HTML
--> --> -->Summer climate variability in the WNP and East Asia experienced a remarkable decadal change around the late 1970s. It has been reported that the interannual variability of the WNPSH has increased since the late 1970s (Wang et al., 2001; Huang et al., 2010, 2015; Gao et al., 2017). Along with the increase in WNPSH variability, the anticyclonic (cyclonic) anomaly associated with the WNPSH becomes stronger (Li et al., 2016). Therefore, the decadal change in WNPSH variability might induce different impacts of the WNPSH on YRB rainfall before and after the late 1970s. On the other hand, it has been noticed that the impact of ENSO on East Asian summer rainfall experiences a decadal change in the late 1970s (Wu and Wang, 2002; Gao et al., 2006; Ye and Lu, 2011), and this decadal change in ENSO impact has been explained by the distinct roles of the WNPSH. For instance, Wu and Wang (2002) explored the decadal change in the relationship between the East Asian summer monsoon and ENSO and showed that the WNPSH-related rainfall anomalies exhibit noticeable changes in the late 1970s (their Fig. 4). In 1962–77, the rainfall anomalies are opposite-signed over South China and the Huaihe River region, while in 1978–93, the YRB shows opposite-signed rainfall anomalies with South China and North China. Therefore, it can be inferred that the WNPSH is more closely related to YRB rainfall after the late 1970s. These previous studies, however, did not focus on the decadal change in the relationship between the WNPSH and YRB rainfall in the late 1970s.
There are few studies on the decadal change in the relationship between the WNPSH and YRB rainfall, despite the various studies on the impact of the WNPSH on YRB rainfall (e.g., Ding, 1992; Huang and Sun, 1992; Lu, 2001, 2004; Ren et al., 2013; Gao et al., 2017, 2019; Li and Lu, 2017, 2018; Camp et al., 2020; Li et al., 2021). To our knowledge, the difference in the WNPSH–YRB rainfall relationship before and after the late 1970s has only been mentioned in Huang et al. (2015), who focused on the decadal change in the WNPSH around the 1970s. Huang et al. (2015) showed the correlation coefficients between the WNPSH and YRB rainfall indices during 1948–78 and 1979–2009, which are 0.34 and 0.41, respectively. The correlation coefficients depend on the definition of indices and periods of analysis, and it will be shown in this study that a clearer strengthening exists in the WNPSH–YRB rainfall relationship before and after the late 1970s.
The strengthened WNPSH–YRB rainfall relationship around the late 1970s might be explained by the decadal changes in the influencing factor (the WNPSH in this study) and environmental condition. One possibility is that the enhancement of WNPSH variability since the late 1970s, as previously mentioned, could have resulted in the strengthened WNPSH–YRB rainfall relationship. Another possibility is that the changes in the thermal conditions in the tropics, such as increased temperatures and resultant increased water vapor content of the atmosphere (e.g., Held and Soden, 2000; Soden et al., 2005; Sherwood et al., 2010; Sobel and Camargo, 2011; Zhang et al., 2019; Chen et al., 2020), might have also made the WNPSH more effectively induce YRB rainfall anomalies. These hypotheses are tested in this study.
The rest of this article is structured as follows. Section 2 describes the data and indices used in this study. Section 3 identifies the decadal change in the influence of the WNPSH on YRB rainfall in the late 1970s. In that section, the relationship between the WNPSH and YRB rainfall is demonstrated to be strong and statistically significant after the late 1970s but weak before the late 1970s. Section 4 further explores the possible mechanisms responsible for the decadal change of the relationship in terms of WNPSH variability and the thermal background. Section 5 provides a summary.
We define two indices to facilitate the descriptions of YRB rainfall and the WNPSH. The YRB is defined as the land area that lies from 107.5°E eastward and between 27°N and 34°N, which is identical to the previous studies (Li and Lu, 2017, 2018). There are 32 stations evenly spaced across this region. The Yangtze River basin precipitation index (YRBPI) is defined as the summer precipitation anomalies averaged over these stations. Previous studies have reported that there is an abrupt increase of YRB rainfall since the end of the 1970s (e.g., Huang et al., 1999; Gong and Ho, 2002; Luo et al., 2013; Li and Lu, 2017). Indeed, the YRBPI increased by 0.93 mm d?1 from 1958–79 to 1980–2019, which is statistically significant at the 99% confidence level. Therefore, to obtain the interannual component of the YRBPI, the averages during the periods of 1958–79 and 1980–2019 are subtracted from the original time series of the YRBPI, following the previous study (Li and Lu, 2017). The variance of the YRBPI is 0.84 mm2 d?2 during 1958–79, comparable to that during 1980–2019 (0.76 mm2 d?2).
The WNPSH has been described by various variables in both the middle troposphere and lower troposphere (e.g., Nitta and Hu, 1996; Hu, 1997; Lu and Dong, 2001; Gong and Ho, 2002; Zhou et al., 2009; Huang et al., 2015; Li and Lu, 2020). In this study, we focus on the zonal shift of the WNPSH in the lower troposphere because of the following reasons. First, the WNPSH tends to be stronger and much more stable in the lower troposphere than in the middle troposphere (Lu, 2002; Lu et al., 2008). Second, the water vapor transport, which is crucial for inducing YRB rainfall, is concentrated in the lower troposphere.
Figure 1 shows the 850-hPa horizontal wind anomalies regressed onto the normalized YRBPI during 1958–2019. A significant anticyclonic anomaly appears over the subtropical WNP, which corresponds to the westward extension of the WNPSH. Associated with this anticyclonic anomaly, there are significant negative values of relative vorticity over the subtropical WNP. The WNPSH index (WNPSHI) is defined as the 850-hPa relative vorticity anomalies averaged over the region (12.5°–22.5°N, 110°–117.5°E), where relative vorticity anomalies are statistically significant at the 95% confidence level, and then multiplied by minus one. This region is smaller and shifted relatively westward in comparison to those used in earlier studies (e.g., Lu et al., 2008; Huang et al., 2015; Zhang et al., 2017). This region was chosen because it represents the western edge of the anticyclonic anomaly, and the wind anomalies there can directly affect YRB rainfall. A positive (negative) WNPSHI indicates that the WNPSH extends westward (retreats eastward) and there is an anticyclonic (cyclonic) anomaly over the subtropical WNP. Previous studies defined the WNPSHI by using other variables in the lower troposphere, such as geopotential height (Lu, 2001, 2002; Lu and Dong, 2001; Lee et al., 2013; Wang et al., 2013), eddy geopotential height (Huang et al., 2015), and horizontal winds (Wang and Fan, 1999; Wang et al., 2001). We compare our WNPSHI with these previous studies and find that most of the correlation coefficients between them are greater than 0.70 during 1958–2019 (Table 1), implying strong consistency between the present and previous WNPSHIs in representing the interannual variability of the WNPSH. In addition, there is a cyclonic anomaly over the Korea Peninsula and south Japan and an anticyclonic anomaly over northeast Asia. These circulation anomalies are in good agreement with previous results (e.g., Wang et al., 2001; Li and Lu, 2017, 2020; Li et al., 2021).
 Figure1. Regression of 850-hPa horizontal winds (vectors; m s?1) with respect to the normalized YRBPI during 1958–2019, based on the JRA-55 dataset. Grey shading indicates that either zonal or meridional wind anomalies are significant at the 95% confidence level based on Student’s t-test. Red cross-hatching indicates that the negative 850-hPa relative vorticity anomalies are significant at the 95% confidence level. The land area represented by the black box represents the defined YRB, and the relative vorticity anomalies averaged over the red box are used to define the WNPSHI (see text for details). Black shading represents mountains higher than 1500 m.
| Reference | Defining variable; region | Correlation coefficient |
| Wang and Fan, 1999 | u; (5°–15°N, 100°–130°E) minus (20°–30°N, 110°–140°E) | ?0.78 |
| Lu and Dong, 2001 | hgt; (10°–30°N, 110°–140°E) | 0.77 |
| Lu, 2001, 2002 | hgt; (10°–30°N, 110°–150°E) | 0.73 |
| Lu et al., 2008 | vor; (15°–27.5°N, 125°–150°E) | ?0.62 |
| Lee et al., 2013 | hgt; (15°–30°N, 110°–150°E) | 0.74 |
| Wang et al., 2013 | hgt; (15°–25°N, 115°–150°E) | 0.74 |
| Huang et al., 2015 | eddy hgt; (15°–30°N, 120°–150°E) | 0.58 |
Table1. Correlation coefficients between the WNPSHI in the present and previous studies. Here, u, hgt, and vor indicate the 850-hPa zonal wind, geopotential height, and relative vorticity, respectively. The correlation coefficients are all significant at the 99% confidence level according to the Student’s t-test.
 Figure2. (a) Time series of the standardized WNPSHI (black bar; m s?1) and YRBPI (line; mm d?1) and (b) the 21-year running correlation coefficient between the WNPSHI and YRBPI. The vertical lines indicate the year of 1980. The red and blue horizontal dashed lines in (b) represent the significance of the correlation coefficient at 99% and 95% confidence levels, respectively, according to the Student’s t-test.
Figure 3 shows the rainfall and 850-hPa horizontal wind anomalies regressed onto the normalized YRBPI during 1958–79 and 1980–2019, respectively. There are strong and significant positive rainfall anomalies over the YRB for both periods (Figs. 3a and 3b), suggesting the reasonability of the YRBPI in representing YRB rainfall in both periods. However, the circulation anomalies affecting YRB rainfall show appreciably different features between the former and latter periods. For the latter period (Fig. 3d), the circulation anomalies are quite similar to those during 1958–2019 (Fig. 1). There is a significant anticyclonic anomaly over the subtropical WNP, indicating that the WNPSH plays an important role in affecting YRB rainfall, and a significant cyclonic anomaly appears over midlatitude East Asia. However, in the former period (Fig. 3c), the subtropical WNP anticyclonic anomaly is weak and insignificant, indicating that the impact of the WNPSH on YRB rainfall is obscure. In addition, there is a cyclonic anomaly over midlatitude East Asia with marginal significance. Overall, the present results suggest that the YRB rainfall anomalies are greatly affected by the WNPSH in the latter period but not in the former period.
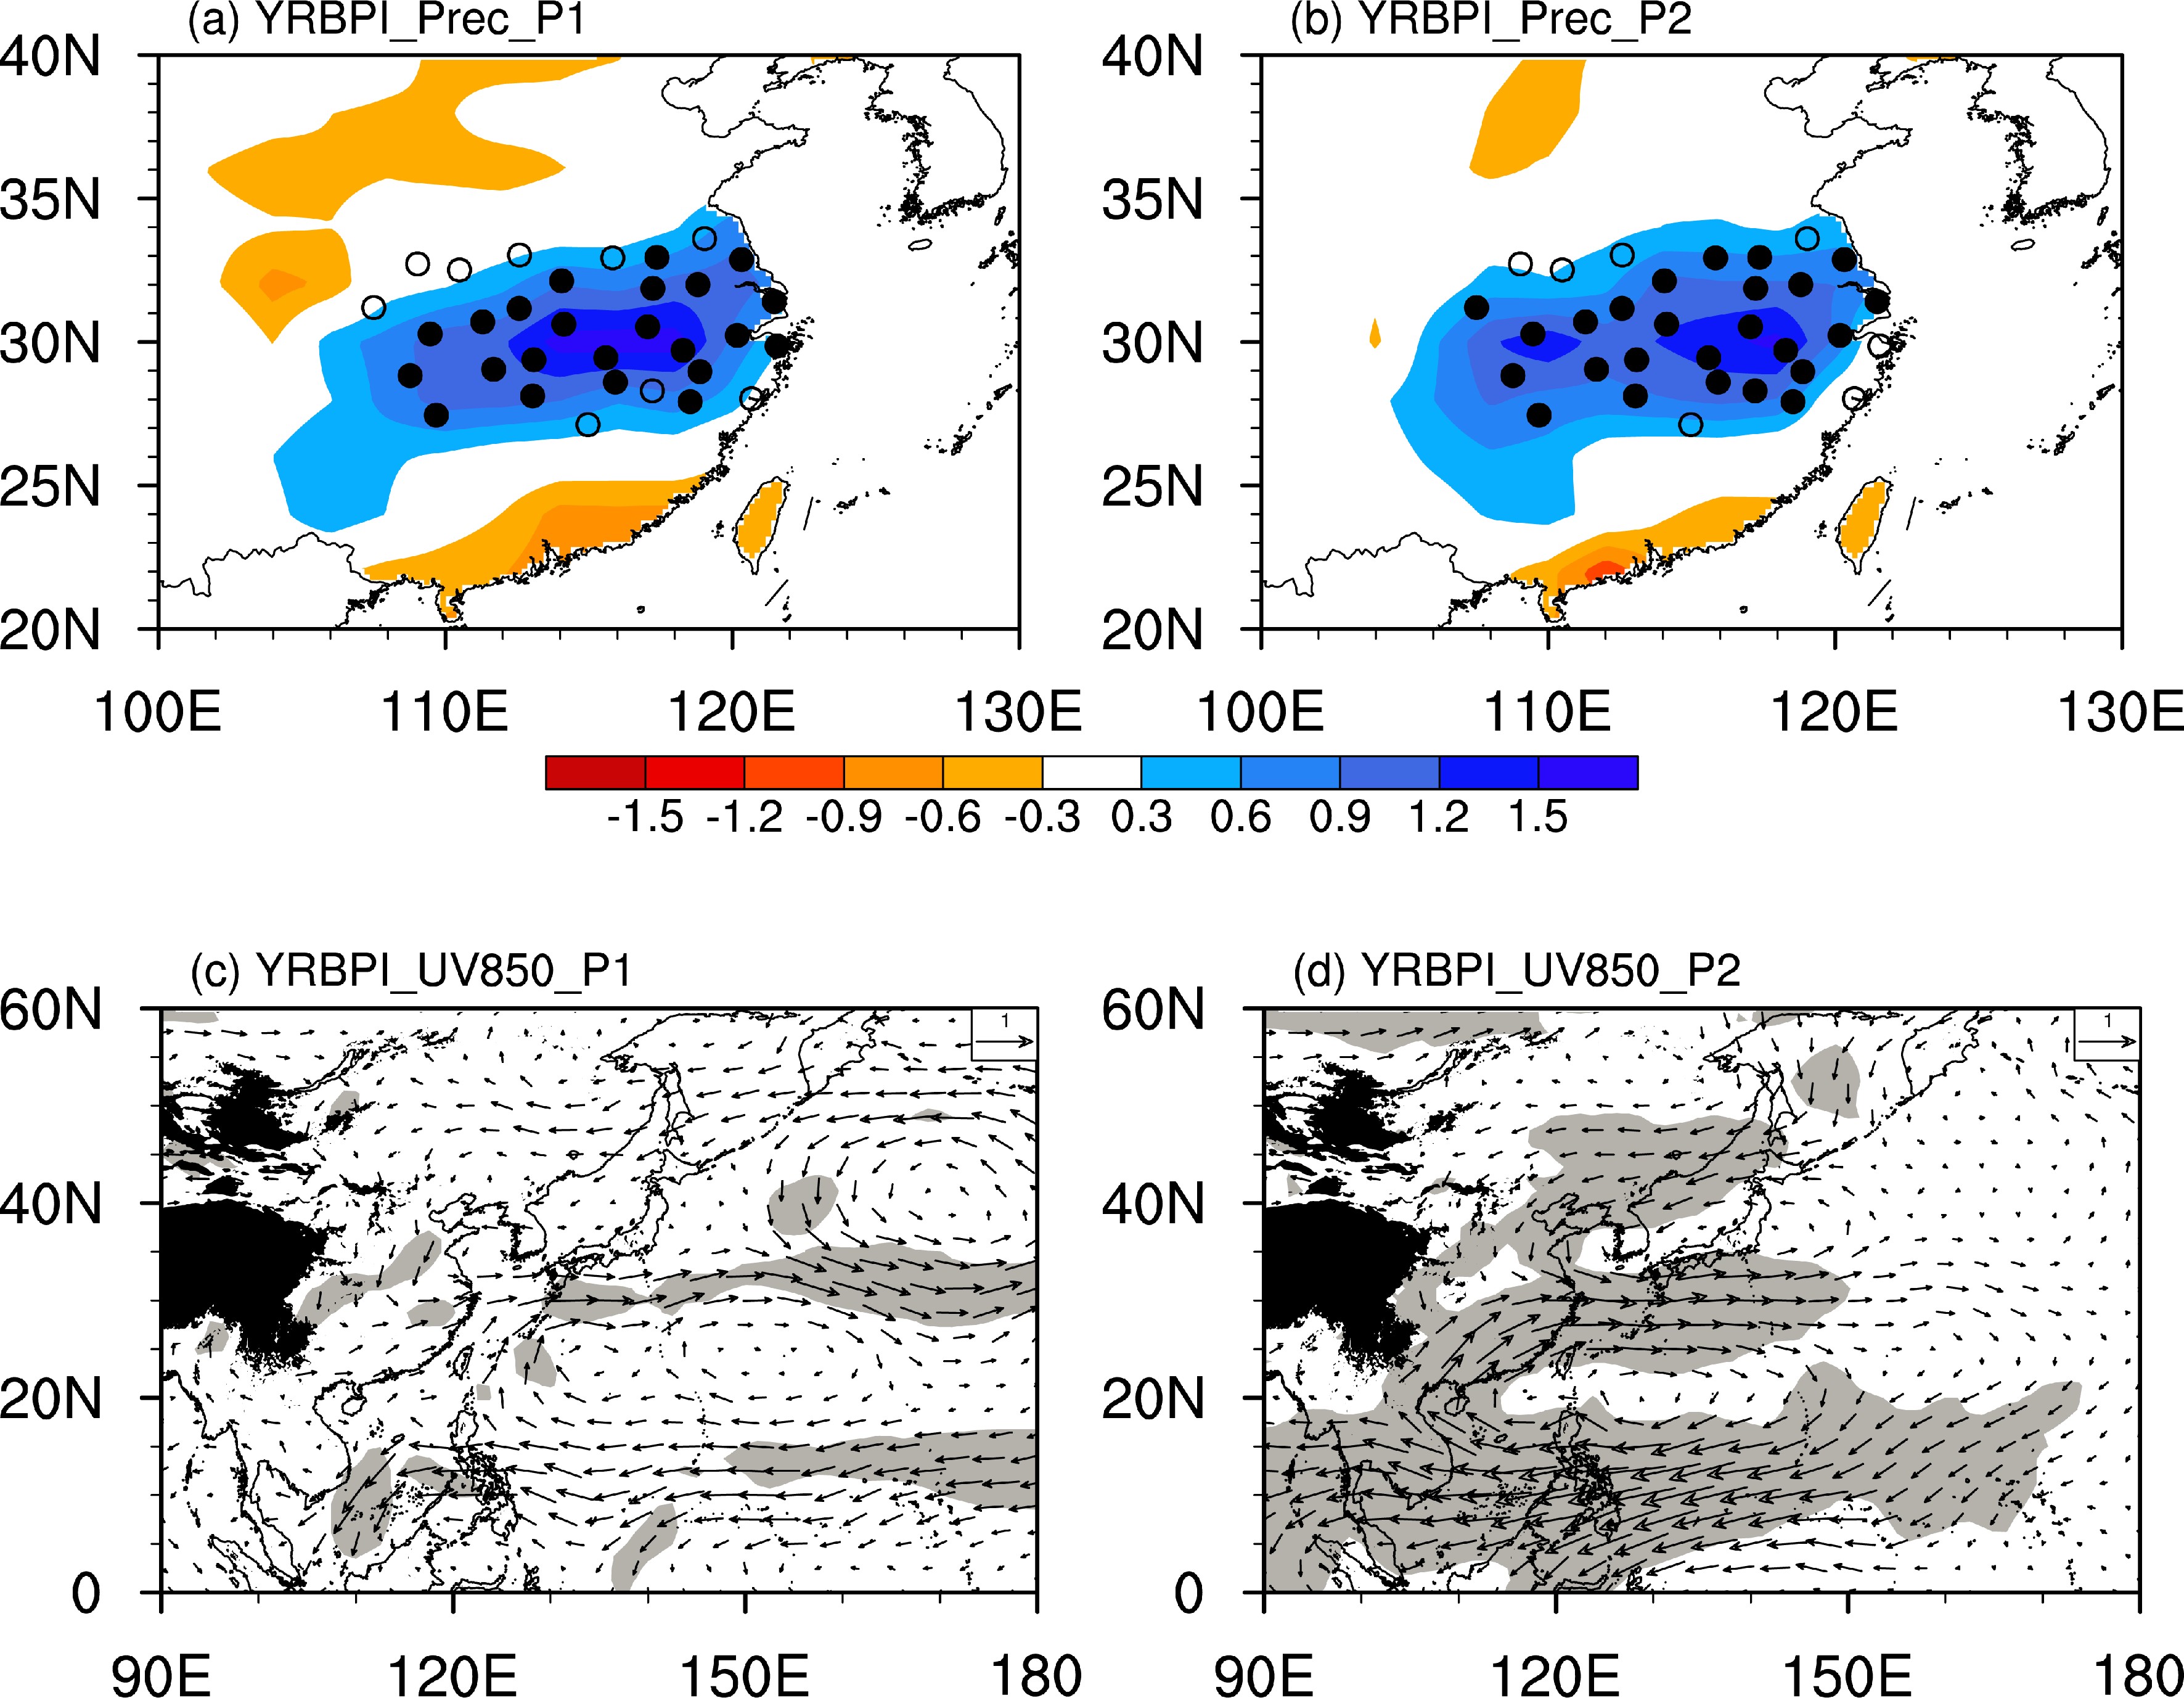 Figure3. Regression of (a, b) rainfall (shading; mm d?1) and (c, d) 850-hPa horizontal winds (vectors; m s?1) with respect to the normalized YRBPI during (a, c) 1958–79 (P1) and (b, d) 1980–2019 (P2), based on the JRA-55 dataset. The circles in (a) and (b) represent the stations in the Yangtze River basin, and the closed circles indicate stations significant at the 90% confidence level based on Student’s t-test. Grey shading in (c) and (d) indicates that either zonal or meridional wind anomalies are significant at the 95% confidence level based on Student’s t-test. Black shading represents mountains higher than 1500 m.
 Figure4. As in Figs. 3a and 3b, but for the WNPSHI.
Figure 4 shows the rainfall anomalies over stations regressed onto the normalized WNPSHI during 1958–79 and 1980–2019, respectively. In the latter period (Fig. 4b), there is enhanced rainfall over the YRB, and 20 out of 32 stations show significance at the 90% confidence level. By contrast, in the former period (Fig. 4a), positive rainfall anomalies over the YRB are weak and barely significant. There are only 4 out of 32 stations that are significant at the 90% confidence level. Positive anomalies tend to locate southward, including South China. These results confirm that the influence of the WNPSH on YRB rainfall is only strong and significant in the latter period.
Figure 5 shows the 850-hPa horizontal wind anomalies regressed onto the normalized WNPSHI during 1958–79 and 1980–2019. A significant anticyclonic anomaly appears over the subtropical WNP for both periods (Figs. 5a and 5b), corresponding to the westward extension of the WNPSH. The southwesterlies associated with the anticyclonic anomaly transport water vapor to the YRB and induce enhanced rainfall there (e.g., Huang and Sun, 1992; Liu and Ding, 2009; Kosaka et al., 2011; Li and Zhou, 2012; Li and Lu, 2017; Yang et al., 2017). On the other hand, the southwesterlies also intensify the meridional gradient of equivalent potential temperature (θe) over the YRB, which is also favorable for enhanced rainfall (Ninomiya, 1984; Ninomiya and Shibagaki, 2007; Li and Lu, 2017, 2018; Gao et al., 2019, 2020). However, the anticyclonic anomaly shows some appreciably different features between the former and latter periods. In the former period (Fig. 5a), the anticyclonic anomaly is relatively weak. The southwesterlies only cover the areas south of the YRB and South China, corresponding to the positive rainfall anomalies there (Fig. 4a). In contrast, in the latter period (Fig. 5b), the anticyclonic anomaly becomes strong and significant. The southwesterlies extend more northward and cover the whole YRB, resulting in enhanced rainfall there (Fig. 5b). In addition, the extratropical wind anomalies also exhibit as distinctly different features between the two periods. The cyclonic anomaly over midlatitude East Asia and the anticyclonic anomaly over Northeast Asia are both weak and of marginal significance in the former period (Fig. 5a), suggesting a weak meridional teleconnection; but they are both strong and significant in the latter period (Fig. 5b), indicating a strong meridional teleconnection, consistent with previous studies (Li et al., 2016; Kubota et al., 2016).
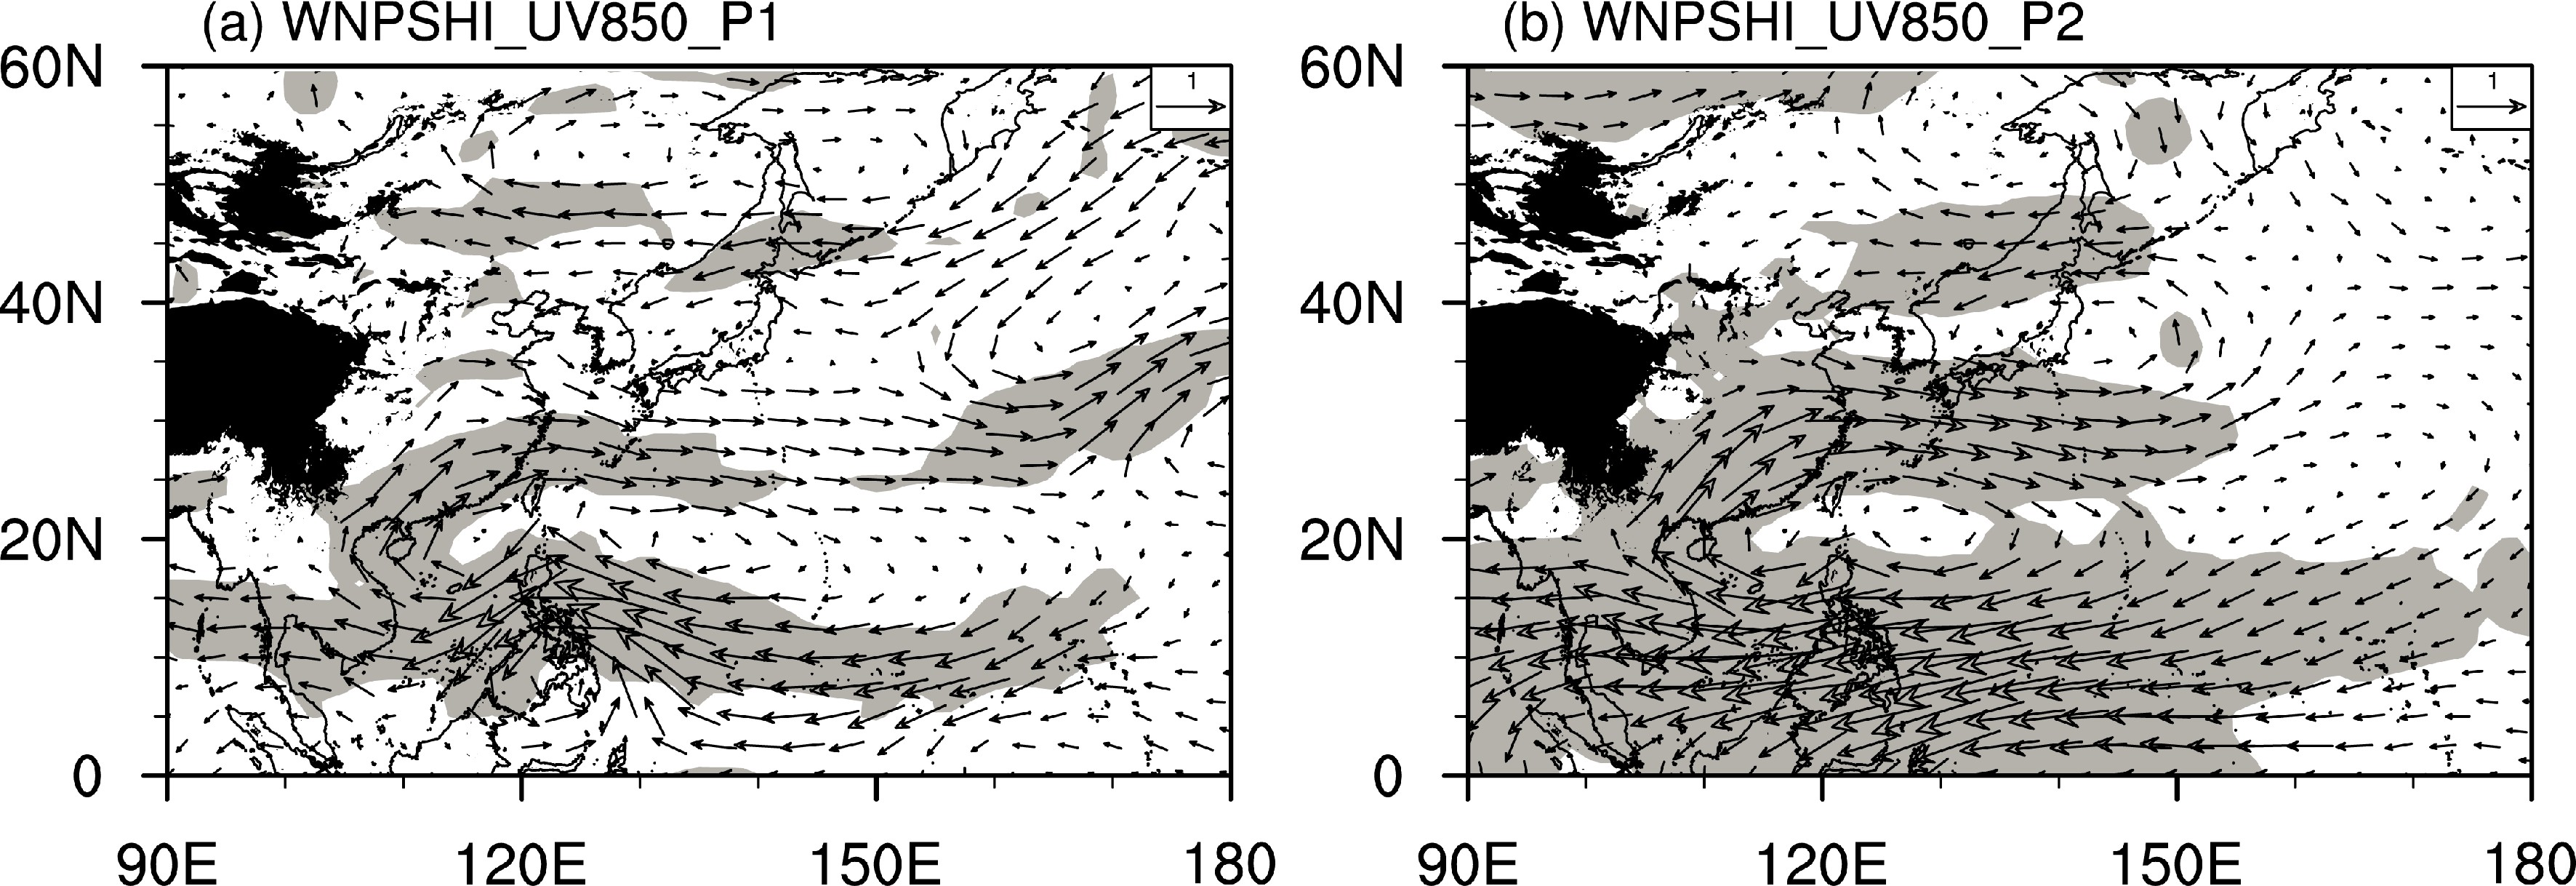 Figure5. As in Figs. 3c and 3d, but for the WNPSHI.
We repeated the analyses in this section by using the other WNPSH indices defined in previous studies (Wang and Fan, 1999; Lu and Dong, 2001; Lu, 2001, 2002; Lu et al., 2008; Lee et al., 2013; Wang et al., 2013; Huang et al., 2015). The correlation coefficients between these WNPSH indices and YRBPI confirm the enhancement of the relationship between the WNPSH and YRB rainfall after the late 1970s: They range from 0.36 to 0.46 during 1958–79 and from 0.51 to 0.64 during 1980–2019, suggesting that the present results are not sensitive to the definitions of WNPSHI. In particular, the WNPSHI defined by Huang et al. (2015) and the YRBPI show larger differences between the former and latter periods in this study, with correlation coefficients of 0.36 and 0.51, respectively (0.34 and 0.41 in their results). The higher correlation coefficient during the latter period in the present study is due to differences in YRBPI definitions and analysis periods. In addition, results obtained in this section is based on the JRA-55 dataset, and similar results were obtained by using the NCEP1 and ERA5 datasets (not shown).
2
4.1. Role of the decadal change of WNPSH interannual variability
It has been reported that the interannual variability of the WNPSH shows an enhancement since the late 1970s (Wang et al., 2001; Huang et al., 2010). Indeed, the standard deviation of the WNPSHI during 1980–2019 is greater than that during 1958–79 (3.03 × 10?6 s?1 versus 2.39 × 10?6 s?1), and the WNP anticyclonic anomaly in the latter period is stronger than that in the former period (Figs. 5a and 5b), consistent with previous studies. To explore the impacts of WNPSH interannual variability, we define strong (weak) WNPSH anomalies to be when the absolute value of the WNPSHI is greater (smaller) than 1.0 standard deviation in the latter period. There are 11 strong WNPSHI years and 29 weak WNPSHI cases based on this criterion. After removing the strong WNPSHI cases, the standard deviation of the WNPSHI is 1.58 × 10?6 s?1, smaller than that during 1958–79 (2.39 × 10?6 s?1).Figure 6 shows the rainfall anomalies over stations regressed onto the normalized WNPSHI for the strong and weak cases, respectively, in the latter period. Associated with the strong WNPSH (Fig. 6a), there are strong positive rainfall anomalies over the YRB. The average rainfall anomaly over the YRB is 0.93 mm d?1. The correlation coefficient between the WNPSHI and YRBPI is 0.76, which is significant at the 99% confidence level. For the weak WNPSH (Fig. 6b), enhanced rainfall also appears over the YRB, while the anomalies become weaker, as expected. The average rainfall anomaly over the YRB is reduced to 0.37 mm d?1, and the correlation coefficient between the WNPSHI and YRBPI decreases to 0.52. These results suggest that the WHPSHI interannual variability plays a role in affecting the WNPSH–YRBP relationship. On the other hand, the WNPSH–YRBP relationship for the weak cases is still stronger than that in the former period, and the correlation coefficient (0.52) is also significant at the 90% confidence level. These results suggest that the change of WNPSH interannual variability is not the only factor that results in the decadal change of the WNPSH–YRBP relationship.
 Figure6. As in Fig. 4, but for the (a) strong and (b) weak WNPSHI in 1980–2019.
Figure 7 shows the 850-hPa horizontal wind anomalies regressed onto the normalized WNPSHI for the strong and weak cases. For both the strong and weak WNPSH, there is an anticyclonic anomaly over the tropical WNP, and a cyclonic anomaly appears over midlatitude East Asia. The anticyclonic anomaly for the strong cases is much stronger than the weak cases (Figs. 7a and 7b), as expected. However, the anticyclonic anomaly for the weak cases can still induce significant rainfall anomalies over the YRB (Figs. 6b and 7b). Similar results were obtained by using the NCEP1 or ERA5 datasets (not shown).
 Figure7. As in Fig. 5, but for the (a) strong and (b) weak WNPSHI in 1980–2019.
2
4.2. Role of the decadal change of basic state
Figure 8 shows the climatology maps of temperature, specific humidity, and θe during the periods 1958–79 and 1980–2019 based on the JRA-55 dataset. The differences between the latter and former periods are shown in the bottom panels. For both periods, the high temperature (Figs. 8a and 8d) and specific humidity (Figs. 8b and 8e) values dominate the South China Sea and the tropical WNP, in a tongue-shaped pattern. Both temperature and specific humidity decrease with latitude over the north of the tongue and show a maximum meridional gradient over the northeast. However, compared to the former period, the tropical warm and moist region is larger in the latter period (Figs. 8a and 8d; Figs. 8b and 8e). The differences between the latter and former periods show significantly warmer and wetter conditions in the tropical WNP and South China Sea (Figs. 8g and 8h). Figure8. Climatology of 850-hPa (left-hand panels) temperature, (middle panels) specific humidity, and (right-hand panels) equivalent potential temperature (θe) during (a–c) 1958–79 and (d–f) 1980–2019, and (g–i) the difference between the latter and former periods. Results are based on the JRA-55 dataset. The contour interval is 1.0 K in (a) and (d), 1.0 g Kg?1 in (b) and (e), and 3.0 K in (c) and (f). In (g–i), the contour intervals are 0.2 K, 0.2 g Kg?1, and 0.6 K, respectively, and zero contours are omitted. Red and blue shadings in Figs. 8g-8i indicate that the positive and negative anomalies are significant at the 95% confidence level, respectively, based on Student’s t-test.
The warmer and wetter conditions in the tropics in the latter period can also be inferred from the higher values of θe (Fig. 8i), which combines temperature and humidity. Higher θe in the tropical WNP, including the region south of the YRB, enhances the meridional gradient of climatological θe over the YRB in the latter period. The difference in climatological θe between the southern edge [averaged over (27°N, 107.5°–120°E)] and the northern edge [averaged over (34°N, 107.5°–120°E)] of the YRB (e.g., Chang et al., 2000; Li and Lu, 2017, 2018) increased by 0.93 K in the latter period, which is 15.3% of the climatological difference in the former period (6.05 K). Slightly changing the southern and northern edges leads to similar results. For instance, the difference in climatological θe between the southern and northern edges increased by 13.3% in the latter period, if defining the southern and northern edges of the YRB as 26°N and 35°N, respectively. The enhanced meridional gradient in climatological θe can favor the role of the WNPSH in affecting YRB rainfall, as the similar anticyclonic/cyclonic anomaly associated with the WNPSH can more effectively induce θe gradient anomalies over the YRB in the latter period.
It is notable that the difference in specific humidity, as well as the resultant θe, between the latter and former periods shows extremely high values over the Philippine Sea (Figs. 8h and 8i), which probably result from the dry bias center over this region in the former period (Kobayashi et al., 2015). To guarantee the reliability of the results, we explored the change in basic state of tropical thermal conditions by using the other reanalysis datasets (NCEP1 and ERA5 datasets) and obtained similar results. For instance, Fig. 9 shows the thermal conditions obtained from the ERA5 dataset. The results are basically consistent with those shown in Fig. 8. For instance, the difference of climatological θe between the southern and northern edges of the YRB increases by 16.7%. In addition, there are no extremely high values over the Philippine Sea (Figs. 9h and 9i). These results confirm that the warmer and wetter conditions in the tropics enhance the meridional gradient of climatological θe over the YRB in the latter period, and thus the WNPSH-related circulation can more effectively induce θe gradient and resultant YRB rainfall anomalies.
 Figure9. As in Fig. 8, but based on the ERA5 dataset.
It is found that the interannual variability of the WNPSH has a role in affecting the WNPSH–YRBP relationship. The anticyclonic (cyclonic) anomaly is stronger in the latter period, and thus induces stronger anomalous rainfall over the YRB. After removing the strong cases of the anticyclonic (cyclonic) anomaly in the latter period, the YRB rainfall anomalies decrease, and the WNPSH–YRBP relationship becomes weaker.
On the other hand, after excluding the strong WNPSH cases in the latter period, the YRB rainfall anomalies induced by the WNPSH are still much stronger than those in the former period, suggesting that there are other factors that contribute to the decadal change of the WNPSH–YRBP relationship. Further results indicate that the decadal change in the basic state of tropical thermal conditions has a crucial role. In the latter period, the tropical WNP gets warmer and wetter, and the meridional gradient of the climatological θe is intensified over the YRB. Therefore, the WNPSH anomalies can more effectively induce θe gradient and resultant YRB rainfall anomalies, resulting in an enhanced WNPSH–YRBP relationship. Different reanalysis datasets show similar results and confirm the decadal change of the thermal conditions in the tropical WNP in the late 1970s.
The enhanced climatological θe gradient probably results from the change in climatological sea surface temperature. In the latter period, the tropical WNP gets warmer and the midlatitude Pacific tends to get cooler (not shown). These sea surface temperature changes are favorable for θe increasing in the tropical WNP and θe
It seems that tropical–extratropical connection over the WNP and East Asia is enhanced in the latter period (Figs. 5a and 5b), which is also favorable for anomalous YRB rainfall. On the other hand, there is an interaction between circulation and precipitation anomalies over the WNP and East Asia (Lu and Lin, 2009). In the latter period, the WNPSH anomalies can significantly induce anomalous YRB rainfall due to stronger WNPSH variability and warmer and wetter conditions in the tropical WNP. The YRB rainfall anomalies, as a heat source, in turn, can play a positive feedback role in enhancing the tropical–extratropical connection (Lu and Lin, 2009). However, in the former period, the WNPSH anomalies cannot induce clear YRB rainfall anomalies and the feedback of YRB rainfall in circulation anomalies is weak.
Furthermore, the present results imply that the fundamental factors that affect YRB rainfall variability would be distinct between the former and latter periods. In the latter period, the WNPSH anomalies can play a role in linking tropical sea surface temperature anomalies to YRB rainfall variability, as previously suggested (e.g., Wu and Wang, 2002; Xie et al., 2009, 2016; Ye and Lu, 2011; Zhang et al., 2016; Li et al., 2021). In fact, more/less YRB rainfall corresponds to El Ni?o/La Ni?a decaying and simultaneous summer tropical Indian Ocean warming/cooling in this period (not shown). The fundamental factors that affect YRB rainfall variability should be investigated in both the former and latter periods, particularly in the former period, since these factors remain unknown.
Current climate models show considerable capability in the seasonal forecast of the WNPSH (Li et al., 2012, 2014; Lu et al., 2012; Kosaka et al., 2013; Shin et al., 2019), but the seasonal forecast of YRB summer rainfall remains a great challenge (Li et al., 2014). This study implies that, for skillful seasonal forecasting in East Asian summer rainfall, seasonal forecast systems need to have good climatology as well as good interannual variability. In addition, it would be interesting to further explore the future projected changes in climatological θe and the WNPSH–YRBP relationship, and we will investigate this issue by using the Coupled Model Intercomparison Project Phase 6 outputs.
Acknowledgements. We thank the editor and two anonymous reviewers for their insightful comments, which were helpful in improving the presentation. This work was supported by the National Natural Science Foundation of China (Grant Nos. 41905055 and 41721004), the Natural Science Foundation of Jiangsu Province (Grant No. BK20190500), and the Fundamental Research Funds for the Central Universities (Grant No. B200202145).
