HTML
--> --> -->The KE has a mode of interdecadal variability evidenced by its transition from a stable state to an unstable state. When the KE is in a stable state we note the following effects; the zonal transport is strengthened, the main axis moves northward, the southern recirculation gyre is strengthened, and the regional eddy kinetic energy is reduced. When the KE is in an unstable state, the situation is the opposite. The KEI (Kuroshio Extension Index) defined by Qiu et al. (2014) can better characterize the different states of the KE. When KEI is positive, it implies the stable state, and when KEI is negative, it implies the unstable state. The KEI is introduced in detail in the second part of this paper. The interdecadal variability of the KE can significantly affect the free atmosphere (Wang and Liu, 2015), and especially the tropospheric atmosphere which is known to have a profound response to KE variability (Liu et al., 2008; Masunaga et al., 2016). Both observational (Kwon and Joyce, 2013; O’Reilly and Czaja, 2015) and modeling (Smirnov et al., 2015) results show that the large-scale SSTA variability caused by the KE can influence the interdecadal variability of the climate in the North Pacific. Révelard et al. (2016, 2018) regressed the atmospheric potential height field by using the KEI defined by Qiu et al. (2014) and found that the atmosphere had a widespread, significant, and consistent response to the KE in the early winter from October to January in the following year, which shows a barotropic structure (Peng and Whitaker, 1999; Gan and Wu, 2013) similar to the North Pacific Oscillation/West Pacific teleconnection (NPO/WP) (Linkin and Nigam, 2008). When they used a composite analysis, they found that the large-scale SSTA in the North Pacific caused by the KE stable and unstable states had a symmetrical structure, but the response of the atmosphere to this symmetrical SSTA is asymmetric. They argue that asymmetry may be caused by the nonlinearity of the Clausius-Clapeyron equation (Deser et al., 2004) or by the nonlinear forcing of transient eddies due to thermal changes (Nakamura et al., 1987) but these inferences remain speculative. In fact, the response of the atmosphere to the symmetric SSTA in mid-latitudes has always been a complicated problem (Kushnir and Lau, 1992; Peng et al., 1995). Tao et al. (2019) discussed the atmospheric response forced by different phases of PDO modes and found that the PDO in a warm phase forced a low-pressure anomaly with equivalent barotropic structure as seen in the cold SSTA, while the PDO in a cold phase forced an anomaly with a weak baroclinic structure as seen in the warm SSTA. It is known that the forcing of the atmosphere through diabatic heating and transient vorticity forcing play independent roles in each phase of the PDO. However, the factors that maintain the response of the atmosphere to the symmetric SSTA during both periods of the KE warrants s further investigation. Considering this, some studies have shown that the low-frequency mode of the WP/NPO can be maintained and enhanced by the barotropic process of absorbing energy from a climatic jet, and that this enhancement may only be significant in the upper troposphere (Lau and Nath, 1991; Okajima et al., 2018). Some studies have also found that baroclinic energy conversion is also more important to maintain the WP/NPO like pattern structure (Schubert et al., 1986; Tan et al., 2019).
Therefore, the main purpose of this paper is to discuss the relative importance of diabatic heating, the nonlinear feedback of transient eddies, and the barotropic and baroclinic energy transformation, in the context of maintaining the WP/NPO like pattern response during the cold season (ONDJ), under the influence of the KE interdecadal SSTAs variability states. This paper is divided into six parts. The second part introduces the data and methods. The third part introduces the composite results of the geopotential height and storm track in the different states of the KE. The fourth part discusses the similarities and differences of basic energy transformation. The fifth part discusses the role of diabatic heating and transient eddy feedback. The sixth part is the conclusion.
2.1. Data
(1) The SST data used in this paper come from the monthly average optimal interpolation dataset provided by the National Oceanic and Atmospheric Administration (NOAA) with a resolution of 0.25° × 0.25°over the time period from 1993 to 2012.(2) The SSH (Sea Surface Height) data provided by Archiving Validation and Interpretation of Satellite Oceanographic Center (AVISO) altimeter satellite products at a 0.25° × 0.25° resolution are used to calculate the monthly average KEI (Ducet et al., 2000), over the time period from January 1993 to December 2012.
(3) The daily average global atmospheric reanalysis data of the ERA-Interim are mainly used for the atmospheric data, including the daily height field (Z), wind field (u, v) and temperature field (T); the time is from 1983 to 2012, the resolution is 0.25° × 0.25°, and the vertical stratification is 23 layers.
In addition, we define the winter period as the early winter and late winter period, from October to January of each year (ONDJ) because this period has the strongest air-sea interaction in the western boundary current in the northern hemisphere and because a large amount of the heat flux from the western boundary current is released to the atmosphere (Taguchi et al., 2011; Révelard et al., 2016).
2
2.2. Method
(1) In this study, we use a Eulerian approach in the method to characterize the storm track. The storm track is determined by the filtering variance of the synoptic scale (2?8 d) meridional wind speed

(2) We mainly use the KEI defined by Qiu et al. (2014), which uses the monthly average SSHA between regions (31°?36°N, 140°?165°E) as the monthly average KEI. The monthly average KEI during the winter period over 20 years (1993?2012),based on satellite SSH data, is shown in Fig. 1; the KE shows obvious characteristics of interdecadal variation. A KEI with a longer time series, derived by Qiu et al. (2014), has been applied as (KEI_Q) which uses an eddy-resolving ocean general circulation model (OGCM) hindcast, thus providing an accurate description of the KE state at monthly resolutions during the 1983?2012 period. In addition, we also use the KEI derived from ECMWF Operational Ocean Reanalysis (ORAS4) SSH data, noted hereafter as (KEI_R).
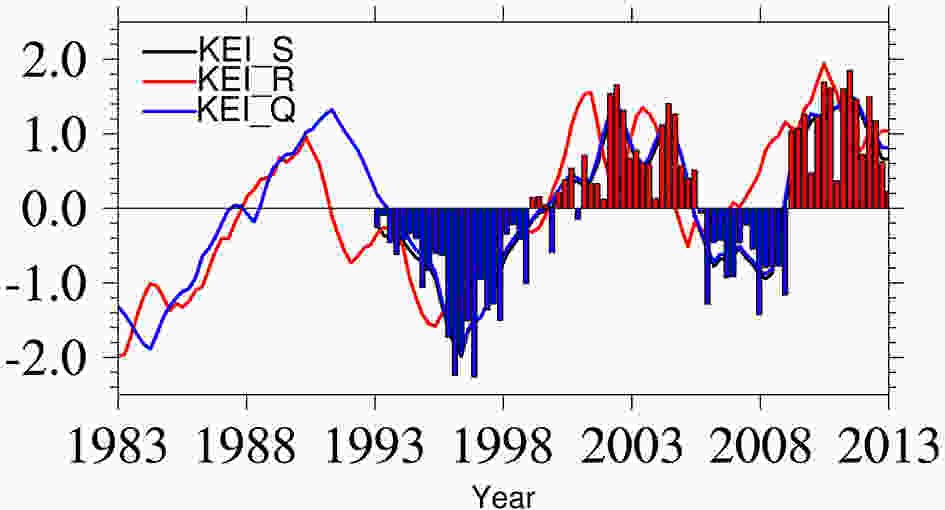 Figure1. The monthly mean of the Kuroshio Extension Index KEI during the winter period (ONDJ) after normalization. The curve is KEI of 4-point moving average. Histogram and black curves are KEI based on satellite observation data. The blue curve is the KEI based on the OGCM product, and the red curve is KEI based on the ORAS4.
(3) The storm track anomalies during the different phases of the KE are determined by composite analysis. Since the satellite data is limited to the period from 1993 to 2012, there are only 20 years of actual observation, as shown in Fig.1. For a composite analysis, in order to obtain a robust atmospheric signal we need to use a longer time series of KEI. The KEI_Q (blue curve in Fig.1) is used for this purpose (Révelard et al. 2016, 2018), which is strongly correlated with the KEI calculated from the satellite observation data, noting a correlation coefficient of 0.82 (Qiu et al., 2014). We combined satellite observation data and longer time KEI_Q for analysis. Based on the mean KEI in ONDJ for nearly 30 years from 1983 to 2012, we select and define the positive years as having a KEI greater than one standard deviation above the mean for a total 10 years (1989, 1990, 1991, 1992, 2002, 2004, 2009, 2010, 2011, 2012) and, in a similar manner, we define a total of 10 negative years (1983, 1984, 1985, 1986, 1995, 1996, 1997, 2006, 2007, 2008). To test the credibility of the differences between positive (negative) phase years and climatological state, we use the Student’s t test at the 90% significant confidence level.
In addition, when the KEI_R was compared with satellite observation data, as shown in the red curve in Fig. 1, it was in relative agreement the KEI, yielding a correlation coefficient of 0.62.We mainly use the SSH based on satellite observation data for the composited SSTA. Since we have limited satellite observation data of SSH and the 170 cm SSH contours representing the KE path in different KE stable periods needs to be identified, the SSTA in different KE stable periods are selected for composite analysis.
 Figure2. Composited SSTA (coloring, units: °C) during (a) the KE stable period in winter and (b) the KE unstable period. Statistically significant differences at 90% according to the Student’s t-test are stippled. Thick black lines denote the mean KE path in different stable state based on 170 cm SSH contours.
Additionally, considering the limited persistence of atmosphere intrinsic variability compared to that of the ocean, the numerical modeling studies suggest that the atmospheric response to SSTA or other boundary forcing in the extratropical regions takes one or two months to reach its maximum amplitude (Deser et al., 2007). While, recent high-resolution experiments suggest that the maximum amplitude may be reached slightly faster (Smirnov et al., 2015), many assume that the response time to the SST fingerprint of the KE is 1 month, or even less. This lag usually reflects the interaction between transient eddies and the mean flow. Upon regressing the KEI onto the geopotential height field, at leads of 1?2 months, a broadly coherent and robust, tripolar atmospheric response pattern is found from October to January (ONDJ) (Révelard et al., 2016). Thus, the atmospheric response is best detected in ONDJ. Regarding the seasonal variation of KE, KE is usually stronger in summer and autumn, before decreasing slightly thereafter (Lee et al., 2015; Yang and Liang, 2018). The seasonal average KEI in ONDJ is used to select the significant positive phase years and negative phase years, and the composite analysis is also carried out during ONDJ, which mainly reflects the forcing of the ocean on the atmosphere.
2
3.1. The response of geopotential height
Under the influence of a symmetric SSTA, the composite response of geopotential height field is shown in Fig. 3. From this, we can find that, during the KE stable period, the response of geopotential height field at 250 hPa in the upper troposphere presents a WP/NPO like pattern, which shows a north-south dipole structure bounded by 40°N. In addition to significant positive geopotential height anomalies in the western Pacific, there are also strong significant signals in the eastern Pacific. South of 40°N, negative geopotential height anomalies appear while north of 40°N is positive geopotential height anomalies are present. When the dipole signal is opposite of this, it is called the negative phase of WP/NPO like pattern. However, during the unstable period of the KE, the atmosphere failed to produce a statistically significant signal of this kind over the western and central Pacific. However, significant positive height anomalies did appear in the Gulf of Alaska and near the west coast of North America. During the unstable period, there was no negative phase of WP/NPO like pattern detected in the upper troposphere, which would have been symmetrical to the KE stable period, and there was actually a weak positive anomaly of geopotential height in the East Pacific Ocean. Therefore, it can be concluded that the response of geopotential height field is asymmetric to the symmetric SSTA. Figure3. Composited geopotential height anomaly at 250 hPa during (a) the KE stable period and (b) unstable period (shaded, units: m) in winter. Statistically significant differences at 90% according to the Student’s t-test are stippled.
The response of geopotential height during the KE stable period presents a nearly barotropic structure from the bottom up (Fig. 4), and there is a positive anomaly of geopotential height between 35° to 60°N. During the unstable period of KE, a nearly barotropic structure is also produced. There is a negative anomaly of geopotential height south of 50°N, while north of 50°N is a positive anomaly; however, these features are not statistically significant.
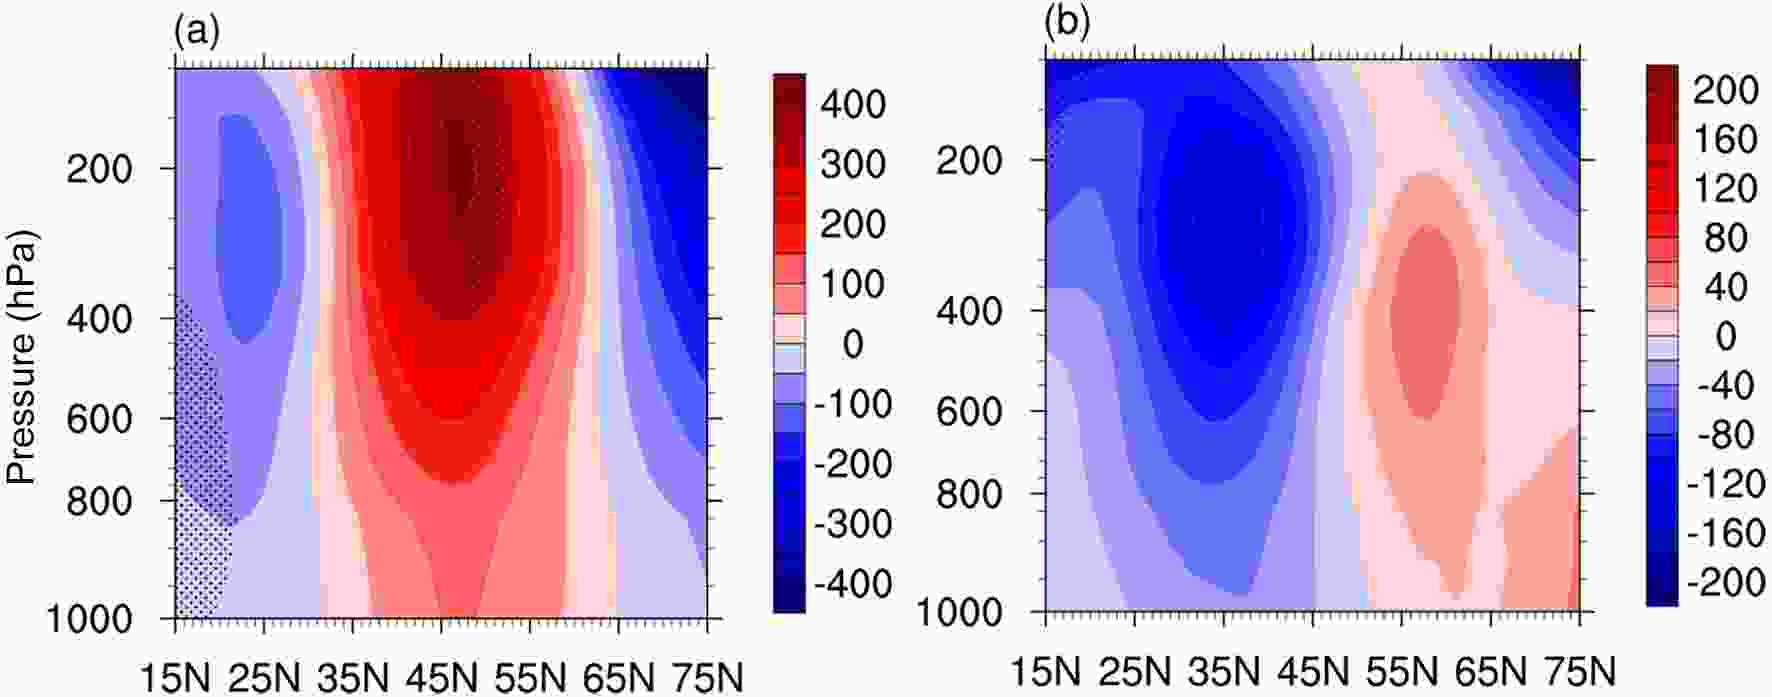 Figure4. Latitude?altitude sections of composited geopotential height anomaly field during the KE stable period and unstable period averaged in (120°E?120°W) (shaded, units: m), (a) composited geopotential height during the KE stable period; (b) composited geopotential height during the KE unstable period. Statistically significant differences at 90% according to the Student’s t-test are stippled.
The results of Linkin and Nigam (2008) show that the variability of WP/NPO like pattern is significantly related to the meridional movement of the Asia-Pacific jet and is modulated by the storm track in the North Pacific, which is probably the result of transient eddy forcing. This means that, during stable state of the KE, the WP/NPO like pattern may be maintained by the interaction of the transient eddy and the mean flow or transient eddy forcing in the atmosphere.
2
3.2. The response of the storm track
Many studies have demonstrated a significant correlation between the storm track and the KE or WP teleconnection (Nakamura et al., 1987; Zhu and Sun, 2000). As shown in Fig. 5,during the KE stable period, the storm track moved northward, and the vigor of the storm track increased significantly north of 40°N and over the northeast Pacific. During the unstable period of the KE, the storm track moved southward. We also found that, there were significant changes in the weakening of storm track in different periods of KE near the west coast of the North American continent. Overall, the response of storm track demonstrates some asymmetry. Anomalies along the storm track can usually provide feedback to the atmospheric circulation, which is an important reason for maintaining the low-frequency modes of the atmosphere. According to linear baroclinic theory, the growth of storm track is often related to the baroclinicity in the lower atmosphere. One commonly used measure of the baroclinicity of the atmosphere is the maximum Eady growth rate (Hoskins and Valdes, 1990):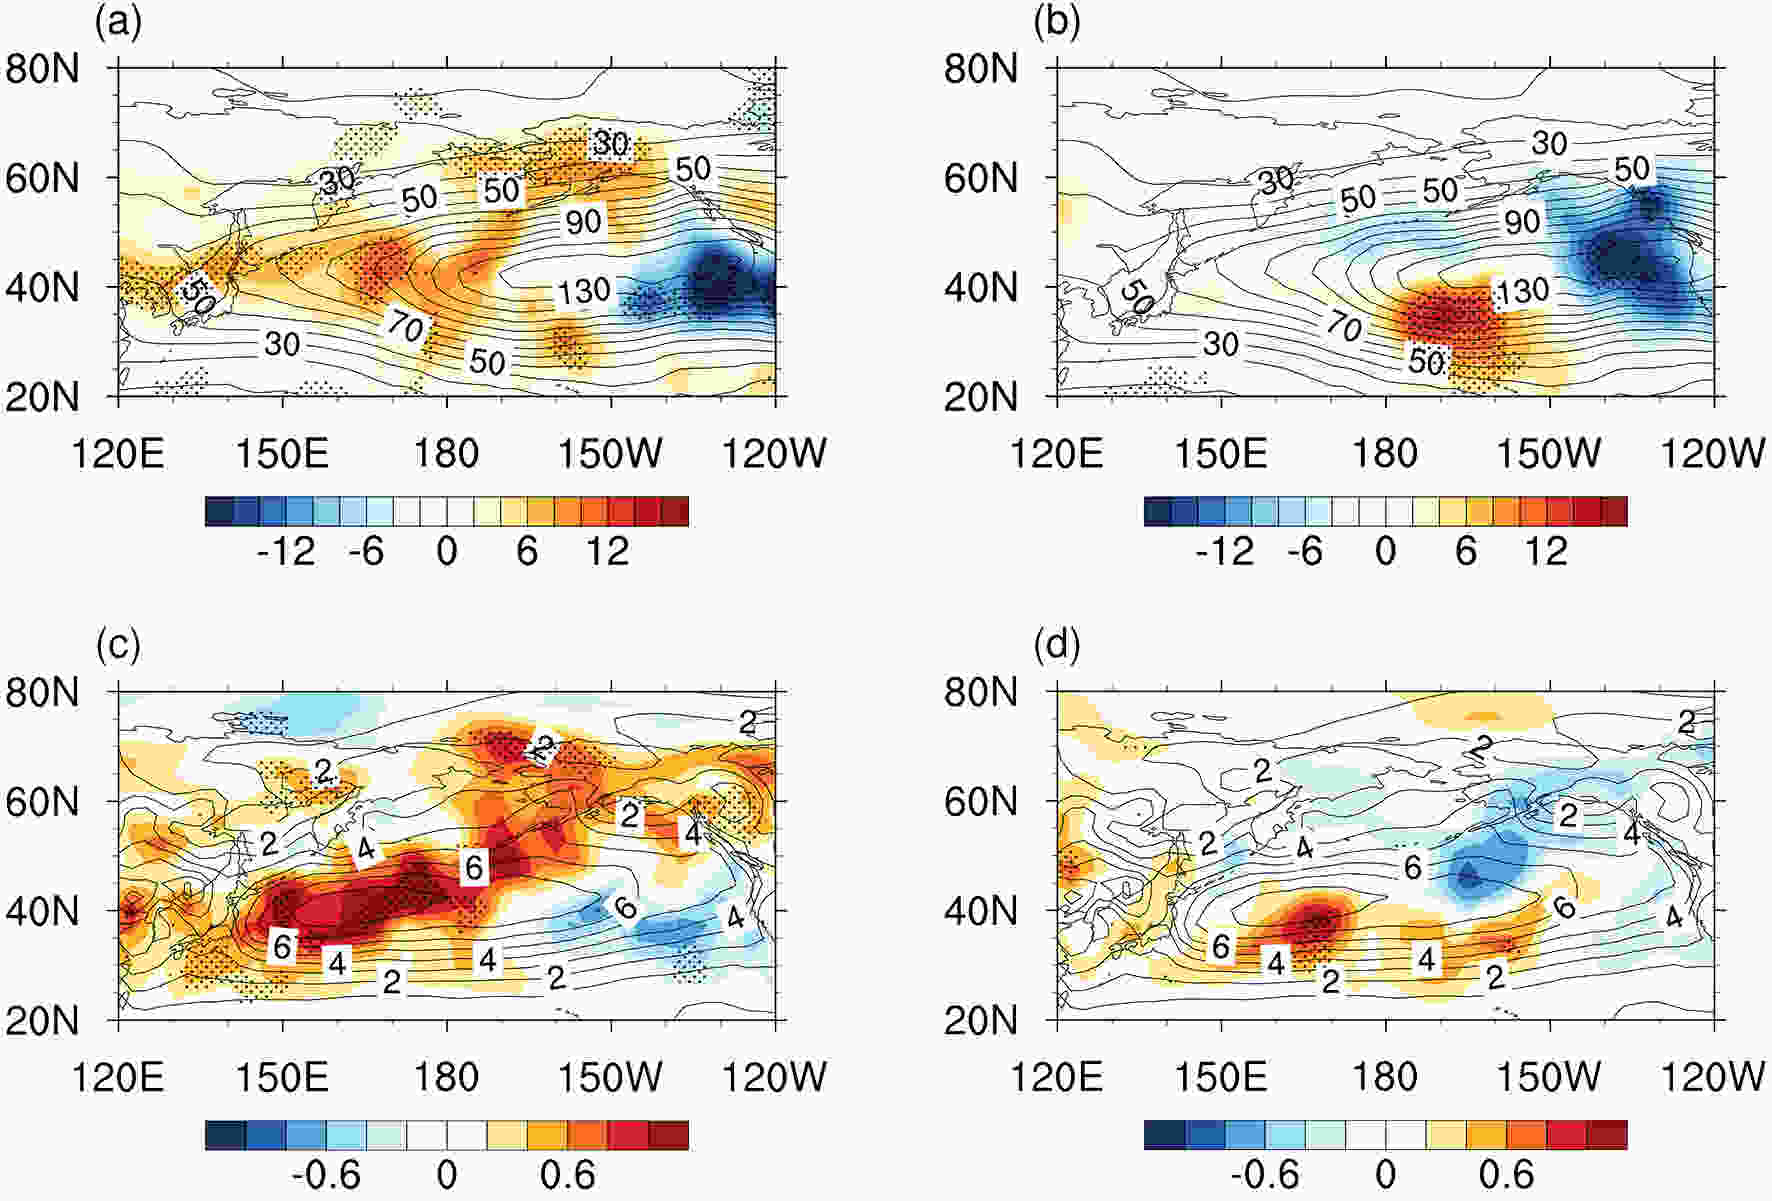 Figure5. Composited storm track anomaly during the KE stable and unstable periods. (a) Composited storm track anomaly

In KE stable state, as shown in Fig.6, the synoptic meridional heat flux at 850 hPa has a consistent correspondence with the lower atmospheric baroclinicity. The baroclinicity north of 40°N in the western Pacific and Gulf of Alaska at 850 hPa increased significantly, but decreased south of 40°N, which may be related to the distribution of the SSTA the horizontal temperature advection, or the ocean-continent thermal contrast. In fact, during the KE stable state, except in the vicinity of SSTA, the exchange of heat flux between ocean and atmosphere can cause the changes of atmospheric low-level baroclinicity, we also find that the area north of 50°N in the western Pacific and Gulf of Alaska have cold temperature advection, which can cause the enhancement of atmospheric baroclinicity to the south of the cold advection (figures not shown), this concept is consistent with the research of (Sun et al., 2018). During the unstable period of the KE, there is a strong baroclinicity to the south of 40°N, which may also be related to the cooling SSTA in the central Pacific Ocean during the unstable period of the KE, thus forming a strong meridional temperature gradient near 30°N. The storm track at 850 hPa also has a consistent correspondence with the lower atmospheric baroclinicity, as shown in Fig. 6. We also noticed a strong relationship between the atmospheric baroclinicity and the synoptic meridional heat flux in the lower atmosphere, but the correlation between the upper-level storm track and the low-level baroclinicity is not significant. On one hand, baroclinicity may be related to the downstream development along the storm track. Dynamic storm track analysis shows that baroclinic energy conversion does indeed correlate with the region of maximum baroclinicity. It is further noted that it is the downstream radiation of energy that serves as a trigger for the development and maintenance of storm track (Chang and Orlanski, 1993). On the other hand, the background atmospheric state can also influence the intensity and distribution of upper-level storm track, which makes the baroclinic region in lower atmosphere have poor correspondence with the storm track in the upper atmosphere. Some studies show that, the enhancement of the storm track in the presence of a thermal anomaly in lower atmosphere is confined in the lower troposphere and becomes much weaker in the upper troposphere. Numerical experiments show that the response of upper-level storm track to midlatitude SSTA exhibits great yearly difference, which indicates that the storm track is strongly affected by different background states (Taguchi et al., 2009; O’Reilly and Czaja, 2015; Kuwano-Yoshida and Minobe, 2017; Huang et al., 2020).
 Figure6. Baroclinicity (shaded, units: s?1) and storm track anomaly at 850 hPa (CI=0.4 m s–1 k) during the KE stable period and unstable period. (a) During the KE stable state; (b) During the KE unstable period. Statistically significant differences at 90% according to the Student’s t-test are stippled.
Here, u, v are the zonal wind velocity and meridional wind velocity, p is air pressure. x and y are represents zonal and meridional distance. The overbar and prime represent the climatological mean and monthly mean anomaly parts, respectively, and when TE is positive, barotropic energy conversion is extracted from the climatological-mean state to the low frequency mode, and vice versa. When TP is positive, it is the available potential energy that is converted from the climatological-mean state to the low-frequency mode, and vice versa. We define the parameter,


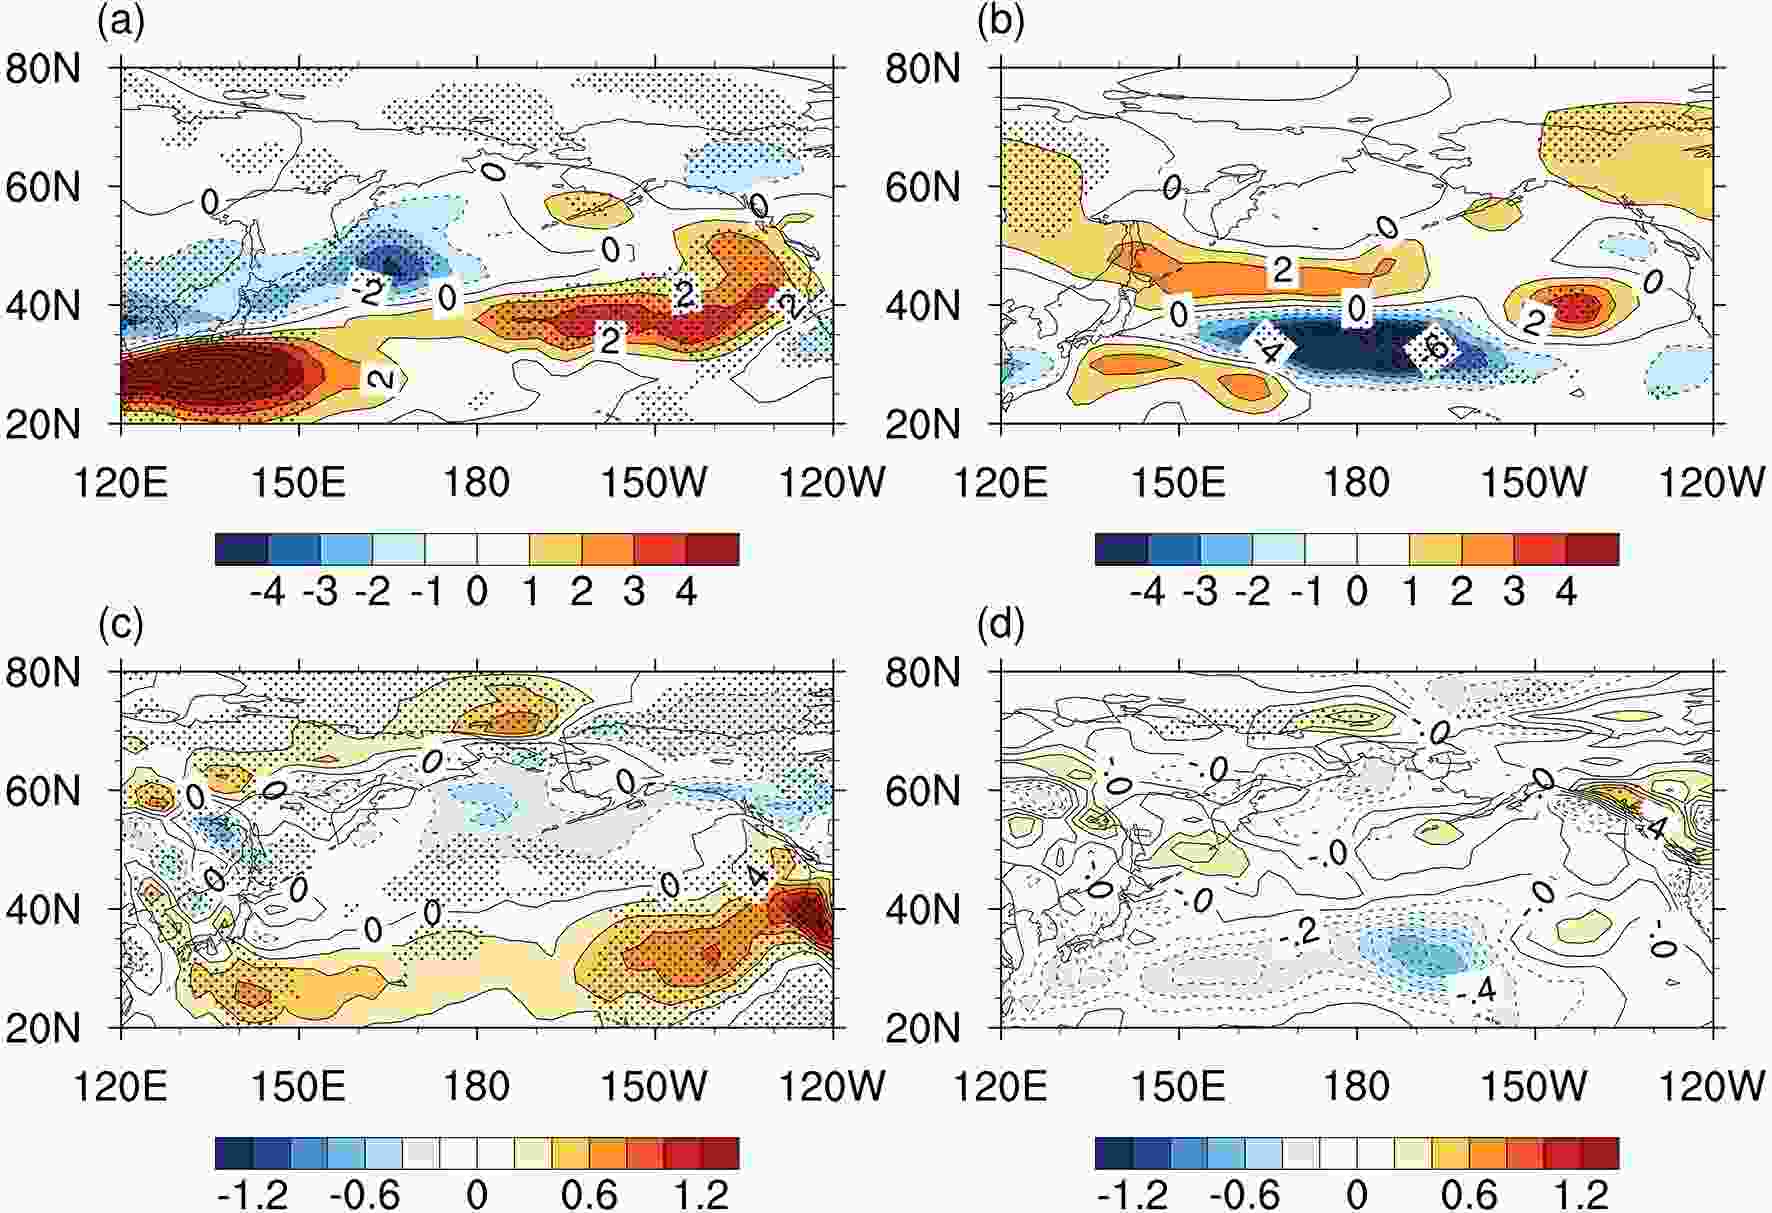 Figure7. Composited barotropic energy conversion TE (shaded, units: W m–2), (a) composited barotropic energy conversion at 250 hPa during the KE stable period, (b) composited barotropic energy conversion at 250 hPa during the KE unstable period; (c) and (d) are the same as (a) and (b), but at 850 hPa. Statistically significant differences at 90% according to the Student’s t-test are stippled.
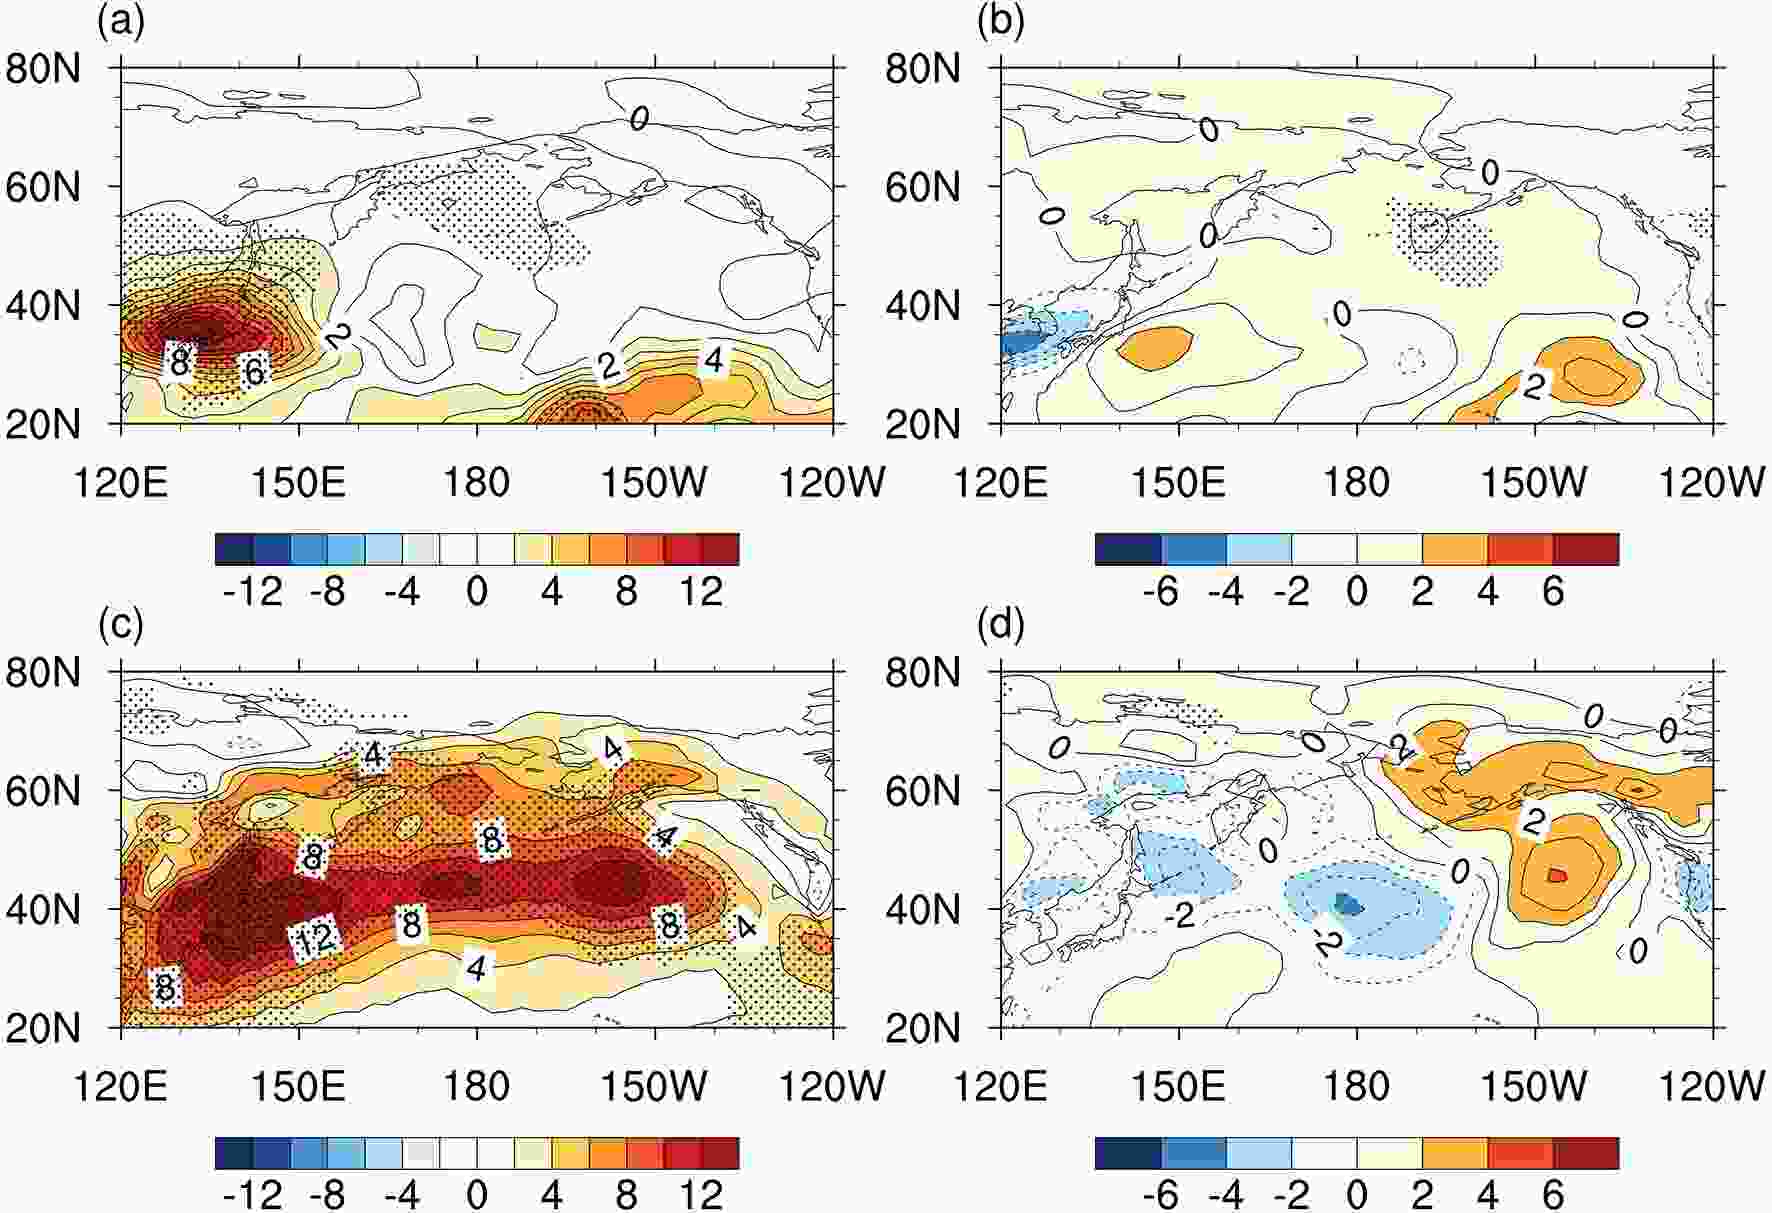 Figure8. Baroclinic energy conversion TP (shaded, units: W m–2), (a) composited baroclinic energy conversion at 250 hPa during the KE stable period, (b) composited baroclinic energy conversion at 250 hPa during the KE unstable period; (c) and (d) are the same is as (a) and (b), but at 850 hPa. Statistically significant differences at 90% according to the Student’s t-test are stippled.
Among them,


The prime represents the synoptic transient (2?8 days bandpass filtered) and the overbar represents the wintertime climatology.


During the KE stable period, as shown in Fig. 9, the diabatic heating term causes the negative geopotential height anomaly north of 40°N and a positive one south of 40°N, producing a negative geopotential height north of 40°N and positive geopotential height in the south, However, the magnitude is relatively weak, which shows that the diabatic heating has little effect on maintaining the WP/NPO like pattern. However, the feedback of transient eddy vorticity presents a tripolar structure, and the magnitude is larger, which is similar to the WP/NPO response, and it is very similar to the aforementioned tripolar structure at 250 hPa using the KEI regressed onto the geopotential height field as in Révelard et al. (2016, 2018). From the distribution of the storm track during the KE stable period, the dipole distribution forced by eddy vorticity in the East Pacific Ocean can also be regarded as the blocking anomaly forced by the storm track downstream of it. This implies that the synoptic eddy forcing is an important contributor to the formation of the dipole structure of the geopotential height anomaly (Holopainen and Fortelius, 1987; Nakamura and Wallace, 1993). The anomaly of the geopotential height field formed by the thermal feedback of transient eddy heating presents a north-south distribution pattern, and the magnitude is also relatively weak. The geopotential height field forced by transient eddy heating is strong north of 40°N, but relatively weak south of 40°N. The transient eddy heat flux mainly enhances the positive geopotential height anomaly in the North-Central Pacific Ocean, but its magnitude is smaller than that which is forced by the transient eddy vorticity. The feedback of diabatic heating and transient eddy heating tend to offset one another, nearly canceling each other out in terms of magnitude and sign. The distribution of diabatic heating and transient eddy feedback on latitude?altitude sections is shown in Fig. 10. The diabatic heating shows a certain baroclinic structure. Above 300 hPa and north of 40°N there is a negative tendency of the geopotential height anomaly, while there is a positive geopotential height anomaly below it. The feedback of transient eddy vorticity presents a nearly uniform barotropic structure, and its maximum influence is exists between 200 and 300 hPa. There is a positive tendency of geopotential height between 40° and 60°N, and a negative tendency of geopotential height outside of this region. The feedback of transient eddy heating seems to be opposite to the distribution of feedback of diabatic heating. In the range of 35° to 65°N, there is a clear positive tendency of geopotential height above 400 hPa, but the magnitude is still relatively small. Therefore, it can be concluded that the feedback of transient eddy vorticity is the main contributor towards maintaining the WP/NPO like pattern with a barotropic structure.
 Figure9. Feedback of diabatic heating and transient eddy to the geopotential height anomaly field at 250 hPa during the KE stable period (shaded, units: 10–3 m2 s–3), (a) feedback of diabatic heating; (b) feedback of transient eddy vorticity; (c) feedback of transient eddy heating. Statistically significant differences at 90% according to the Student’s t-test are stippled.
 Figure10. Latitude?altitude sections of the feedback of geopotential height anomaly field by diabatic heating and transient eddy during the KE stable period averaged over 135°E?125°W (shaded, units: 10–3 m2 s–3), (a) feedback of geopotential height field by diabatic heating; (b) feedback of transient eddy vorticity flux; (c) feedback of transient eddy heat flux to potential height field. Statistically significant differences at 90% according to the Student’s t-test are stippled.
During the unstable period of the KE, the SSTA is almost symmetrical with that which is observed during the stable period of the KE. However, the diabatic heating, feedback of transient eddy vorticity and feedback of transient eddy heating do not show symmetrical distributions which would be opposite to that in the KE stable period, as shown in Fig. 11. The parameter that is most significant is the feedback of transient eddy vorticity (its magnitude is the largest). As shown in Fig. 11(b), between 160° and 130°W and between 50°?60°N, the tendency of geopotential height forced by transient eddy vorticity tends to be positive. There are even significant positive anomalies in the Gulf of Alaska and the western Pacific, off the coast of North America, this is consistent with the significant positive response of geopotential height anomaly in this area. The feedback of transient eddy vorticity is negative in the central Pacific region south of 50°N. Feedback of transient eddy heating is significant to the south compared with transient eddy heating in the KE stable period, and there is a significant positive anomaly mainly south of 40°N in the KE unstable period. The feedback of diabatic heating is weaker than that which is observed in the KE stable period, but the spatial distributions are generally consistent with that in the KE stable period. The vertical distribution of diabatic heating and transient eddy feedback is shown in Fig. 12. The feedback of diabatic heating and transient eddy heating still shows a typical baroclinic structure, and the feedback of transient eddy heating is distributed southward. The feedback of transient eddy vorticity has obvious barotropic structure characteristics and exerts a negative tendency upon the geopotential height anomalies within the region from 40°N to 50°N, while a positive anomaly occurs outside of this region.. Although the sign of this parameter is generally opposite to that in the KE stable period, it is no longer significant at the 90% level, which may be the main reason for the asymmetric response of the atmosphere during the KE unstable period.
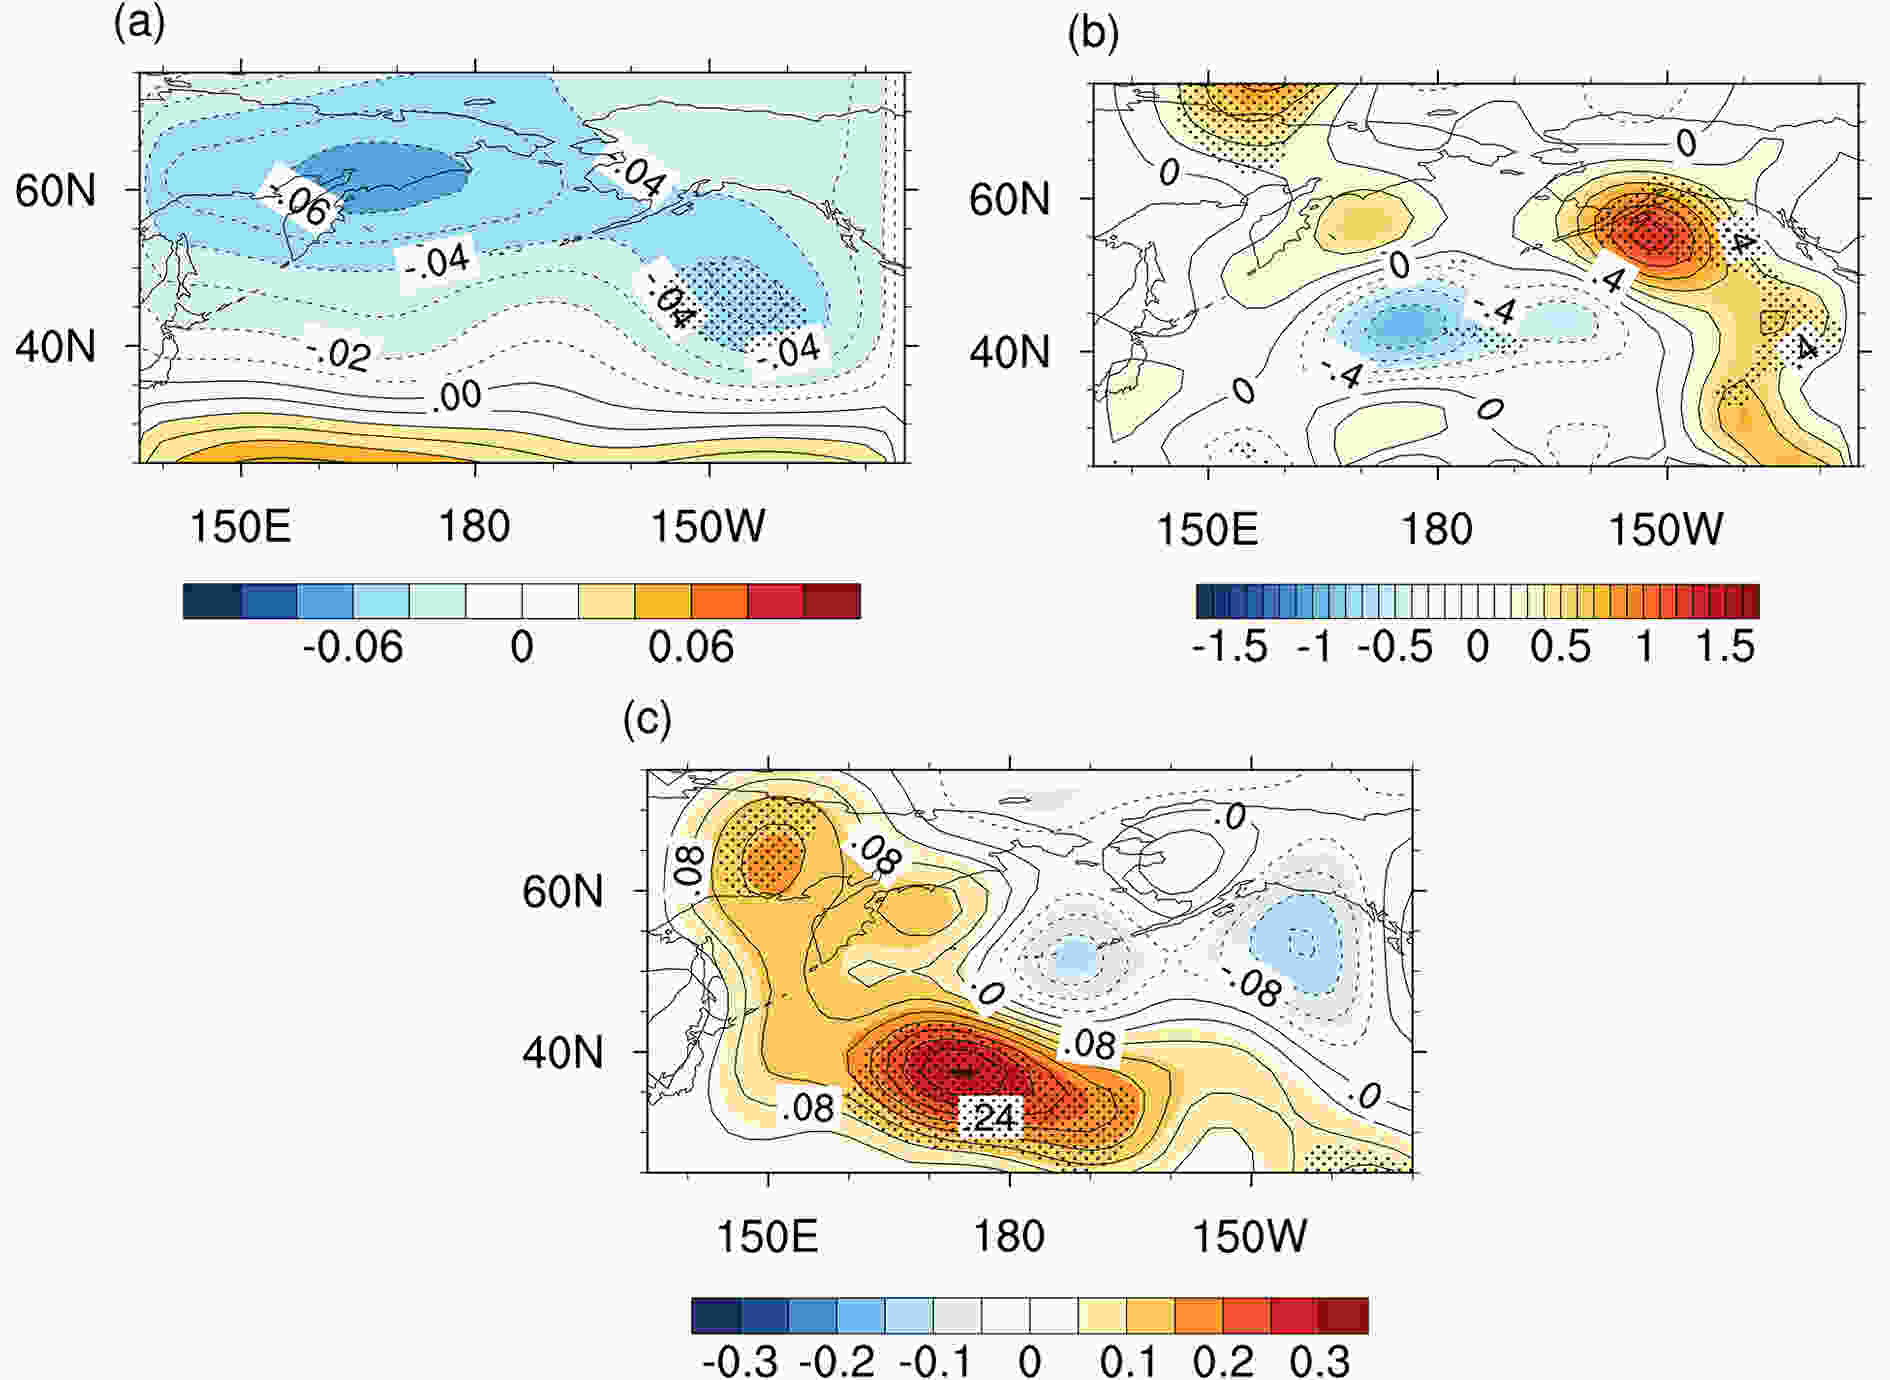 Figure11. The same as Fig. 9, but shows the feedback of diabatic heating and transient eddy to the geopotential height anomaly field at 250 hPa (shaded, units: 10?3 m2 s?3) during the KE instability.
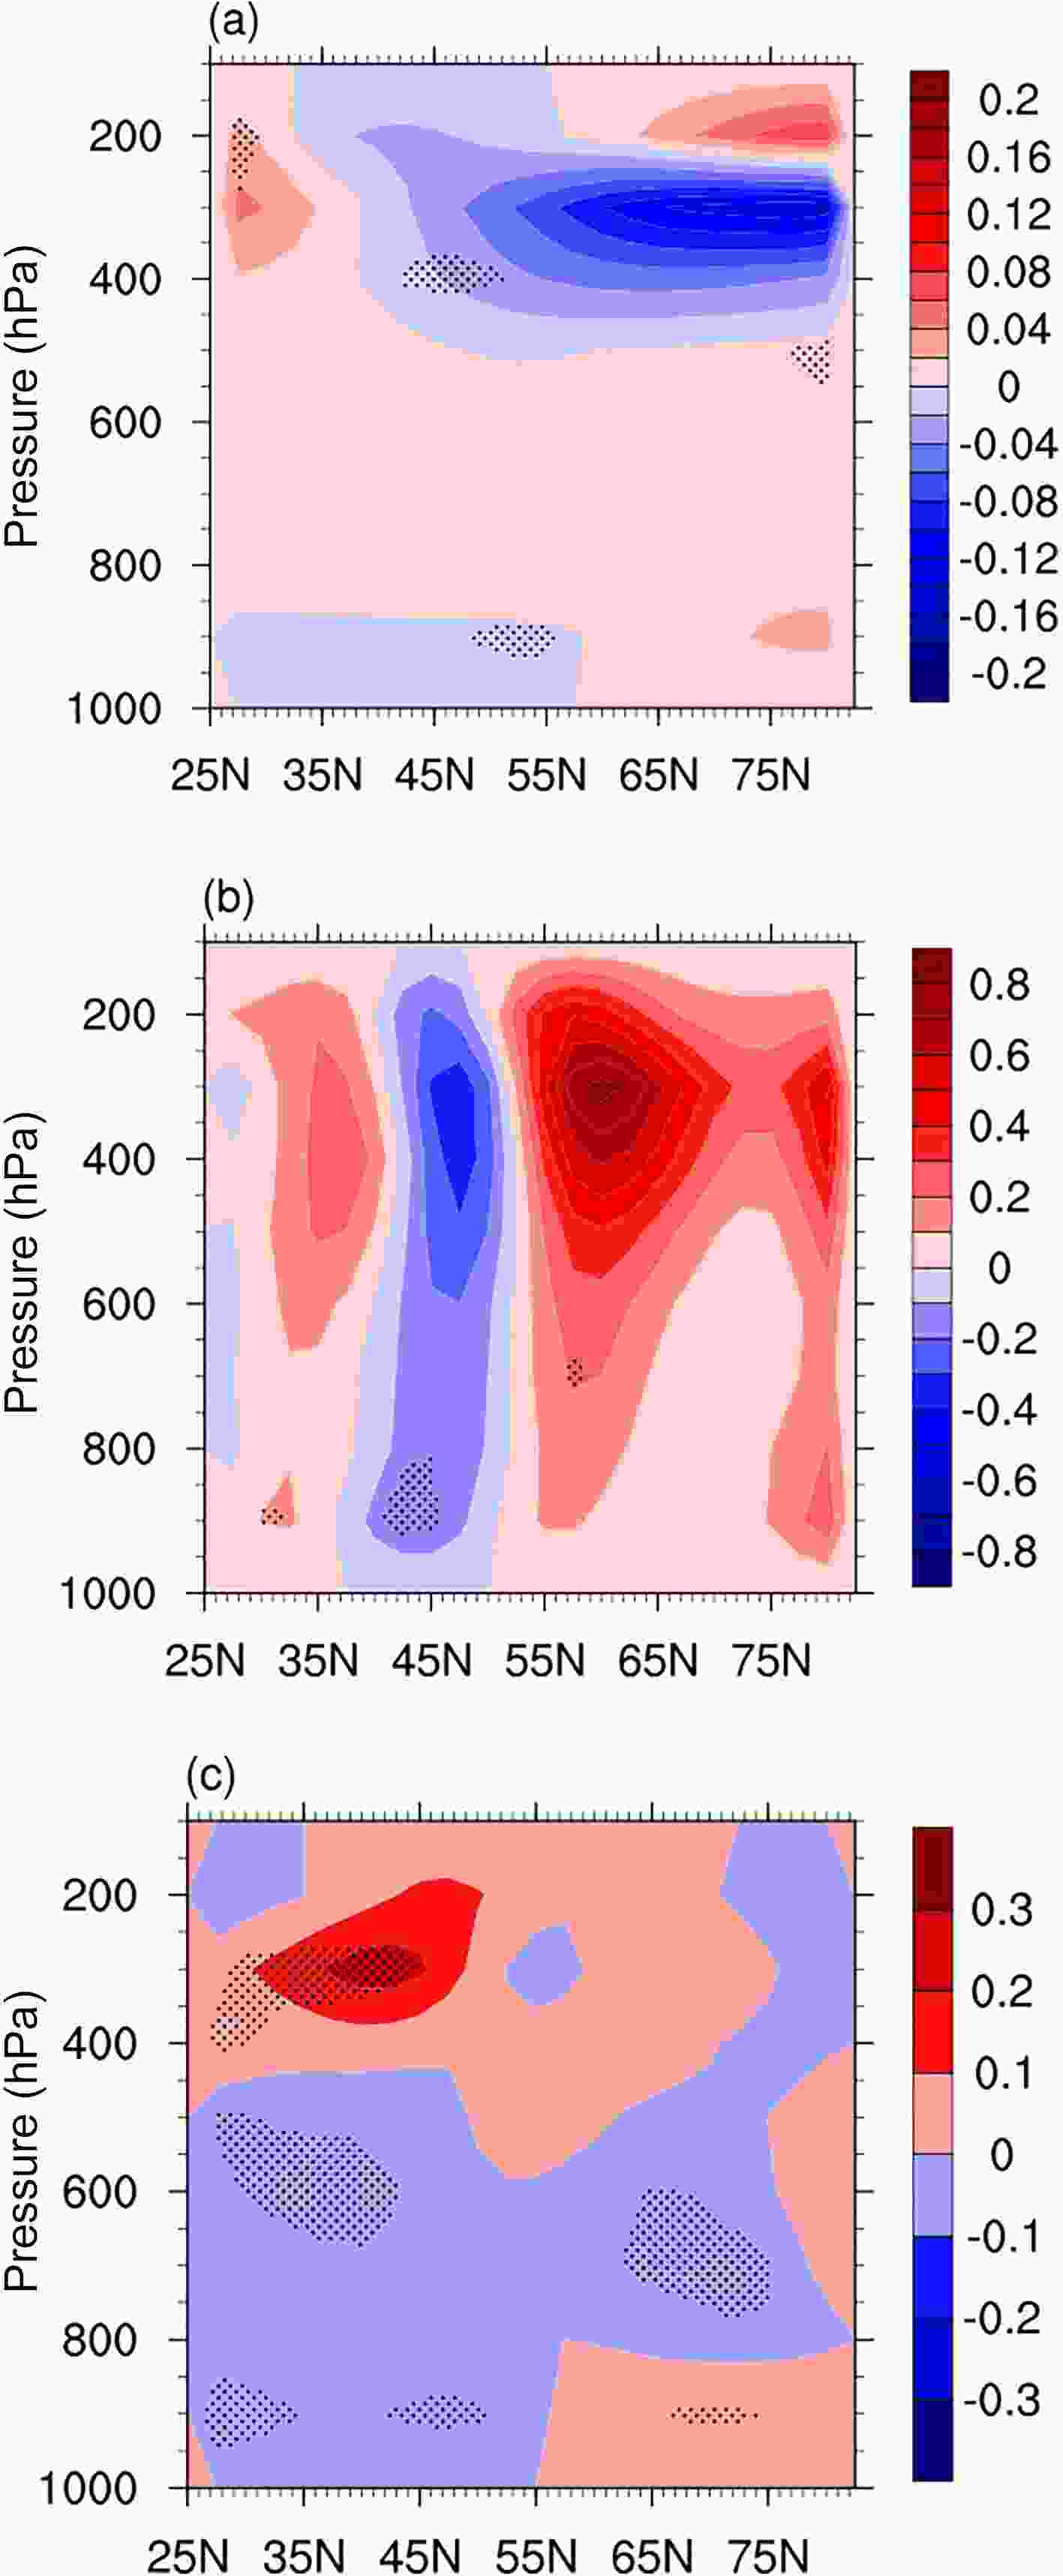 Figure12. The same as Fig. 10, but shows latitude?altitude sections averaged over 135°E?125°W) (shaded, units: 10?3 m2 s?3) of the feedback of diabatic heating and transient eddy to the geopotential height anomaly field during the KE instability.
(1) The SSTA formed by the KE during its stable and unstable periods are symmetrical. During the stable period of the KE, the SSTA in the central Pacific Ocean south of 40°N is warm, while the SSTA north of 40°N is cold. In the unstable period of the KE, the distribution of the SSTA is opposite that in the stable period.
(2) The response of the atmosphere to the symmetric SSTA formed in different periods of the KE is asymmetric. During the KE stable period, the response of the atmosphere presents a WP/NPO like pattern, which manifests as a barotropic structure. However, in the unstable period of the KE, there is no significant symmetrical response of the atmosphere.
(3) The barotropic energy conversion is not the main contributor to the WP/NPO like pattern in the KE stable period. The baroclinic energy conversion contributes to the WP/NPO like pattern mainly in the lower layer. During the unstable period of the KE, barotropic energy conversion may contribute positively towards its asymmetric response. The baroclinic energy conversion is still reflected in the lower atmosphere, and there is a negative anomaly of baroclinic energy conversion in the central Pacific.
(4) The asymmetric response of transient eddy vorticity feedback provides the main contribution to the asymmetric response of the atmosphere during different periods of the KE. During the KE stable period, the feedback of transient eddy vorticity manifests as a significant WP/NPO like pattern, which presents a barotropic structure. The feedback of transient eddy heating and the feedback of diabatic heating show a certain baroclinic structure, and their distributions roughly cancel each other. During the KE unstable period, the feedback of transient eddy vorticity is not opposite to that observed during the KE stable period and is found to be significant in the Gulf of Alaska and western Pacific (off the coast of North America) regions, which is consistent with the significant response of the geopotential height anomaly observed in that area.
These findings suggest that the asymmetric atmospheric response is caused by the asymmetry of the response of transient eddy vorticity and that there may be many other reasons that affect the asymmetric feedback of transient eddy vorticity. Many studies have shown that the different background atmospheric state may be one of the reasons that affect its asymmetric feedback. Based on numerical simulation experiments, Peng et al. (1997) first studied the response of the model to the warm SSTA in the North Pacific under different climatic conditions, and found that the different atmospheric background states during different months result in the different responses. There are also many subsequent studies that show the important influence of the background atmospheric state on eddy feedback (Kushnir et al., 2002; Thomson and Vallis, 2018; Huang et al., 2020). With different background states, the transient eddy response to SSTA can exhibit divergent response. For example, a strong background westerly jet is beneficial to the enhanced synoptic eddies that propagate toward the jet core and thus strong eddy-mean flow interaction occurs. However, a weak background atmospheric jet may confine the eddy activity in the lower atmosphere, thus decoupling its effect upon the upper troposphere (Lee and Kim, 2003; Nie et al., 2016; Huang et al., 2020). In this paper, composite analysis was conducted based on KEI. Aside from the influence of a baroclinicity anomaly in the lower atmosphere upon transient eddies, the difference of background atmospheric states interacting with the variable states of the KE may also be one of the possible reasons for the asymmetric feedback of transient eddy vorticity. In our next study, we will continue to design numerical sensitivity experiments designed to further discuss the forcing of the symmetric SSTA during different periods of the KE on the atmosphere and verify the conclusions using the reanalysis data.
Acknowledgements. We thank Prof. Bo QIU of University of Hawaii and Dr. Gongjie WANG for providing the Kuroshio Extension Index. We also thank two anonymous reviewers and editors for their insightful comments, which greatly improved the quality of this manuscript. This research was supported by the National Natural Science Foundation of China (Grant No. 41490642).
