1.State Key Laboratory of Atmospheric Boundary Layer Physics and Atmospheric Chemistry, Institute of Atmospheric Physics, Chinese Academy of Sciences, Beijing 100029, China 2.University of Chinese Academy of Sciences, Beijing 100049, China 3.Center for Excellence in Urban Atmospheric Environment, Institute of Urban Environment, Chinese Academy of Sciences, Xiamen 361021, China 4.Key Laboratory of Geographic Information Sciences, Ministry of Education, School of Geographic Sciences, East China Normal University, Shanghai 200241, China 5.CAS Key Laboratory of Forest Ecology and Management, Institute of Applied Ecology, Chinese Academy of Sciences, Shenyang 110016, China 6.Department of Earth, Environmental, and Planetary Sciences, Brown University, Providence, RI 02912, USA 7.Institute at Brown for Environment and Society, Brown University, Providence, RI 02912, USA 8.College of Resources and Environmental Sciences, China Agricultural University, Beijing 100193, China 9.National Physical Laboratory, Air Quality and Aerosol Metrology Group, Environment Department, Hampton Road, Teddington, Middlesex, TW11 0LW, UK 10.National Satellite Meteorological Center, China Meteorological Administration, Beijing, 100081, China 11.Key Laboratory of Stable Isotope Techniques and Applications, Shenyang 110016, China 12.Centre for Environmental and Agricultural Informatics, Cranfield University, College Road, MK43 0AL, UK Manuscript received: 2020-04-20 Manuscript revised: 2020-05-28 Manuscript accepted: 2020-06-15 Abstract: 摘要:我国自2013年实施《大气污染防治行动计划》以来,中东部大气二氧化硫和硫酸盐气溶胶含量下降迅速,但硝酸盐含量降幅不明显。大气富氨环境是导致重污染期间硝酸盐居高不下的主要因素,成为我国现阶段大气环境问题的新特征。迄今,包括我国在内的世界上大部分地区都未对氨气排放进行管控,近地面观测资料依然非常缺乏,而广泛使用的被动采样器获得的氨气浓度存在系统性的偏差。基于已有的卫星观测资料,发现全球主要农业区的氨气柱浓度呈现上升趋势;对于城市普遍出现的高浓度氨气,其来源主要是农业排放还是机动车等非农业源来源尚无科学定论。基于同位素技术的氨气溯源研究方法展现出巨大潜力,有望解决困扰科学界的氨气来源之争,但现有的输入参数(包括气粒转化过程中的同位素分馏系数和不同排放源的同位素特征值)仍然受限于观测方法本身的局限性而存在很大不确定性。本文重点从方法学角度探讨大气氨浓度观测和同位素溯源的最新进展。 关键词:氨气, 铵盐, 氮同位素, 源解析, 霾污染
HTML
--> --> --> While China’s Air Pollution Prevention and Control Action Plan on particulate matter since 2013 has reduced sulfate significantly, aerosol ammonium nitrate remains high in East China. As the high nitrate abundances are strongly linked with ammonia, reducing ammonia emissions is becoming increasingly important to improve the air quality of China. Although satellite data provide evidence of substantial increases in atmospheric ammonia concentrations over major agricultural regions, long-term surface observation of ammonia concentrations are sparse. In addition, there is still no consensus on whether agricultural or non-agricultural emissions dominate the urban ammonia budget. Identifying the ammonia source by nitrogen isotope helps in designing a mitigation strategy for policymakers, but existing methods have not been well validated. Revisiting the concentration measurements and identifying source apportionment of atmospheric ammonia is thus an essential step towards reducing ammonia emissions.
1. The need for ammonia monitoring in the atmosphere Ammonia (NH3) is the most abundant alkaline gas in the atmosphere. While NH3 has a beneficial role in buffering acid rain (Wang et al., 2012), after deposition it can detrimentally affect Earth’s ecosystems through soil acidification, water eutrophication, and biodiversity loss (Liu et al., 2019). The overabundance of NH3 in the lower atmosphere is suggested to promote the formation of secondary ammoniated aerosol particles (Wang et al., 2016), with significant impacts on visibility deterioration and human health (An et al., 2019). Recently, NH3 and ammonium nitrate particles were also found in the upper troposphere during the Asian monsoon and play a hitherto neglected role in ice cloud formation and aerosol indirect radiative forcing (H?pfner et al., 2019). However, the severe lack of NH3 measurements with sufficient spatial and temporal coverage is currently a barrier to understanding the vital role of NH3 in air pollution, ecosystem protection, and climate change. It has resulted in unclear regulatory guidelines for mitigating these effects (Pan et al., 2020b).
2. Current status of ammonia observations and limitations Anthropogenic emissions of NH3 in China are more significant than the total emissions of the U.S. and the European Union (Liu et al., 2019). To date, there is still no national NH3 concentration monitoring network operated by the Chinese government. Following the guidelines of the National Atmospheric Deposition Program in the U.S., the Institute of Atmospheric Physics, Chinese Academy of Sciences, established a Regional Atmospheric Deposition Observation Network in the North China Plain (READ-NCP). This network, including 10 sites covering different land-use types, started monitoring NH3 concentrations in 2007, and has also obtained significant results with respect to the atmospheric deposition of nitrogen, carbon, sulfate, and metals. Based on the observations of READ-NCP from 2008 to 2010, NH3 was found to be a significant contributor to nitrogen deposition in this region (Pan et al., 2012). Thus, clarification of NH3 levels in China can aid policymakers in the protection of ecosystems from excess nitrogen deposition. Due to the lack of data, however, the whole picture of NH3 distribution in China was poorly understood. In 2015, READ-NCP was extended to a spatially dense and cost-efficient network focusing on NH3 observations in China (AMoN-China) (Pan et al., 2018). The system currently consists of approximately 100 sites, which is similar to that of the U.S. AMoN (Fig. 1). While the NH3 concentration was relatively low in the U.S., there is an increasing importance of deposition of reduced nitrogen due to the significant reduction in oxidized nitrogen (Li et al., 2016). Figure1. Surface ammonia concentrations during 2015?16 observed by AMoN in (a) the U.S. (http://nadp.slh.wisc.edu/AMoN/), (b) the UK (https://uk-air.defra.gov.uk/), and (c) East Asia (https://www.eanet.asia) including China (Pan et al., 2018). (d) Long-term surface measurements of ammonia in Africa within the framework of the IDAF (IGAC-DEBITS-AFRICA) program (mean values from 1998 to 2007) (Adon et al., 2010). Global ammonia morning column measurements (2008–16) observed from space by IASI are also shown (https://doi.pangaea.de/10.1594/PANGAEA.894736).
Besides AMoN in China (Pan et al., 2018) and the U.S. (http://nadp.slh.wisc.edu/AMoN), the monitoring of surface NH3 is also conducted by other networks (Fig. 1), e.g., EANET (The Acid Deposition Monitoring Network in East Asia; https://www.eanet.asia), EMEP (the Co-operative Programme for Monitoring and Evaluation of the Long-Range Transmission of Air Pollutants; http://ebas.nilu.no/Default.aspx) and the IDAF (IGAC-DEBITS-AFRICA) program for African ecosystems (Adon et al., 2010). Most of these networks employed a cost-effective approach by using passive samplers, including ALPHA, Analyst, Radiello, and Ogawa, which have advantages in characterizing the spatial distribution and long-term trends of NH3. However, the accuracy of these passive NH3 sampling techniques is not well validated in the field, which represents one of the biggest challenges in NH3 monitoring (Martin et al., 2019). For example, it is reported that the NH3 concentrations collected by Radiello passive samplers are approximately 40% lower than the denuder-based reference method (Puchalski et al., 2011). The low NH3 concentration bias in the passive collection samplers was suggested to be the result of inaccurate effective sampling rates due to incorrect mass transfer correction factors for the environmental conditions (Pan et al., 2020a). Thus, questions remain as to whether the NH3 concentrations from different networks can be directly compared if they employed different passive samplers. Concurrent measurements of the passive samplers used in various networks are thus further needed, with a collocated reference method, e.g., annular denuders and continuous real-time instruments employing the wet chemistry technique (von Bobrutzki et al., 2010; Martin et al., 2019; Pan et al., 2020a).
3. Debate on ammonia sources in the urban atmosphere The need for source apportionment has increased in recent years as atmospheric NH3 concentrations and deposition fluxes have shown little change or even increased following more stringent air pollutant controls (Liu et al., 2018). Long-term satellite observation from the Atmospheric Infrared Sounder (AIRS) aboard NASA’s Aqua satellite also implied that NH3 levels over agricultural regions had experienced significant increasing trends between 2002 and 2013, with an annual increase rate of 2.6%, 1.8% and 2.3% in the U.S., the European Union, and China, respectively (Warner et al., 2017). The increment of atmospheric NH3 concentrations tended to continue between 2013 and 2017, as observed from space with the Cross-track Infrared Sounder (CrIS) (Shephard et al., 2020). While agricultural activities (fertilization and livestock volatilization) are known to dominate the emissions of NH3, accounting for over 60% and 80% of the global and Asian inventory (Bouwman et al., 1997; Huang et al., 2012), non-agricultural sources have been suggested as a major NH3 source at the urban scale (Felix et al., 2014; Pan et al., 2016; Sun et al., 2017; Chang et al., 2019; Walters et al., 2020a). Ammonia emissions in developing cities are especially important because of their high emissions ratios to CO2 and rapidly expanding vehicle fleets (Sun et al., 2017). For example, vehicular emissions were found to be a critical NH3 source in urban Beijing (Ianniello et al., 2010; Meng et al., 2011). Industrial NH3 emissions, rather than those from vehicles, were also identified in the megacity of Shanghai (Wang et al., 2015). However, in contrast to previous results, Teng et al. (2017) suggested that urban green spaces and evaporation of deposited NHx (NH3+NH4+) on wet surfaces, rather than traffic and agricultural emissions, were the primary source for NH3 in an urban environment during winter in NCP. Thus, there is still no consensus on whether these emissions are among the major sources of urban atmospheric NH3. Currently, the rapid development of isotope techniques is promising (Liu et al., 2014) and may provide scientists and policymakers with a more robust methodology and reliable evidence to track atmospheric NH3 sources (Felix et al., 2014; Pan et al., 2016; Chang et al., 2019; Walters et al., 2020a).
4. Constraining ammonia sources utilizing nitrogen isotopes The use of nitrogen isotopic composition of NH3 (δ15N-NH3) as a fingerprint identification of NH3 emissions sources requires distinguishable isotopic signatures (Felix et al., 2013). While this technique has been widely used in Chinese cities, e.g., Beijing (Pan et al., 2016; Zhang et al., 2020) and Shanghai (Chang et al., 2019), considerable uncertainties remain in characterizing the endmembers. In particular, current collection methods are almost exclusively based on passive samplers, which have not been verified for their suitability to characterize δ15N-NH3 accurately. Recently, Walters and Hastings (2018) validated an active sampling collection technique using an acid-coated honeycomb denuder to characterize δ15N-NH3 under a variety of laboratory-controlled conditions as well as under field conditions. As a reference to this new verified method, Walters et al. (2020a) also found a substantial low bias of 15‰ in the ALPHA passive sampler in characterizing δ15N-NH3 from traffic plumes. Such a low bias of passive samplers in characterizing δ15N-NH3 was also confirmed in field observations in urban Beijing by Pan et al. (2020a). Thus, previous source apportionment needs to be reevaluated if using an inventory of δ15N-NH3 based on passive samplers, especially the ALPHA sampler. To evaluate the potential influences of the low bias of δ15N-NH3 by passive samplers, we revisited the sources of atmospheric NH3 in urban Beijing using a Bayesian isotope mixing model (SIAR, Stable Isotope Analysis in R) (Kendall et al., 2007). Two scenarios were performed based on an isotopic inventory with and without correction for the passive collection δ15N-NH3 bias (Fig. 2). Accordingly, the model was run with δ15N-NH3 values of ?18.2‰ (corrected) and ?33.2‰ (original uncorrected) as input for ambient samples. The latter value represented an annual mean δ15N-NH3 value in urban Beijing based on a year-round and weekly collection by the passive ALPHA sampler (Zhang et al., 2020). Figure2. The nitrogen isotopic composition of ammonia characterized at various endmembers. Recent reported isotopic signatures from traffic plumes, fertilizer and livestock (Ti et al., 2018; Kawashima, 2019; Walters et al., 2020a) were updated based on the previous summary by Walters and Hastings (2018). Note that the field sampling was conducted by different collection methods (legend) and is grouped by passive against active samplers (symbols with colors). To correct the low bias of passive data (gray symbols), 15‰ was added to the original values and is shown as corrected (symbols with colors) accordingly. Symbols with the same color and shape represent a series of observations during the same campaign. Data sources: (a) Freyer (1978); (b) Hristov et al. (2009); (c) Heaton (1987); (d) Savard et al. (2017); (e) Smirnoff et al. (2012); (f) Ti et al. (2018); (g) Felix et al. (2013); (h) Walters et al. (2020b); (i) Kawashima (2019); (j) Felix et al. (2014); (k) Chang et al. (2016).
Figure 3a demonstrates that non-agricultural sources contributed only 57% of NH3 using the inventory without correction (Fig. 2), which is lower than the original estimation of ~72% by Zhang et al. (2020). This difference implied the impacts of different selection of source signatures in these two studies. Also, we have apportioned the source of NH3 with corrected δ15N-NH3 values of both inventories and samples by adding 15‰ to the corresponding passive sampler measurement data. The results showed that 66% of NH3 was from non-agricultural emissions (Fig. 3b). This attribution may be more reliable due to the updated inventory. The different contributions between Figs. 3a and b for each source, in particular for fertilizers, industry, and vehicles, indicated the uncertainty introduced by the low δ15N-NH3 bias of passive samplers. Figure3. Source apportionment of atmospheric ammonia in urban Beijing based on isotopic inventory (a) without and (b) with correction for the passive collection bias in characterizing nitrogen isotopic composition of ammonia, as shown in Fig. 2. The nitrogen isotopic values of ?18.2‰ (corrected) and ?33.2‰ (original) were selected as input for ambient ammonia samples. The original isotope data of ?33.2‰ were the annual mean values observed between March 2016 and March 2017 by Zhang et al. (2020).
5. Outlook It is important to note that tropospheric NH3 concentrations can be reduced through tight control measures; else they will continue to increase. Constraining NH3 sources utilizing stable nitrogen isotopes can aid policymakers to draft a mitigation strategy for NH3 emissions, but this method depends on an accurate characterization of δ15N-NH3 from both source and receptor sites. While the isotopic inventory has significant impacts on the source apportionment, a verified collection technique is warranted to improve the source inventory of δ15N-NH3. Due to the different lifetime of NH3 and NH4+ in the atmosphere, the sources of NH3 and NH4+ at a given site may also be different. Thus, a better knowledge of nitrogen fractionation via atmospheric processes, e.g., gas-to-particle conversion, also helps in source apportionment of atmospheric NH3 and NH4+. To address this concern, the concurrent determination of different chemical speciation (i.e., δ15N-NH3 and δ15N-NH4+) is highly needed. Acknowledgements. This study was supported by the National Key Research and Development Program of China (Grant No. 2017YFC0210100), National Research Program for Key Issues in Air Pollution Control (Grant No. DQGG0208) and the National Natural Science Foundation of China (Grant No. 41405144). WWW acknowledges support from the Atmospheric and Geospaces Sciences U.S. National Science Foundation (Grant No. AGS 1351932). We acknowledge the U.K. Department for Environment Food & Rural Affairs (uk-air.defra.gov.uk) as the source of the UK ammonia data (? Crown 2020 copyright Defra via uk-air.defra.gov.uk, licenced under the Open Government Licence). ? Crown copyright 2020 and reproduced by permission of the Controller of HMSO and the Queen’s Printer for Scotland.
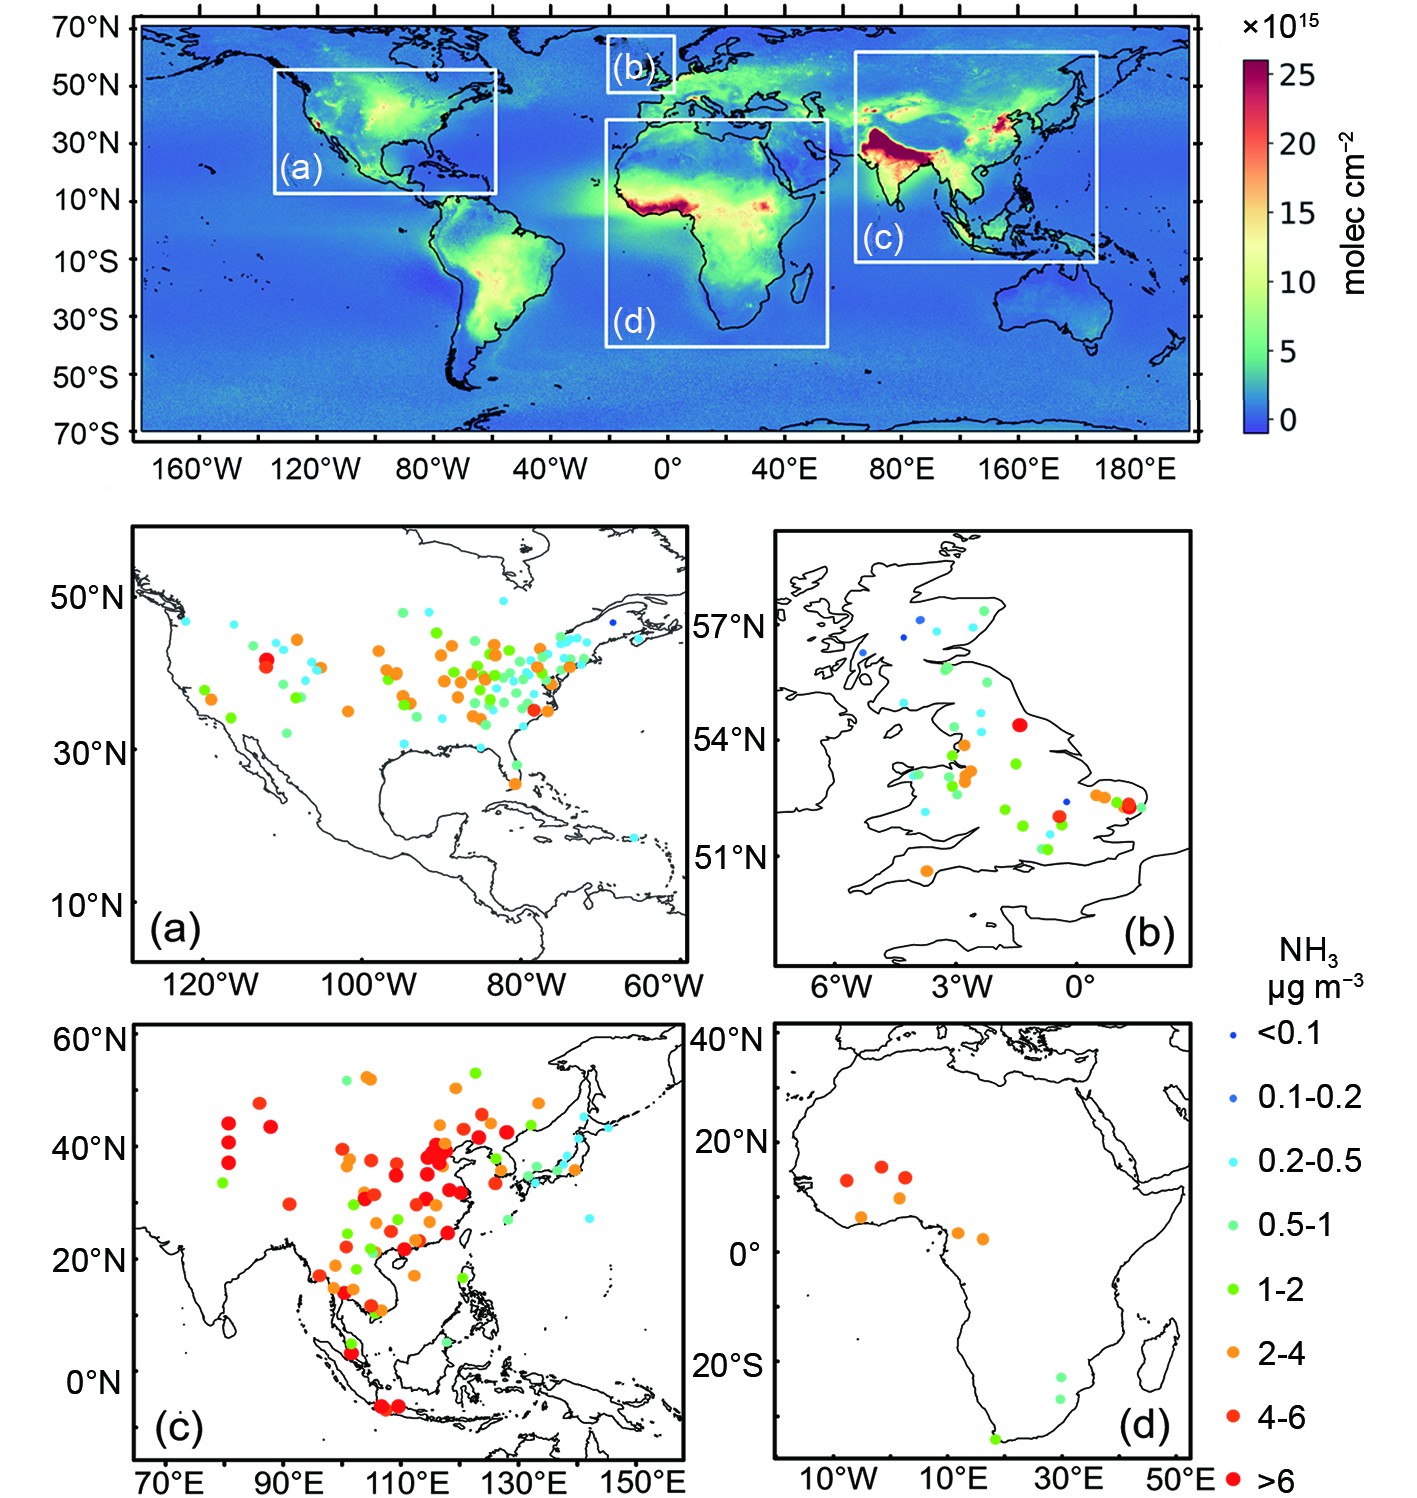 Figure1. Surface ammonia concentrations during 2015?16 observed by AMoN in (a) the U.S. (http://nadp.slh.wisc.edu/AMoN/), (b) the UK (https://uk-air.defra.gov.uk/), and (c) East Asia (https://www.eanet.asia) including China (Pan et al., 2018). (d) Long-term surface measurements of ammonia in Africa within the framework of the IDAF (IGAC-DEBITS-AFRICA) program (mean values from 1998 to 2007) (Adon et al., 2010). Global ammonia morning column measurements (2008–16) observed from space by IASI are also shown (https://doi.pangaea.de/10.1594/PANGAEA.894736).
 Figure2. The nitrogen isotopic composition of ammonia characterized at various endmembers. Recent reported isotopic signatures from traffic plumes, fertilizer and livestock (Ti et al., 2018; Kawashima, 2019; Walters et al., 2020a) were updated based on the previous summary by Walters and Hastings (2018). Note that the field sampling was conducted by different collection methods (legend) and is grouped by passive against active samplers (symbols with colors). To correct the low bias of passive data (gray symbols), 15‰ was added to the original values and is shown as corrected (symbols with colors) accordingly. Symbols with the same color and shape represent a series of observations during the same campaign. Data sources: (a) Freyer (1978); (b) Hristov et al. (2009); (c) Heaton (1987); (d) Savard et al. (2017); (e) Smirnoff et al. (2012); (f) Ti et al. (2018); (g) Felix et al. (2013); (h) Walters et al. (2020b); (i) Kawashima (2019); (j) Felix et al. (2014); (k) Chang et al. (2016).
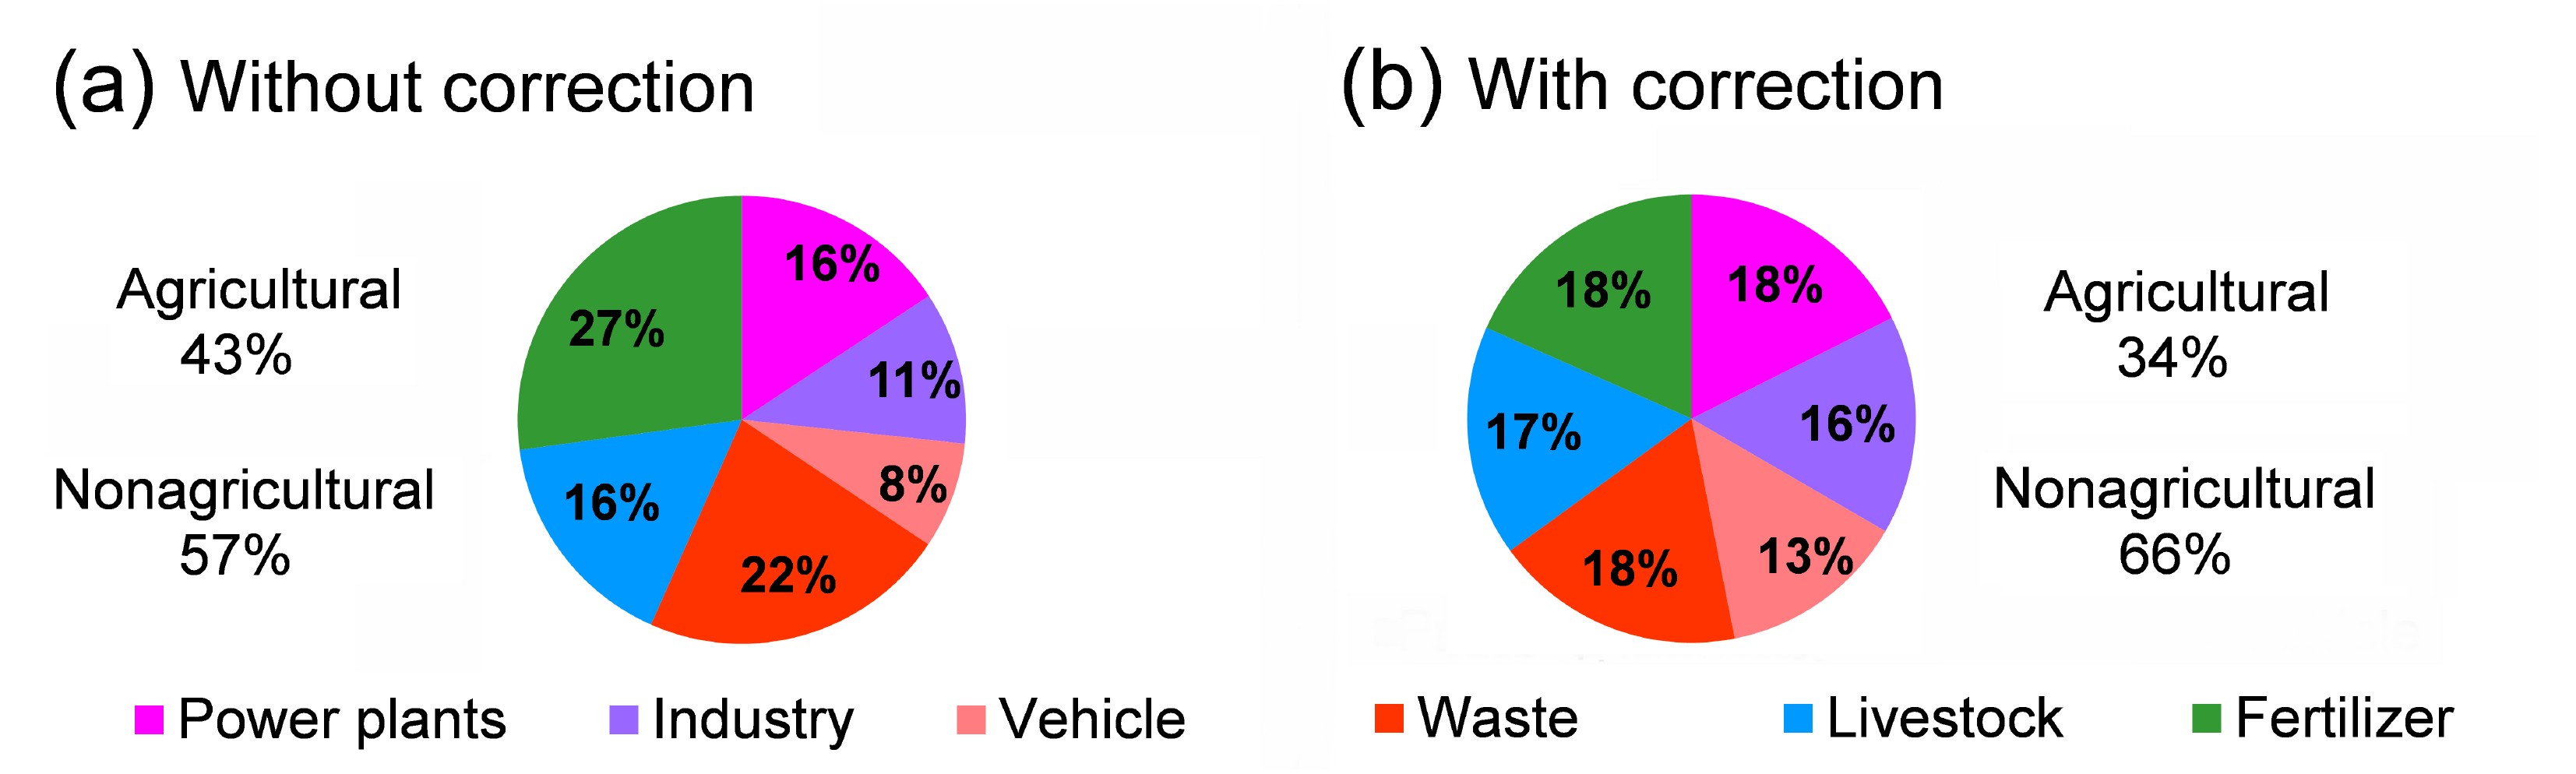 Figure3. Source apportionment of atmospheric ammonia in urban Beijing based on isotopic inventory (a) without and (b) with correction for the passive collection bias in characterizing nitrogen isotopic composition of ammonia, as shown in Fig. 2. The nitrogen isotopic values of ?18.2‰ (corrected) and ?33.2‰ (original) were selected as input for ambient ammonia samples. The original isotope data of ?33.2‰ were the annual mean values observed between March 2016 and March 2017 by Zhang et al. (2020).