HTML
--> --> -->Visibility is a measure of the distance at which an object or light can be clearly discerned (Watson, 2002; Zhang et al., 2014). The damaged visibility is a reflection of the low transparency of the atmosphere. Visibility can reach 300 km when only taking into account Rayleigh scattering and gas absorption (Watson et al., 2002). However, visibility is reduced to a few kilometers in the presence of particles (Chan et al., 1999; Song et al., 2013; Liu et al., 2019). Several studies have shown the relationship between the aerosol loading and visibility, which is relevant to the mass concentration, chemical composition and the size distribution of aerosols (Wang et al., 2015; Zhou et al., 2016; Liu et al., 2019). The distribution of PM2.5 mass concentrations varies dramatically in spatiotemporal dimensions, and therefore estimation of PM2.5 mass concentrations using satellite-based remote sensing data is a promising method (Sun et al., 2019). In many previous studies, the relationship between the satellite data of aerosol optical depth (AOD) and in-situ measured surface PM2.5 mass concentrations was investigated (van Donkelaar et al., 2006; Chelani, 2019; Sun et al., 2019). Zheng et al. (2017) analyzed the influential factors including the aerosol type, relative humidity (RH), planetary boundary layer height, wind speed and direction, and the vertical structure of aerosol distribution.
According to those previous studies, aerosol water uptake has a significant impact on the relationship between AOD and PM2.5 (Zhao et al., 2019). Aerosol hygroscopic growth enhances the scattering ability of particles, and accelerates the formation of haze pollution. However, some numerical models still lack sufficient input data for aerosol hygroscopicity (Zhao et al., 2019). The hygroscopic enhancement factor f(RH) was defined as the ratio of aerosol optical properties such as aerosol extinction, aerosol scattering and aerosol backscattering between wet and dry (reference) conditions (Kotchenruther and Hobbs, 1998). f(RH) can be obtained from nephelometer measurements with different methods. Malm and Day (2001) employed a single nephelometer with an RH range of 35%?85%. For other studies, two parallel nephelometers with one operated at lower RH and another at higher RH were used (Pandolfi et al., 2018). However, previous methods cannot precisely obtain the aerosol hygroscopicity when RH reaches above 90%. Zhao et al. (2019) reported f(RH) with a wider range of RH between 30% and 96% using an improved nephelometer system. With the development of methods and instruments in this field, there are many studies that have demonstrated the relationship between aerosol hygroscopicity and RH in different seasons and places (Li et al., 2013; Chen et al., 2019; Zhao et al., 2019).
Based on previous studies, the IMPROVE (Interagency Monitoring of Protected Visual Environments) project provides a method to calculate aerosol loading from visibility (Ryan et al., 2005). However, this method is relatively complicated, involving detailed measurements of mass concentrations of several components. In this study, an empirical method was developed to calculate PM2.5 mass concentration from visibility and RH in a certain area where light extinction was mainly contributed by PM2.5.
2.1. Site and instruments
The experiment was conducted from 4?19 January 2019 in Changshou, Chongqing, in Southwest China. The site (29°49'N, 107°00'E; 266 m above sea level) is located in Yanjia Industrial Park surrounded by busy highways. It is about 51 km away from the city center of Chongqing.A dust monitor (EDM 180, Grimm Aerosol) and an ambient particulate monitor (FH62C14, Thermo Scientific) were used to jointly measure the aerosol mass concentration. The FH62C14 instrument provided PM2.5 mass concentrations at 1-h intervals. The EDM 180 instrument measured aerosol number concentrations in 31 particle size channels, and mass concentrations including PM10, PM2.5 and PM1.0, with a temporal resolution of 6 s. The isothermal inlet was integrated with a nafion dryer, which was turned on at ambient RH above 55%. Several studies have reported the errors in the measurements of GRIMM EDM 180 (Ding et al., 2014; Xu, 2017). Thus, the GRIMM EDM 180 measurements were validated using FH62C14 measurements at a 1-h temporal resolution. A good correlation between PM2.5 mass concentrations from GRIMM EDM 180 and FH62C14 was found. Then, the GRIMM EDM 180 data were corrected using the regression fit function and reported at a temporal resolution of 10 min.
A polar nephelometer (Aurora-4000, Ecotech) was used to measure the aerosol scattering coefficients at seven angle ranges at the wavelengths of 635 nm, 525 nm, and 450 nm at relatively dry RH (~35%). Full scattering coefficients were corrected based on the measurements for the angle range 9°?170° using the method proposed by Müller et al. (2011). Black carbon (BC) mass concentration was measured by an aethalometer (model AE31, MAGEE) (Hansen et al., 1984; Collaud Coen et al., 2010) at seven wavelengths of 370, 470, 520, 590, 680, 880 and 950 nm. Loading effects were corrected and absorption coefficients were obtained following the method in Ran et al. (2016). However, data availability was only 35% due to instrument malfunction. Visibility was measured by a PWD20 instrument (Vaisala Co.) at an interval of 1 min. Ambient RH was observed by the sensor attached to the Grimm EDM 180 instrument.
The Grimm EDM 180 and FH62C14 instruments were calibrated before and after the campaign. The results showed that the instruments were stable throughout the campaign. Aurora-4000 was calibrated routinely and zero-checked every day for the correction of the zero point. All data were filtered according to measurement logs and data consistency between instruments. A flow chart of the steps involved in the method, which will be detailed in section 2.2, is presented in Fig. 1.
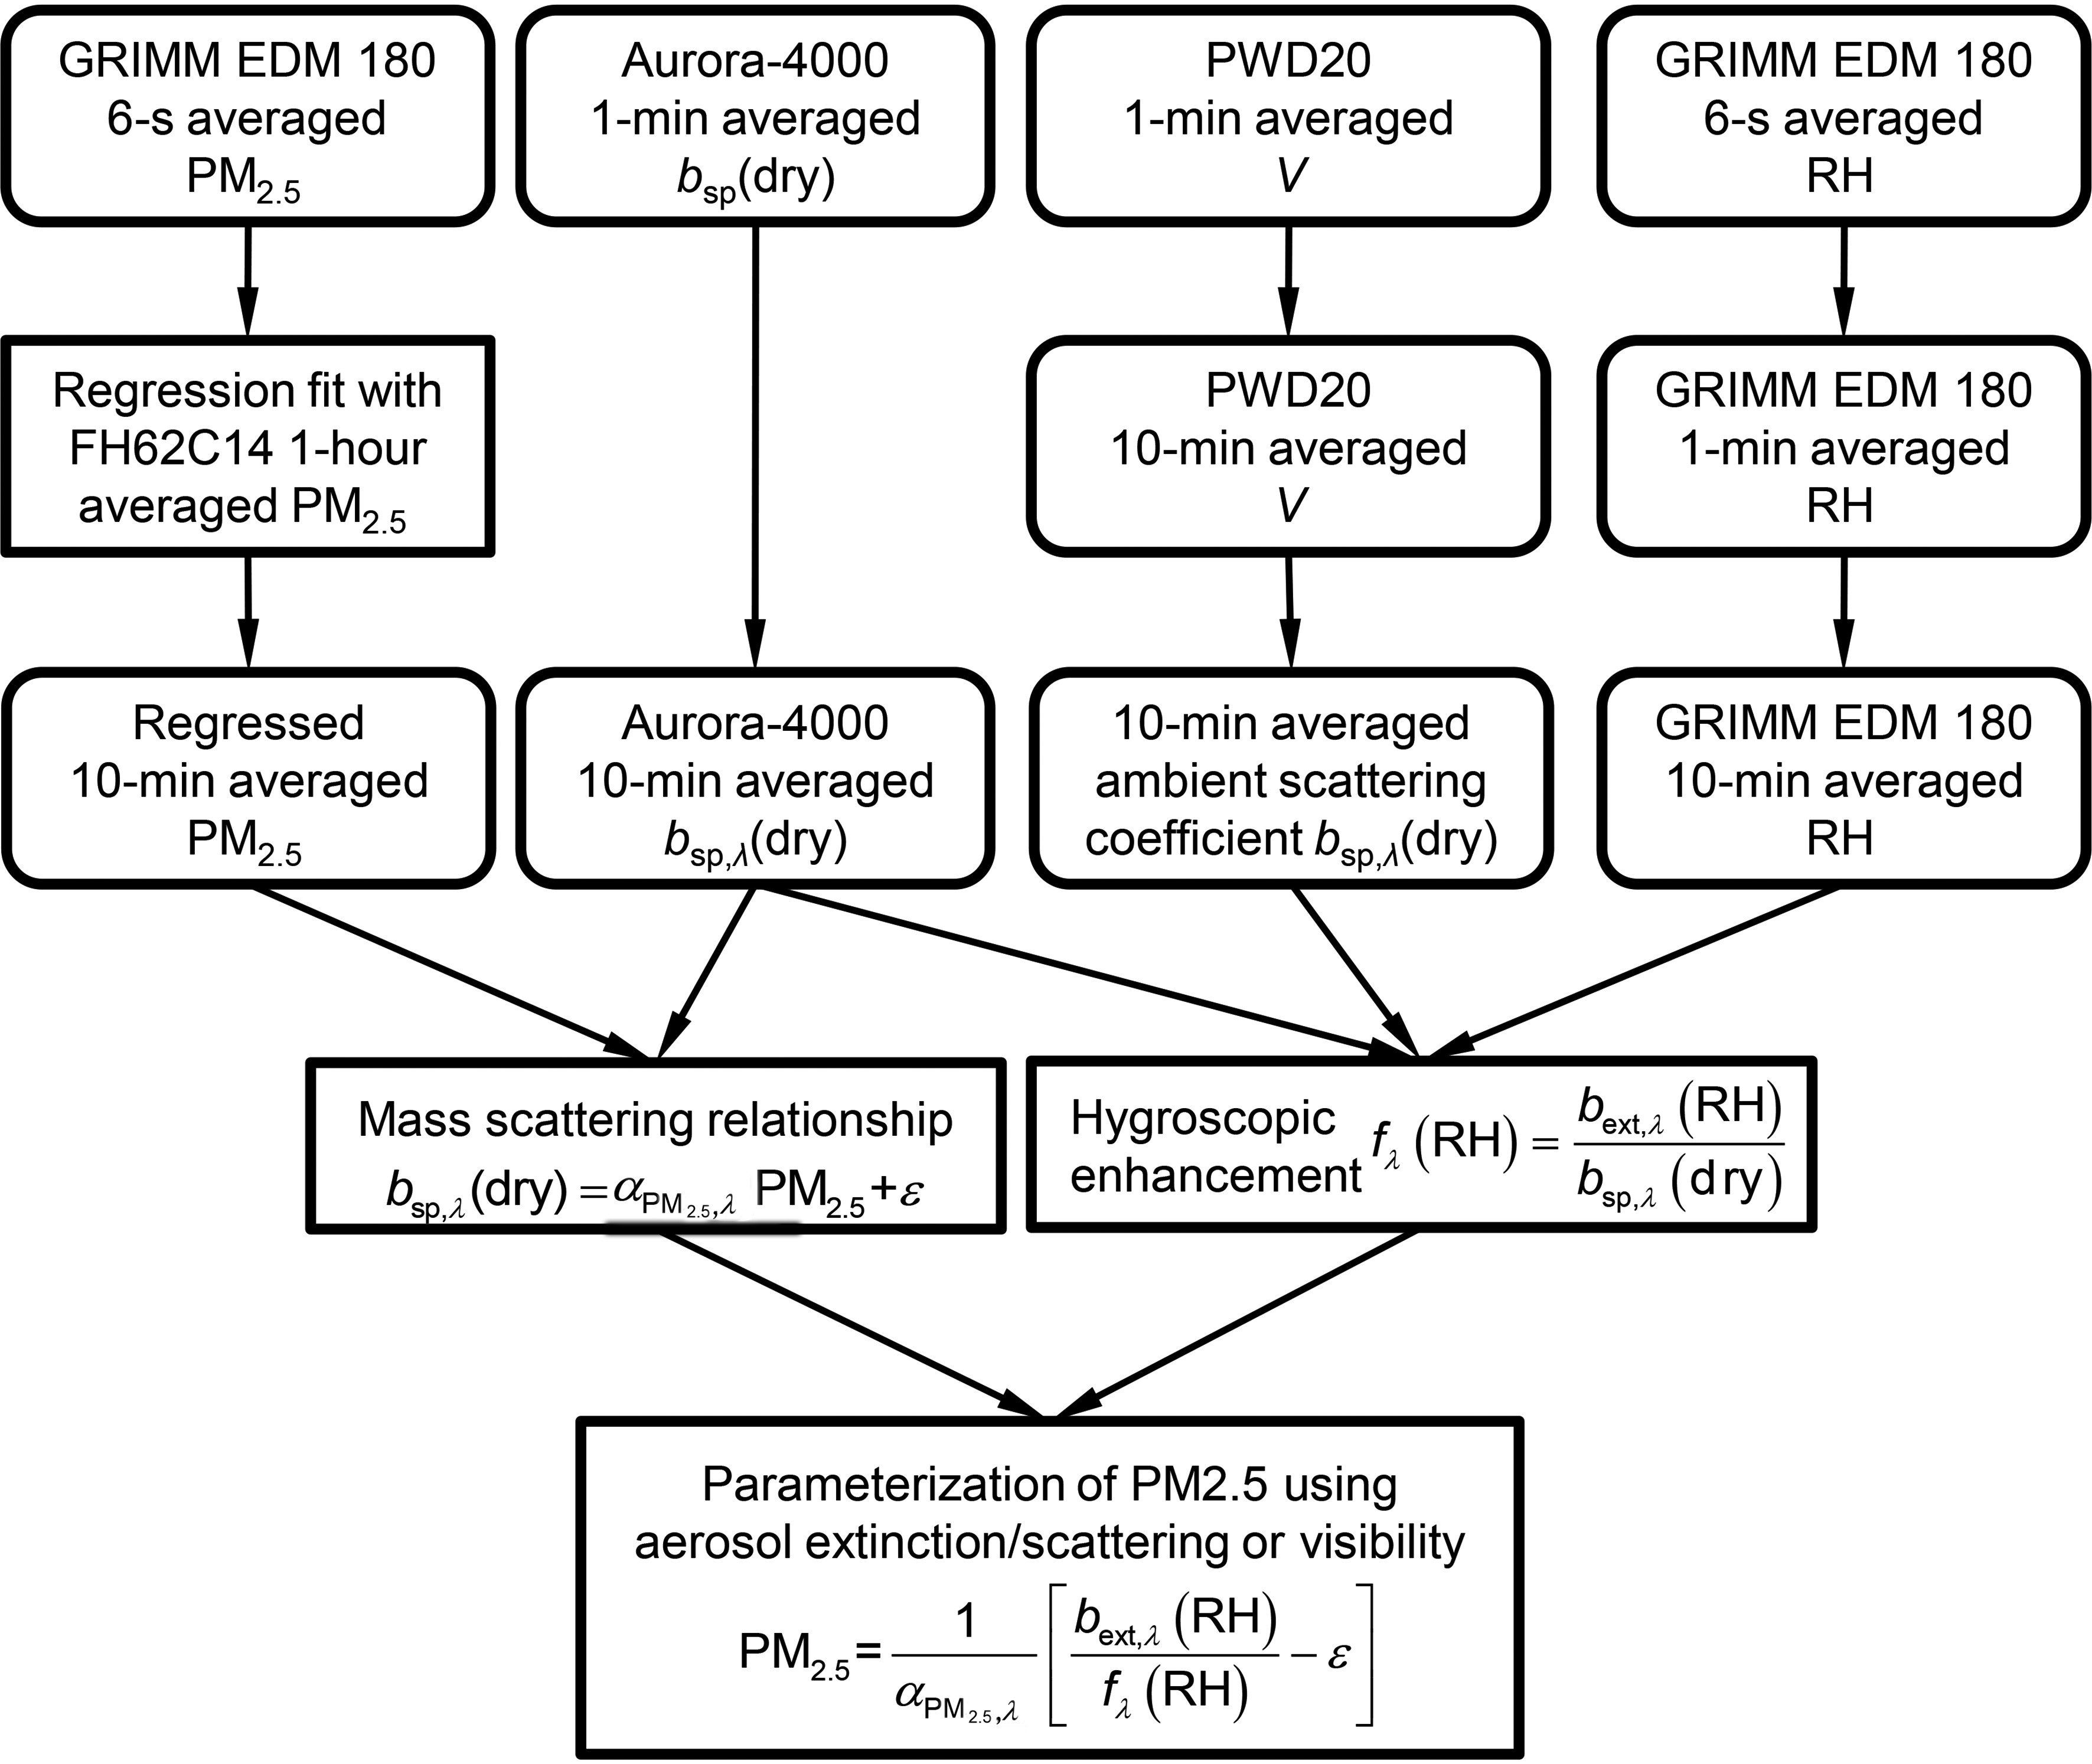 Figure1. Flow chart for data processing and parameterization.
2
2.2. Aerosol scattering hygroscopic growth algorithms
Aerosol scattering coefficient and complex refractive index are related to ambient RH. Measurements of total scattering coefficient and the simultaneous RH are used to indicate aerosol hygroscopic growth. Several studies have defined the hygroscopic enhancement factor for aerosol total scattering, f(RH), and aerosol back scattering, fb(RH), in different cases (Sun et al., 2016). The hygroscopic enhancement factor, which considers light extinction by scattering and absorption of both aerosol and gas, is defined as follows:where bsp,λ (RH) and bsp,λ (dry) are the aerosol scattering coefficient at wavelength λ in the ambient environment and under dry conditions; bext,λ (RH) is the ambient extinction coefficient; bap,λ is the aerosol absorption coefficient; bag,λ is the gas absorption coefficient; and bsg,λ is the gas scattering coefficient.
Since the gas extinction contribution to total light extinction is much less than that of particles in such polluted regions (Chan et al., 1999) and aerosol absorption is usually much smaller than aerosol scattering, Eq. (1) can be simplified to:
It is calculated from the measurements of ambient extinction coefficient, bext,λ(RH), at a certain RH and aerosol scattering coefficient, bsp,λ(dry), under dry conditions (RH < 40%). The bext,λ(RH) at a certain wavelength (λ) is calculated from visibility (V) by the following equation:
where the coefficient q is determined by experiments.
Two fit functions, the dual-parameter fit equation (H?nel, 1976, 1980; Carrico, 2003; Zieger et al., 2011; Liu et al., 2019) and single-parameter equation (H?nel, 1980; Kotchenruther and Hobbs, 1998; Gassó et al., 2000; Liu et al., 2019), were used to establish the relationship between fλ(RH) and RH. Aerosols that are metastable or on the upper branch of the hygroscopic growth hysteresis curve typically follow the dual-parameter power lower fit equation described by Kasten (1969):
where


During the observational period, RH was frequently above 60%, with few records at low RH. Curve fitting will be misleading under such a condition. Thus, f(RH) under dry conditions, which is the ratio of dry extinction and scattering from the aethalometer and nephelometer, was added for the curve fitting.
3.1. Overview of the experiment
Figure 2 shows the time series of PM2.5 mass concentration, visibility, and RH during the experiment. It can be clearly seen that there were two episodes according to PM2.5 mass concentrations, i.e., one from 4?9 January with a continuous increase from 75 μg m?3 to 200 μg m?3, and the other from 10?16 January with an increase from 25 μg m?3 to 150 μg m?3. A linear correlation between PM2.5 mass concentration and dry aerosol scattering coefficient was found, with a correlation coefficient of about 0.98 (Fig. 3). However, there was no obvious decrease in visibility along with the increase in PM2.5 mass concentration during either of the two episodes, as is often expected. No correlation between the mass concentration of PM2.5 and visibility was found, with the correlation coefficient found to be 0.21. During the whole campaign, visibility ranged from 2 km to 15 km, with 86.4% lower than 10 km. It was notable that RH was higher than 70% at most of the time, and even up to 85%?100% during 53% of the whole time. Aerosol hygroscopic growth in such a highly humid environment may greatly influence the scattering properties of aerosol and thereby visibility.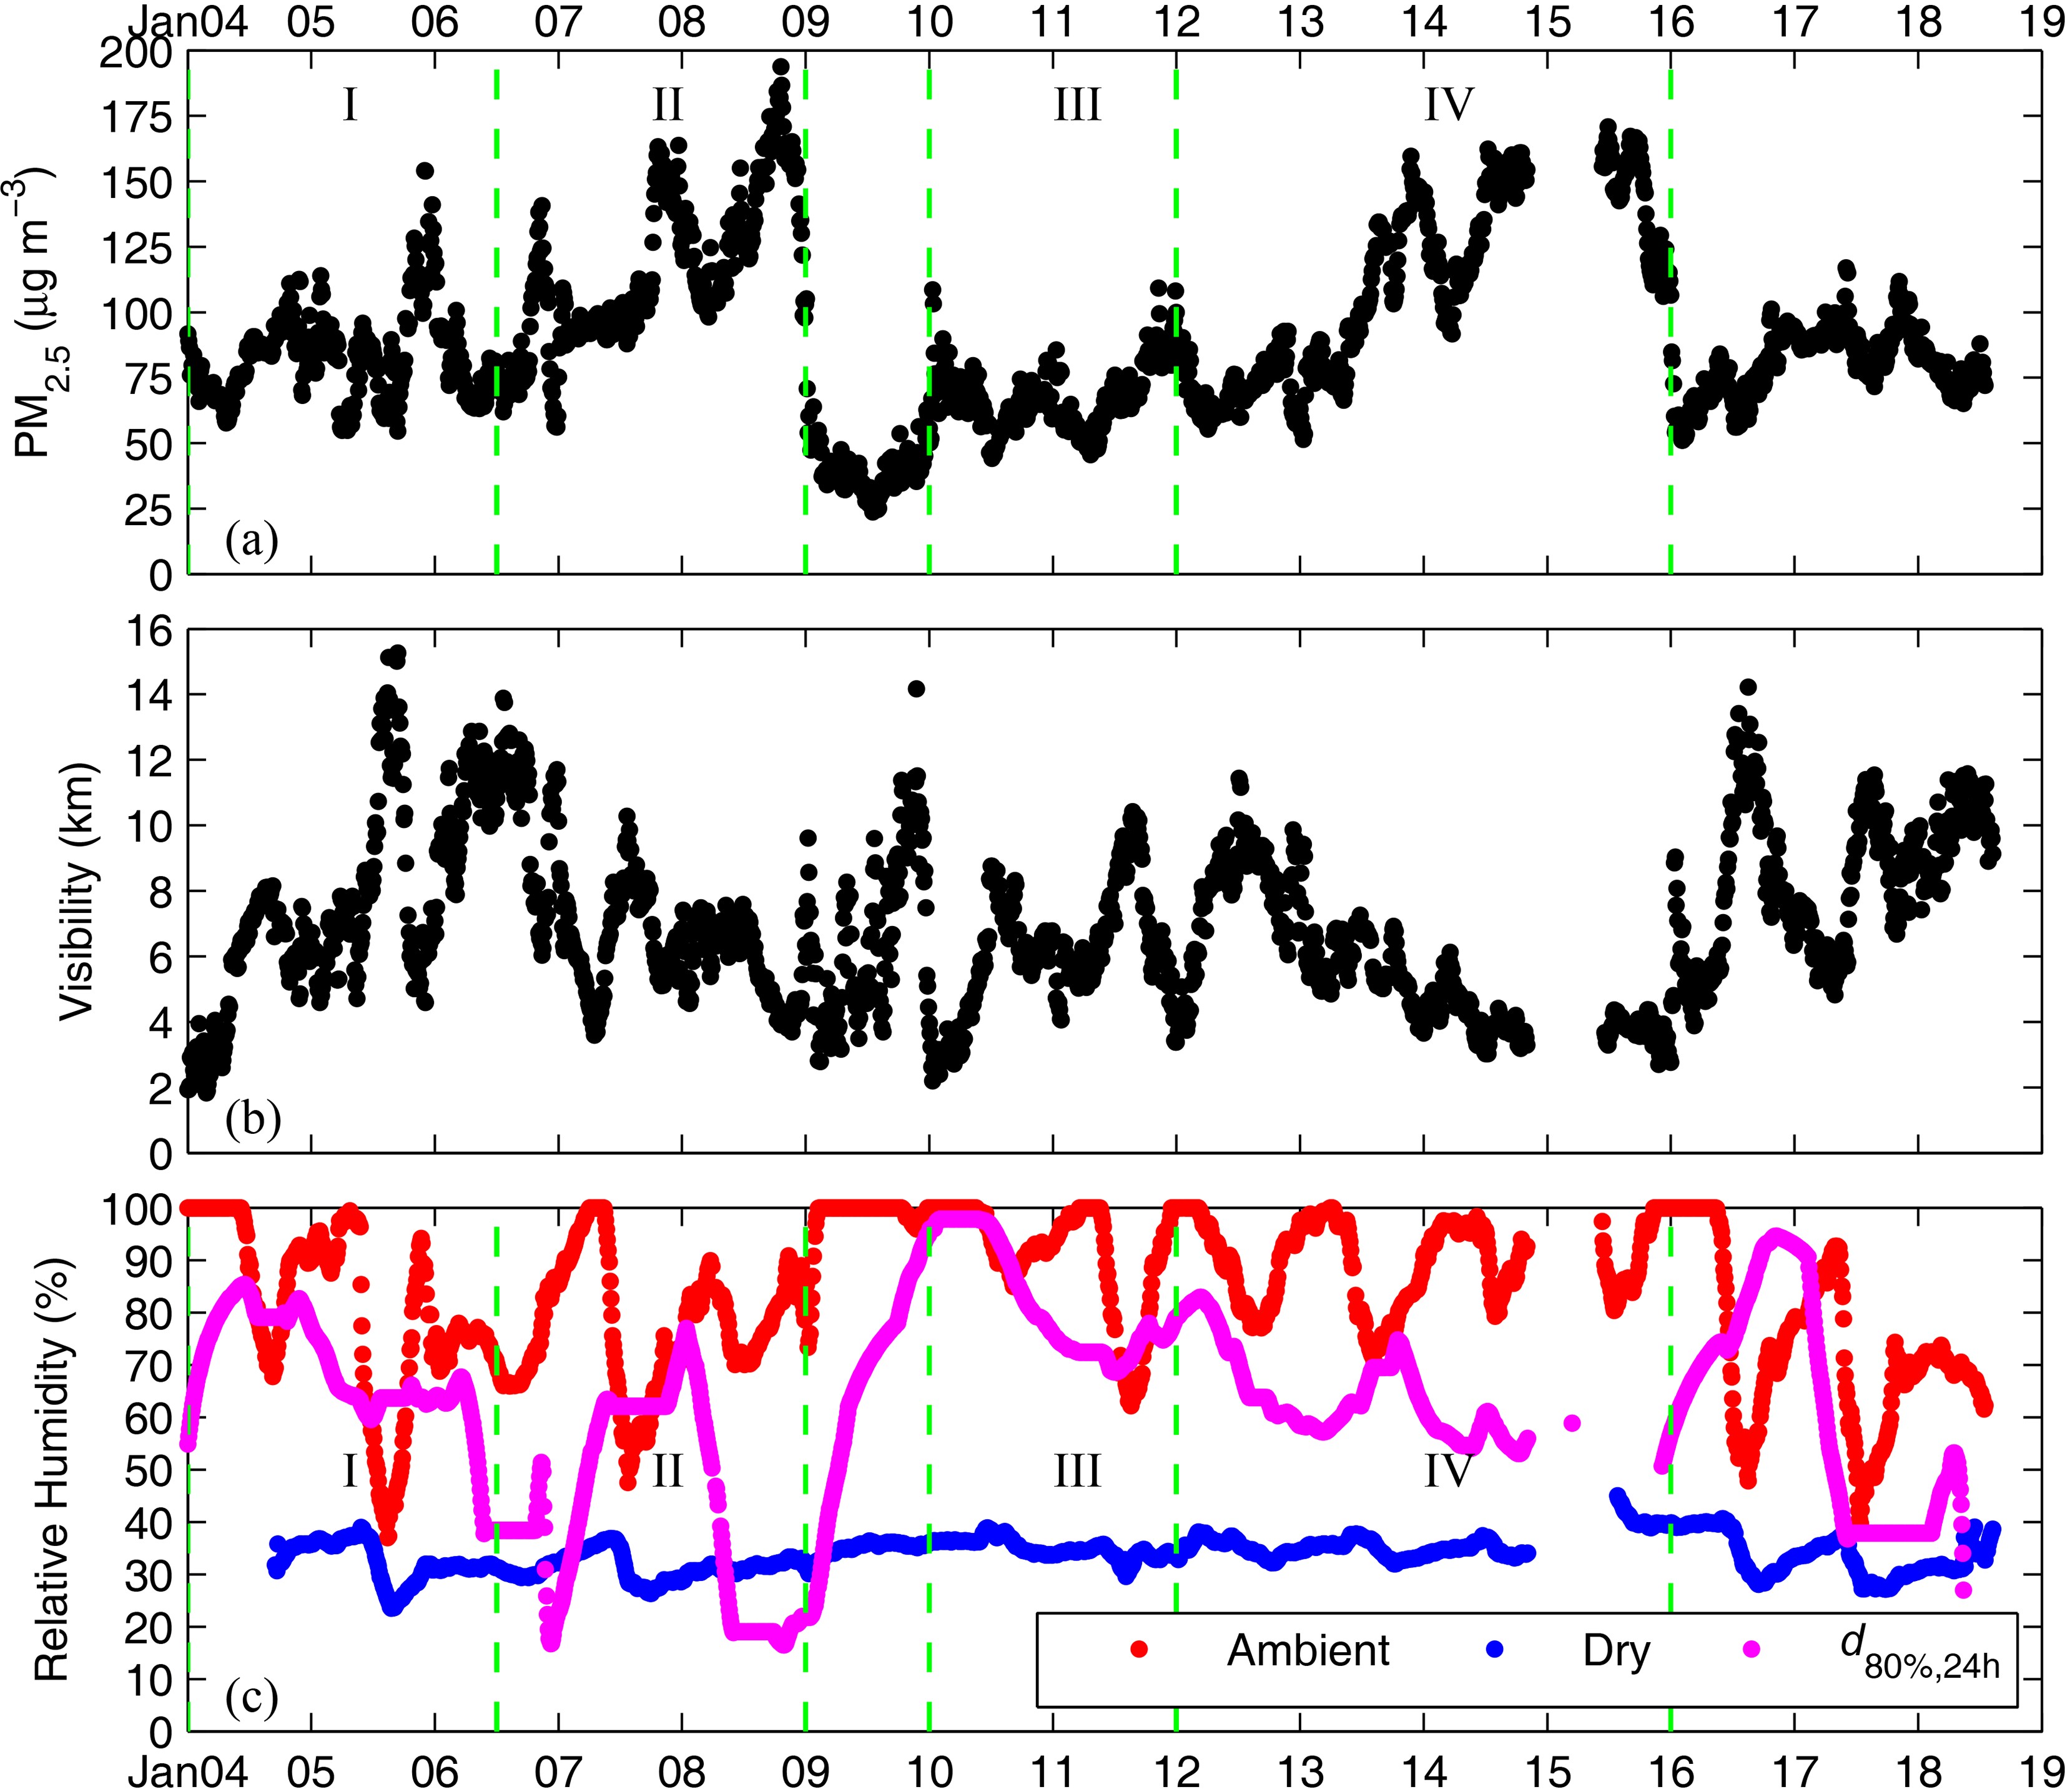 Figure2. Observation of PM2.5, visibility, RH and
 Figure3. Linear relationship between PM2.5 mass concentration and scattering coefficient at three wavelengths.
2
3.2. Aerosol hygroscopic growth under different RH conditions
The effect of water vapor on aerosol scattering was examined, in order to explain the difference in the variations of PM2.5 mass concentrations and visibility. A new empirical relationship between RH and f550nm(RH), the ratio of ambient extinction coefficient to aerosol dry scattering coefficient, was built to characterize the aerosol hygroscopicity. Considering the large variation in RH and the duration of high RH during the experiment, the observational period was classified into different periods according to the ambient RH condition.A distinct diurnal cycle of RH can be seen in Fig. 2. To analyze the high RH condition and its impact on aerosol hygroscopic growth, a new parameter,

where


Each of the two pollution episodes could be further divided into two periods (Fig. 2c). It was noted that


 Figure4. f(RH) in four periods and the fitted function.
Pan et al. (2009) reported f525nm (80%) values of 1.20, 1.31 and 1.57 during dust, clean and pollution episodes over a rural area near the megacity of Beijing. Zhao et al. (2019) performed a survey of fλ(RH) studies in China for the past seven years. In winter, the f550nm (80%) of Gucheng, f525nm (80%) of Beijing and f525nm (80%) of Guangzhou was 1.29 ± 0.10, 1.47 ± 0.16, and 1.58 ± 0.07, respectively. In this study, the f550nm (80%) for the above mentioned four segments ranged from 1.28?1.46, which was a similar range to other studies.
2
3.3. Relationship between PM2.5 mass concentration and visibility
The relationship between PM2.5 mass concentration and visibility is subject to the RH conditions owing to the hygroscopic growth of aerosols. The establishment of an empirical relationship between PM2.5 mass concentration and visibility under different RH conditions would be useful for estimating PM2.5 mass concentrations based on visibility—a widely measured parameter.In the IMPROVE algorithm, the computed aerosol light extinction coefficients include contributions from PM2.5 species such as ammonium sulfate, ammonium nitrate, organic matter, elemental carbon, fine soil, coarse mass, and Rayleigh scattering, as well as the hygroscopic enhancement factor fλ(RH) (Ryan et al., 2005). The equation requires knowledge of mass concentrations of different components, which are not always available or only measured at low temporal resolution. Since the light extinction at the observational site is mainly contributed by PM2.5, we can simply calculate the extinction coefficient at ambient RH using the following equation:
where the contribution of PM2.5 mass concentration is considered using a mass scattering efficiency,

From the combination of Eqs. (2) and (5), the relationship between PM2.5 mass concentration and measured visibility under a given RH can be obtained as Eq. (7):
Figure 5 compares the measured and regressed PM2.5 mass concentrations in two ways—one using fλ(RH) in four periods, and the other using the average fλ(RH) during the whole observational period, 1.030 / (1 ? RH)0.183. The results show that simulated PM2.5 mass concentrations from both methods coincide well with the measurements. The slopes of the two methods are 0.93 and 0.94 respectively, and the intercepts are 6.6 and 8. The correlation coefficient of the first method is 0.89, which is better than the second one at 0.81.
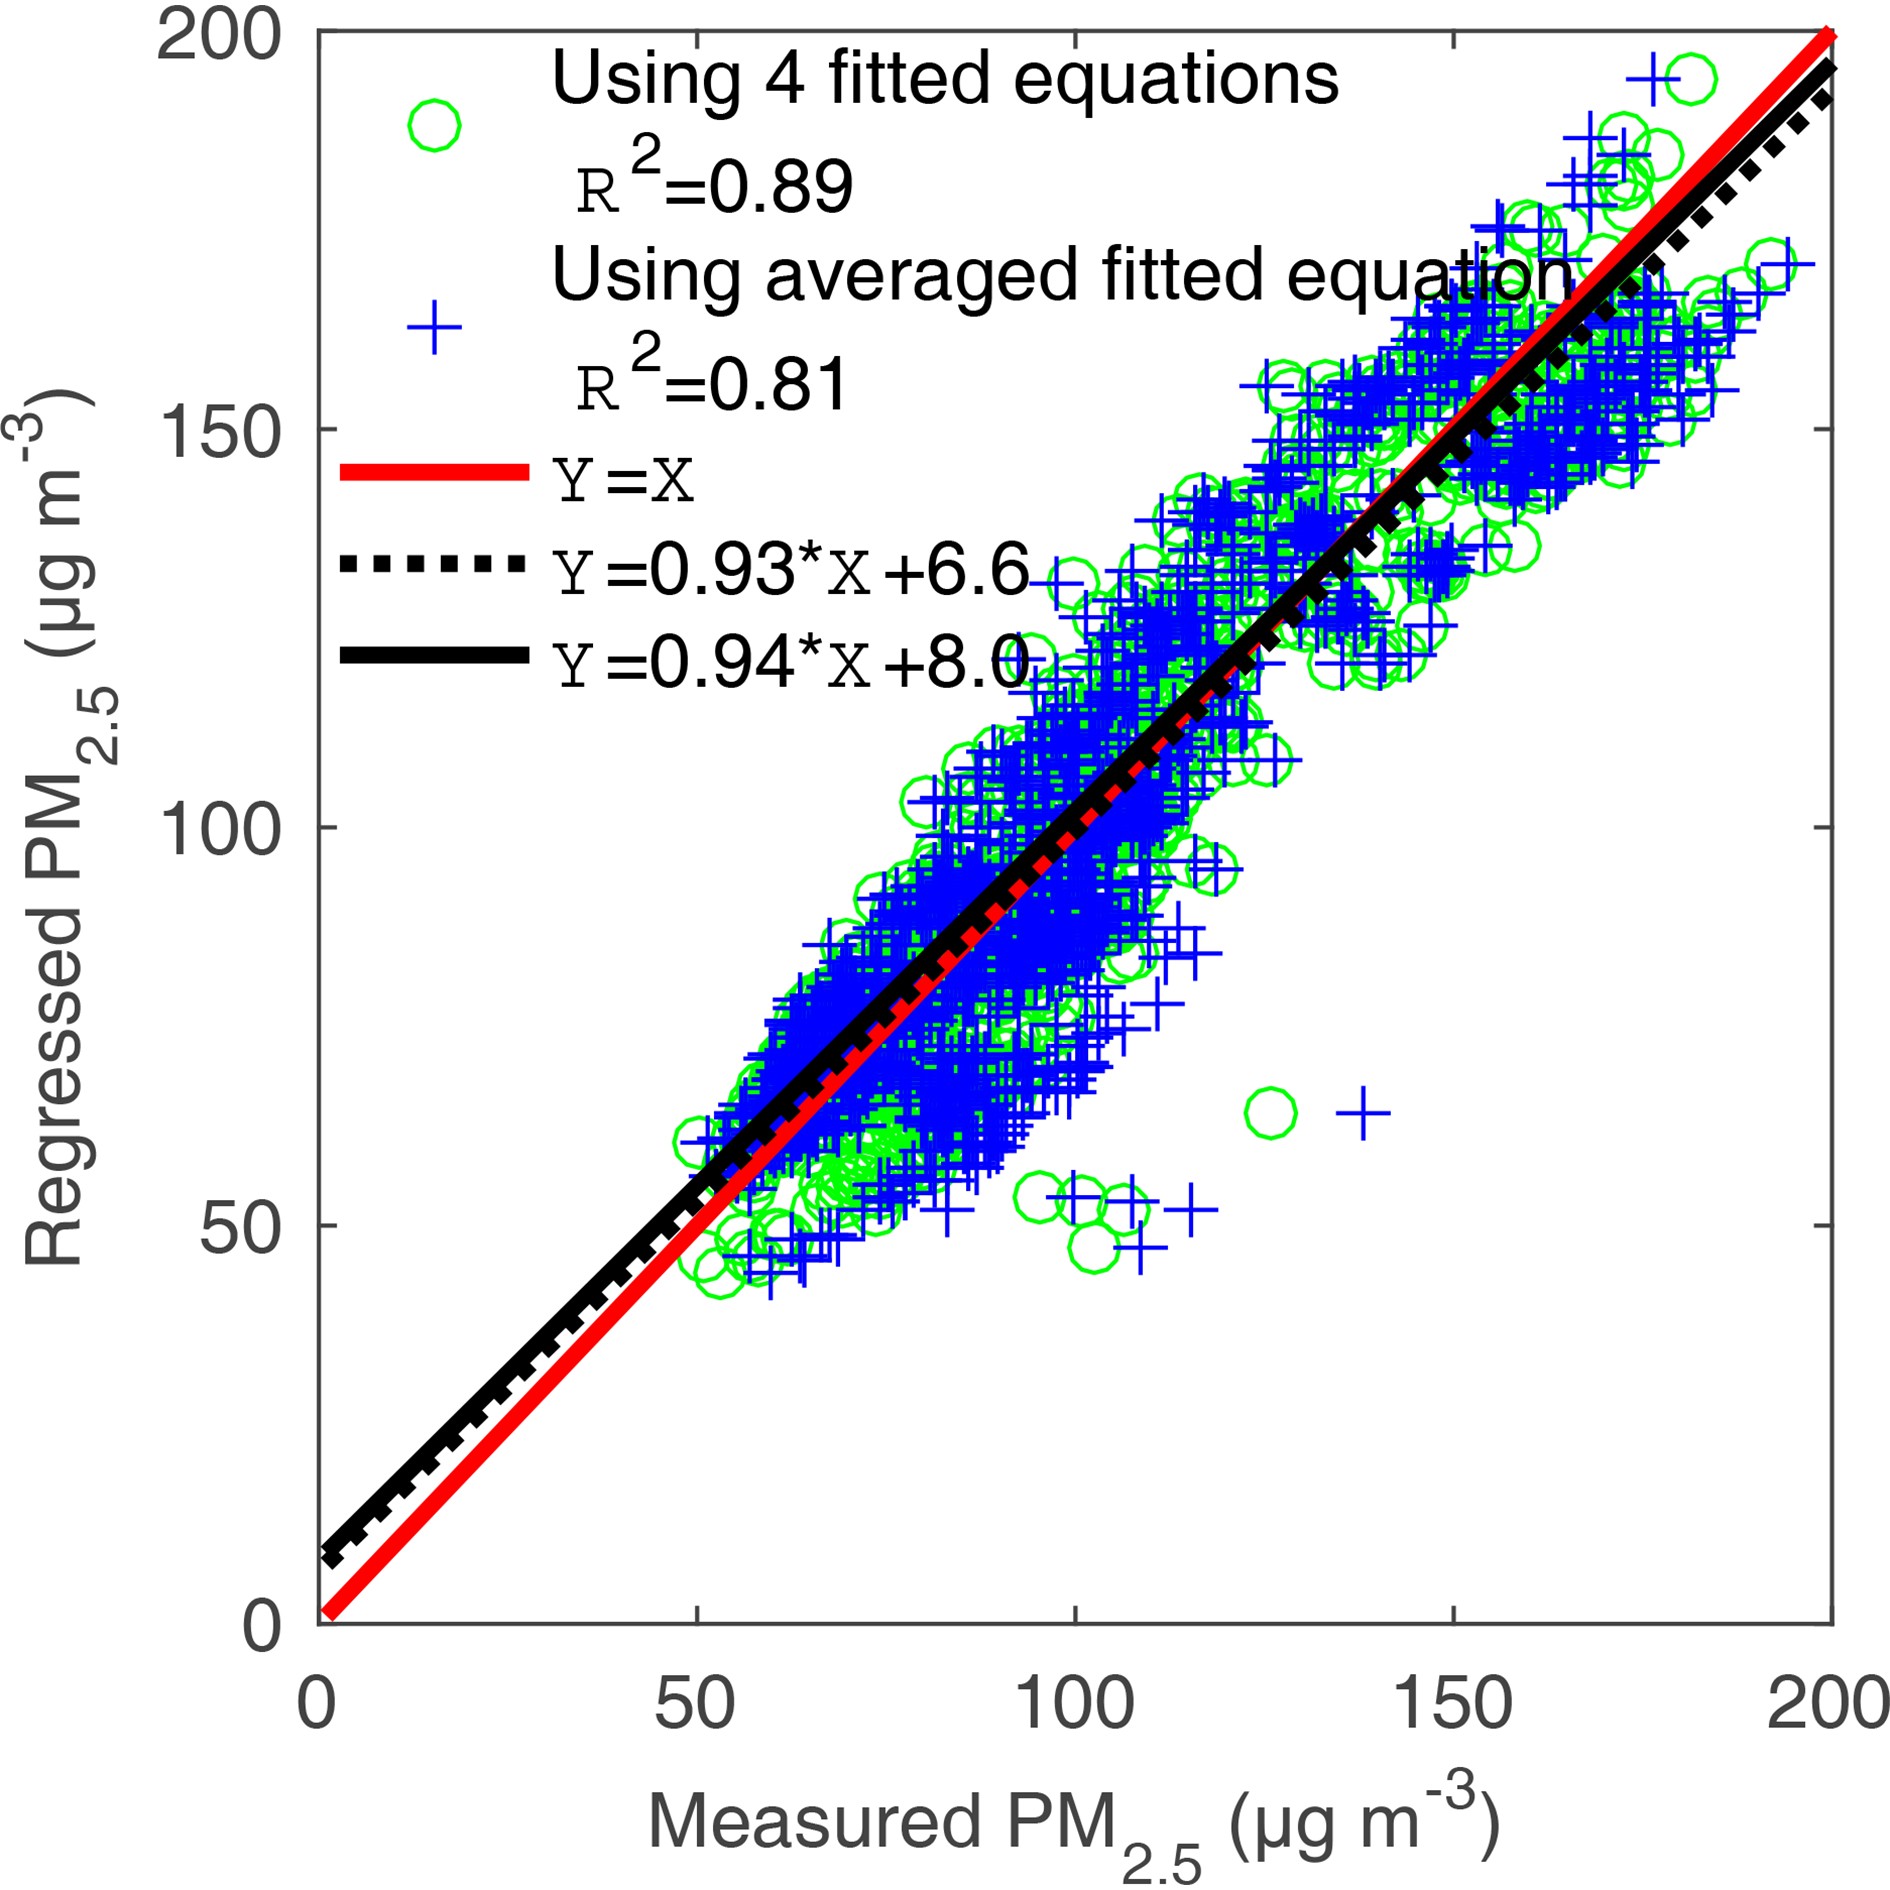 Figure5. Comparison between measured PM2.5 mass concentration and regressed PM2.5 mass concentration via two methods (black solid line—using four fitted equations; black dotted line—using averaged fitted equation).
Two pollution episodes were encountered during the campaign. For each episode, a good linear relationship of PM2.5 mass concentration and dry aerosol scattering coefficient was found. However, the linear correlation between PM2.5 mass concentration and visibility is only about 0.21, which indicates that ambient RH has an important effect on visibility. Each episode was further divided into two periods—the first one with high aerosol hygroscopicity and high RH, and the second one with a relatively dry but more polluted condition and low aerosol hygroscopicity.
Based on the established empirical relationship between the hygroscopic enhancement factor, fλ(RH), the ratio of ambient aerosol extinction coefficient to dry aerosol scattering coefficient, and RH, a simplified method for predicting the PM2.5 mass concentrations from measurements of visibility and RH was developed and verified. This method is applicable for other regions to generate their own empirical relationships using related data. Although nephelometers are not so densely equipped as instruments for visibility or PM2.5 mass concentration measurements, available observations at representative stations could be used to generate parameters in different regions and under different conditions for the proposed parameterization scheme. PM2.5 mass concentration could also be estimated using the AOD from satellite or sunphotometer measurements, except that the vertical distribution of aerosol properties and RH has to be taken into consideration. Profiles of PM2.5 mass concentration could also be obtained based on a similar method. Therefore, this method would be useful for the remote sensing of PM2.5 mass concentrations.
Acknowledgements. This research was supported by a National Science and Technology Major Project (Grant No. 2016YFC0200403) and the National Natural Science Foundation of China (Grant Nos. 41675037 and 41675038).
Open Access This article is distributed under the terms of the Creative Commons Attribution 4.0 International License (http://creativecommons.org/licenses/by/4.0/), which permits unrestricted use, distribution, and reproduction in any medium, provided you give appropriate credit to the original author(s) and the source, provide a link to the Creative Commons license, and indicate if changes were made.
