HTML
--> --> -->Despite the notable prediction skills of current numerical weather prediction (NWP) models, forecasting low-visibility fog is still challenging (Yang et al. (2010). Specifically, there are three main obstacles: (1) the complexity of fog formation and evolution processes in the boundary layer, including the microphysics, turbulent exchange, radiation, and surface processes (Duynkerke, 1991; Guedalia and Bergot, 1994); (2) the low vertical resolution of data observation networks, which are unable to provide sufficient moisture and temperature profiles for model verification; and (3) the restrictions associated with using satellite images for studying fog because fog always occurs with high-level cloud formation. In spite of these challenges, NWP is still a useful tool for examining and predicting the formation and evolution of fog. Gultepe et al. (2007) summarized the available fog forecasting models. From their analysis, it is clear that most models have a focus on fog physics, and less so on coastal fog. Numerous cases have been used to evaluate model capability in fog prediction (Fu et al., 2006; Yang et al., 2006). Zhou and Du (2010) showed that the fog-forecast accuracy of numerical models with a lead time of 12 to 36 hours can be improved by applying different model output post-processing schemes. However, given the complexity of fog process, there has not been much progress in terms of operational forecasting. Thus, NWP centers still do not directly provide fog predictions in their model calculations. Instead, fog forecasting is more based on local forecasters’ experience, statistical methods (Koziara et al., 1983), or indirect model output variables (Baker et al., 2002). As indicated by Zhou and Du (2010), the major drawbacks to statistical forecasts are that the models used at NWP centers are frequently upgraded or changed, affecting the performances and validity of statistical approaches, which need sufficiently long periods of historical forecast data for training. At the same time, fog prediction based on indirect model output variables strongly depend on forecasters’ experience, and thus remains a challenging forecasting problem.
Dense fog days are weather extremes like heavy rainfall, tornados, or hailstorms. It is recommended to study extreme weather events via anomaly-based weather analysis (Qian, 2015), of which the advantages have already been demonstrated in research on heavy rainfall (Jiang et al., 2016; Qian et al., 2016a), heat waves (Chen et al., 2017), cold surges (Qian et al., 2016b), severe haze (Qian and Huang, 2019), and tornados/hailstorms (Qian et al., 2017). In the present work, we examine whether the anomaly-based weather analysis method can also be applied to fog episodes with visibility less than 1 km for more than 24 hours. Cases that occurred during 2015?16 at Ningbo-Zhoushan Port in the ECS are investigated. Following this introduction, section 2 describes the datasets and methods. Section 3 examines some climatological features of visibility at Ningbo-Zhoushan Port. Section 4 analyses the anomalous weather chart signals of a dense coastal fog case. Section 5 verifies the findings in section 4 with more coastal fog cases and statistical analysis. And finally, conclusions and some discussion are provided in section 6.
2.1. Datasets
Four datasets were used in this study. The first was the global atmospheric reanalysis from the European Centre for Medium-Range Weather Forecasts (ECMWF), named ERA-Interim (Dee et al., 2011; http://apps.ecmwf.int/datasets/data/interim-full-daily/levtype=sfc/). The ERA-Interim data provide reanalyzed tropospheric geopotential height (GPH), air temperature, horizontal wind, and specific humidity data with a horizontal resolution of 0.75° × 0.75° at 37 vertical pressure levels. The ERA-Interim data was used to examine whether the anomaly-based weather analysis method can be applied to obtain anomalous signals indicating coastal fog episodes of low visibility in the Ningbo-Zhoushan Port area.The second dataset used was the product of the ensemble prediction systems (EPSs) at ECMWF, obtained from “The International Grand Global Ensemble” project (TIGGE; http://apps.ecmwf.int/datasets/data/tigge/levtype=pl/type=cf/). The EPS data provide 15-day (360-h) forecasts of GPH at nine vertical levels from 1000 to 50 hPa and temperatures at eight levels from 1000 to 200 hPa, based on 51 ensemble members. The EPS data was used to explore whether the medium-range numerical products can be applied to provide more accurate prediction of conditions favorable for the formation of coastal fog based on the case analysis.
The third dataset was the observed hourly minimum visibility, hourly precipitation and temperature during 2015?16 from 20 automatic observational sites in the Ningbo-Zhoushan Port area. The hourly minimum visibility ranges from 100 m to 60 000 m with 1-m intervals. The maximum values of hourly minimum visibility at different sites vary during device calibration, and thus data points with visibility higher than 20 000 m were all treated as 20 000 m in this study. The hourly PM2.5 (fine-scale particulate matter) concentration series for the two years at the sites of Beilungang and Daxie, near the port, were also used, to identify whether low visibility is influenced by severe haze.
The fourth dataset was the observed number of fog days during 2001?17 from seven national observational stations.
2
2.2. Methods
The anomaly-based weather analysis approach [Eq. (1)], which separates the temporal climatological component


where t represents time (24 hours a day) on a calendar date d in a year y, while


Daily extreme weather events, such as heavy rainfall or severe-weather storms, are seen as products of anomalous synoptic-scale systems related to temporal climatology. The temporal climatology of a certain location and a certain time is considered as a state under the thermodynamic equilibrium of the earth?atmosphere system, which is only forced by the solar radiation (solar declination) and surface conditions rather than daily weather disturbances. The temporal climatology is estimated by averaging the reanalysis data at time t on calendar date d over M years:
where y runs for Y years (Y > 30 years). It is assumed that the positive and negative anomalies of meteorological variables at a specific grid point and a given calendar time cancel each other out during the Y years. The climatic state (or temporal climatology) defined by Eq. (2) contains the diurnal cycle since it varies temporally from hour to hour. In previous works (Qian et al., 2014; Jiang et al., 2016; Qian et al., 2016a), y runs from 1981 to 2010 for Y = 30 years. The global temporal climatology is obtained from the six-hourly ERA-Interim data.
Other methods used were the correlation calculated from two long-term time series and the threat score (TS) to verify the skill of different atmospheric variables indicating low visibility. The TS,
was proposed by Palmer and Allen (1949) and has been widely used in the prediction of weather extremes. The TS takes missing (M) and false alarm (FA) instances into account, besides the overlapping or hitting area (H).
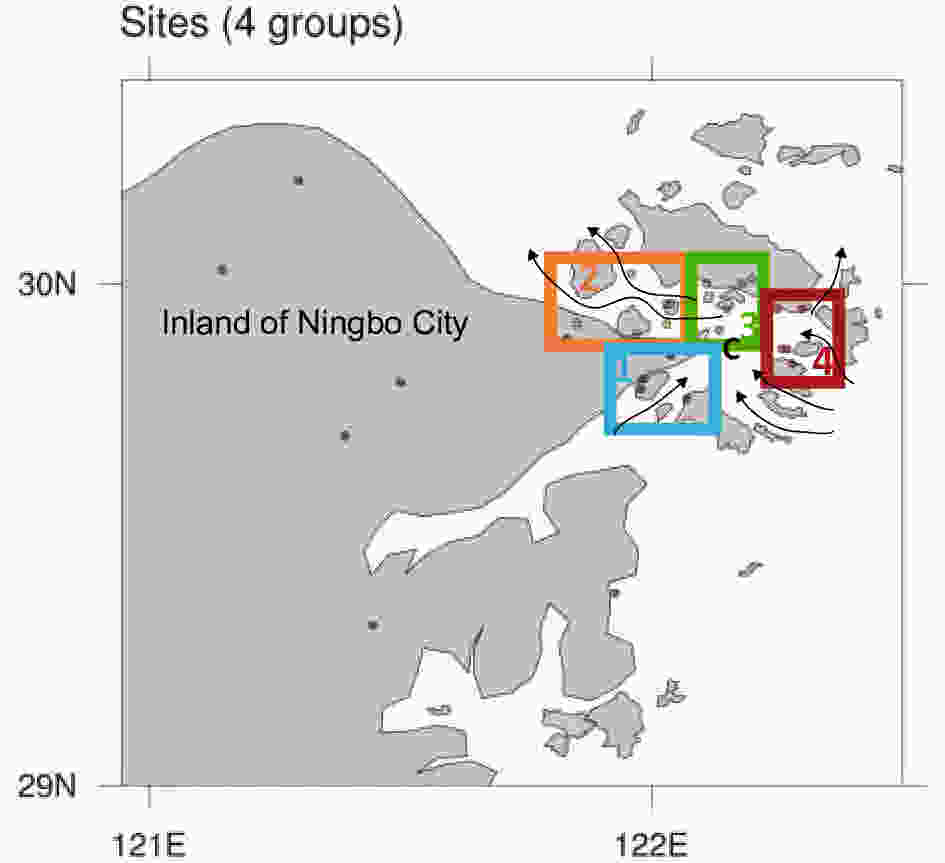 Figure1. Twenty automatic observation sites (colored dots) in the Ningbo-Zhoushan Port area classified into four groups (regions). Letter C is the central location of the port at 29°52′00″N and 122°10′10″E. Arrowed lines indicate shipping lanes. The site at Beilungang is marked by a star in region 2. The other seven black dots indicate national observational stations.
The main extreme weather phenomena influencing ship safety in the port include strong winds, convective storms, rainfall, tornados, and dense fog. Among them, the frequency of coastal fog is the highest. To quantitatively measure different meteorological conditions, 20 automatic observation sites located within the port area have been constructed since 2006, besides seven national observational stations in the land area of Ningbo City (Fig. 1). The statistical result based on these seven stations and those near the port shows that the annual fog frequency was 12.8 days during 2001?17. During that period, two weather phenomena (rain-fog- and pure-fog-type weather) occurred in Ningbo City without haze and snow. The ratio of rain-fog was 66.3%, while that of pure-fog was 33.7%. The annual fog frequencies were different inland and in the seashore area. Before 2008, the annual fog frequency at Xiaogang Harbor, near the sea, was 31 days, but its annual frequency reduced by five days during 2008?18 when the observation site was moved 6.5 km inland. This indicates that surface environmental conditions are critical to the annual fog frequency. The statistical result from three years (2015?17) reconfirms the regional difference. Total rain-fog days were 56 and total pure-fog days were 39 at Beilunguang in the port area, while the rain-fog days and pure-fog days averaged from the seven national observational stations inland was 32.7 and 12.4, respectively. Overall, the number of fog days in the port area is roughly twice that inland.
The monthly fog frequency at Beilungang during 2015?17 shows that a high frequency of fog days occurred in spring (March?April?May?June), with the highest frequency in April (7.7 days), and then there was another peak in October (2.3 days) (Fig. 2a). A similar seasonal variation of fog frequency was reported by Xu et al. (2002) using 10 years of data from three national stations on the Zhoushan Islands from 1990?99. During 2015?17, the seven national observation stations show that two peaks of high-frequency fog days occurred, in November (2.5 days) and April (2 days) respectively, as indicated by the green dashed line in Fig. 2a. During a longer period from 2001?17, the seven national observation stations show that winter (November?December?January?February) had a high frequency of fog days for about 2 days, as indicated by the black dot-dashed line in Fig. 2a. There were fewer fog days in the summer season (July?August?September). The difference in fog frequencies between the port and land areas and the interannual variability of fog days were rather large. In 2016, 40 fog days were observed at Beilungang, but only 15 fog days were recorded by the average of the seven national stations.
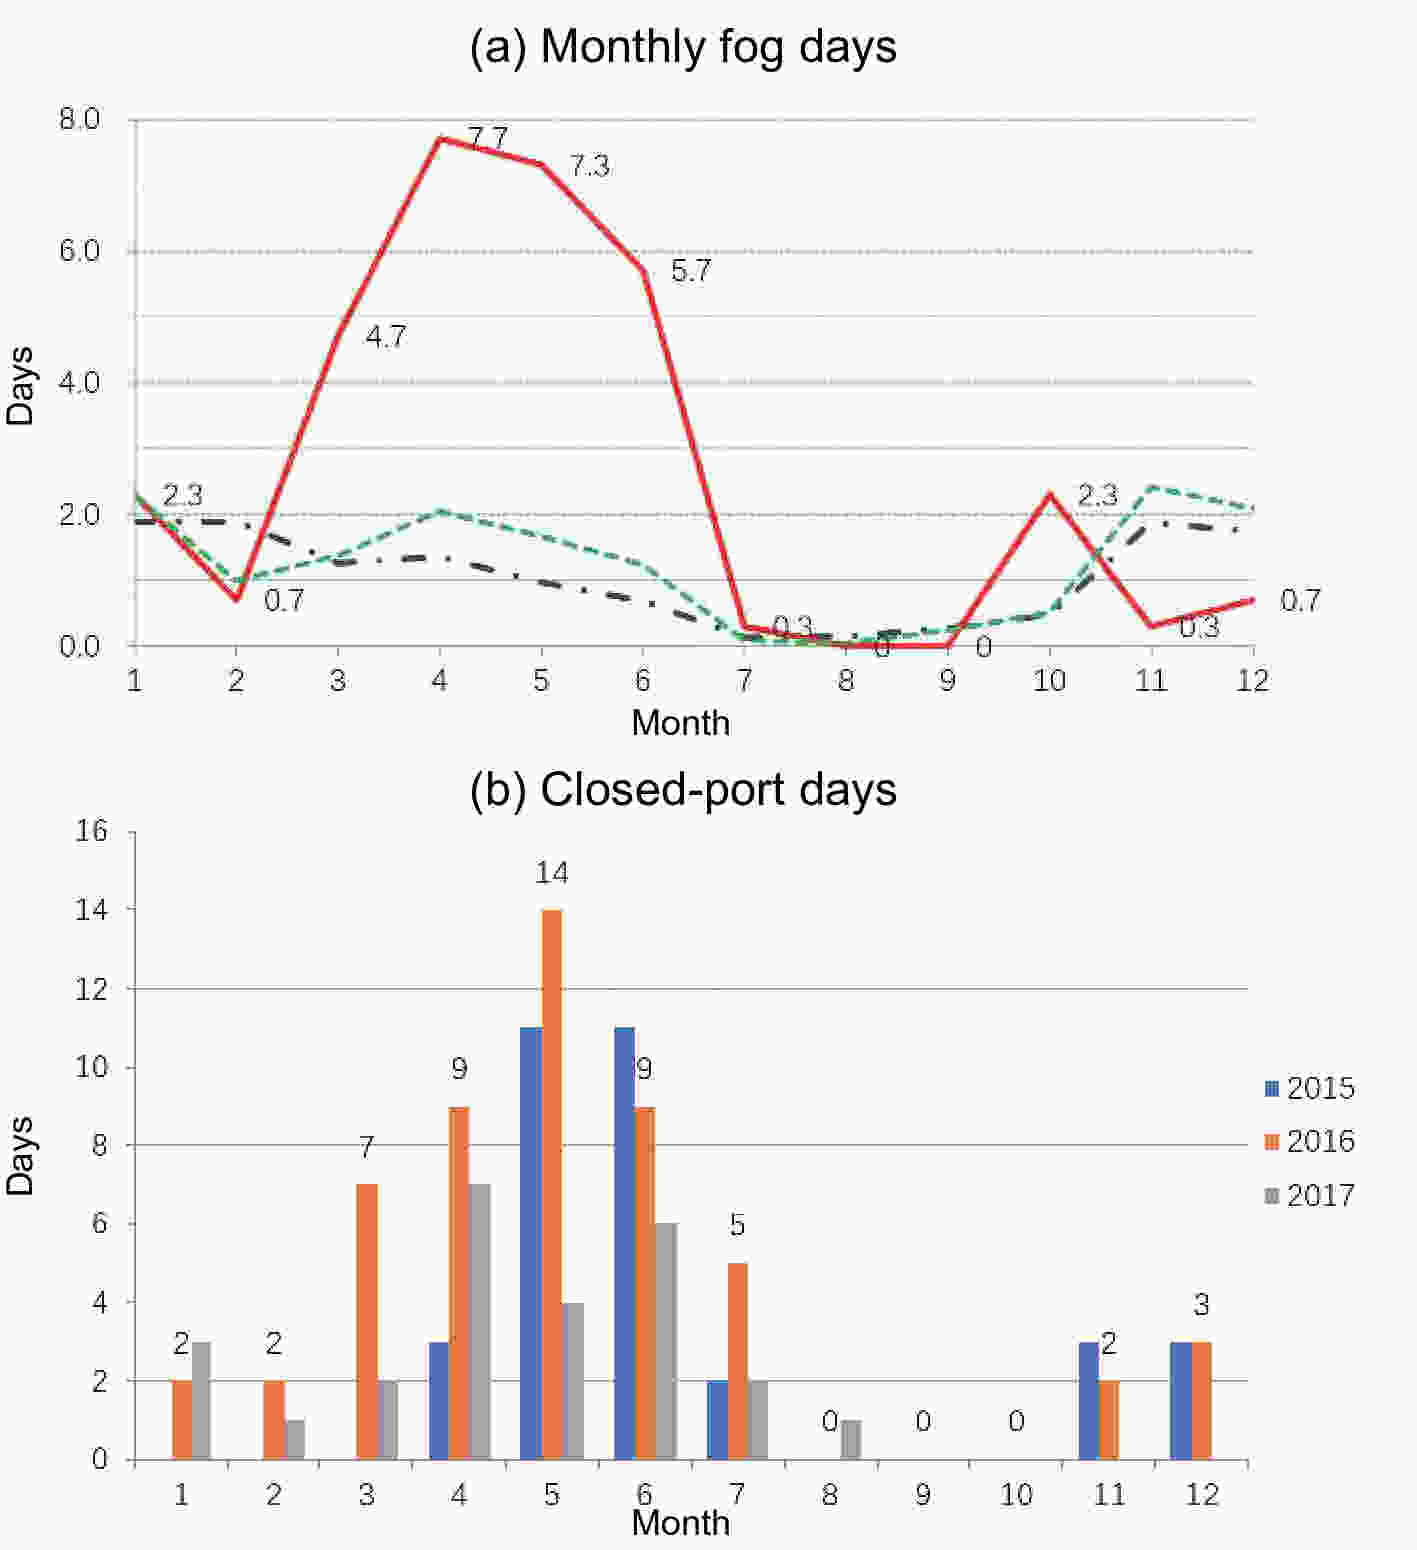 Figure2. (a) Monthly fog days based on observations at Beilungang from 2015?17 (red line), seven national stations from 2015?17 (green dashed line), and seven national stations from 2001?17 (black dot-dashed line). (b) Closed-port days in 2015 (blue bar), 2016 (orange bar) and 2017 (gray bar).
The port is closed when fog becomes dense. The number of closed-port days was 33, 53 and 23 in 2015, 2016 and 2017, respectively (Fig. 2b). A major peak of closed-port days occurred in May 2016 (14 days), and then there was a second peak in December 2016 (3 days). In 2015, the number of closed-port days was 11 in both May and June. The closed-port frequency was relatively high from March to July, which was similar to the frequency of fog days at Beilungang during the three years.
In order to measure the coastal fog at the port, 20 automatic observational sites are plotted and divided into four regions in Fig. 1a. There are four, six, five and five automatic observation sites in regions 1?4, respectively. Theoretically, the climatology of visibility at the port should be obtained from data of 30 years or more. However, owing to the availability of fog observations, the climatological features of visibility were examined based on two years (2015?16) of observations only at the port. The climatology of hourly-mean visibility at each region of the port was based on 62 samples (2 years by 31 days) in January. Figure 3a shows the hourly-mean climatology of January visibility of all four regions. There is a significant feature in that the first and second peaks of the diurnal cycle of visibility occur respectively at 0800?0900 UTC [1600?1700 LST (local standard time), LST = UTC + 8 h] and 1800?1900 UTC (0200?0300 LST). Also, there are two lower points of climatic visibility, in the morning at 2300?0000 UTC (0700?0800 LST) and in the middle of the night at 1500?1600 UTC (2300?0000 LST). Using four national observation stations for 1962?2015 and automatic observation sites for 2014?15, Chen et al. (2018) also confirmed that two peaks usually happen in the early morning and nighttime. Another study used hourly observations at state Shipu station from 1971?2011 to reveal that the occurrence frequency of nighttime fog is higher than that in the morning (Zhou et al., 2015). One dynamical explanation may be associated with the fact that the two conversion times of sea and land breezes occur locally in the morning and in the middle of the night (Xun et al., 2017). A rapid increase in climatological visibility can be seen from morning to afternoon owing to solar radiation driving the boundary-layer turbulent mixing during the daytime period. The maximum and minimum peaks of visibility are generally one to two hours earlier in regions 1 and 2 (western port) than those in the other two regions (eastern port). The lowest visibility (green line) and highest visibility (blue line) among the four regions are found in region 3, covering the central port, and region 1, near the inland area, respectively. The main shipping lanes are located in regions 2, 3 and 4, with lower visibility in morning.
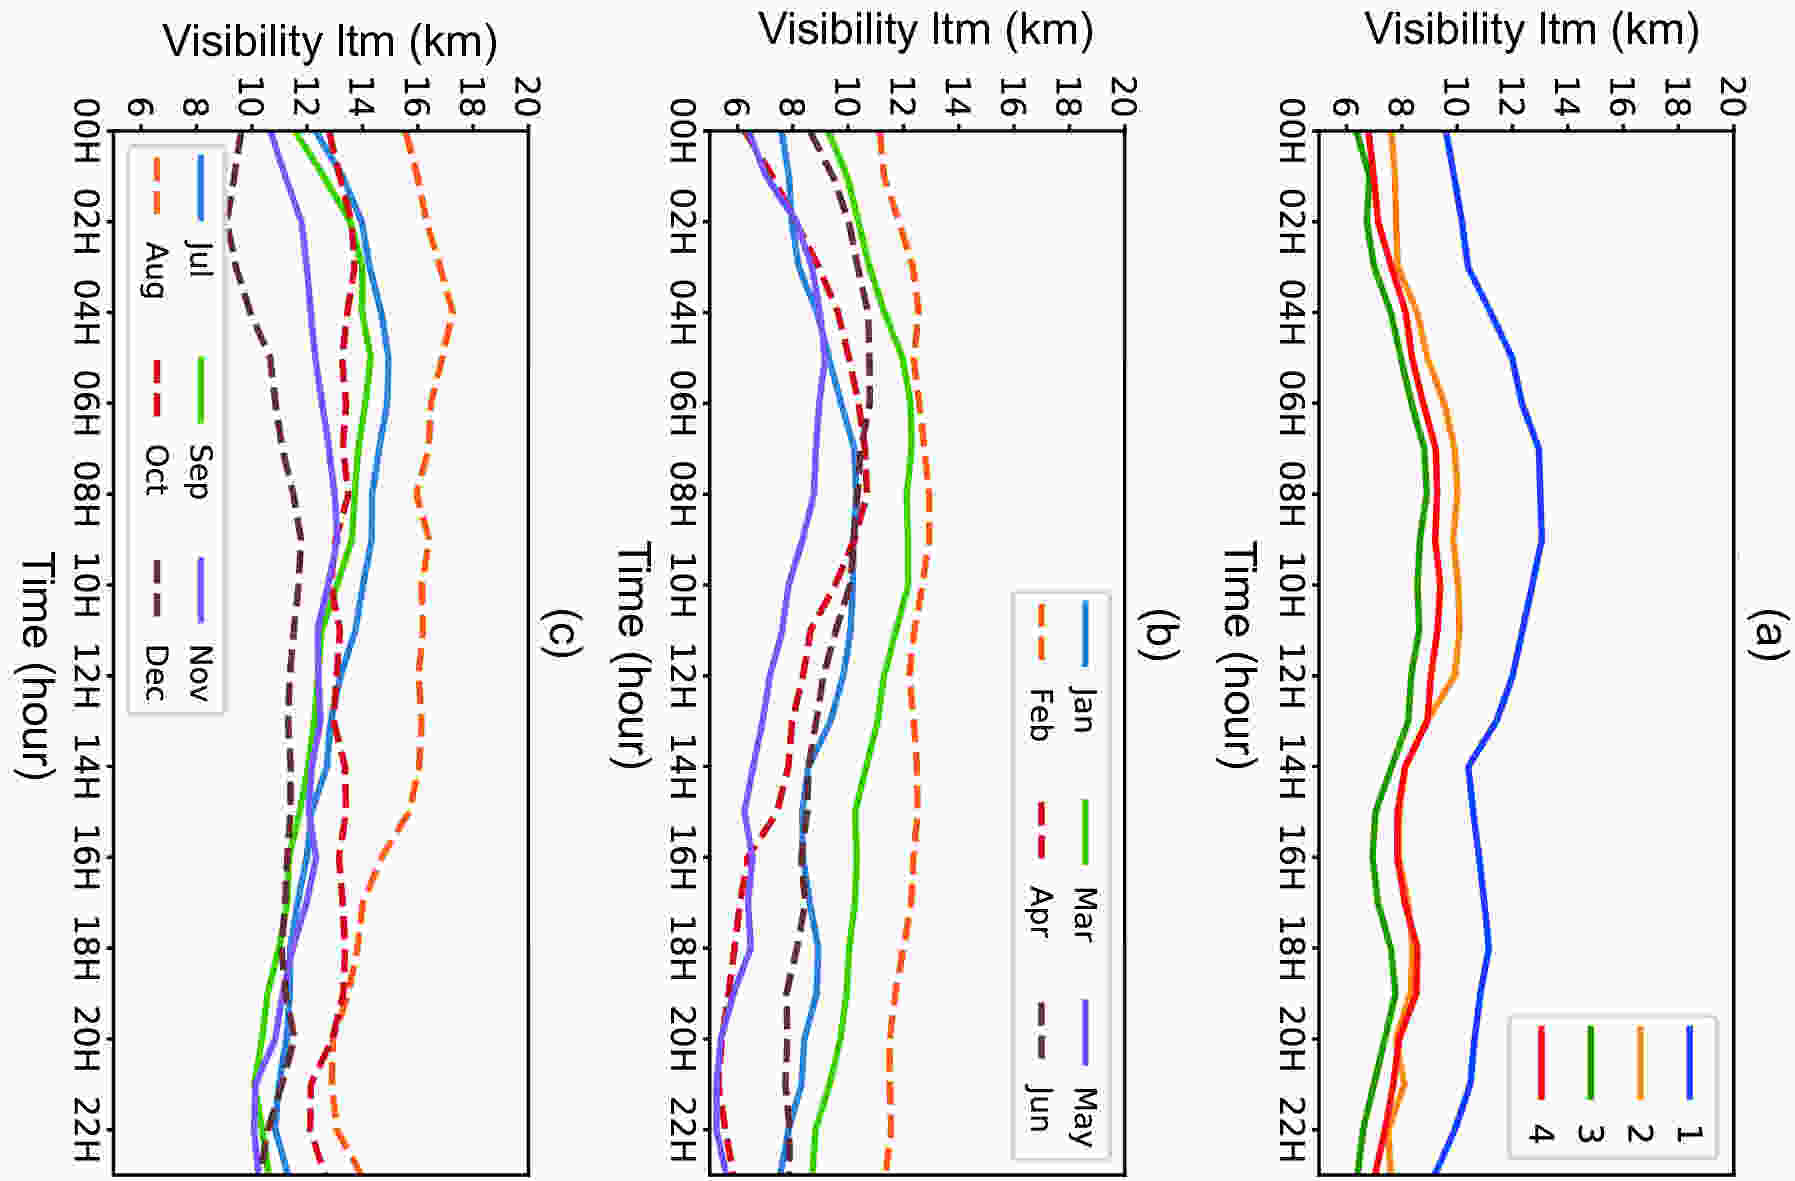 Figure3. (a) Regional-mean diurnal cycle of visibility (vertical scale; units: km) for 24 hours (UTC) in January for four regions, and (b, c) the diurnal cycle of visibility (vertical scale; units: km) averaged over all four regions for 24 hours (UTC) in 12 months: (b) January?June; (c) July?December.
To compare the seasonal climatology, the diurnal cycles of each month’s visibility averaged over all four regions are plotted in Figs. 3b and c. The basic feature indicates that the lowest visibility occurs locally in the early morning (2000?2200 UTC) for all regions. In terms of seasonality, the lowest visibility is found in May, with visibility lower than 5 km locally in the early morning (Fig. 3b), while the visibility observed in August is larger than 17 km locally at around noon (Fig. 3c).
According to the diurnal cycle of visibility shown in Fig. 3a, the visibility difference is large between 1200 UTC and 0000 UTC. The climatological differences in tropospheric variables between 1200 UTC and 0000 UTC along 30°N show that the GPH in the atmospheric boundary is higher in the morning than the evening, locally, while a reversal of GPH is observed in the mid?upper troposphere (Fig. 4a). The reversal of temperature is mainly located in the boundary layer below 925 hPa over the land, with low temperatures in the morning. The negative southerly wind indicates that the morning northerly wind is stronger and the positive specific humidity indicates that the morning moisture is less near the land surface (Fig. 4b), but the morning southerly wind is stronger over the land in the 700?500 hPa layer. Among the four basic variables, the decreasing boundary-layer temperature over the land in the morning is conducive to reducing visibility over the port. Thermodynamically, high boundary-layer temperatures during daytime are favorable for increased visibility.
 Figure4. Zonal cross sections of climatological variable differences at 1200 UTC minus 0000 UTC in January along 30°N, crossing the port: (a) climatological GPH difference (contours; interval: 1 gpm) and climatological temperature difference (shading; interval: 0.3 K); (b) climatological southerly wind difference (contours; interval: 0.2 m s?1) and climatological specific humidity difference (shading; interval: 0.04 g kg?1). (c, d) as in (a, b) but for the climatological differences at 0000 UTC August minus 0000 UTC May.
According to the maximum difference of visibility shown in Figs. 3b and c, some seasonal differences in climatological variables are illustrated in Figs. 4c and d. The results indicate that the temperature is higher and the GPH is lower in the lower troposphere in August than that in May, while the southerly wind is stronger and the humidity is higher in the lower troposphere in August than that in May, without obvious difference between land and sea. This implies that the seasonal high frequency of lower visibility in May is due to lower temperatures and northerly winds—namely, cold northerly advection.
4.1. Fog case description
A case of coastal dense fog with rain at Ningbo-Zhoushan Port from 27 to 28 January in 2016 was studied as an example to examine the relationship between heavy fog and anomalous features of atmospheric variables. From the traditional surface weather analysis, the port was located in an east-high and west-low pattern of surface pressure, with a high center in the ECS at 0000 UTC 27 January 2016. This pattern is a weather situation favorable for the occurrence and maintenance of sea fog (Wang, 1983; Jiang et al., 2008; Yang and Gao, 2015). Rain and low visibility were observed at the port while the weather situation was fog from the eastern land area in China to the Korean Peninsula and haze in North China. A reverse trough was formed from the Taiwan Strait to the port with rain, and light fog was still observed in the land area, but the port sky became unclear when the high center moved eastward to southwest of the Japan Islands at 1200 UTC 27 January 2016. A low center formed and moved northeastward along the east coast of the ECS from 0000 UTC to 1200 UTC 28 January 2016. The port sky was still unclear with rain, while light fog covered many stations from eastern China to the Korean Peninsula on that day. At 0000 UTC 29 January 2016, the weather situation was still maintaining, except the low center had moved eastward slightly in the ECS. This weather process involving an east-high and west-low pattern is typical in January and shows that fog often forms from eastern China to the Korean Peninsula with haze in North China before a strong cold high develops in Siberia. The unclear sky with rain observed at the port resulted from a reverse trough that developed an area of low pressure near the ECS coast, meaning the port experienced a rain-fog type process.Among the 20 automatic observation sites in Fig. 1, four recorded that the visibility was lower than 200 m from 1400 LST 27 to 1000 LST 28 January 2016, and less than 1000 m from 0800 LST 27 to 1600 LST 29 January 2016. The central point of the low-visibility period was at 0000 UTC 28 January 2016. Figure 5 shows the spatial distribution of visibility in four spells. The lowest visibility of less than 400 m during the four spells occurred in the northern part of the port. During this period, in the central low-visibility place, the hourly PM2.5 concentration was less than 81 μg m?3, so the low visibility at the port was not influenced by haze. At the port, the minimum temperature was above 3°C, and rain lasted from 0600 LST 27 to 1600 LST 29 January 2016, but was interrupted between 1400 and 1500 LST 28 January 2016 at some sites. The visibility at Putuo national station near the port was 392 m, so it experienced extreme weather of a rain-fog type during the three days. The visibility and rain at the port is strongly influenced by the local topography.
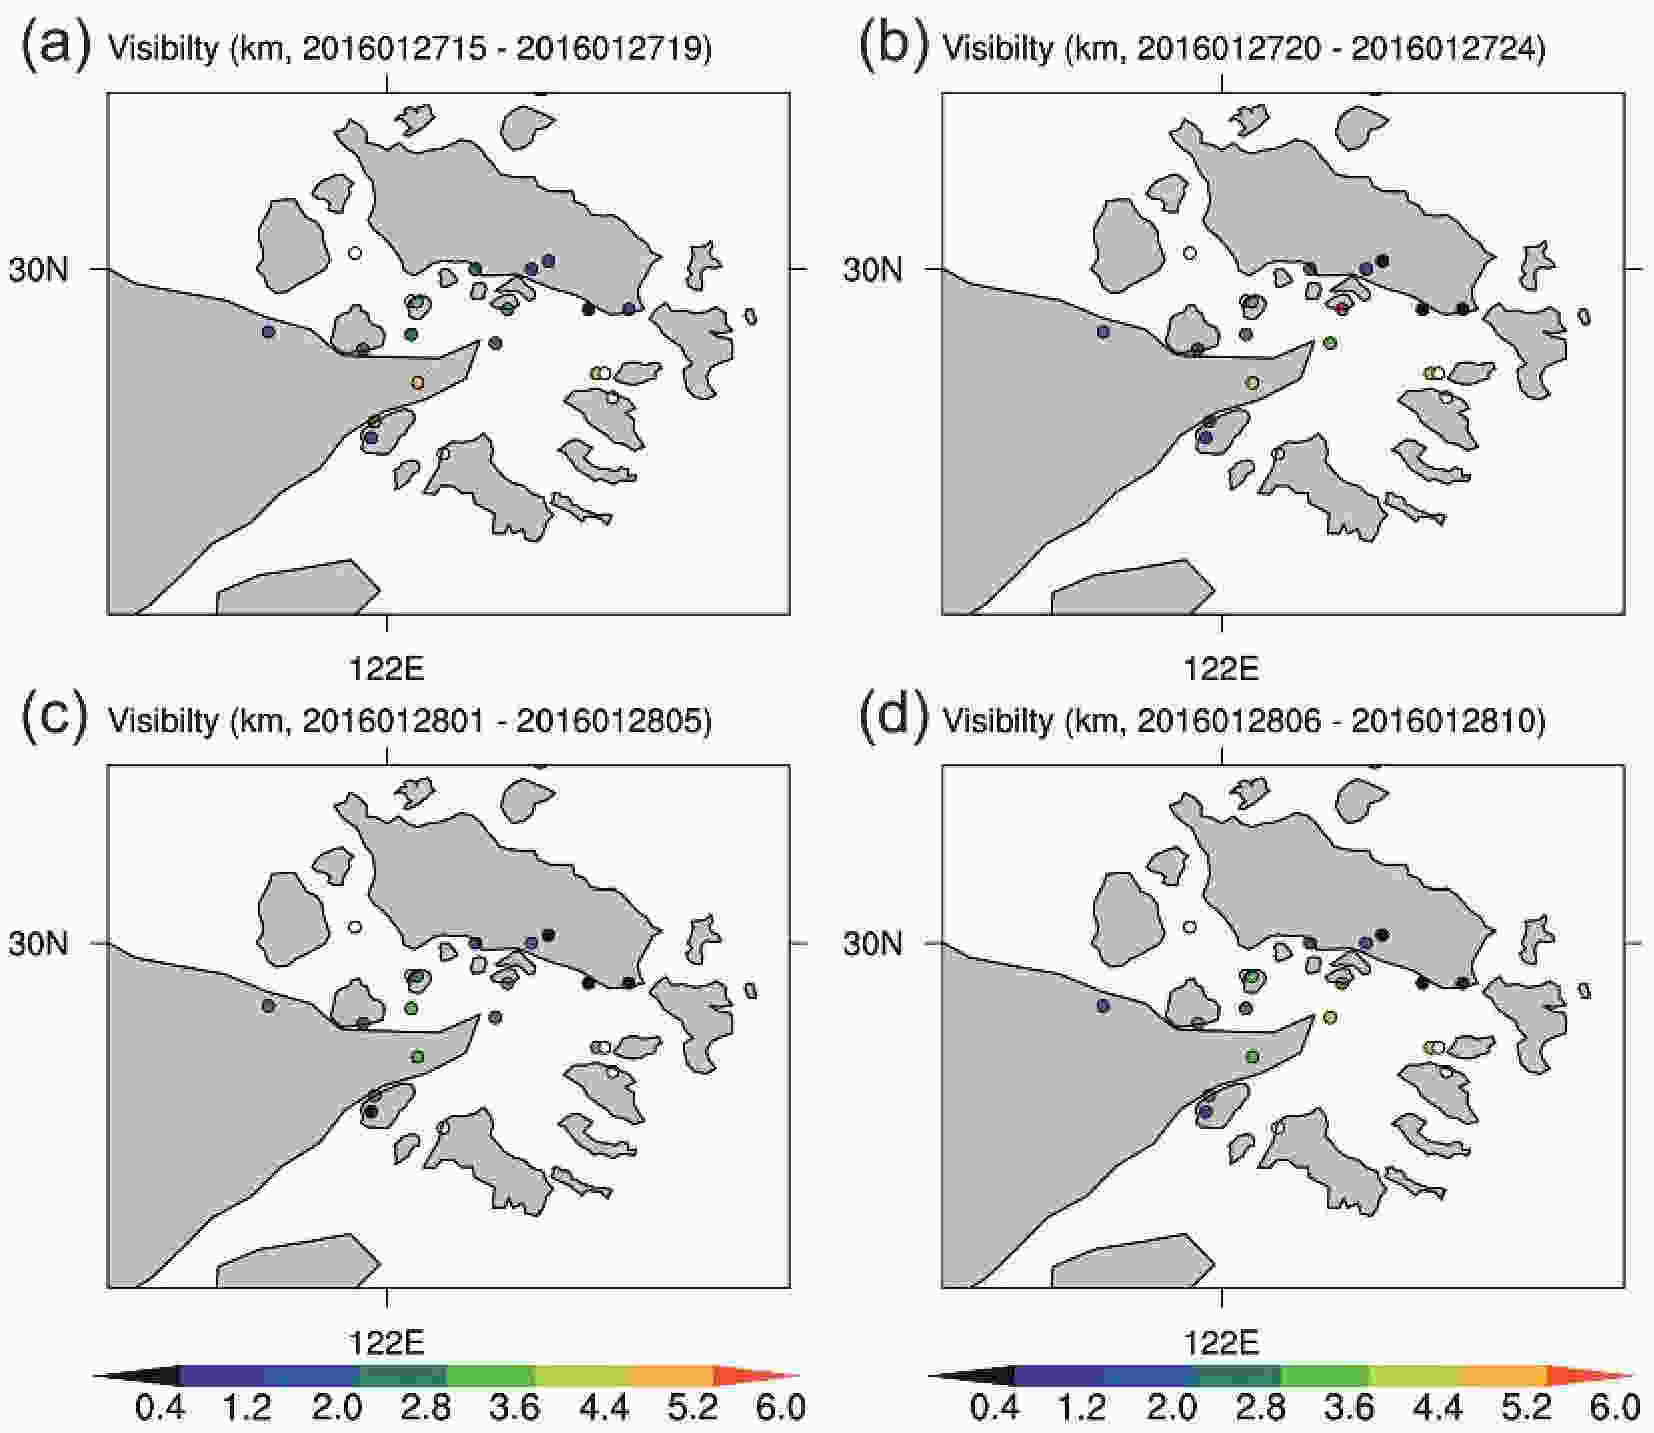 Figure5. Spatial distributions of visibility (shading; units: km) averaged over (a) 1500?1900 LST 27 January, (b) 2000?2400 LST 27 January, (c) 0100?0500 LST 28 January, and (d) 0600?1000 LST 28 January 2016.
The port was closed during the three days. Figure 6a shows the time series of hourly minimum visibility of the four regions from 24?31 January 2016. The green and red lines indicate that the visibility of regions 3 and 4 sometimes reached 1 km from 27 to 28 January in 2016. This happened with the surface relative humidity higher than 95%?100%, the surface temperature at about 7°C?8°C, rain, and a change from southwesterly to northeasterly winds, based on the automatic station observations. Before this period, the visibility was larger than 10 km in all four regions. On 26 January, the surface minimum temperature reached ?4°C to ?6°C and was accompanied by northwesterly winds. After this period, the visibility was larger than 5 km in all four regions with temperatures of about 5°C?6°C. Thus, correctly predicting dense fog processes like this one at lead times of several days is important for shipping safety and the economy.
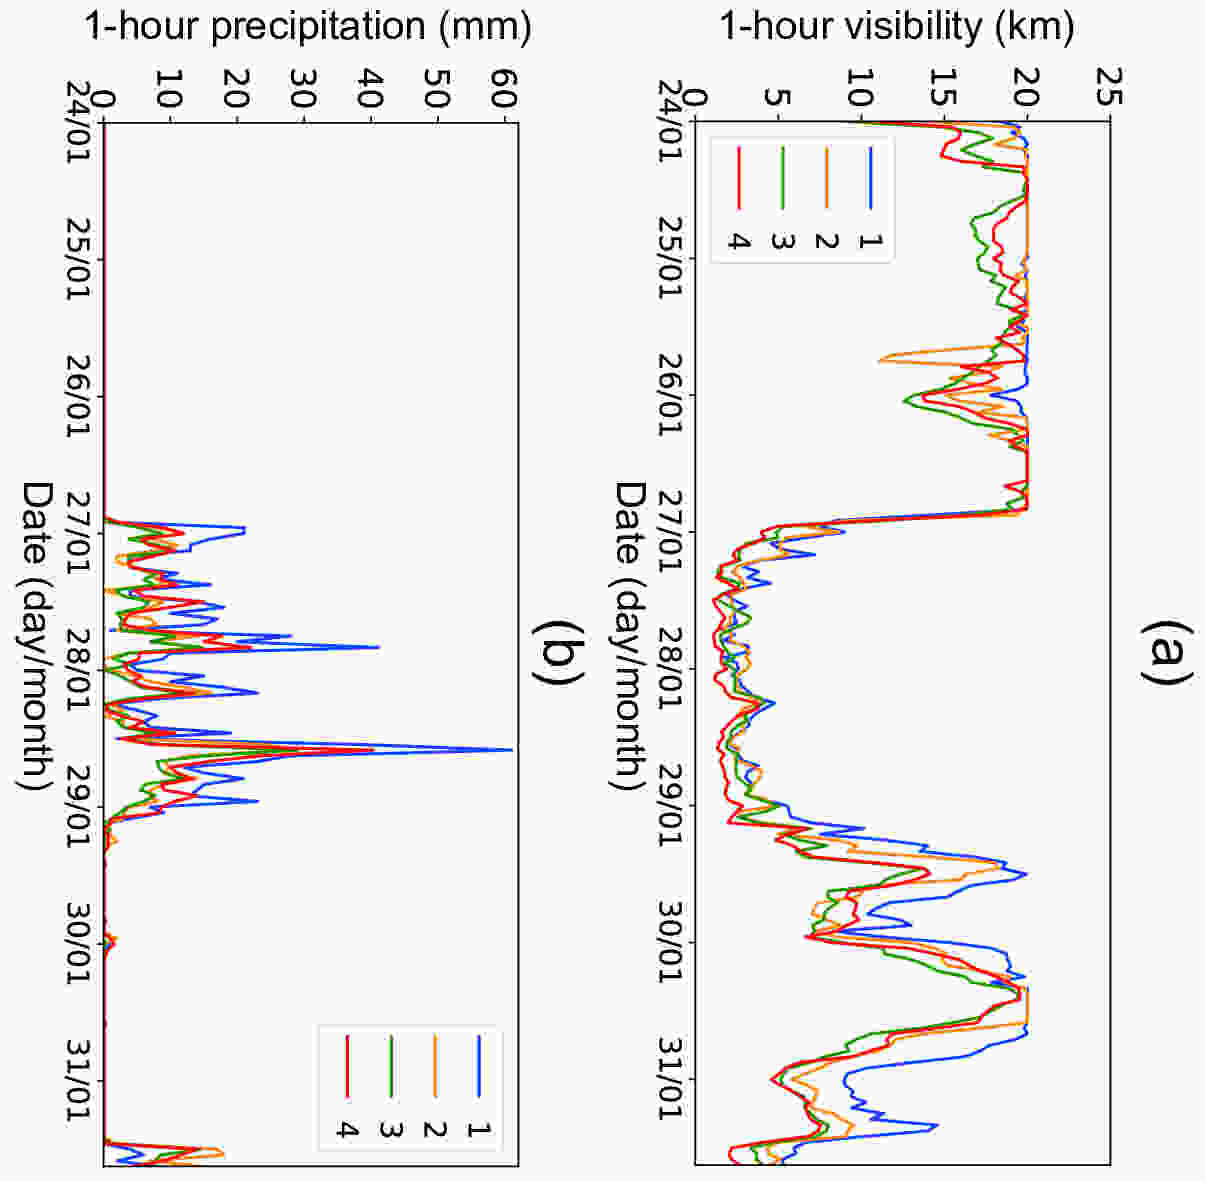 Figure6. Hourly-mean (a) visibility (vertical scale; units: km) and (b) precipitation (vertical scale; units: mm h?1) averaged over all four regions from 24?31 January 2016.
Figure 6b shows the hourly-mean precipitation averaged over all four regions from 24?31 January 2016. When compared to the visibility in Fig. 6a, it can be understood that the two days’ low visibility was caused by the rainy period. However, regions 2 and 3 in the central part of the port experienced several hours without rain, but visibility was still low. Therefore, this was an extreme weather process of rain-fog type.
2
4.2. Anomaly-based weather analyses
In previous studies, traditional weather analysis of certain pressure levels and vertical sections has been used to describe the relations of basic variables to indicate the synoptic conditions of regional weather extremes. The evolution of vertical sections of total height and total temperature as well as total westerly wind, total southerly wind and total specific humidity at the port (30°N, 121°E) from 24?31 January 2016 based on ERA-Interim data are shown in Figs. 7a and c. The total temperature has a fluctuating evolution from 24?31 January 2016, but without any significant change in total GPH (Fig. 7a). In Fig. 7c, the northeasterly, northwesterly, southwesterly and northeasterly winds change from day to day, while a high humidity air mass can be seen from 27?28 January in the lower troposphere. From Fig. 7c, the southwesterly warm-moist flow in the lower troposphere was favorable for the formation of the severe fog and precipitation in this case.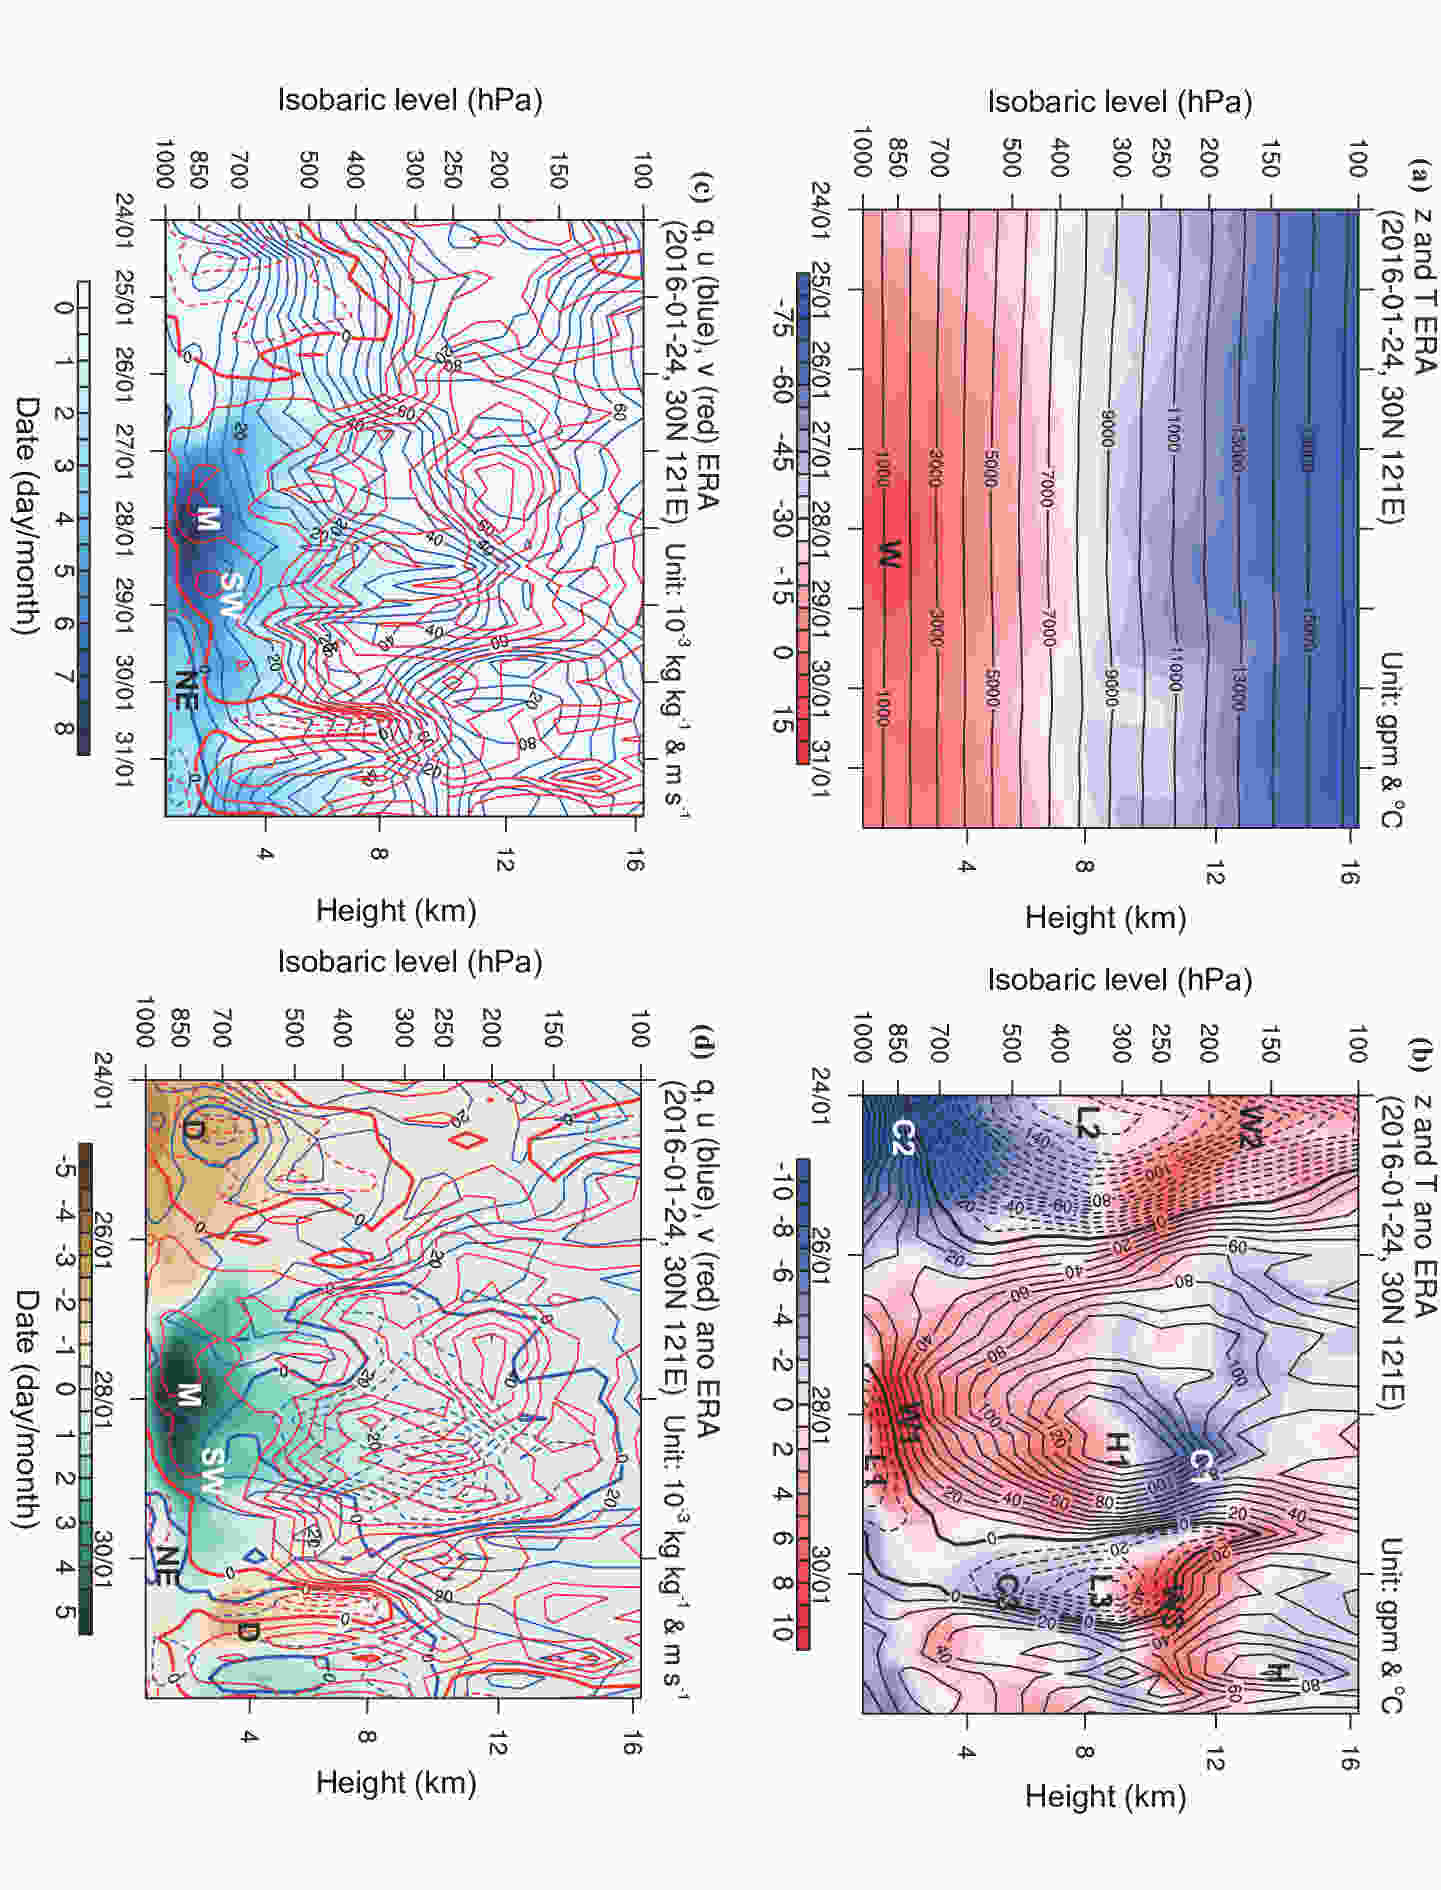 Figure7. (a) Evolution of vertical profiles of total GPH (contours; interval: 100 × 10 gpm) and total temperature (shading; interval: 5 K) at the port (30°N, 121°E) from 24?31 January 2016, based on ERA-Interim. (b) As in (a) but for GPH anomalies (contours; interval: 1 × 10 gpm) and temperature anomalies (shading; interval: 1K). (c) As in (a) but for total westerly wind (blue contours; interval: 5 m s?1), total southerly wind (red contours; interval: 5 m s?1) and total specific humidity (shading; interval: 0.5 g kg?1). (d) As in (a) but for westerly wind anomaly (blue contours; interval: 5 m s?1), southerly wind anomaly (red contours; interval: 5 m s?1) and specific humidity anomaly (shading; interval 0.5 g kg?1). The letters “H/L” and “W/C” denote the centers of height and temperature or their anomalies. The letters “SW/NE” denote the “southwesterly/northeasterly” winds or their anomalies, while the letters “D/M” are dry/wet centers of humidity or their anomalies.
No special signals were found in the traditional weather analysis (Figs. 7a and c), but the anomalous components clearly show the severe fog and rain evolution from 27?28 January 2016 in Figs. 7b and 7d, after removing the temporal climatological components. A positive GPH anomaly center (H1) separated a warm center (W1) below and a cool center (C1) above from 27 to 28 January 2016. Before the low-visibility period, a low GPH center (L2) separated a cool center (C2) below and a warm center (W2) above from 24?25 January 2016. After this period, a low GPH center (L3) separated a cool center (C3) below and a warm center (W3) above on 30 January 2016. During the low-visibility period, a temperature inversion was formed beneath the high center H1 and above the low center L1. As indicated by Zhao et al. (2013) in the study of smog formation, pollutants accumulate in the shallow layer near the surface under strong inversion. Similarly, a strong persistence inversion layer (W1 in Fig. 7b) formed by the positive height center (H1) above and the negative center (L1) below favored the accumulation of moisture and caused severe fog and rain. During the period of severe fog and rain from 27?28 January 2016, moist southwesterly wind anomalies are clearly apparent, and changed to northeasterly wind anomalies (Fig. 7d). Before and after the fog and rain period, there were dry northwesterly wind anomalies in the port boundary layer. Thus, the spatial pattern of anomalous variables for forming severe fog and rain is different before and after the period.
For this severe coastal fog and rain period, it was centered at 0000 UTC 28 January 2016. Thus, we compared the total basic variables, such as total GPH, temperature, wind and specific humidity, to the anomalous variables at 0000 UTC 28 January 2016 along 121°E and 30°N, crossing the port. Figure 8 shows that a relatively warm and moist air column was centered on the southeast side of the port, with weak southerly wind near the boundary layer. There were no other significant signatures to indicate the severe fog and rain from the total variables of GPH, temperature (Figs. 8a and c), specific humidity and southerly wind (Figs. 8b and d).
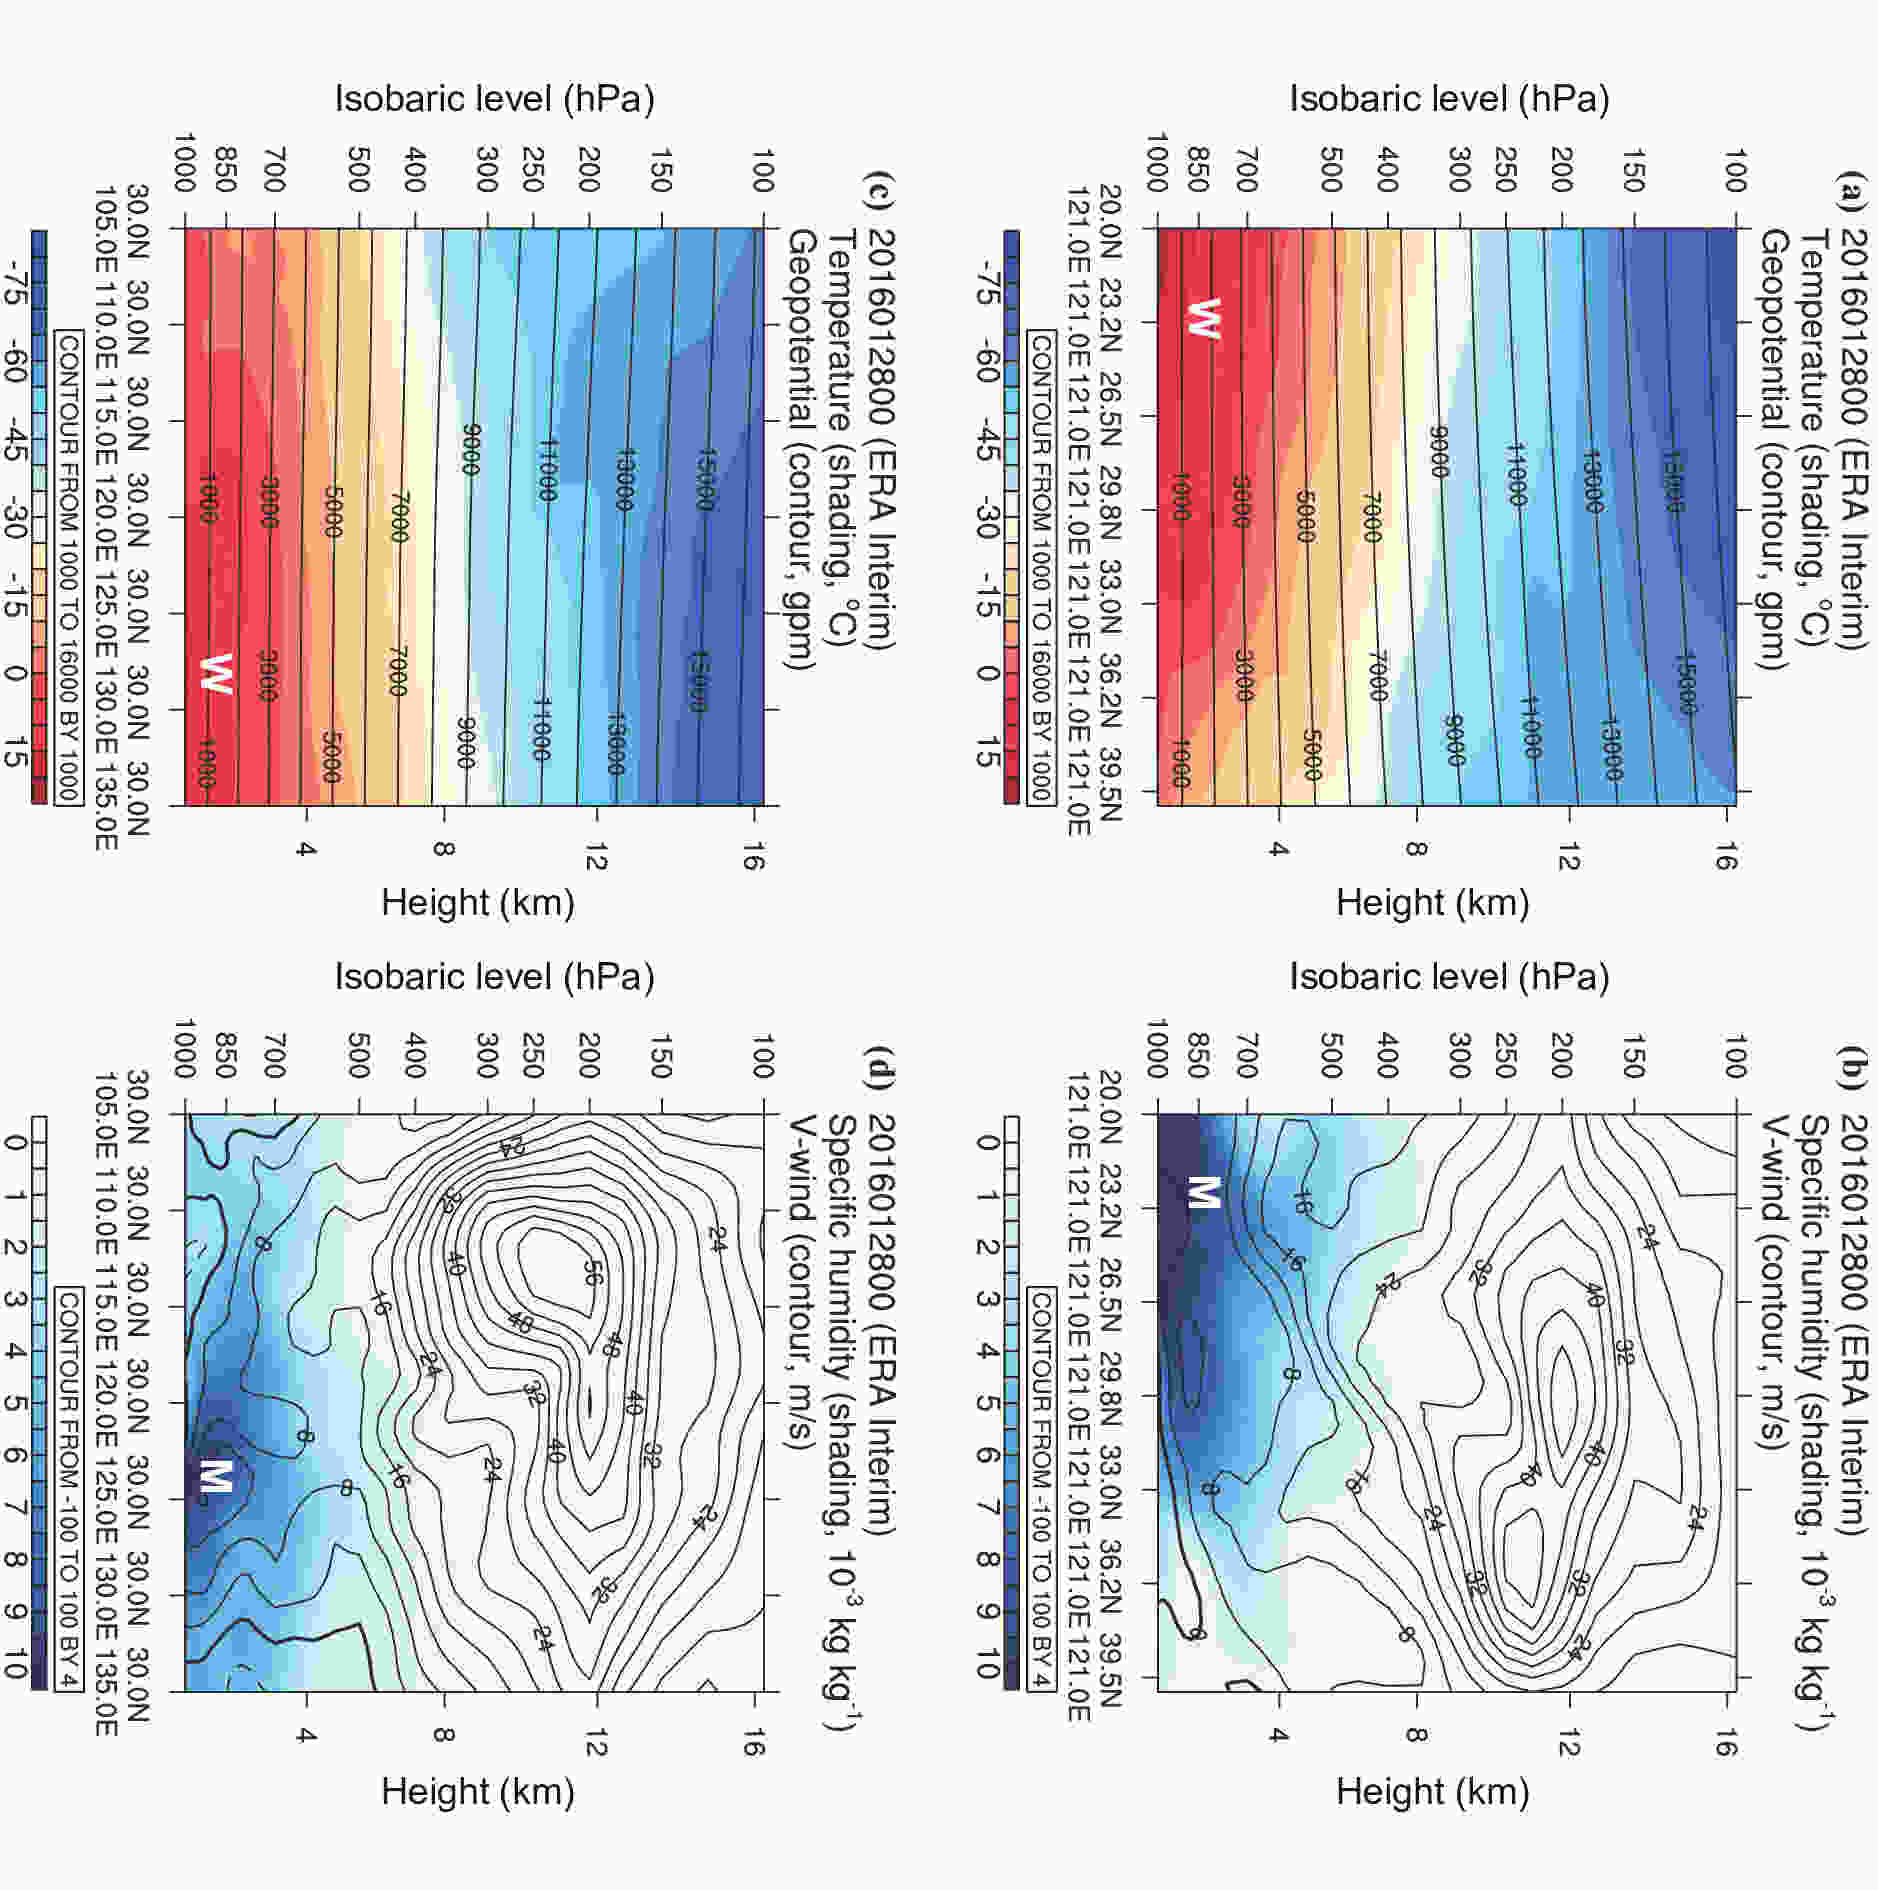 Figure8. (a) Meridional cross section of total GPH (contours; interval: 1000 gpm) and total temperature (shading; interval: 5 K) along 121°E from 22°N to 38°N at 0000 UTC 28 January 2016, based on ERA-Interim. (b) As in (a) but for the total southerly wind (contours; interval: 4 m s?1) and total specific humidity (shading; interval: 0.5 g kg?1). (c) As in (a) but for the total GPH and total temperature along 30°N from 105.0°E to 134.2°E. (d) As in (c) but for the total southerly wind and total specific humidity. The letters “W” and “M” denote the centers of temperature and specific humidity.
Figure 9 compares vertical sections of total variables and anomalous variables, where some significant features can be used to indicate the severe fog and rain. A positive GPH anomaly center was located in the upper troposphere over the northeast side of the port, and a ridge of GPH anomaly formed a warmer air column in the mid?lower troposphere over the port (Figs. 9a and c). This warm air column was amplified by a trough of GPH anomaly near the surface, as shown in Fig. 9c. Therefore, there was a maximum center of inversion at around 925 hPa over the port. This type of shallow temperature inversion was also mentioned by Zhang et al. (2012) using stability analysis. In Figs. 9b and 9d, a center of specific humidity anomaly is accompanied by a center of southerly wind anomaly in the lower troposphere over the port.
 Figure9. As in Fig. 8 but for (a) GPH anomalies (contours; interval: 20 gpm) and temperature anomalies (shading; interval: 1 K) as well as southerly wind anomaly (contours; interval: 4 m s?1) and specific humidity anomaly (shading; interval: 0.6 g kg?1) at 0000 UTC 28 January 2016, based on ERA-Interim. The letters “H/L” and “W/C” denote the centers of height and temperature anomalies in (a) and (c). The letters “S/N” denote the centers of “southerly/northerly” wind anomalies, while the letter “M” is the wet center of the humidity anomaly in (b) and (d). Long and short thick dashed lines indicate the ridge and trough, respectively, in (a) and (c).
To find the strongest center of inversion and moisture from anomalous weather analysis, Fig. 10 depicts the horizontal distribution of 925-hPa GPH anomalies and temperature anomalies as well as wind anomalies and specific humidity anomalies at 0000 UTC 28 January 2016. The strongest location of inversion and the strongest location of specific humidity anomalies were centered at the port. The anomalous weather analysis shows that the port was located along a trough of GPH anomalies, with a high center in its east and a low center in its west. A shear line of wind anomalies also crossed the port, so there was a convergence center of southerly wind anomalies at the port. These features observed from the anomalous weather analysis can be seen as some basic signals to predict the formation of fog, rain and low visibility from both a temporal and spatial perspective.
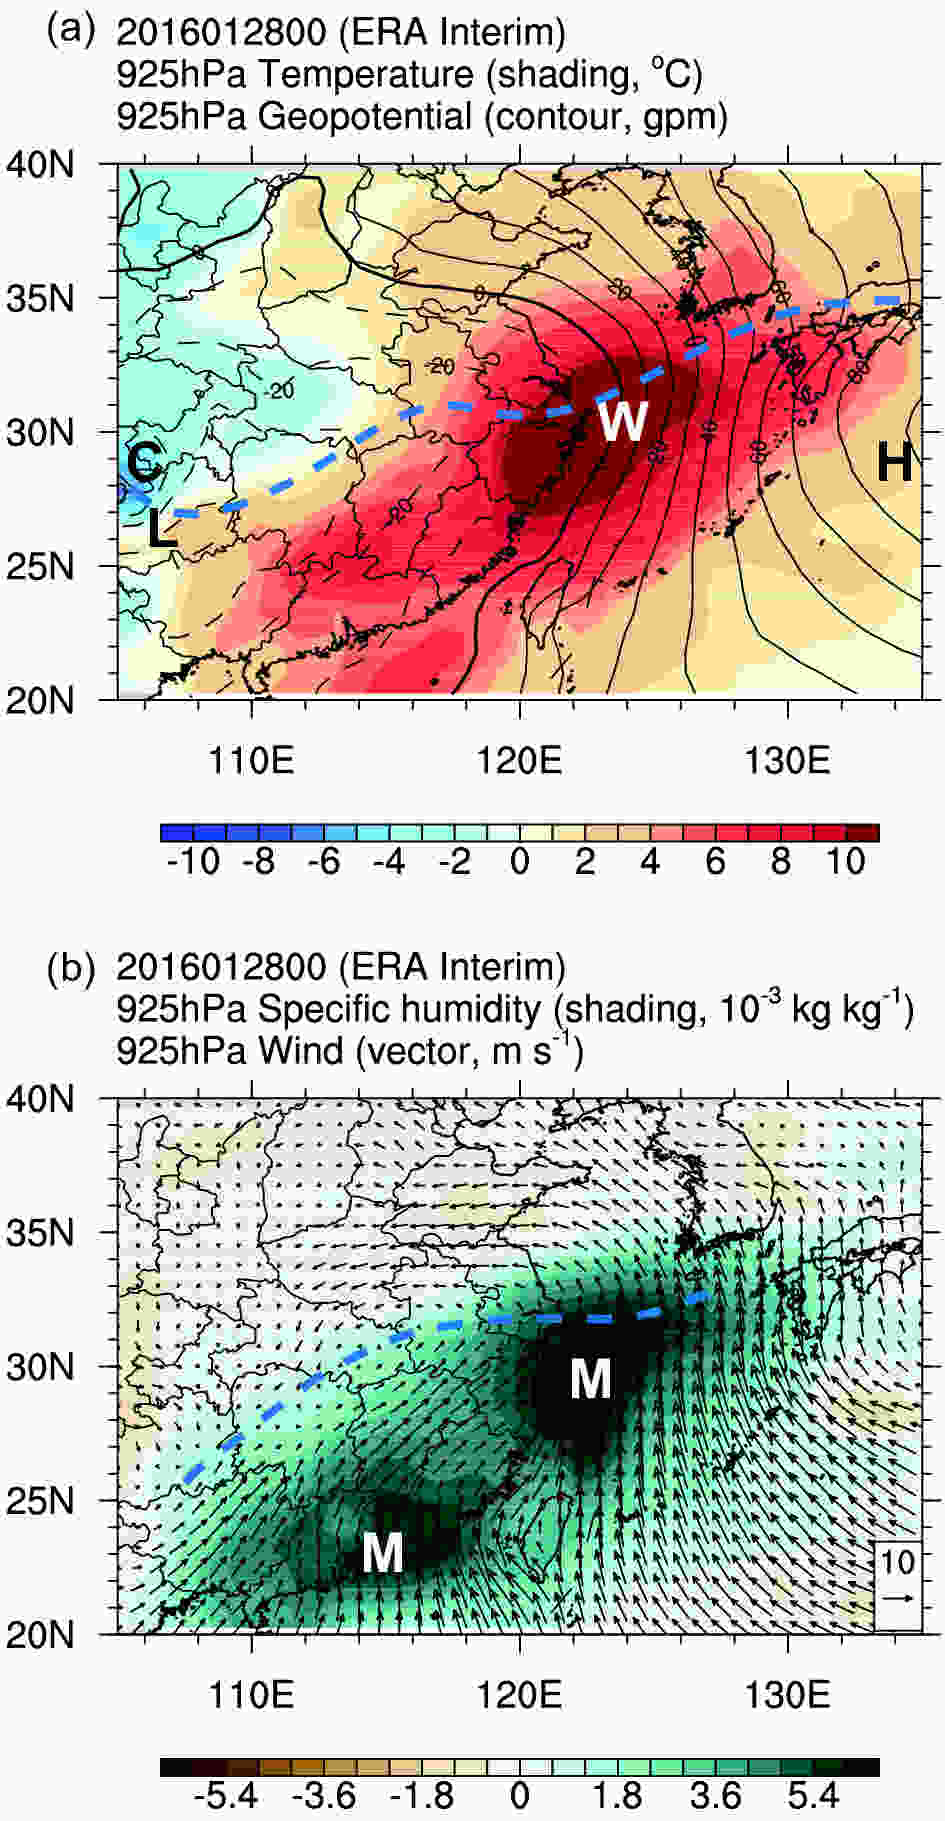 Figure10. Horizontal distribution of (a) GPH anomalies (contours; interval: 10 gpm) and temperature anomalies (shading; interval: 1 K), (b) wind anomalies (arrows; units: m s?1) and specific humidity anomalies (shading; interval: 0.6 g kg?1) at 0000 UTC 28 January 2016 at 925 hPa, based on ERA-Interim. The letters “H/L” and “W/C” denote the centers of height and temperature anomalies, while the letter “M” is the moist center of the humidity anomaly. Blue dashed lines denote the trough of GPH anomalies and shear line of wind anomalies.
2
4.3. Model output products
Comparing the four basic anomalous variables—GPH, temperature, humidity and wind anomalies—we find that the vertical patterns and evolutions of GPH?temperature and humidity anomalies are better than wind anomalies at indicating the fog formation and rain that resulted in low visibility. As such, the wind anomaly can be seen as an additional condition to indicate the formation of severe fog and rain. Figure 11 shows the vertical profiles of GPH anomalies and temperature anomalies based on the EPS products initiated from 0000 UTC 24, 0000 UTC 23, 0000 UTC 22, 0000 UTC 21, 0000 UTC 20, and 0000 UTC 19 January 2016 for the future 10 days. The EPS data correctly predicted the warm center (W1) as well as the high center (H1) and the low center (L1) for lead times of 4, 5, 6, 7, 8 and 9 days. Before the fog and rain period, EPS also correctly predicted the cold center (C2) as well as the low center (L2) and the warm center (W2) in advance. Figure11. As in Fig. 7b except for the EPS prediction of vertical profiles of GPH anomalies (contours; interval: 1 × 10 gpm) and temperature anomalies (shading; interval: 1 K) initiated from (a) 0000 UTC 24, (b) 0000 UTC 23, (c) 0000 UTC 22, (d) 0000 UTC 21, (e) 0000 UTC 20, and (f) 0000 UTC 19 January 2016, for the future 10 days.
For all the anomalous variables plotted on horizontal and vertical anomalous weather analyses, temperature anomalies can be derived from height anomalies by using the hydrostatic balance, while wind anomalies can also be derived from height anomalies by using the geostrophic balance. The vertical structure of GPH?temperature anomalies in Fig. 9 is similar to that indicated by Beijing extreme rainfall (Jiang et al., 2016). This vertical structure is also favorable for the formation of severe smog, if there are local pollutant sources (Qian and Huang 2019). Also, this marine boundary layer structure of temperature anomalies (inversion) is favorable for the formation and maintenance of sea fog (Gao et al., 2007). The horizontal structure of GPH?temperature anomalies and wind?humidity anomalies in Fig. 10 is not entirely similar to the east-high and west-low pattern as well as the reverse trough along the ECS coast from traditional weather analysis. This is because the former can indicate the central location of weather extremes (Qian, 2015).
Comparing the wind anomalies and humidity anomalies in Fig. 7d, EPS correctly predicted the center of the southwesterly (SW) wind anomalies and the moisture center “M” of humidity anomalies for lead times of 4, 5, 6, 7, 8 and 9 days (Fig. 12). Before the fog and rain period, EPS also correctly predicted the center of the northwesterly (NW) wind anomalies and the dry center “D” of humidity anomalies in advance. In addition, the conditions favorable for the persistence and the transfer of wind anomalies from southwesterly to northeasterly were correctly predicted.
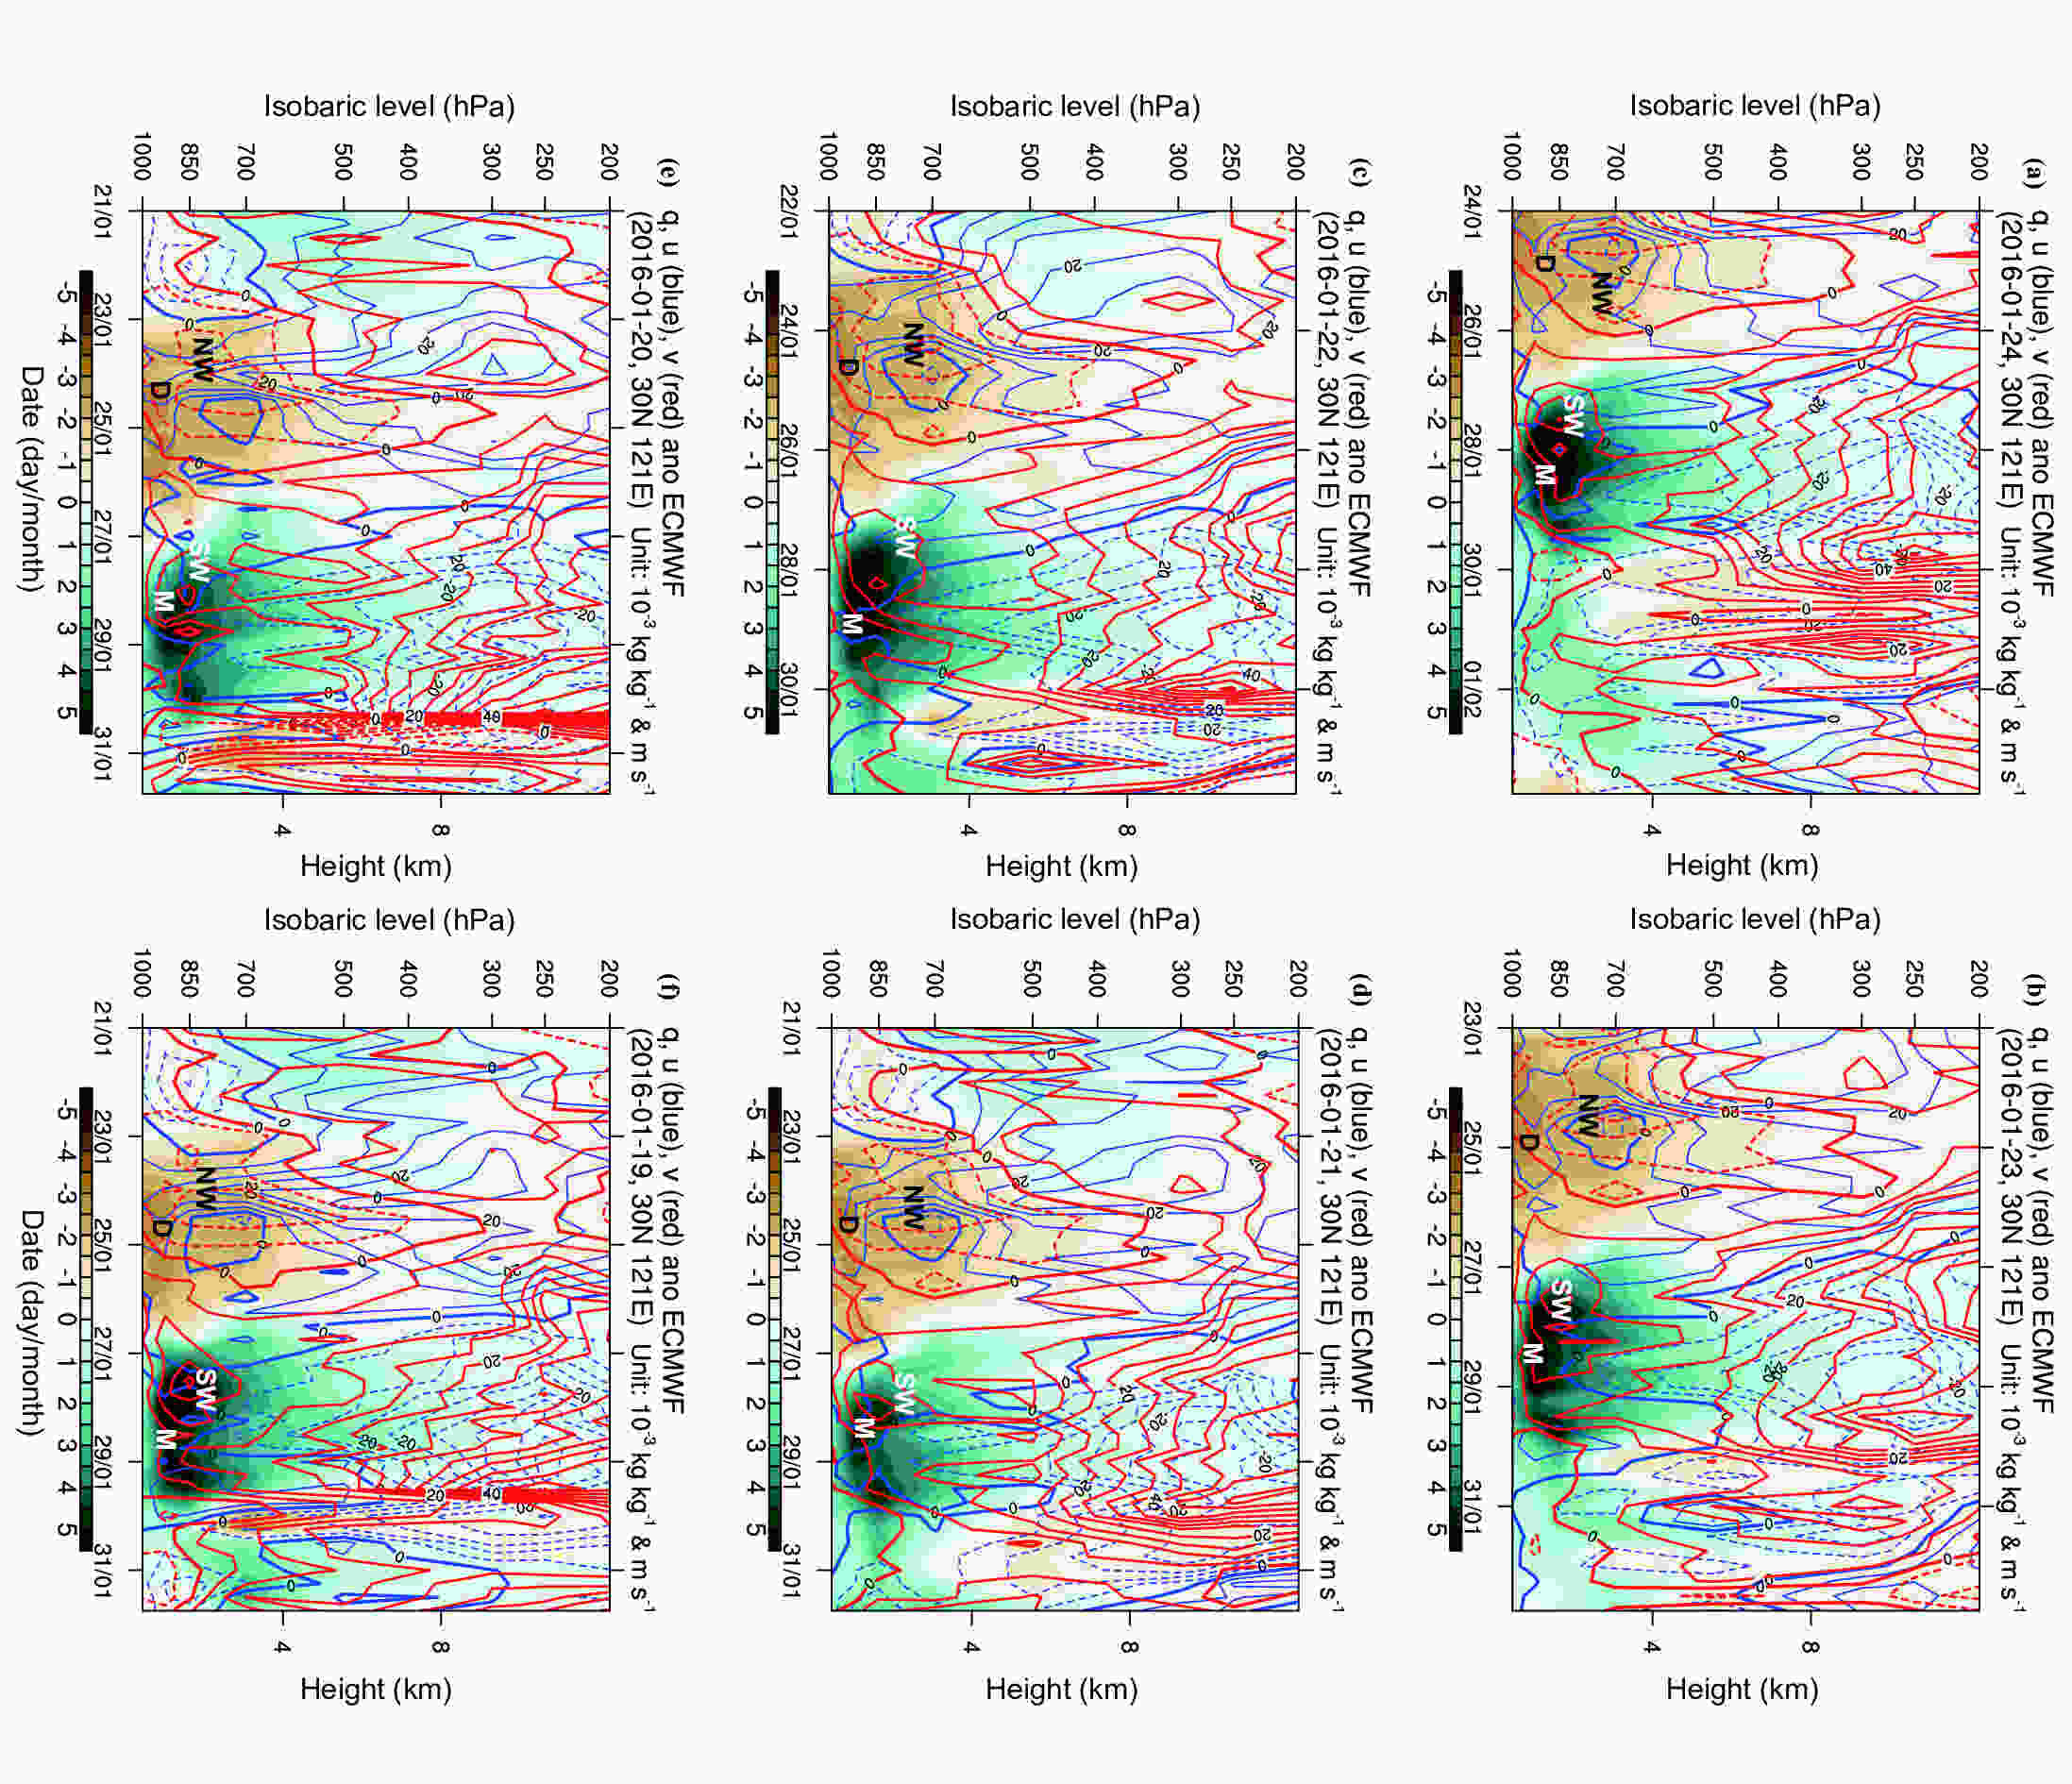 Figure12. As in Fig. 7d except for the EPS prediction of vertical profiles of westerly wind anomalies (blue contours; interval: 5 m s?1), southerly wind anomalies (red contours; interval: 5 m s?1) and specific humidity anomalies (shading; interval: 0.5 g kg?1) initiated from (a) 0000 UTC 24, (b) 0000 UTC 23, (c) 0000 UTC 22, (d) 0000 UTC 21, (e) 0000 UTC 20, and (f) 0000 UTC 19 January 2016, for the future 10 days.
 Figure13. (a, b) As in Figs. 6a and b but from 1?10 March 2015. (c, d) as in Figs. 7b and d but from 1–10 March 2015. Black boxes denote the period of low visibility episodes.
There were two periods with visibility less than 1 km late on 27 and 29 May 2015 (Fig. 14a). The rain in Fig. 14b occurred before the low visibility on 27 May, but basically no rain was observed on 29 May during the low visibility. The two periods can also be indicated by the two warm-low peaks of GPH?temperature anomalies during 26?30 May in the lower troposphere (Fig. 14c). The two wet centers following the change from southwesterly to northeasterly wind anomalies were consistent with the two fog periods (Fig. 14d). In addition, the two low visibility periods occurred with the change from southwesterly to northeasterly wind anomalies. Similarly, the EPS products can be used to indicate these anomalies for lead times of several days.
 Figure14. As in Fig. 13 but for 21–31 May 2015.
As done for the case from 27?28 January 2016, as well as the cases depicted in Fig. 13 and Fig. 14, we can also examine other cases. One example had two periods of lower visibility, with the first weak one from 1?3 June and the second strong one from 7?10 June 2015. The two inversion periods of temperature anomalies and the two wet periods of humidity anomalies in the lower troposphere were observed to closely accompany the two lower visibility periods. The fog period ended at the moment when the southwesterly wind anomaly changed to a northeasterly one. Another case shows that a two-day period of visibility less than 1 km from 4?5 January 2016 was situated within the inversion and the negative GPH anomalies as well as the wettest humidity anomaly and the change from southwesterly to northeasterly wind anomalies. All cases show that low-visibility episodes are the result of comprehensive effects from GPH?temperature anomalies and wind?humidity anomalies. For a longer episode of low visibility of more than several days, it is influenced by stratus clouds and rain, which is generally classified as “advection fog”. So, this period could be rain-fog type weather. On the other hand, a diurnal cycle of visibility could be observed when there are no rain and stratus clouds, which is the so-called “radiation fog”.
To confirm the relationship by using anomalous variables to indicate low visibility at the port, we performed two calculations based on the observed data and reanalysis data. The first involved calculating their correlation coefficients and the other the threat score. Six-hourly series of visibility and anomalous variables from 1 January to 30 June during 2015?16 (total: 363 days, 1452 samples) were used. The correlation coefficients of visibility against 850?925-hPa-averaged temperature, GPH, specific humidity, westerly wind and southerly wind anomalies were calculated. The correlation coefficients of the first four anomalies averaged over 850?925 hPa were ?0.31, 0.40, ?0.48 and ?0.17, respectively, reaching the 99.9% confidence level, but the southerly correlation was ?0.03 with a 75% confidence level. This result shows that low-layer temperature, GPH, and humidity anomalies are better than wind anomalies at indicating whether a low-visibility period is possible.
As done by Qian et al. (2016a), we used the TS to quantitatively measure the applicability of these anomalous features for all 1452 samples in the first halves of the two years. The TSs of anomalies averaged over 850?925 hPa were calculated. Different thresholds of anomalies were tested and the threshold that gave the highest TS is given in Table 1. The first test took the best threshold of humidity anomaly larger than 5.4 g kg?1, and the TS was 0.098 with 24 hitting samples, 15 missing samples, and 235 false alarm samples. The TS of a single variable was lower than 0.1. The TS increased to 0.104 when considering both humidity and GPH anomalies, and reached 0.125 when considering both humidity and temperature anomalies. The TS from the three variables of humidity, GPH and temperature anomalies combined was 0.140. These TS results imply that fog occurrence depends on multiple anomalous variables, with different threshold values. The TS is changed when taking these variables at different grids vertically and horizontally. It would be meaningful in the future to see how the TS changes with different lead times, vertical levels and thresholds of anomalies. The results of this TS analysis are a good reference for studies and operations involving NWP forecast data.
| Test | Best threshold | TS | Hit | Miss | False alarm |
| Exp_q' | q' ≥ 5.4 g kg?1 | 0.098 | 24 | 15 | 235 |
| Exp_z' | z' ≤ ?190 gpm | 0.068 | 20 | 19 | 254 |
| Exp_T ' | T ' ≥ 6.2 K | 0.092 | 17 | 22 | 146 |
| Exp_q'z' | q' ≥ 3.16 g kg?1, z' ≤ ?18 gpm | 0.104 | 16 | 23 | 115 |
| Exp_q'T ' | q' ≥ 2.28 g kg?1, T ' ≥ 7.88 K | 0.125 | 12 | 27 | 57 |
| Exp_q'z'T ' | q' ≥ 2.24 g kg?1, z' ≤ ?13 gpm, T ' ≥ 6.24 K | 0.140 | 13 | 26 | 54 |
Table1. Threat scores (TS) of identifying dense fog (visibility < 1000 m) by using a single variable of humidity anomaly (q'), GPH anomaly (z'), or temperature anomaly (T '), as well as combinations of anomalous variables: (q'z'), (q'T ') and (q'z'T ').
It is not easy to predict severe coastal fog episodes from traditional weather analysis because no obvious signals can be found. For this reason, we applied anomaly-based weather analysis, which can help extract signals of extreme fog episodes at the port, as analyzed in sections 4 and 5. The coastal fog process is due to lower-tropospheric moisture accumulation resulting from anomalous temperature inversion and anomalous southwesterly warm-moist advection, which is usually characterized by a 925-hPa warm-moist anomaly and formed by a positive GPH anomaly above and a negative GPH anomaly below. The positive anomaly of humidity is conducive to the formation of coastal fog, while its negative anomaly is of no benefit. Coastal fog at the port is usually formed at the moment when the southwesterly wind anomaly reverses to a northeasterly wind anomaly. The reversal pattern of vertical anomalous variables, such as a negative temperature anomaly in the lower troposphere, which corresponds to a negative GPH anomaly in the upper troposphere and a positive GPH anomaly near the surface, is not conducive to fog formation.
Previous case analyses show that rain with stratus clouds influences the visibility through the diurnal cycle. Without rain and stratus clouds, coastal fog will disappear in the afternoon locally, due to strengthening solar radiation (Zhang and Bao, 2008). However, coastal fog will become persistent if it is rainy and covered by stratus clouds. More coastal fog cases showed that the visibility depends upon low-level warm inversion, positive humidity anomalies, and a change from southwesterly to northeasterly wind anomalies, as well as rain and stratus clouds. Therefore, the prediction of rain, stratus clouds and anomalous atmospheric variables is a basis for predicting the formation of coastal fog. These results from statistical and large-sample analyses show that considering the combined effects of humidity, GPH and temperature anomalies in the lower troposphere is critical to indicate fog formation.
Anomaly-based weather analysis is, compared to traditional weather analysis, able to show the vertical structure of lower-tropospheric anomalous temperature inversion. In terms of anomaly-based weather analysis, the anomalous temperature inversion is a result of an upper-tropospheric high anomaly and a near-surface low anomaly. Vertically, the two GPH anomalies induce an anomalous warm center in the lower troposphere, as a result of the hydrostatic balance, which leads to the formation of severe or dense fog. Given the advantage of anomaly-based weather analysis, researchers and forecasters can extract severe fog events related to anomalous features from NWP forecast outputs, which can help to improve fog forecasts at lead times of several days. This confidence can be obtained from current medium-range NWP model products. As studied by Qian et al. (2013), anomalous weather systems, such as the convergence line of anomalous winds derived from the ECMWF model or EPS products in summer in eastern China, can be used to indicate local extreme rainfall at six to seven days in advance (Jiang et al., 2016). Similar application from the EPS products was also tested in this study.
Acknowledgments. The authors wish to thank the editor and anonymous reviewers, whose constructive suggestions greatly improved the manuscript. This study was financed by the National Natural Science Foundation of China (Grant No. 41775067).
Open Access This article is distributed under the terms ofthe Creative Commons Attribution License which permits anyuse, distribution, and reproduction in any medium, providedthe original author(s) and the source are credited.
