HTML
--> --> -->Fluctuating winds can make a significant contribution to the rates of transfer of atmospheric momentum, vorticity, and mechanical energy to the ocean (Esbensen and Reynolds, 1981; Marsden and Pond, 1983; Ledvina et al., 1993; Ponte and Rosen, 2004; Zhai et al., 2012; Zhai, 2013; Zhai and Wunsch, 2013; Wu et al., 2016; Lin et al., 2018), hence markedly influencing the ocean circulation. Additionally, high-frequency atmospheric forcing also has a significant influence on ocean heat and freshwater fluxes (Ledvina et al., 1993; Gulev, 1994; Hughes et al., 2012; Wu et al., 2016). For example, Wu et al. (2016) found that atmospheric fluctuations on time scales shorter than one month increase the wind stress derived from monthly mean winds by about 60% over the Southern Ocean (SO). Besides, this time scale of atmospheric variability also leads to enhanced evaporation in most of the global ocean and significantly alters the net freshwater flux. Moreover, Lin et al. (2018) assessed the contributions of different time scales of wind fluctuations (6 h?2 d, 2?8 d, and 8 d?1 yr) to the mean, variability, and trend of SO wind stress during the last four decades. They found that the wind fluctuations at the synoptic scale (2?8 d) strengthen the mean wind stress calculated based on annual mean winds by 40% and contribute significantly to the variability and trend of SO wind stress. However, their influences on SO circulation and Antarctic sea ice have not been quantified and need to be investigated systematically.
Previous investigations have documented the impacts of transient atmospheric variability on general ocean circulation (Condron and Renfrew, 2013; Jung et al., 2014; Holdsworth and Myers, 2015; Wu et al., 2016; Munday and Zhai, 2017). For example, Munday and Zhai (2017) found that increased wind stress caused by the variability of atmospheric winds is more important than that induced by strengthened mean winds in terms of the sensitivity of the SO circulation to changed wind stress. Also, Wu et al. (2016) found that when the atmospheric variability shorter than one month is excluded, the mechanical energy input to the global ocean and the oceanic eddy kinetic energy (EKE) could decrease by about 50%. The wind-driven subtropical gyre circulations can be weakened by 10%?15%. The Labrador Sea deep convection can be much less energetic, which results in a reduction of the Atlantic meridional overturning circulation (AMOC) by 55%. The reductions of horizontal gyre circulations and AMOC lead to a significant decrease in the northward maximum global heat transport by about 50%. The impacts of atmospheric variability found in Wu et al. (2016) on the air?sea fluxes and ocean circulation include contributions from both momentum and buoyancy fluxes. Yet, the different roles played by momentum and buoyancy fluxes associated with these transient atmospheric fluctuations require further studies. Also, the respective impacts of transient atmospheric variability on the time scales of 6 h?2 d, 2?8 d, and 8 d?1 month, on the air-sea fluxes and SO circulation, have not been addressed.
Furthermore, transient atmospheric forcing, such as cyclone activities and polar lows, affects the export of sea ice (St?ssel et al., 2018; Wei et al., 2019) and hence modulates the sea-ice volume (SIV), sea-ice extent (SIE), and sea-ice area (SIA). Both the thermal and dynamic effects of the atmospheric forcing can lead to significant sea-ice variability (Holland and Kwok, 2012; Hosking et al., 2013; Wang et al., 2014, 2019; Abernathey et al., 2016; Haumann et al., 2016; Doddridge and Marshall, 2017; Turner et al., 2017; St?ssel et al., 2018; Wei et al., 2019). For example, Holland and Kwok (2012) reported that the Antarctic sea-ice concentration (SIC) trends around West Antarctica are significantly influenced by surface winds, while sea-ice trends around East Antarctica are dominated by warm air advected from lower latitudes. Recently, Wang et al. (2019) showed that the significant reduction of Antarctic SIE and SIA from 2014 to 2016 was dominated by strong winds that led to enhanced northward sea-ice drift and melting at lower latitudes. It is believed that these wind-driven sea-ice drifts exerted strong freshwater forcing on the underlying ocean (e.g., Abernathey et al., 2016; Haumann et al., 2016).
It has long been known that Antarctic sea-ice simulations are sensitive to switching from monthly to daily forcing (Hibler and Ackley, 1983; St?ssel et al., 1990; St?ssel and Owens, 1992). However, these studies often used a sea-ice model that was coupled with a mixed-layer model, with the ocean dynamics not being resolved. Also, the relative effects of atmospheric variability on different time scales have not been addressed. In this paper, motivated by the lack of systematic studies on the impacts of atmospheric variability at different time scales shorter than one month on the SO circulation and Antarctic sea ice, we focus on the impacts of high-frequency atmospheric variability on the 6 h?2 d, 2?8 d, and 8 d?1 month time scales on the SO circulation and Antarctic sea ice using a high-resolution ocean?sea-ice coupled global model. Moreover, the different roles played by momentum and buoyancy fluxes induced by transient atmospheric fluctuations are also investigated.
In section 2, the model, experiment design, and methods are described. In section 3, the results are presented. Finally, concluding remarks are provided in section 4.
2.1. Model and experimental design
The model used here is MITgcm in the ECCO2 configuration (Marshall et al., 1997a,b ). For eliminating polar singularities, a cube?sphere grid projection is used in this model (Adcroft et al., 2004), which can give relatively smooth grid spacing throughout the domain. The horizontal grid interval is about 18 km, with 50 uneven vertical layers ranging from 10 m near the surface to 450 m near the bottom. A sea-ice model is coupled with the ocean component (Losch et al., 2010). The Green Function Approach is employed to diminish the model?data misfit by calibrating the initial temperature and salinity conditions, surface boundary conditions, background vertical diffusivity, critical Richardson numbers for the KPP scheme, and ice albedo (Menemenlis et al., 2005a, b, 2008). More details about the ECCO2 configuration can be found in Menemenlis et al. (2008) and Wu et al. (2016).Six simulations were conducted in this study. The control experiment (EXP-6H) was driven by six-hourly atmospheric forcing derived from the JRA-55 dataset from 1979 to 2012 with a spatial resolution of 1.125° × 1.125° (Kobayashi et al., 2015). The forcing used in EXP-6H included six-hourly net shortwave radiation and longwave radiation, 2-m air temperature, precipitation, 2-m humidity, and 10-m winds.
Atmospheric variability on the time scale of 2?8 d is related to baroclinic storm activities and synoptic weather systems (Trenberth, 1991; Inatsu and Hoskins, 2004; Yin, 2005; Lin et al., 2018). To differentiate the respective response of Antarctic sea ice and SO circulation to atmospheric forcing on the 6 h?2 d, 2?8 d, and 8 d?1 month time scales, the atmospheric variability shorter than one month was separated into these three time scales. A detailed description of the method can be found in Lin et al. (2018), and so we only provide a brief description here, as follows. Following the approach set out in Lin et al. (2018), we first applied a 2-d running mean, 8-d running mean, and monthly mean averaging to the original six-hourly JRA-55 dataset to filter out atmospheric fluctuations shorter than 2 d, 8 d, and one month, respectively. Atmospheric fluctuations at the 2?8 d time scale were calculated by taking the difference between the 2-d running mean and 8-d running mean atmospheric forcings. The 2?8 d filtered atmospheric variables were then obtained by removing the atmospheric fluctuations at 2?8 d from the original six-hourly atmospheric fields. Also, the 8 d?1 month filtered atmospheric variables were obtained by a similar approach. Once the filtered atmospheric variables has been obtained by excluding the fluctuations in the frequency bands of 6 h?2 d, 2?8 days, and 8 d?1 month, we then conducted three experiments (EXP-6H_2D, EXP-2D_8D, and EXP-8D_1M) by forcing the model using the filtered atmospheric variables, respectively. Hence, the impacts of atmospheric variability in different frequency bands, i.e., 6 h?2 d, 2?8 d, and 8 d?1 month, on the time-mean (last 10-year mean) air?sea fluxes can be identified by comparing the results from these three sensitivity experiments with those from EXP-6H.
Another sensitivity experiment was conducted by forcing the model using the monthly mean winds and six-hourly other atmospheric variables (EXP-MW). Comparing the differences between EXP-6H and EXP-MW with those between EXP-6H and EXP-MON [obtained by using monthly mean winds and other atmospheric variables; see Wu et al. (2016)], we can examine if the impacts of high-frequency wind fluctuations on the SO and Antarctic sea ice are larger than those of atmospheric thermodynamic variable fluctuations. These six simulations were initialized with the same conditions and run for 34 years from 1979 to 2012. Unless otherwise stated, we analyze the means for the last 10 years (2003?12), using the monthly mean output for ocean temperature and salinity, 5-d mean output for ocean currents, and daily output for sea-ice variables. The details of these experiments are summarized in Table 1.
| Experiment | Atmospheric fluctuations | |||
| 6 h?2 d | 2?8 d | 8 d?1 month | > 1 month | |
| EXP-6H | Included | Included | Included | Included |
| EXP-6H_2D | Excluded | Included | Included | Included |
| EXP-2D_8D | Included | Excluded | Included | Included |
| EXP-8D_1M | Included | Included | Excluded | Included |
| EXP-MON | Excluded | Excluded | Excluded | Included |
| EXP-MW | Excluded in 10-m winds; included in other atmospheric variables | Included | ||
Table1. Summary of numerical experiments.
2
2.2. Diagnostic methods
The wind power input (WPI) to the ocean was calculated aswhere the overbar represents the mean of the last 10 years (2003?2012), U is the ocean surface velocity, and τ is the ocean surface wind stress. The oceanic mean kinetic energy (MKE) and EKE used here were calculated by
and
where u and v are the surface ocean zonal velocity and meridional velocity, the overbar represents the mean of the last 10 years, and the prime represents the departure from this mean. Similarly, the MKE and EKE of sea ice were calculated as
and
where uice and vice are the zonal and meridional sea-ice velocities, where the overbar represents the mean of the last 10 years, and the prime is the departure from this mean. Following Downes et al. (2009) and Liu et al. (2017), the buoyancy flux (B0) is defined as,
where


3.1. Air?sea fluxes
Atmospheric fluctuations are important for turbulent fluxes (Zhai et al., 2012; Zhai and Wunsch, 2013; Jung et al., 2014; Holdsworth and Myers, 2015; Wu et al., 2016). Figure 1a presents the horizontal distribution of the time-mean wind stress in EXP-6H. This spatial pattern of the time-mean wind stress is similar to those in EXP-6H_2D, EXP-2D_8D, EXP-8D_1M, EXP-MW, and EXP-MON (not shown), but the magnitude in EXP-6H is much larger than that in the other experiments, particularly in the Antarctic Circumpolar Current (ACC) region where the high-frequency wind fluctuations are large. The impact of atmospheric variability at 6 h?2 d on the time-mean wind stress is more pronounced in the region between 60°W and 120°E (Fig. 1b). The 2?8 d wind fluctuations, however, dominate the wind stress increase between EXP-6H and EXP-MON (Figs. 1c and e), with the contribution of 8 d?1 month wind fluctuations being small (Fig. 1d). Unsurprisingly, the difference in the time-mean wind stress between EXP-6H and EXP-MON is mainly induced by the wind fluctuations (Figs. 1e and f). Averaged over the SO (latitudinal band of 40°?70°S), the mean wind stress increases significantly from 0.06 N m?2 in EXP-MON to 0.1 N m?2 in EXP-6H, with a relative increase of about 66.7% to the result in EXP-MON. The contributions of the atmospheric variability on the 6 h?2 d, 2?8 d, and 8 d?1 month time scales are 38%, 60%, and 2% of the increase between EXP-6H and EXP-MON, respectively. These results indicate that the impact of high-frequency atmospheric phenomena shorter than one month on the wind stress is mainly attributable to the synoptic (2?8 d) and higher (6 h?2 d) frequency atmospheric variability.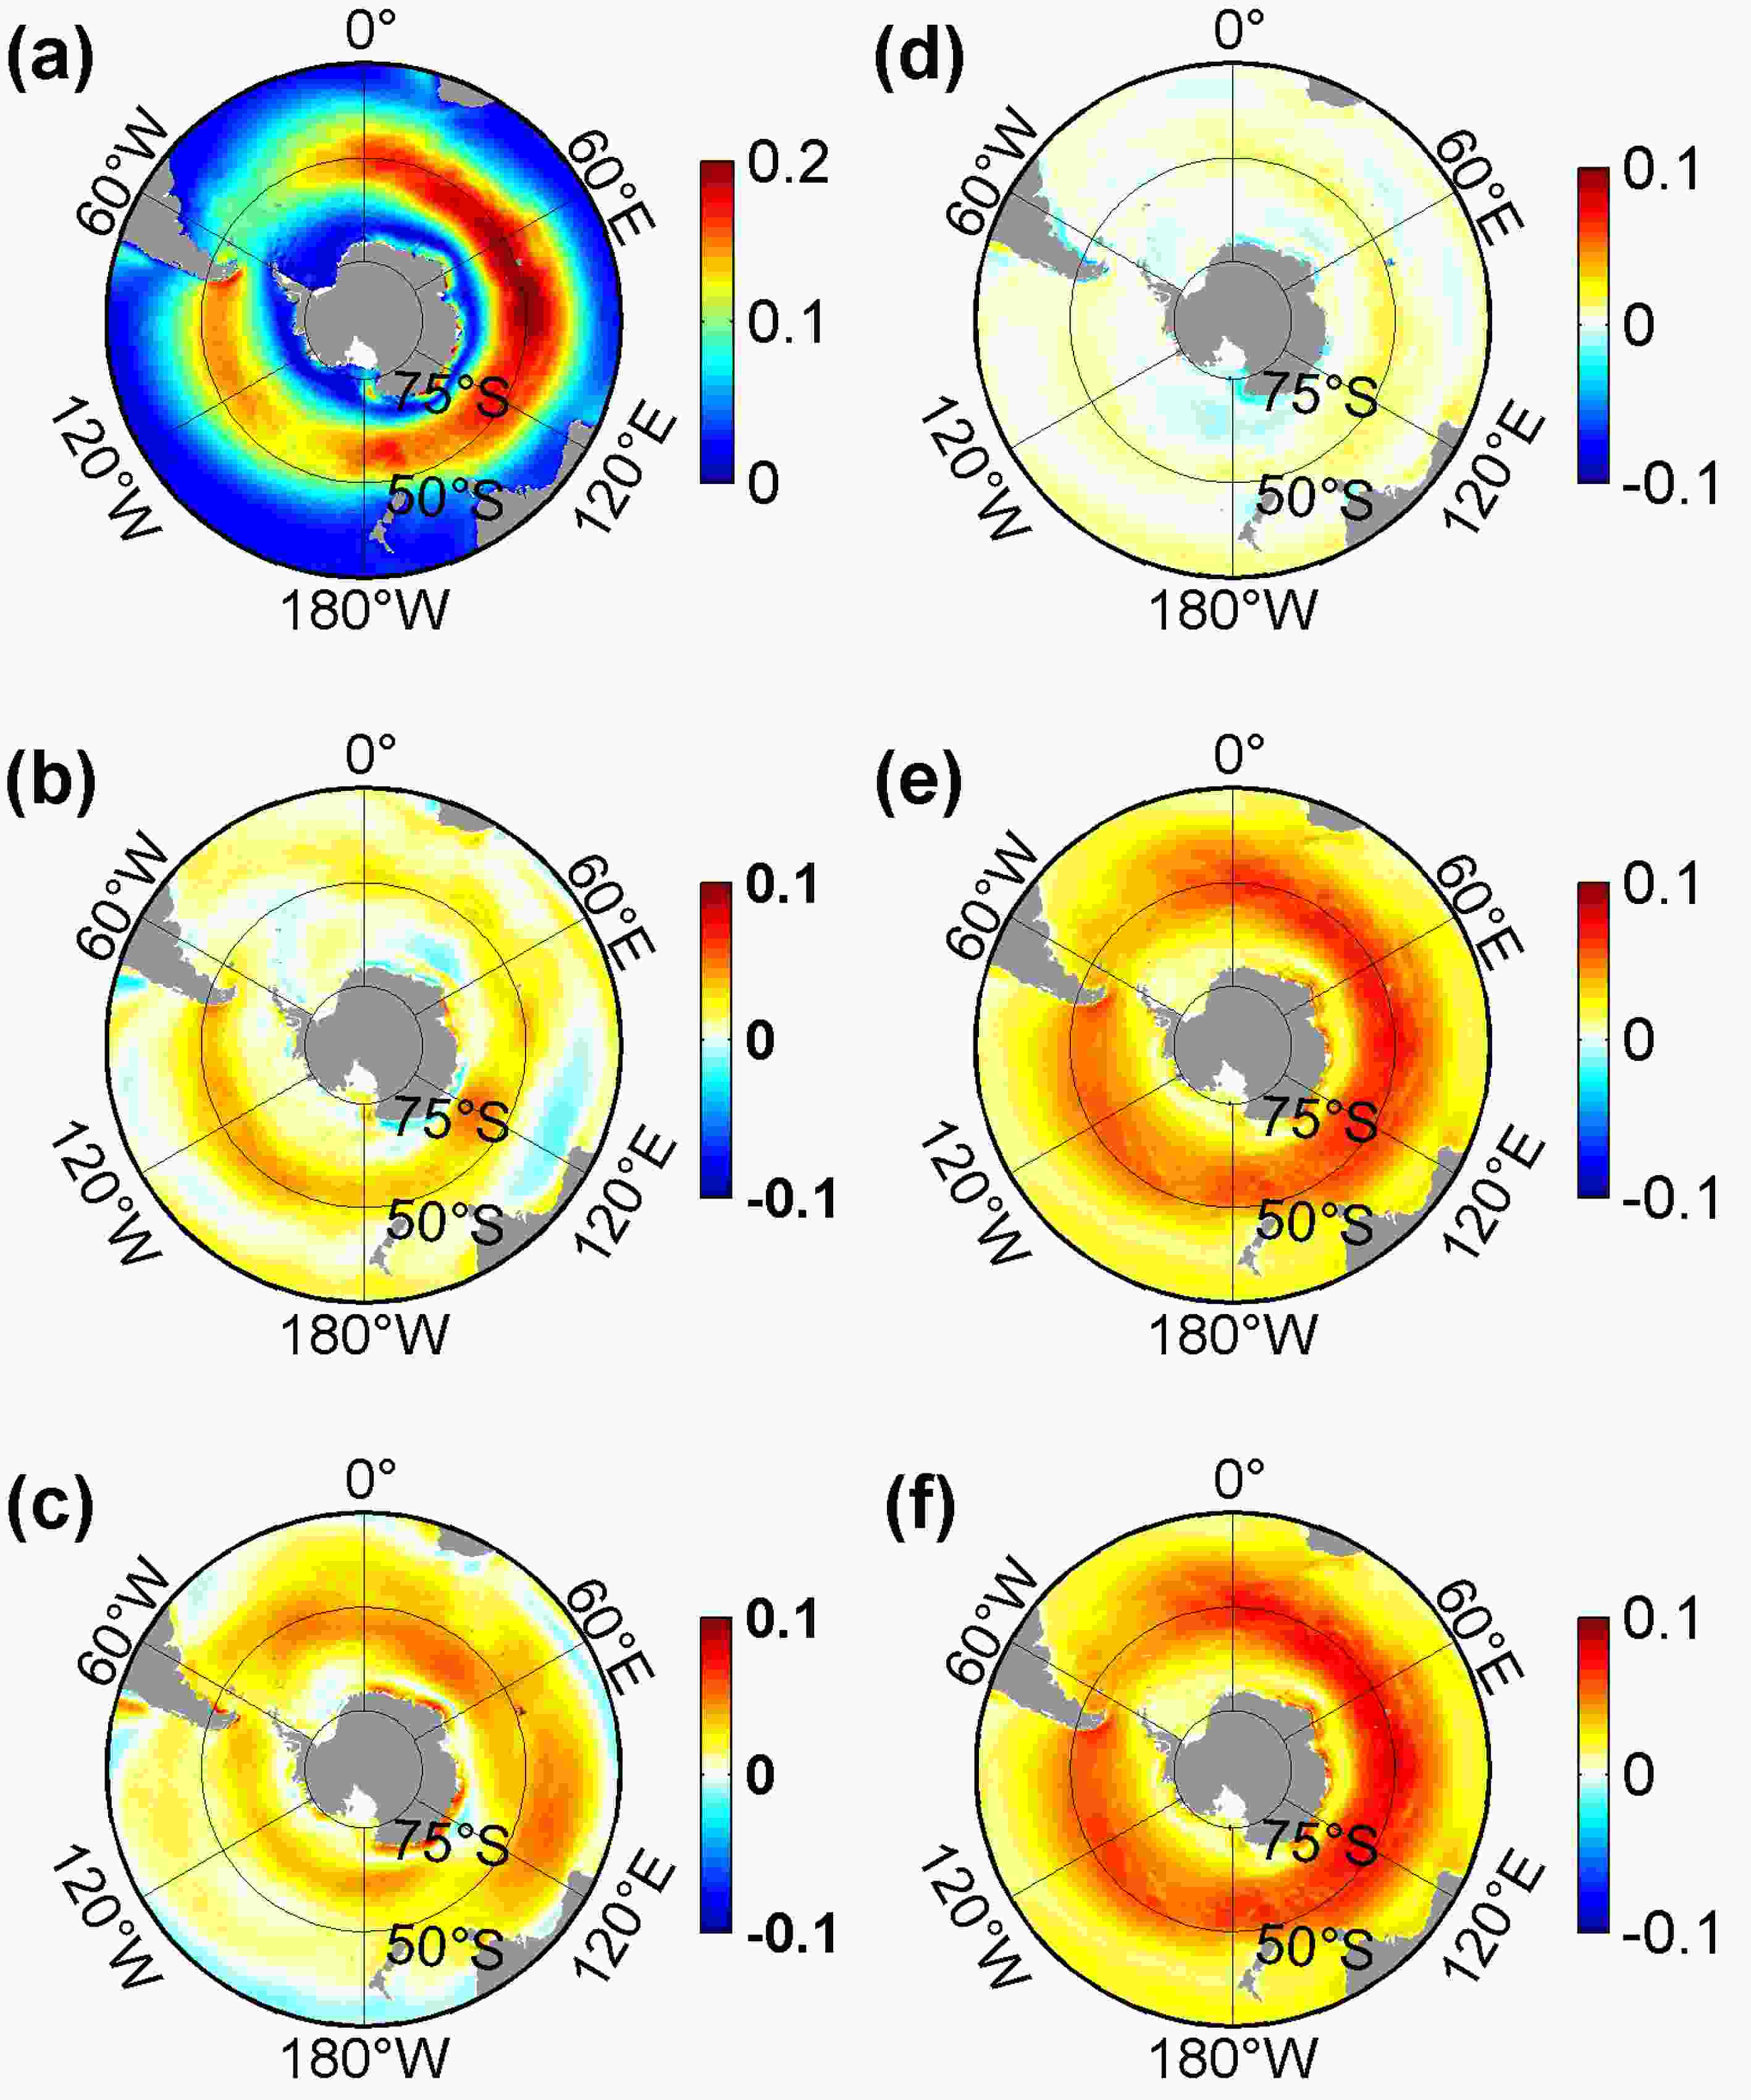 Figure1. Distributions of time-averaged wind stress (units: N m?2) in (a) EXP-6H, and the differences between the indicated simulations: (b) EXP-6H minus EXP-6H_2D; (c) EXP-6H minus EXP-2D_8D; (d) EXP-6H minus EXP-8D_1M; (e) EXP-6H minus EXP-MON; (f) EXP-6H minus EXP-MW. Note the different scales in the color bars.
The enhancement of the mean wind stress by high-frequency atmospheric phenomena has important impacts on the mean wind stress curl over the SO circulation. As expected, the magnitude of the mean wind stress curl decreases almost everywhere when the high-frequency winds are removed (Fig. 2a). The magnitude of area-averaged mean wind stress curl south of 55°S changes from ?6.0 × 10?8 N m?3 in EXP-6H to ?2.1 × 10?8 N m?3 in EXP-MON, indicating more cyclonic wind forcing in EXP-6H than in EXP-MON. The contributions of the atmospheric variability on the 6 h?2 d, 2?8 d, and 8 d?1 month time scales are 22%, 72%, and 6% of the increase between EXP-6H and EXP-MON, respectively. Additionally, when the high-frequency atmospheric variability is included, the detailed structure is more visible in EXP-6H than in the other experiments (not shown).
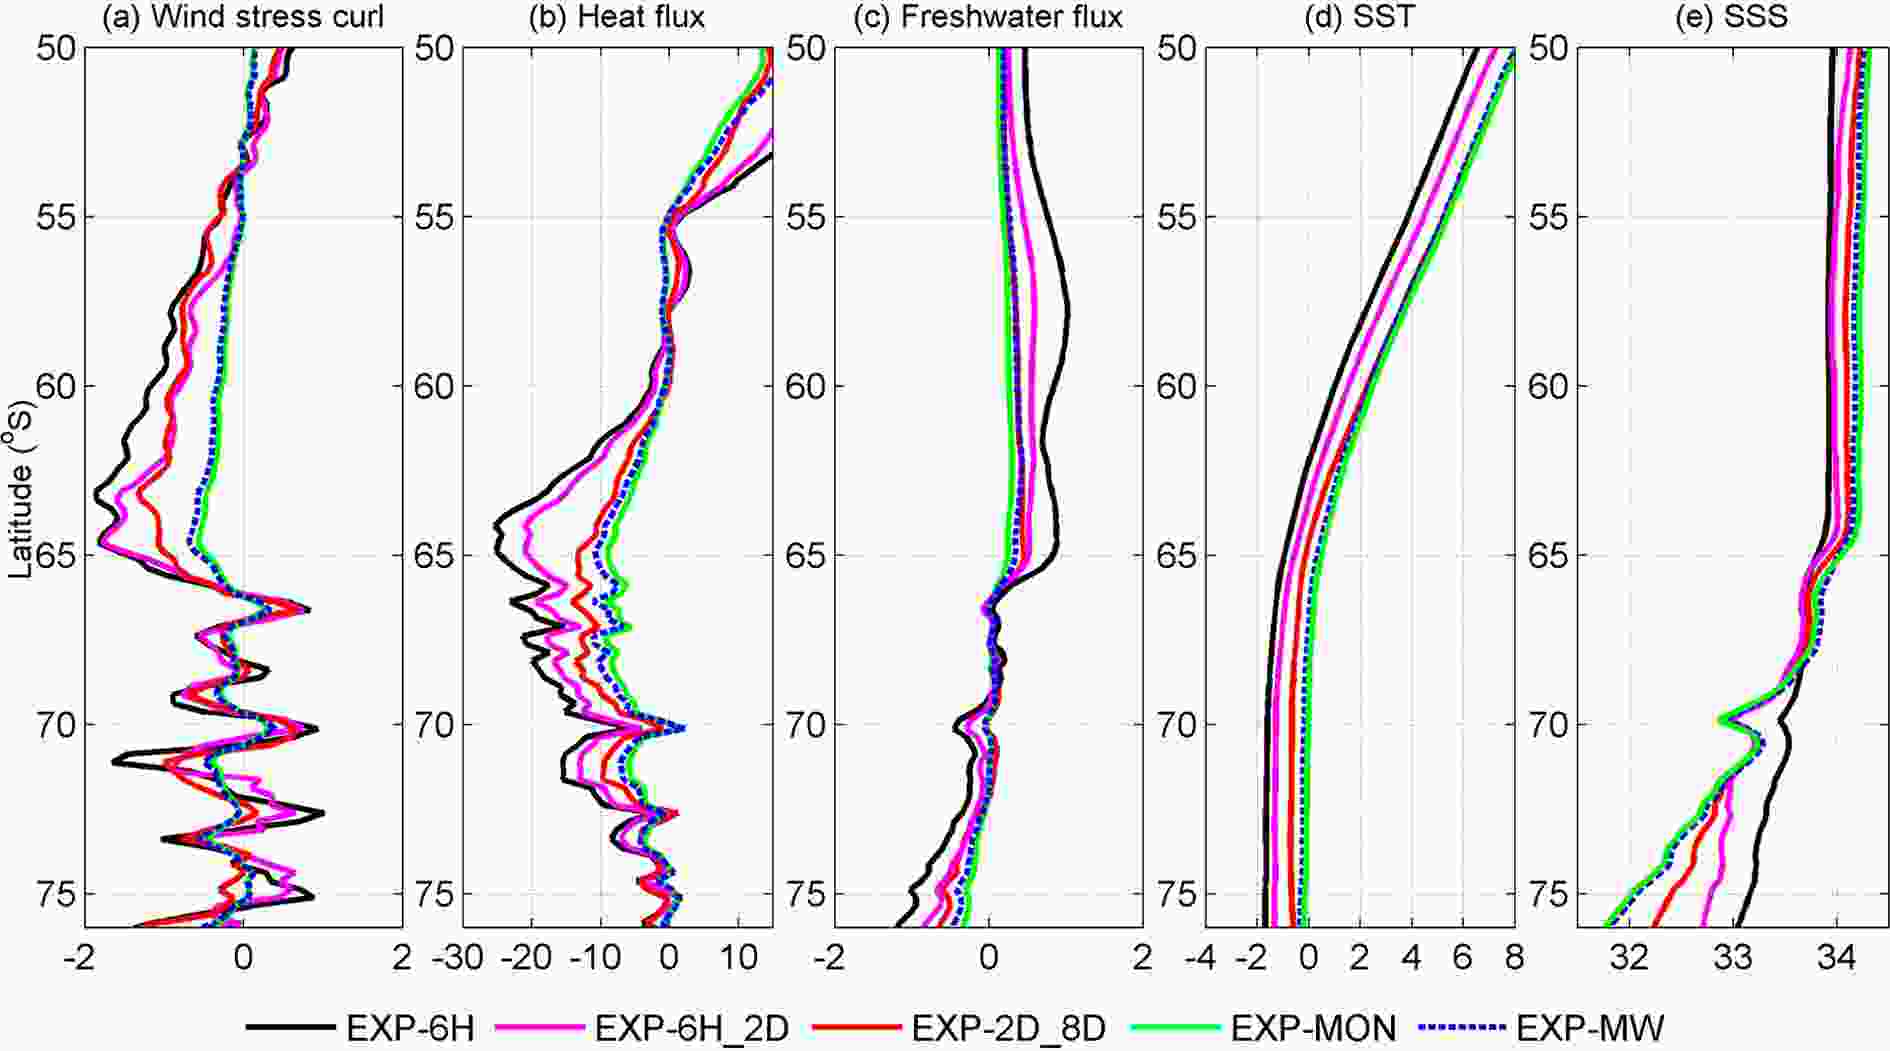 Figure2. Meridional distribution of the time-averaged and zonal-mean (a) wind stress curl (units: 10?7 N m?3), (b) net heat flux (units: W m?2), (c) freshwater flux (units: 10?4 kg m?2 s?1), (d) SST (units: °C), and (e) SSS (units: psu) in the indicated simulations.
The zonal-mean net heat fluxes of these simulations are presented in Fig. 2b. The heat fluxes in these simulations are characterized by heat loss around Antarctica and heat gain at low latitudes. The atmospheric variability on the 6 h?2 d and 2?8 d time scales leads to much more pronounced heat losses at high latitudes and heat gains at low latitudes, which are important for sea-ice freezing/melting and the subsequent transformation of water mass in the upper layer in the SO (Abernathey et al., 2016), in contrast to the situations caused by fluctuations at 8 d?1 month. Averaged over the region south of 60°S, the magnitude of net heat flux increases from 3.9 W m?2 in EXP-MON to 4.3 W m?2, 9 W m?2, and 11 W m?2 in EXP-2D_8D, EXP-6H_2D, and EXP-6H, respectively. Changes in heat flux between EXP-6H and EXP-MON at higher latitudes are mainly attributable to 2?8 d atmospheric variability, and the wind fluctuations play a dominant role (Fig. 2b).
Figure 2c shows the zonal-mean freshwater fluxes in these simulations. The patterns of these profiles are similar, characterized by a large net freshwater input (positive values) to the north of 65°S and freshwater loss (negative values) to the south of 69°S. The significant differences between them are in the sea-ice-covered region where sea-ice melting/freezing dominates the freshwater flux (Fig. 2c). The averaged freshwater flux over the region south of 65°S decreases from 5.7 × 10?5 kg m?2 s?1 in EXP-6H to 3.6 × 10?5 kg m?2 s?1, 2.1 × 10?5 kg m?2 s?1 and 1.6 × 10?5 kg m?2 s?1 in EXP-6H_2D, EXP-2D_8D, and EXP-MON, respectively, indicating that atmospheric variability on the 6 h?2 d and 2?8 d time scales is mainly responsible for the freshwater flux change, which is associated with sea-ice melting/freezing (see section 3.3). Also, wind fluctuations play a dominant role (Fig. 2c).
2
3.2. WPI and kinetic energy
The WPI is considered as a vital transition of the atmospheric kinetic energy to the ocean, affecting the ocean stratification and its circulation (Wunsch and Ferrari, 2004; Ferrari and Wunsch, 2009). The spatial distributions of the WPI rate in these simulations are similar to those in previous investigations (Wunsch, 1998; Huang et al., 2006; Hughes and Wilson, 2008; Scott and Xu, 2009; Roquet et al., 2011; Zhai et al., 2012; Zhai, 2013; Wu et al., 2016, 2017a, b), with large mechanical energy entering into the ACC region (Fig. 3a). Over the ACC region, the WPI rate in EXP-6H (Fig. 3a) is much larger than those in the experiments with high-frequency variability being filtered (Figs. 3b-f). Some negative values exist in the regions where the direction of surface currents is opposite to that of the wind stress—for example, in the Agulhas Current region. Integrated over the region south of 30°S, the total WPI rates into the ocean increase from about 0.4 TW (1 TW = 1012 W) in EXP-MON to 1.9 TW in EXP-6H. The increases of about 0.5 TW and 0.8 TW are induced by the high-frequency atmospheric forcing on the 6 h?2 d and 2?8 d time scales, respectively, indicating a more dominant contribution from the atmospheric variability at 2?8 d to the increase in the WPI rate (Figs. 3b and c). Additionally, the wind fluctuations that are shorter than one month explain almost all the WPI increase between EXP-MON and EXP-6H (Figs. 3e and f).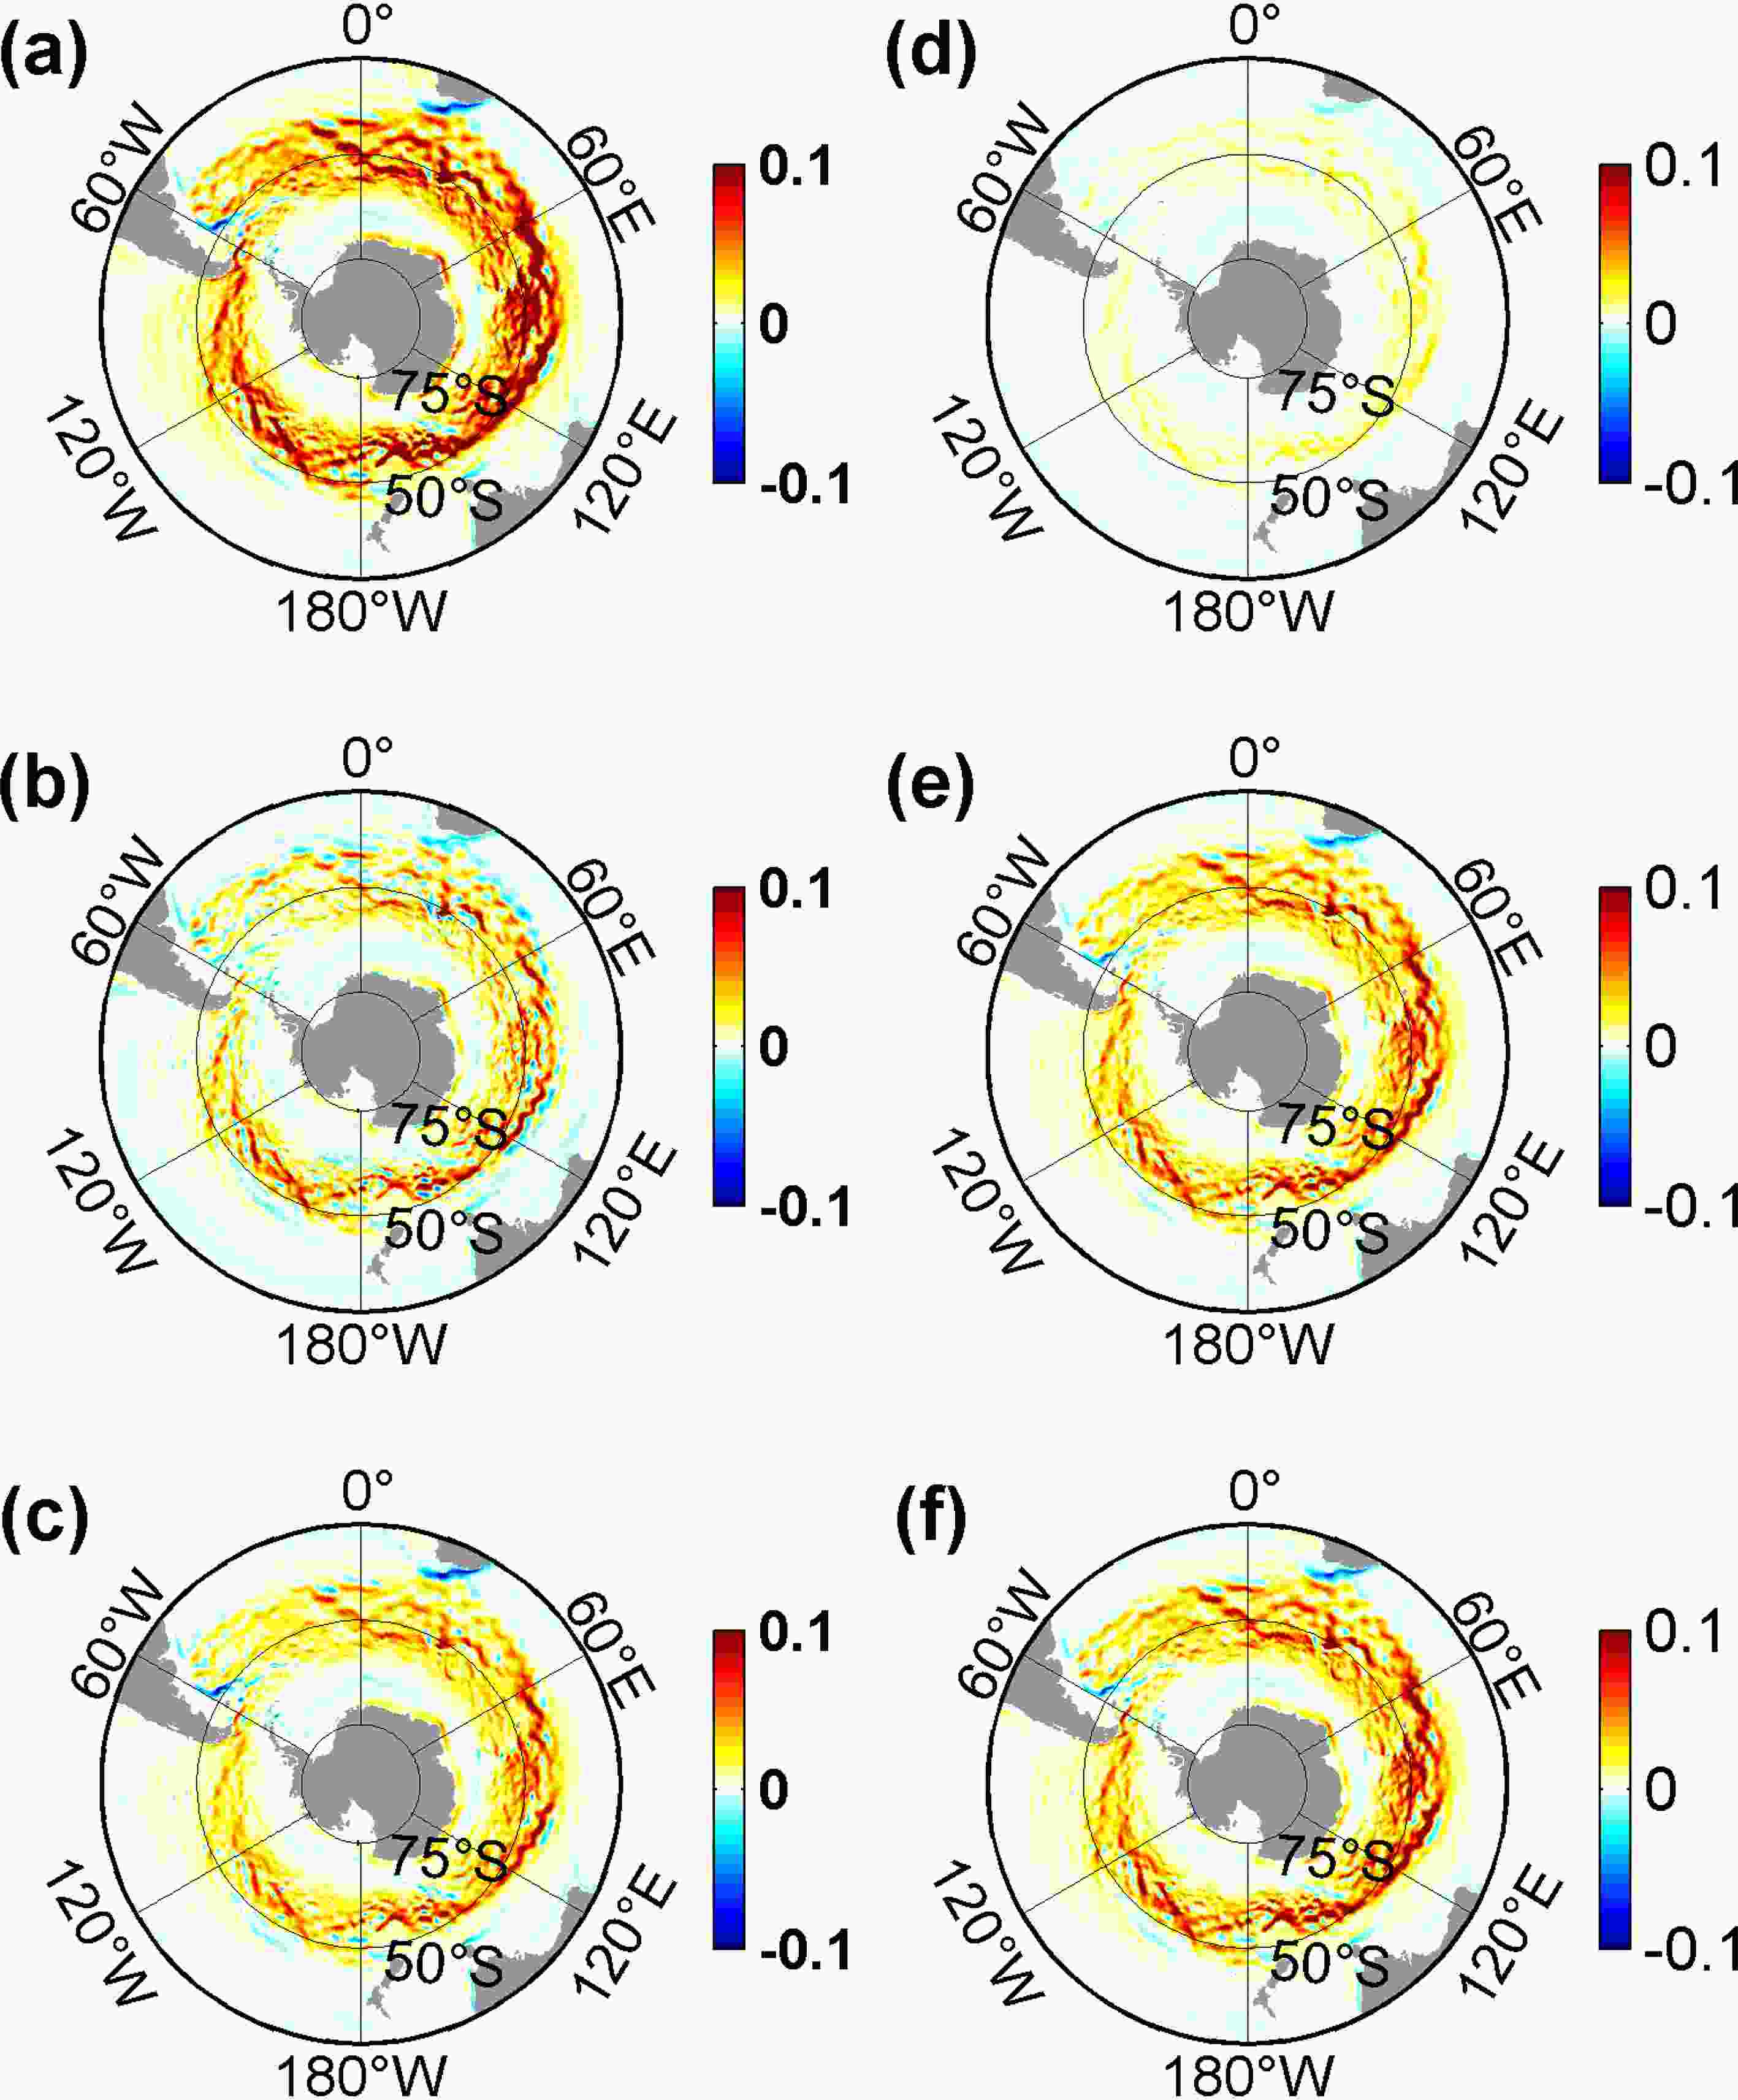 Figure3. Distributions of time-averaged wind power input rates (units: W m?2) in (a) EXP-6H, and the differences between the indicated simulations: (b) EXP-6H minus EXP-6H_2D; (c) EXP-6H minus EXP-2D_8D; (d) EXP-6H minus EXP-8D_1M; (e) EXP-6H minus EXP-MON; (f) EXP-6H minus EXP-MW.
The enhanced eddy generation by the mean flow instabilities releases most of the increased mechanical energy input to the general ocean circulation (Gill et al., 1974; Wunsch, 1998; Zhai and Wunsch, 2013; Wu et al., 2017b). Hence, a decrease in EKE is expected when the transient atmospheric phenomena were excluded in the sensitivity experiments. Figure 4a presents the spatial pattern of surface EKE in EXP-6H, which is similar to those in the other experiments (not shown). These simulations have very similar patterns to that in a previous investigation (Wu et al., 2017b), with large values in the Agulhas retroflection and the ACC regions (Fig. 4a). As expected, when the high-frequency atmospheric variability is excluded, the EKE decreases broadly, particularly in the Agulhas retroflection and the ACC regions. The impact of atmospheric variability on the 6 h?2 d time scale on the EKE is more scattered, particularly in the ACC region (Fig. 4b), in contrast to a broad increase caused by the 2?8 d atmospheric fluctuations (Fig. 4c). In general, the impact of atmospheric variability on the 8 d?1 month time scale on the EKE is weak, except for the Agulhas Current region (Fig. 4d).
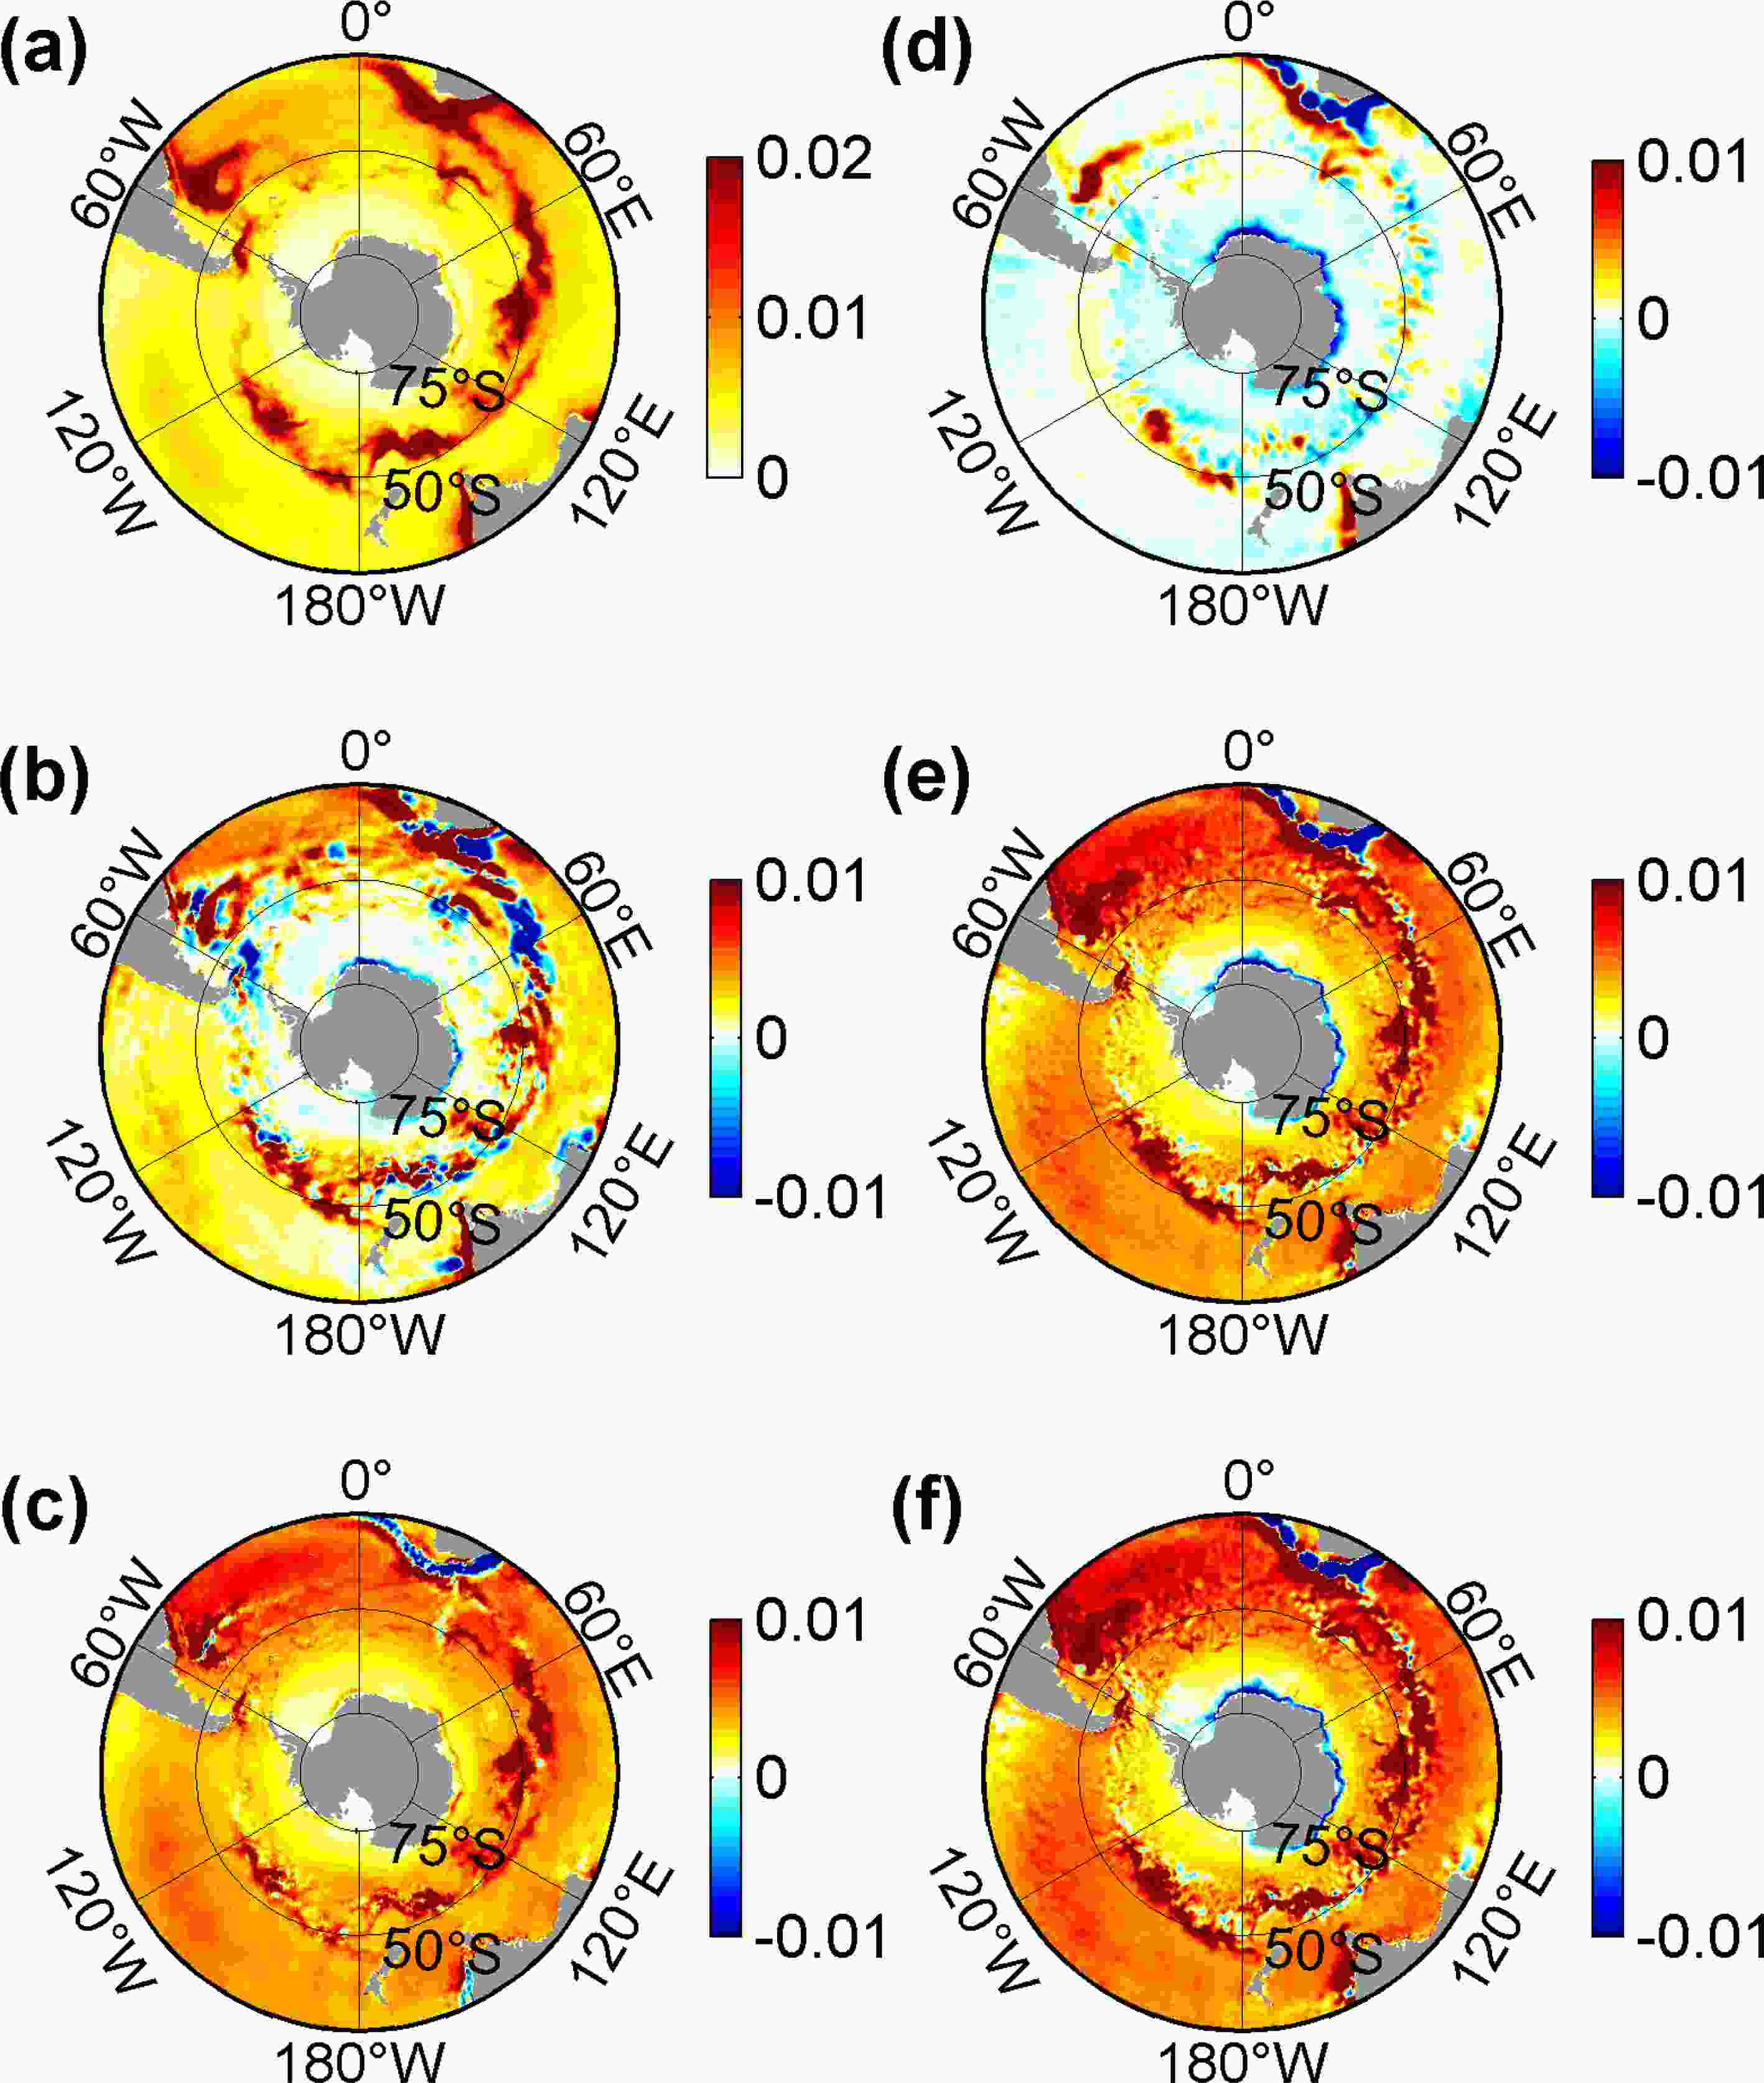 Figure4. Distributions of time-averaged surface EKE (units: m2 s?2) in (a) EXP-6H, and the differences between the indicated simulations: (b) EXP-6H minus EXP-6H_2D; (c) EXP-6H minus EXP-2D_8D; (d) EXP-6H minus EXP-8D_1M; (e) EXP-6H minus EXP-MON; and (f) EXP-6H minus EXP-MW. Note the different scales in the color bars.
The volume-integrated EKE over the SO increases from 3 × 10¹¹ m5 s?2 in EXP-MON to 8 × 10¹¹ m5 s?2 in EXP-6H. About 1.5 × 10¹¹ m5 s?2 and 2.9 × 10¹¹ m5 s?2 of the increases are induced by the atmospheric variability on the time scales of 6 h?2 d and 2?8 d, respectively. These results indicate a more dominant role played by the atmospheric variability of 2?8 d in generating the EKE in the SO. Furthermore, the similar EKE differences between EXP-6H and EXP-MON, and EXP-6H and EXP-MW, in a broad region (Figs. 4e and f), indicate that the EKE increase from EXP-MON to EXP-6H is primarily induced by the wind fluctuations. When the high-frequency atmospheric variability is included, the MKE increases almost everywhere (not shown), owing to the enhanced MKE generation by the increased mean wind stress. Integrated over the SO, MKE increases from 1 × 10¹¹ m5 s?2 in EXP-MON to 4 × 10¹¹ m5 s?2 in EXP-6H, with about 1 × 10¹¹ m5 s?2 and 1.5 × 10¹¹ m5 s?2 of the MKE increase being caused by the high-frequency atmospheric forcing on the 6 h?2 d and 2?8 d time scales, respectively.
2
3.3. Antarctic sea ice
Figures 5a and b present the monthly mean total Antarctic SIA and SIE in the simulations. The SIA and SIE are much larger in EXP-6H than those in the other simulations with high-frequency atmospheric variability being filtered (Figs. 5a and b). Actually, SIC increases almost everywhere when the transient atmospheric activities are included in EXP-6H, except for the coastal region and the region around the Antarctic Peninsula where there is a slight decrease (not shown). As a whole, the time-mean SIA in September decreases from 1.5 × 10⁷ km2 in EXP-6H to 1.2 × 10⁷ km2, 1.3 × 10⁷ km2, and 1.0 × 10⁷ km2 in EXP-6H_2D, EXP-2D_8D, and EXP-MON, respectively. Similarly, the time-mean SIE in September decreases from 1.9 × 10⁷ km2 in EXP-6H to 1.5 × 10⁷ km2, 1.7 × 10⁷ km2, and 1.2 × 10⁷ km2 in EXP-6H_2D, EXP-2D_8D, and EXP-MON, respectively; and the total SIV decreases from 12.2 × 10³ km3 in EXP-6H to 10.6 × 10³ km3, 10.1 × 10³ km3, and 8.3 × 10³ km3 in EXP-6H_2D, EXP-2D_8D, and in EXP-MON. These results show that the Antarctic SIE and SIA are more influenced by 6 h?2 d atmospheric variability than by 2?8 d variability. The effect of 2?8 d atmospheric phenomena is, however, just slightly larger than that of 6 h?2 d atmospheric phenomena on SIV, in contrast to the effects of high-frequency atmospheric variability on wind stress. The significant increases of SIA, SIE, and SIV in EXP-6H are attributable to the enhanced sea-ice formation induced by the higher heat loss (Fig. 5c), lower SST (Fig. 2d), and by the enhanced sea-ice transport induced by the larger air?ice stress (Fig. 5d), as analyzed below.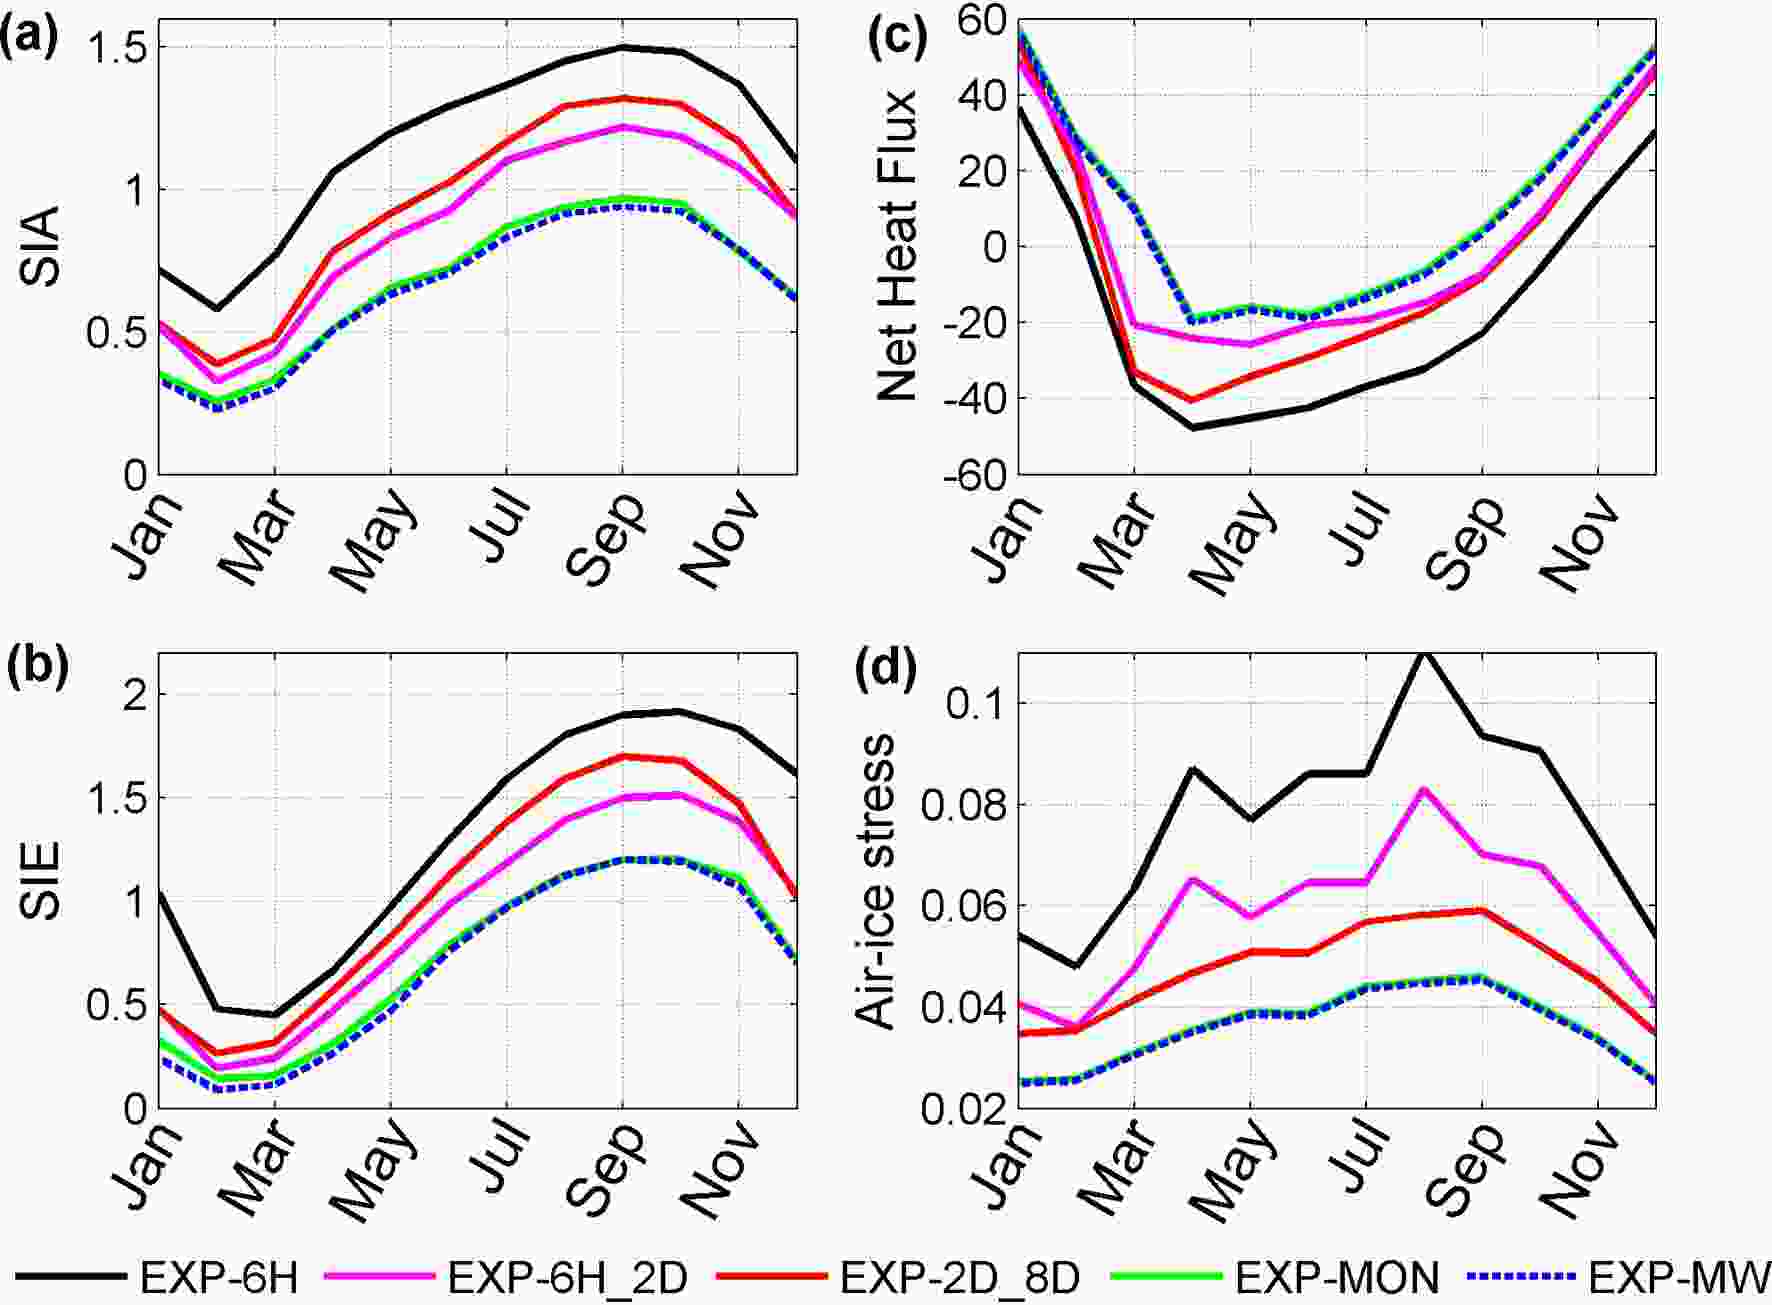 Figure5. Simulated monthly (a) total Antarctic SIA (units: 107 km2) and (b) total SIE (units: 107 km2) in the indicated simulations. (c, d) As in (a, b) but for net heat flux (units: W m?2) and air?ice stress (units: N m?2) over the sea-ice-covered region.
Larger air?ice stress causes stronger sea-ice drift in EXP-6H than in the other simulations, manifested by the larger MKE and EKE of sea ice (Figs. 6 and 7). In all simulations, large magnitudes of sea-ice MKE appear in the areas close to Antarctica and the sea-ice edge (Figs. 6a-d). Unsurprisingly, when the high-frequency atmospheric variability is included, the sea-ice MKE increases along the coast and in the marginal ice zone (Figs. 6e-g). The area-integrated sea-ice MKE over the sea-ice-covered regions decreases from 2.9 × 10¹¹ m4 s?2 in EXP-6H to 2.1 × 10¹¹ m4 s?2, 2.0 × 10¹¹ m4 s?2, 2.8 × 10¹¹ m4 s?2, 1.1 × 10¹¹ m4 s?2, and 1.0 × 10¹¹ m4 s?2 in EXP-6H-2D, EXP-2D_8D, EXP-8D_1M, EXP-MON, and EXP-MW, respectively. The high-frequency atmospheric forcing at 6 h?2 d and 2?8 d causes 44% and 50% of the difference between EXP-MON and EXP-6H. In addition, sea-ice transport also increases significantly, especially in the Weddell and Ross seas and the regions around Antarctica (Figs. 6e-g). The contribution of atmospheric fluctuations at 6 h?2 d to the change in the sea-ice drift between EXP-6H and EXP-MON is comparable with that induced by the 2?8 d atmospheric fluctuations (Figs. 6e and f). The difference between EXP-6H and EXP-MON is mainly induced by the high-frequency wind fluctuations (Figs. 6g and h), while the contribution of high-frequency thermodynamic fluctuations is negligible.
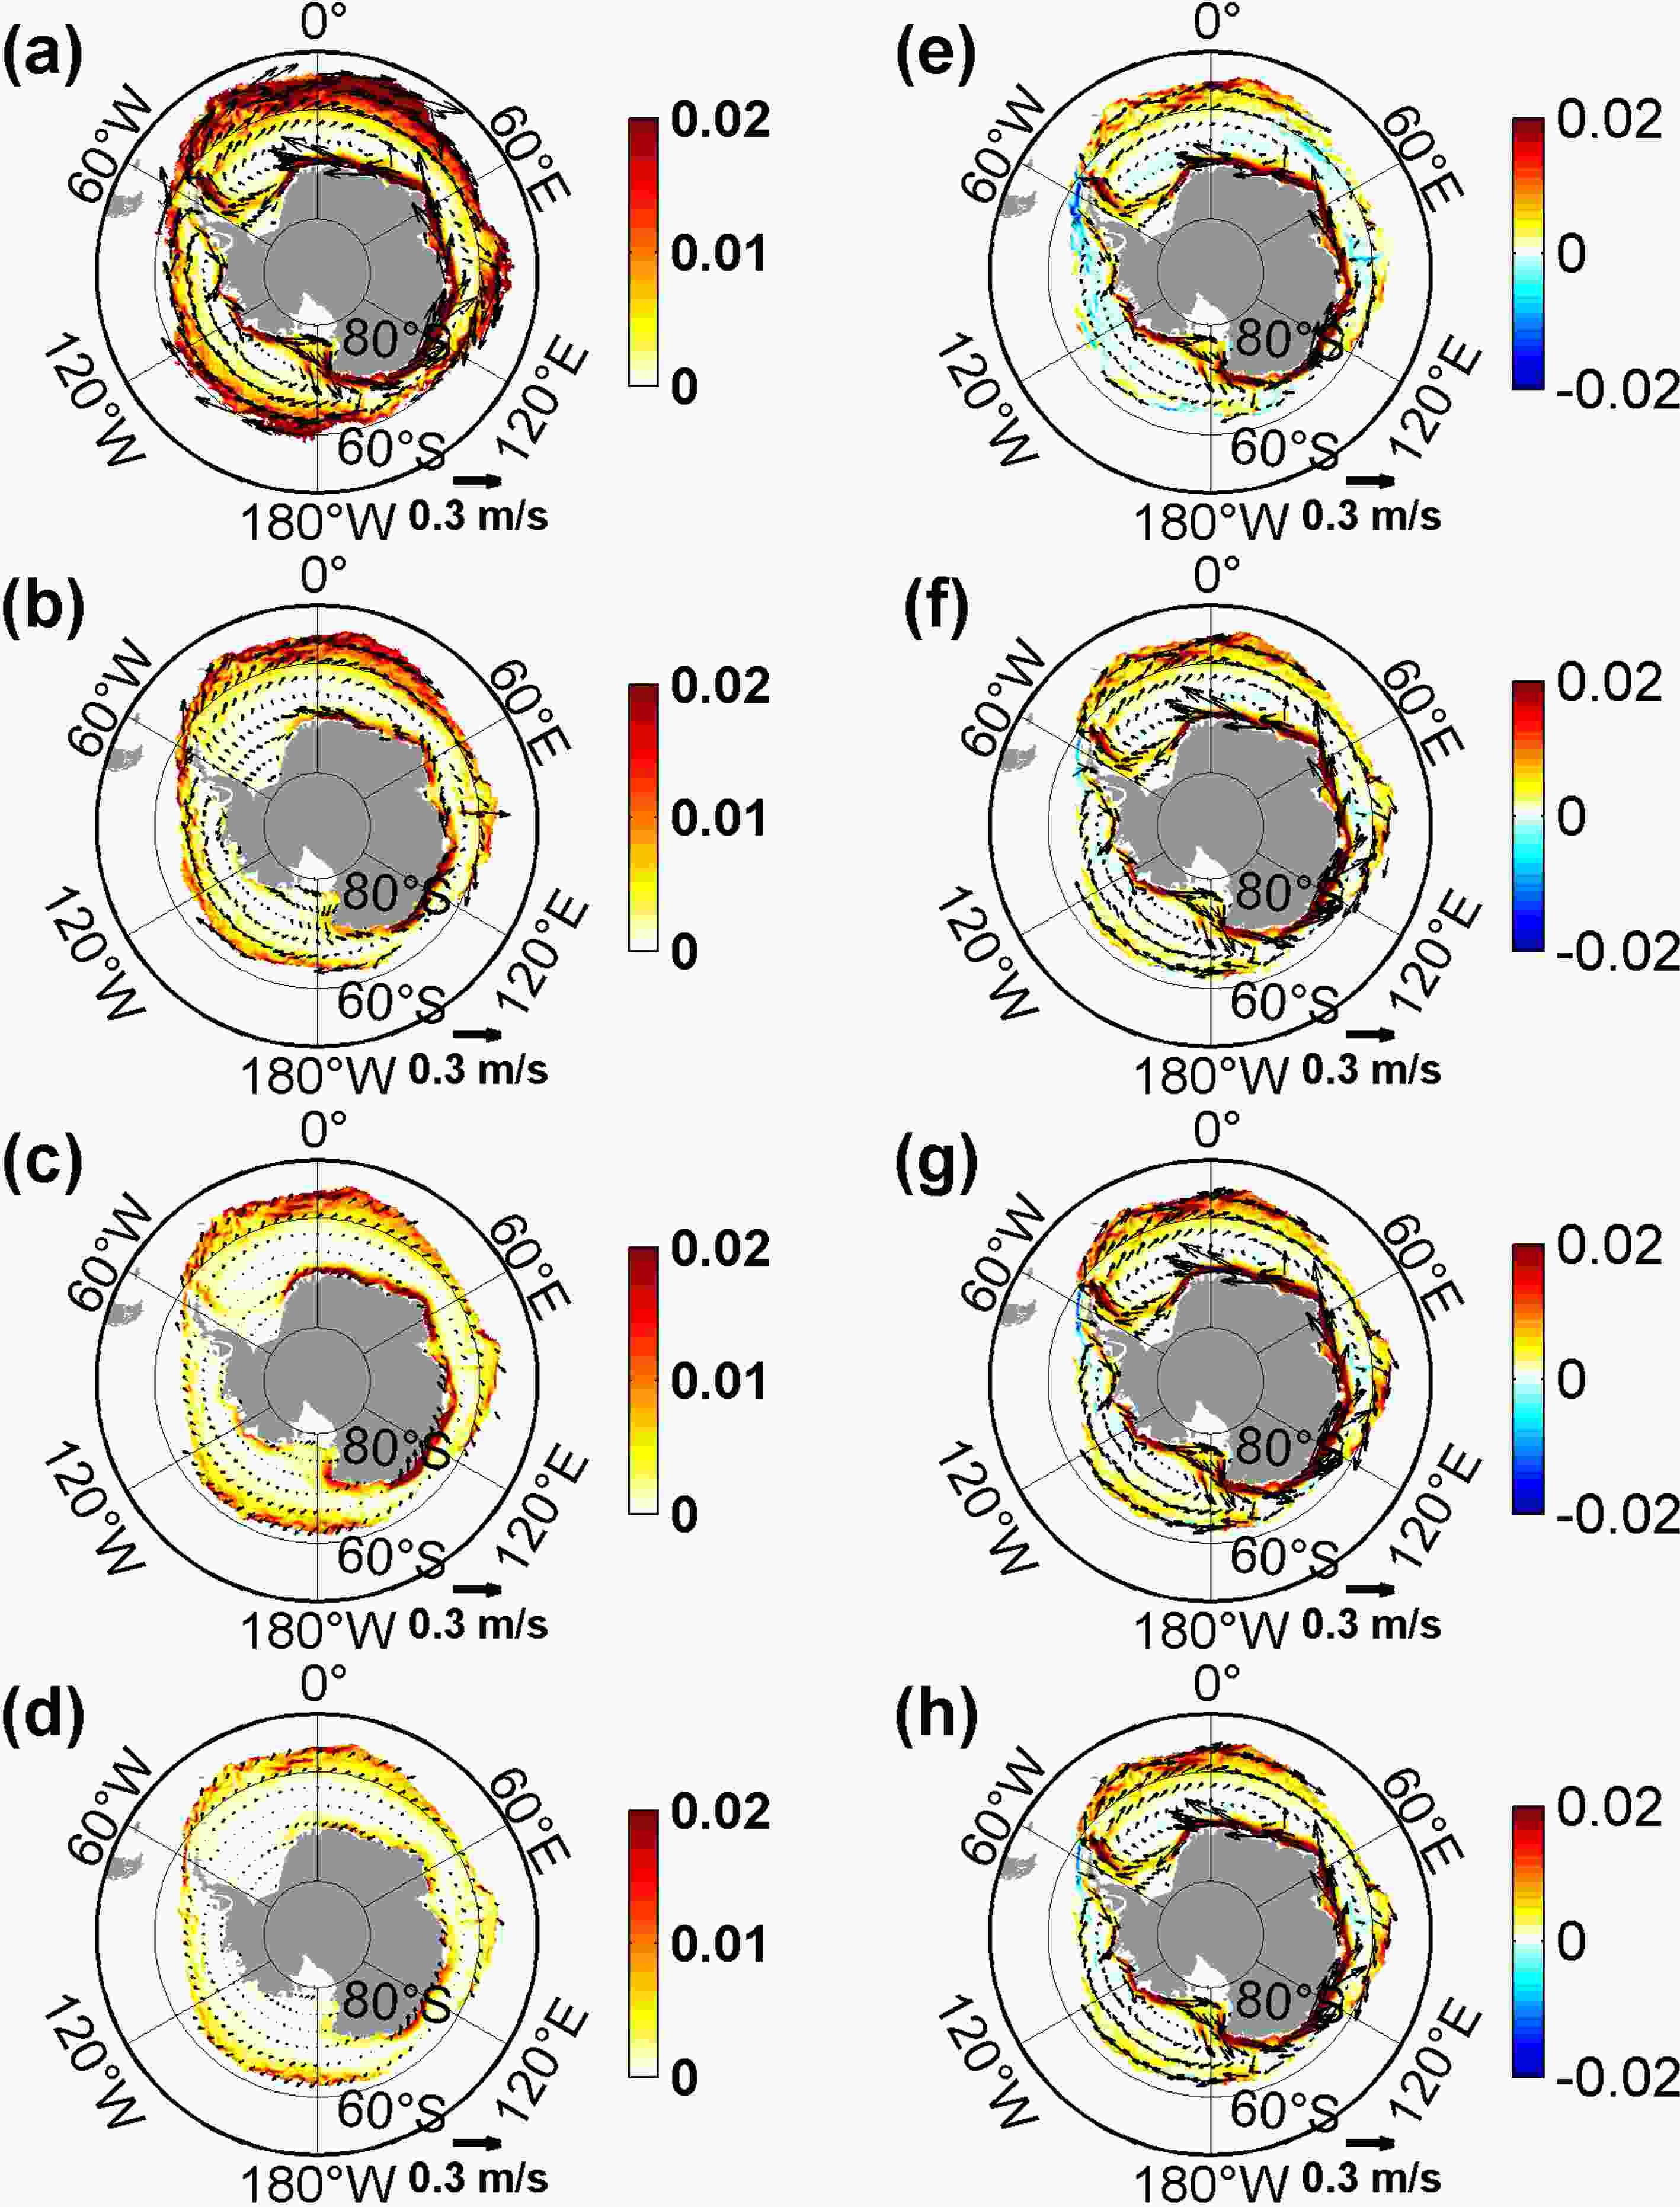 Figure6. Distributions of time-averaged sea-ice MKE (units: m2 s?2; color shading) and drift (vectors) in (a) EXP-6H, (b) EXP-6H_2D, (c) EXP-2D_8D, and (d) EXP-MON, and their differences between these simulations in (e) EXP-6H minus EXP-6H_2D, (f) EXP-6H minus EXP-2D_8D, (g) EXP-6H minus EXP-MON, and (h) EXP-6H minus EXP-MW. Note the different scales in the color bars.
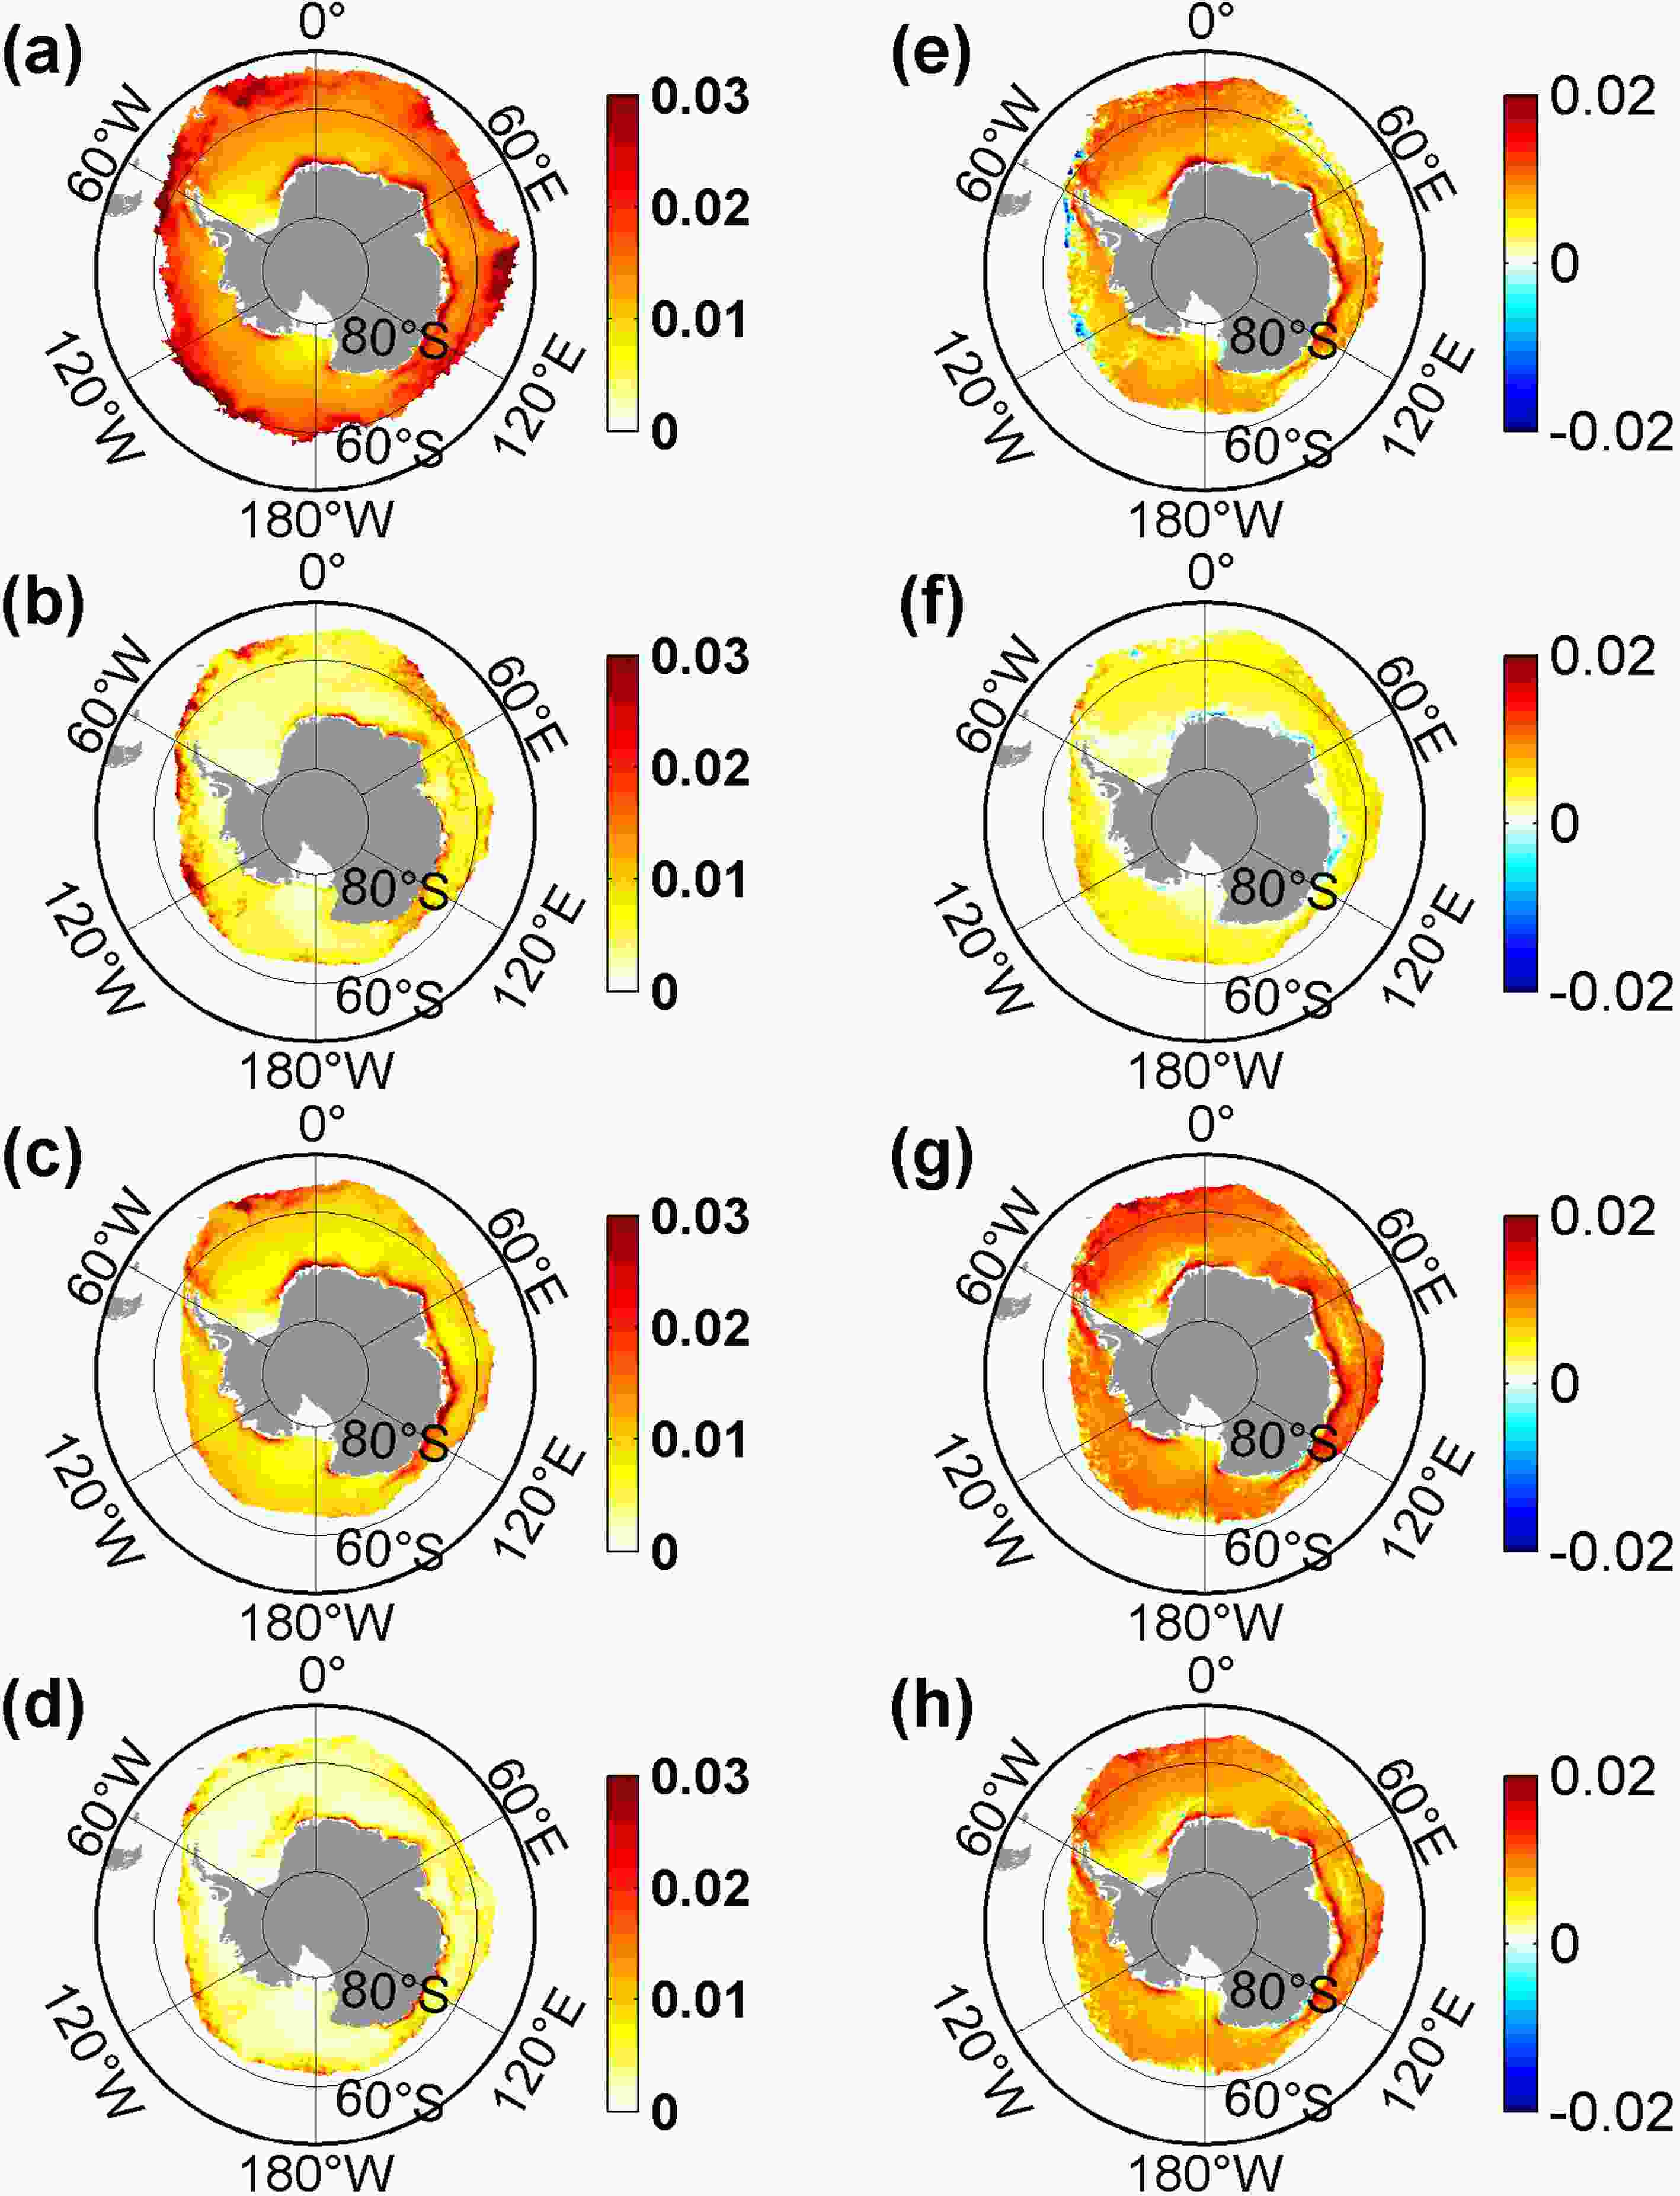 Figure7. Distributions of time-averaged sea-ice EKE (units: m2 s?2) in (a) EXP-6H, (b) EXP-6H_2D, (c) EXP-2D_8D, and (d) EXP-MON, and their differences between these simulations in (e) EXP-6H minus EXP-6H_2D, (f) EXP-6H minus EXP-2D_8D, (g) EXP-6H minus EXP-MON, and (h) EXP-6H minus EXP-MW. Note the different scales in the color bars.
Figures 7a-d show the spatial patterns of sea-ice EKE in EXP-6H and the sensitivity experiments. The patterns in these simulations are very similar, with relatively large EKE around the sea-ice edge and close to Antarctica, but the magnitudes are quite different among the experiments. As expected, when the high-frequency atmospheric variability is included, the sea-ice EKE increases almost everywhere. The area-integrated values of the sea-ice EKE increases from 1 × 10¹¹ m4 s?2 in EXP-MON to 4 × 10¹¹ m4 s?2 in EXP-6H, with the increases of about 2 × 10¹¹ m4 s?2 and 1 × 10¹¹ m4 s?2 being caused by the 6 h?2 d and 2?8 d time-scale atmospheric fluctuation, indicating that the atmospheric variability on the 6 h?2 d time scale is more important to the sea-ice EKE variability.
The melting/freezing of sea ice dominates the net freshwater flux changes at high latitudes, with precipitation-minus-evaporation being small in the sea-ice-covered region (Martinson and Iannuzzi, 1998; Fig. 2c). Subsequently, this large freshwater forcing leads to a significant transformation of water mass in the upper layer in the SO (Abernathey et al., 2016). Hence, significant surface salinity differences in the sea-ice-covered region between the simulations are expected when atmospheric variability at different time scales is excluded. The increased sea-ice formation increases the surface salinity in the region south of 65°S, and the significant sea-ice melting decreases the surface salinity in the region north of 65°S (Figs. 2c and e). The 6 h?2 d and 2?8 d atmospheric fluctuations dominate the salinity increase, while the effects of atmospheric variability at 8 d?1 month are minor (Fig. 2e). Note that the simulated sea surface salinity (SSS) in ECCO2 is lower than the result from the World Ocean Atlas 2013 (WOA13; Zweng et al., 2013) close to Antarctica, where the difference in zonally averaged SSS between ECCO2 and WOA13 is as large as 1 psu (not shown).
2
3.4. Subpolar gyres and ACC transport
Figure 8 shows the distributions of barotropic stream function averaged from 2003 to 2012 in EXP-6H and the differences between this experiment and the sensitivity experiments. The patterns in these simulations are similar, characterized by the ACC and the subtropical and subpolar gyres (Fig. 8a). When the high-frequency atmospheric variability on different time scales is included, the simulated gyre circulations generally become strengthened (Figs. 8b-e). However, the differences are less pronounced in the subtropical gyres due to the weaker transient wind activities in the subtropics (Figs. 8b-e). In line with Sverdrup theory whereby the greater depth integration of meridional transport is caused by larger wind stress curl, the increases of the gyre strengths in EXP-6H are caused by the high-frequency winds (Wunsch, 2011; Thomas et al., 2014). The Weddell Gyre (WG) strength increases by about 54% from 22.4 Sv in EXP-MON to 34.5 Sv in EXP-6H; the high-frequency atmospheric variability on the time scales of 6 h?2 d and 2?8 d cause, respectively, about 33% and 50% of this increase (Figs. 8b and c; Table 2). Similarly, the strength of the Ross Gyre (RG) and Australian?Antarctic Gyre (AG) increases by about 59% from 14.3 Sv to 22.7 Sv, and by about 63% from 9.3 Sv to 15.2 Sv, respectively. The high-frequency atmospheric variability on the time scales of 6 h?2 d and 2?8 d causes about 34% and 46% (40% and 47%) of the RG (AG) increase between EXP-MON and EXP-6H (Figs. 8b and c; Table 2). The WG, RG, and AG strengths are defined as the maximum of the barotropic stream function across the Prime Meridian, 150°W, and 110°E, respectively (Wang and Meredith, 2008). However, the 8 d?1 month atmospheric fluctuations contribute relatively little to the strength of the subpolar gyres (Fig. 8d). These results are within the ranges of the gyre strengths obtained by previous climate models (Wang and Meredith, 2008; Wang et al., 2011; Wang, 2013). The large differences in the strengths of these gyres over high-latitude regions among these simulations are attributable to the large contribution of high-frequency winds on different time scales to the time-averaged wind stress curl (Fig. 2a), with the effects of high-frequency thermodynamic atmospheric variable fluctuations being weak (Fig. 8f; Wang, 2013).| WG | RG | AG | ACC | |
| EXP-6H | 34.5 | 22.7 | 15.2 | 115.8 |
| EXP-6H_2D | 30.5 | 19.8 | 12.8 | 114.0 |
| EXP-2D_8D | 28.5 | 18.8 | 12.4 | 112.0 |
| EXP-8D_1M | 33.6 | 21.7 | 14.4 | 111.7 |
| EXP-MON | 22.4 | 14.3 | 9.3 | 111.5 |
| EXP-MW | 22.3 | 14.1 | 9.2 | 111.3 |
Table2. Time-mean strengths of the subpolar gyres and ACC in the simulations (units: Sv).
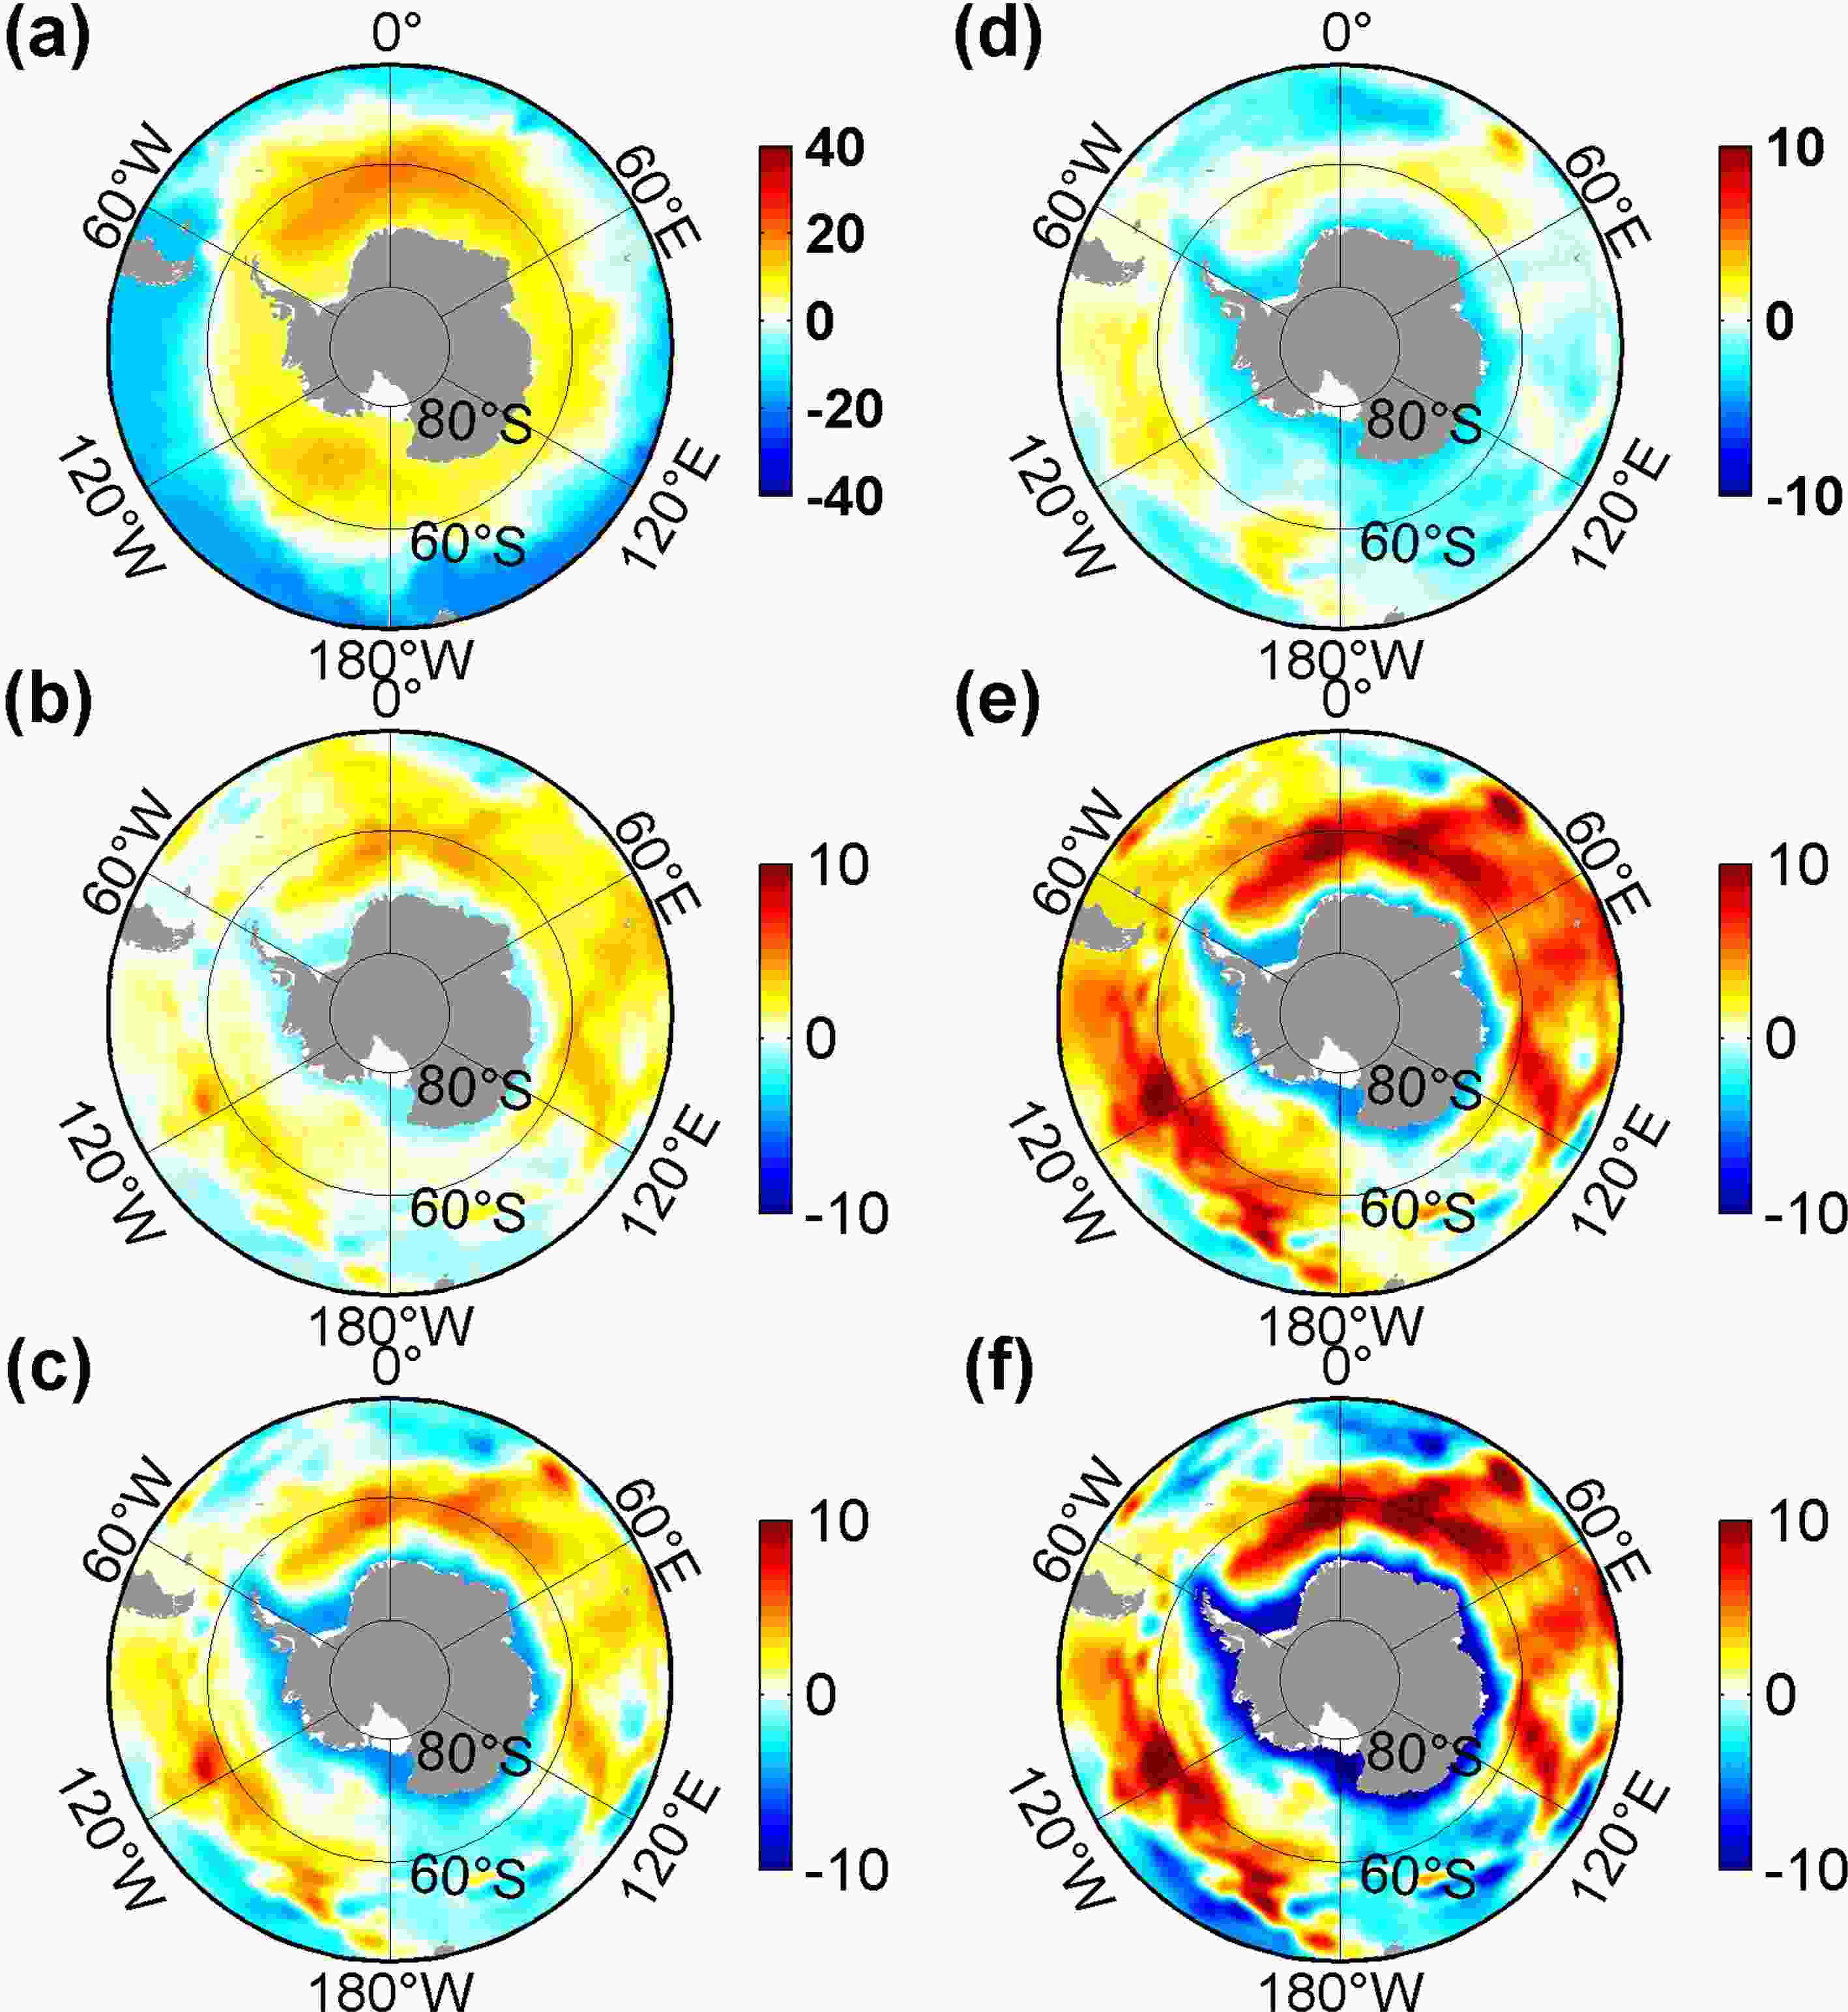 Figure8. Distributions of time-averaged barotropic stream functions (units: Sv) in (a) EXP-6H and the differences between the indicated simulations: (b) EXP-6H minus EXP-6H_2D; (c) EXP-6H minus EXP-2D_8D; (d) EXP-6H minus EXP-8D_1M; (e) EXP-6H minus EXP-MON; (f) EXP-6H minus EXP-MW. Note the different scales in the color bars.
The ACC transport across the Drake Passage for these experiments is shown in Fig. 9a. There are decreasing trends in these simulations, reflecting the model drift. By comparison, the differences between these simulations are not significant. These results show that ACC transport is insensitive to the wind stress change on the decadal scale, owing to the eddy saturation mechanism (Straub, 1993; Meredith and Hogg, 2006; Munday et al., 2013; Wu et al., 2016). However, in some years (e.g., 1984, 1985, 1987,1988, 2001, 2002, 2008, and 2009), the differences are quite large, owing to large differences in mean wind stress (not shown) (Meredith et al., 2004). Hence, Fig. 9b presents almost no change of the zonal mean isopycnal surfaces between these simulations below 400 m, except for in the upper 400 m where the isopycnals tilt a little more in EXP-6H than in the other experiments. The mean transport over the simulation period is about 115.8 Sv in EXP-6H and drops slightly to 114 Sv, 112 Sv, and 111.5 Sv in EXP-6H_2D, EXP-2D_8D, and EXP-MON, respectively (Table 2). These changes in ACC transport are much smaller than those simulated by Jung et al. (2014) (5%?10% changes), probably owing to the relatively coarse model resolution in Jung et al. (2014).
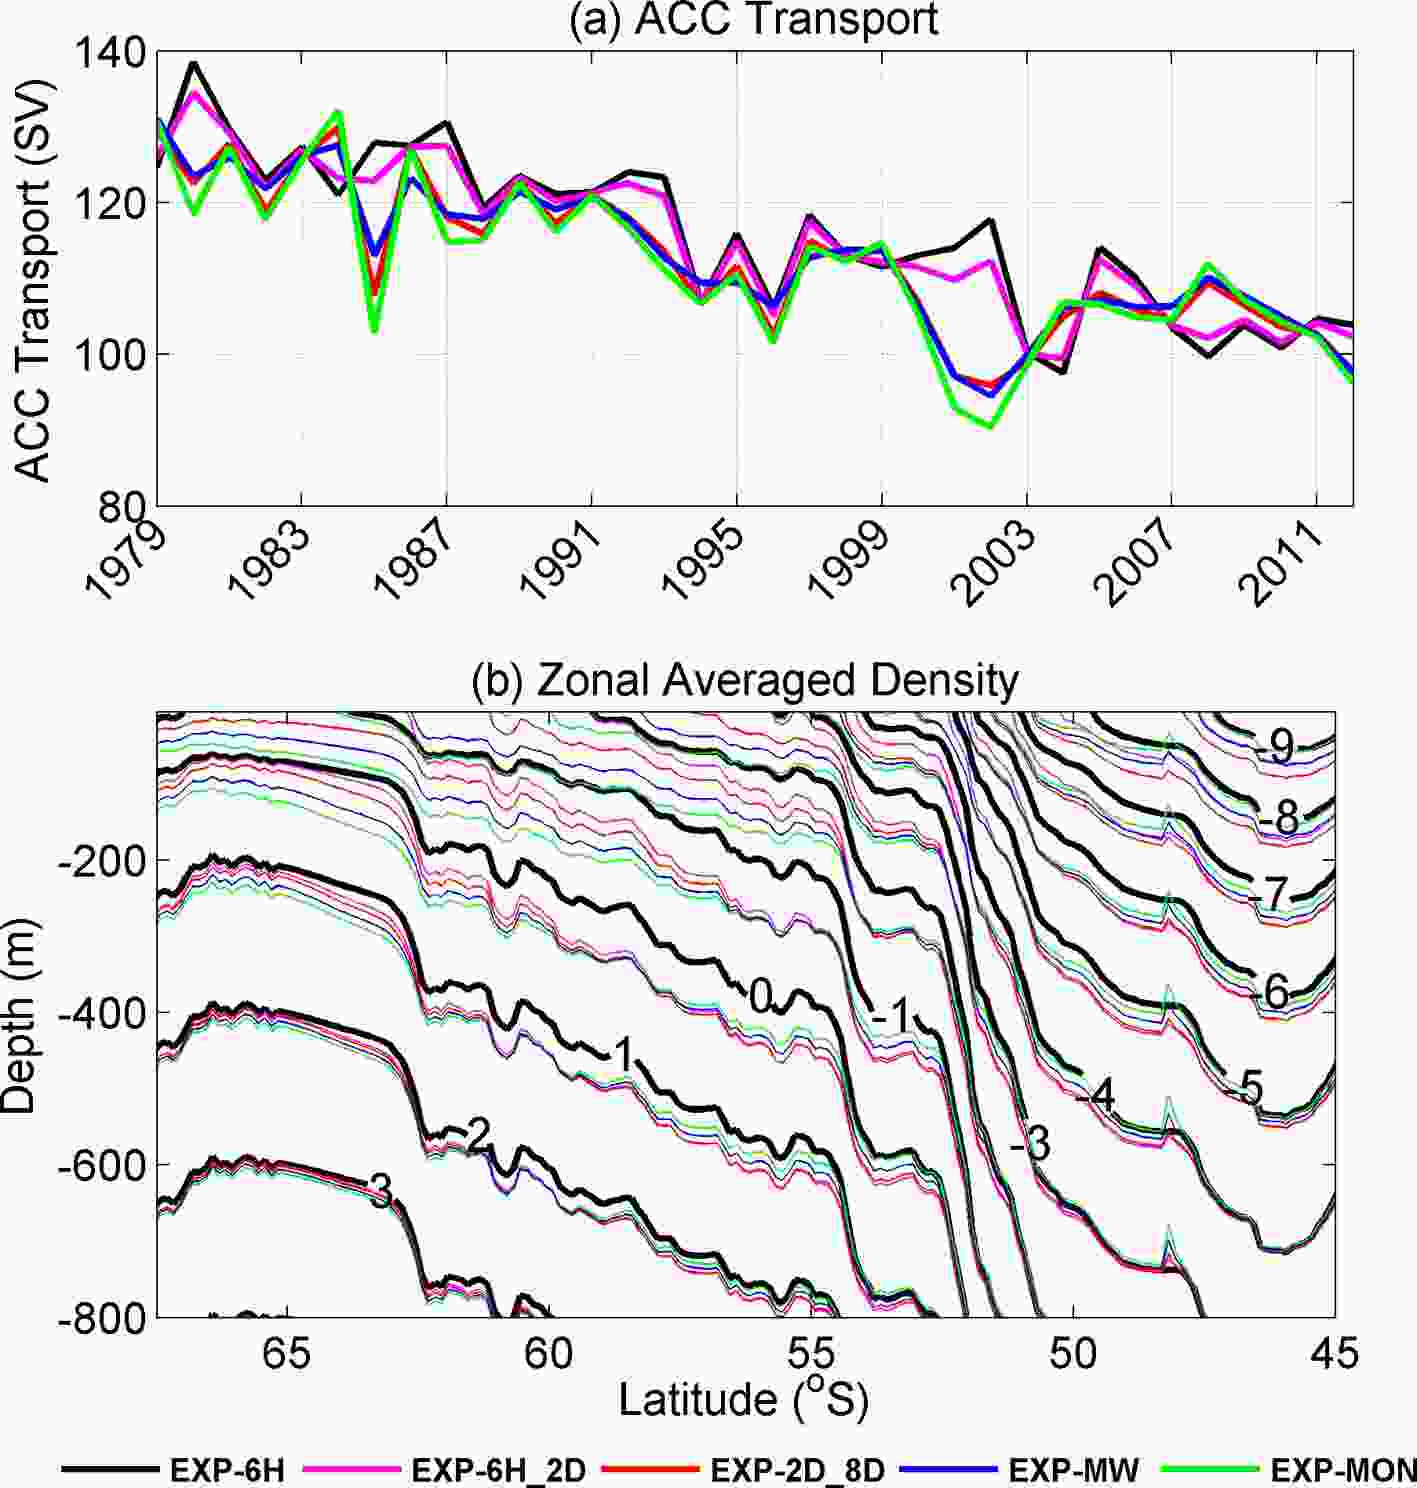 Figure9. Time series of (a) ACC transport (units: Sv) through the Drake Passage and (b) zonal-mean potential density (referring to zero pressure minus a constant of 1025 kg m?3) distribution (units: kg m?3) in the SO.
2
3.5. Mixed-layer depth and meridional overturning circulation
Following Wu et al. (2016), we investigate the impacts of high-frequency atmospheric forcing on the mixed-layer depth (MLD) in the SO. MLD is defined as the depth at which the potential density is 0.03 kg m?3 larger than that at the surface (Downes et al., 2009; Liu et al., 2017). The spatial distributions of the winter MLD and the differences between these simulations are presented in Figs. 10a-e. The simulated MLDs in these six experiments are shown by deep MLD in the northern flank of the ACC and much shallower MLD at lower and higher latitudes (Fig. 10a), similar to the simulated and observed results in previous studies (Wu et al., 2016; Pellichero et al., 2017; Wilson et al., 2019). When the transient atmospheric activities on different time scales are included, the winter MLD increases largely in the northern flank of the ACC (Figs. 10b-e), with the maximum value increasing from 230 m in EXP-MON to 478 m in EXP-6H. The much deeper MLD in EXP-6H than those in the sensitivity simulations is attributable to a much stronger buoyancy loss (Figs. 10b-d and g-i), which is mainly caused by a larger heat loss (Figs. 10l-n). We note that, owing to enhanced sea-ice freezing induced by high-frequency atmospheric variability, the buoyancy loss becomes larger at high latitudes (Figs. 10p-t); however, the consequent response of MLD is weak (Figs. 10a-e). We suggest that this weak response is partially caused by the fresh bias at high latitudes in ECCO2, as compared with the result in WOA13 (not shown). In addition, the buoyancy flux variability is dominated by the heat flux at lower latitudes (Figs. 10k-o), while the freshwater flux becomes more dominant in the sea-ice-covered region (Figs. 10p-t). We note again that the buoyancy flux induced by Ekman drift (not shown) is much smaller than those caused by heat and freshwater fluxes, similar to the results in previous studies (Downes et al., 2010; Liu et al., 2017).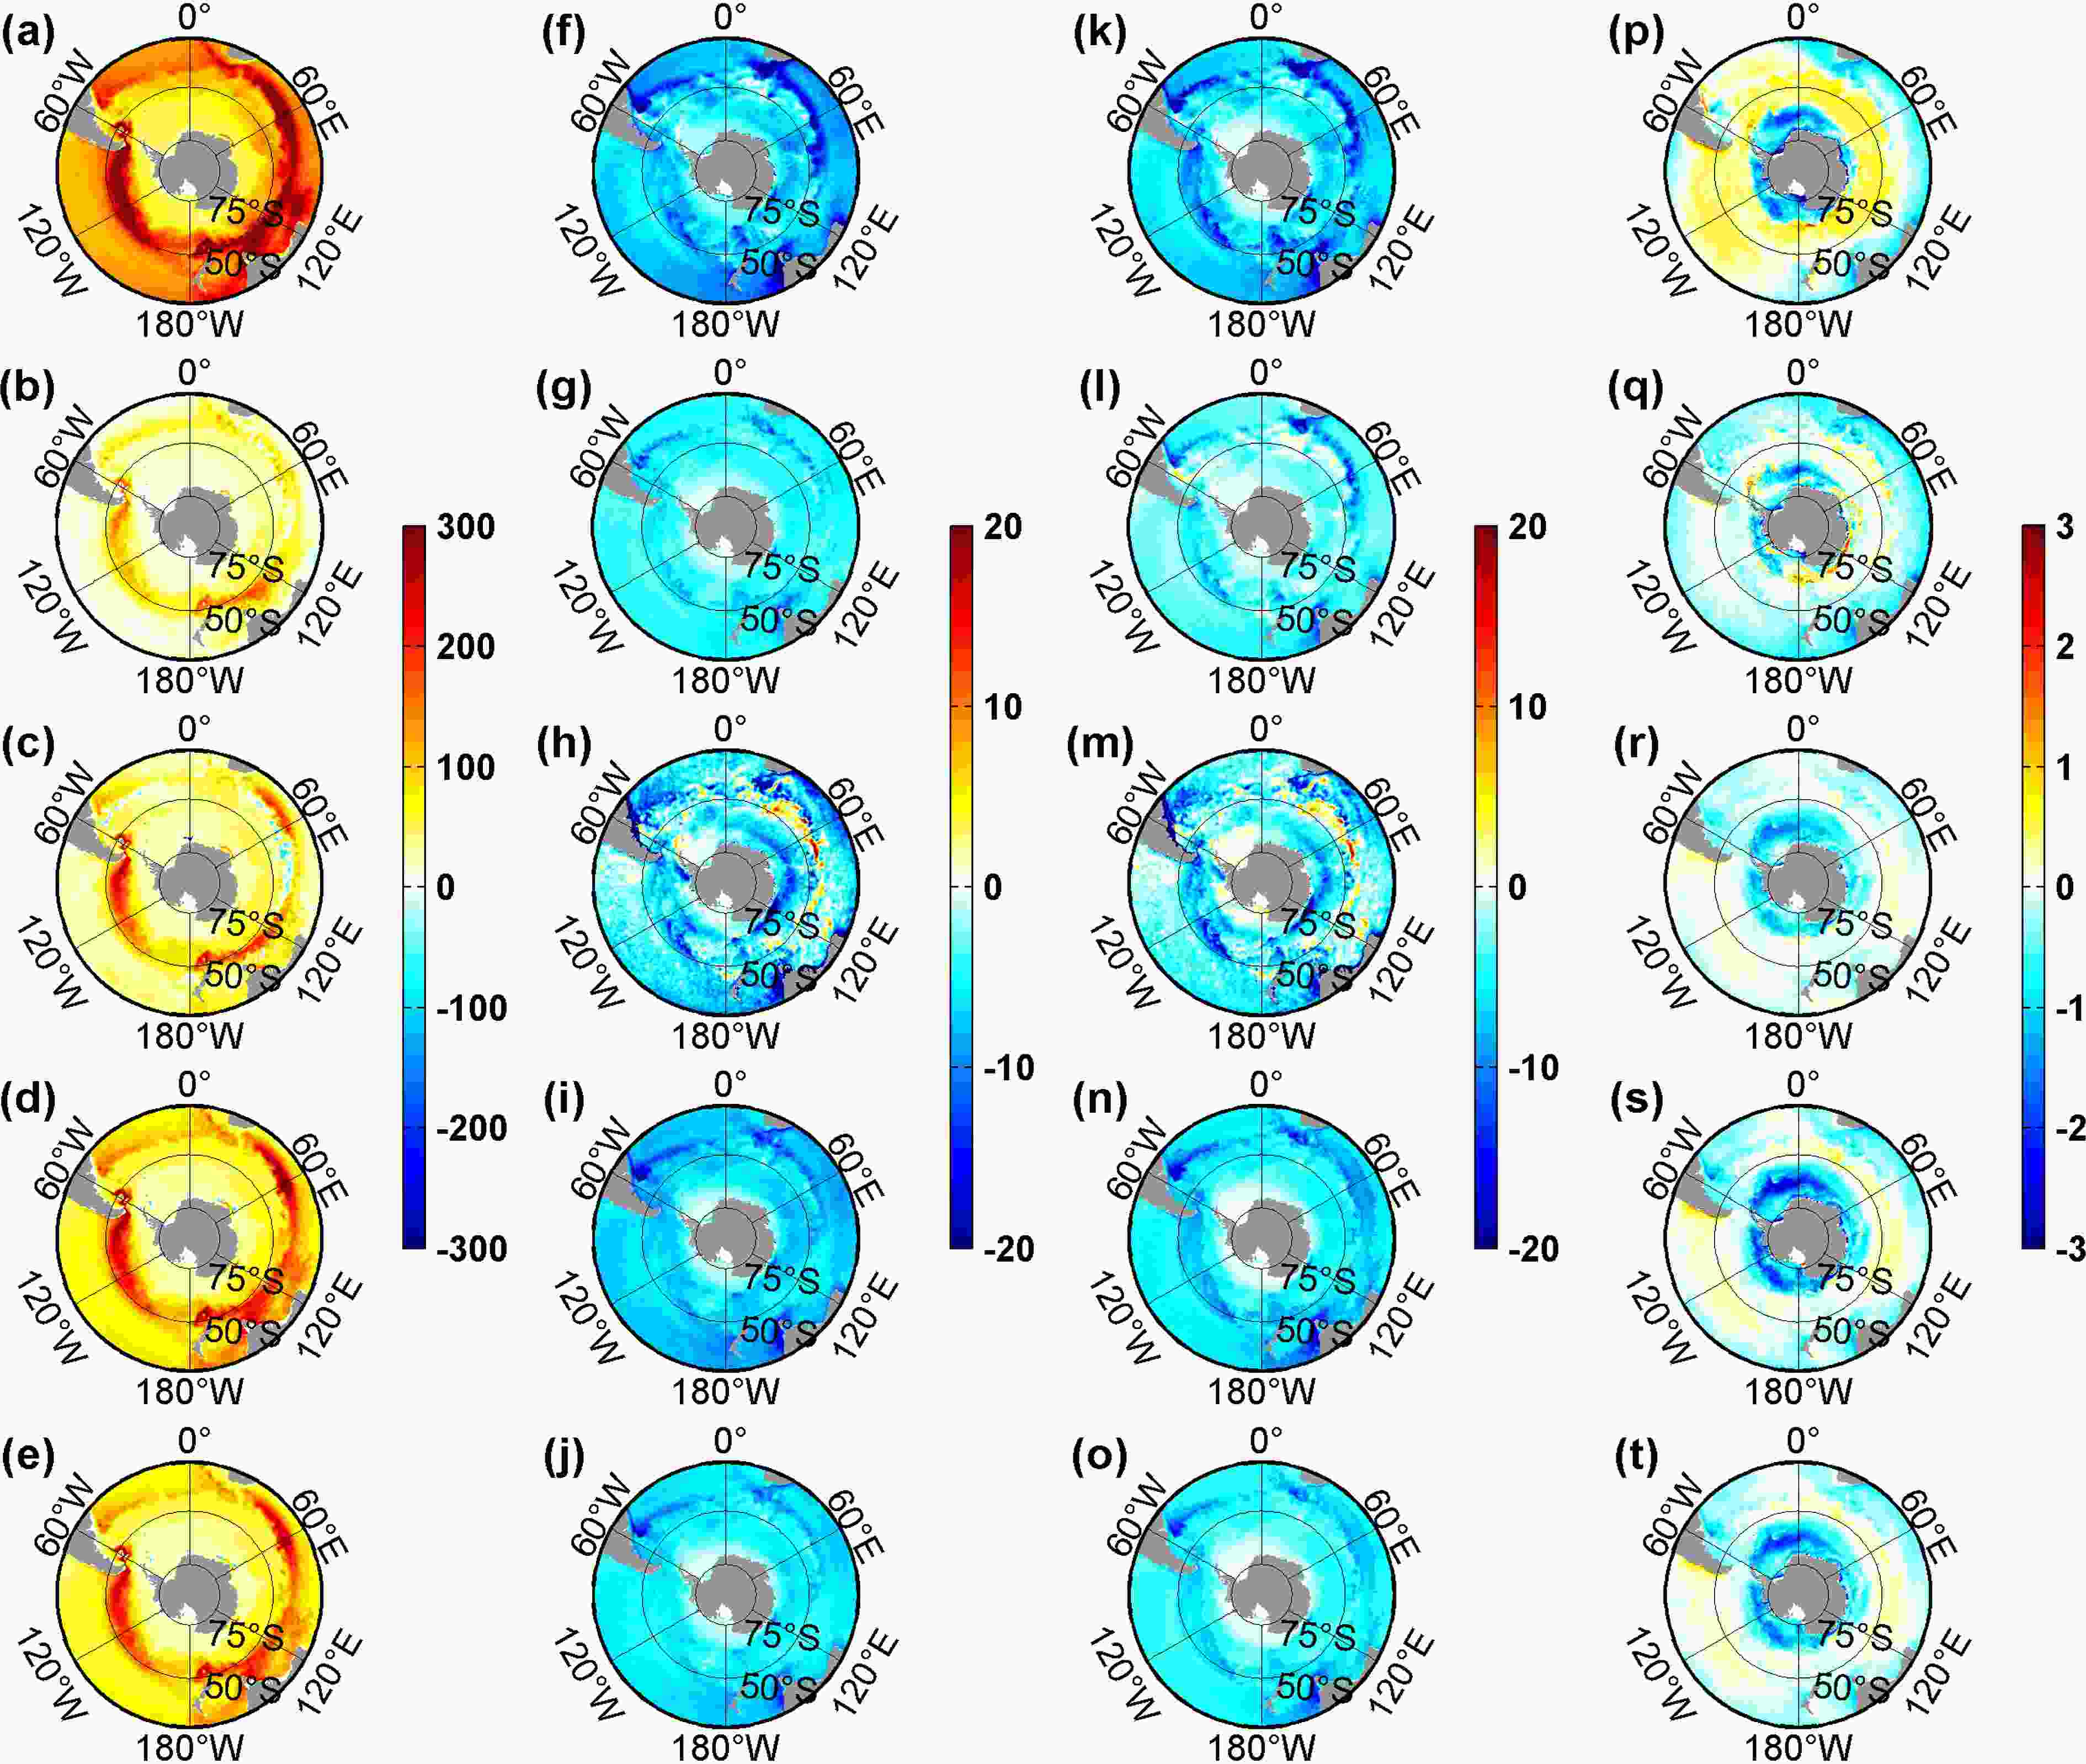 Figure10. Spatial distribution of winter MLD (units: m) in (a) EXP-6H, and the differences of winter MLD between the sensitivity simulations indicated: (b) EXP-6H minus EXP-6H_2D; (c) EXP-6H minus EXP-2D_8D; (d) EXP-6H minus EXP-MON; (e) EXP-6H minus EXP-MW. Panels (f?j), (k?o), and (p?t) are the same as (a?e) but for the total buoyancy flux (units: 10?5 N s?2 m?1), the buoyancy flux induced by heat flux (units: 10?5 N s?2 m?1), and freshwater flux (units: 10?5 N s?2 m?1), respectively. Note the different scales in the color bars.
The high-frequency atmospheric forcing on the 6 h?2 d and 2?8 d time scales causes about 30% and 60% of the MLD increase from EXP-MON to EXP-6H, respectively (Figs. 10b and c). The difference in winter MLD between EXP-6H and EXP-MON (Fig. 10d) is similar to the difference between EXP-6H and EXP-MW (Fig. 10e), indicating that wind fluctuations dominate the MLD variability by dominating the variability of heat and freshwater fluxes (Figs. 10j, o, and t), while the fluctuations of thermodynamic atmospheric variables contribute slightly. The MLD changes are also associated with the circulation change induced by the changes in wind stress curl over the SO (Fig. 2a). This enhanced wind stress curl in EXP-6H (Fig. 2a) leads to a much stronger gyre circulation (Fig. 8) and a weaker stratification than those in the sensitivity simulations (Fig. 9b).
Along with other processes, these changes in MLD could be responsible for the variability in the strength of meridional overturning circulation (MOC, ψ) in the SO, as shown in previous investigations (Condron and Renfrew, 2013; Jung et al., 2014; Wu et al., 2016). The strength of MOC in the SO is set as the maximum value of ψ that directly reflects the strength of the upper cell, i.e., the Deacon cell. The MOC in the SO in these experiments has a similar pattern, mainly characterized by the northward transport of light water in the upper layer being balanced by the southward transport of dense water in the lower layer (Fig. 11a). As shown in Figs. 11b-e, when the high-frequency atmospheric variability is included, it strengthens the MOC in the SO, with the maximum increase being about 12 Sv from EXP-MON to EXP-6H (Fig. 11e). The increases of about 2 Sv and 8 Sv are caused by including the high-frequency atmospheric forcing on the 6 h?2 d and 2?8 d time scales, respectively (Figs. 11b-d), while the 8 d?1 month atmospheric fluctuations contribute slightly to the increase in MOC strength (Fig. 11d). The changes of MOC in the SO are dominated by the high-frequency wind fluctuations, while the atmospheric thermodynamic variable fluctuations play a minor role (Fig. 11f).
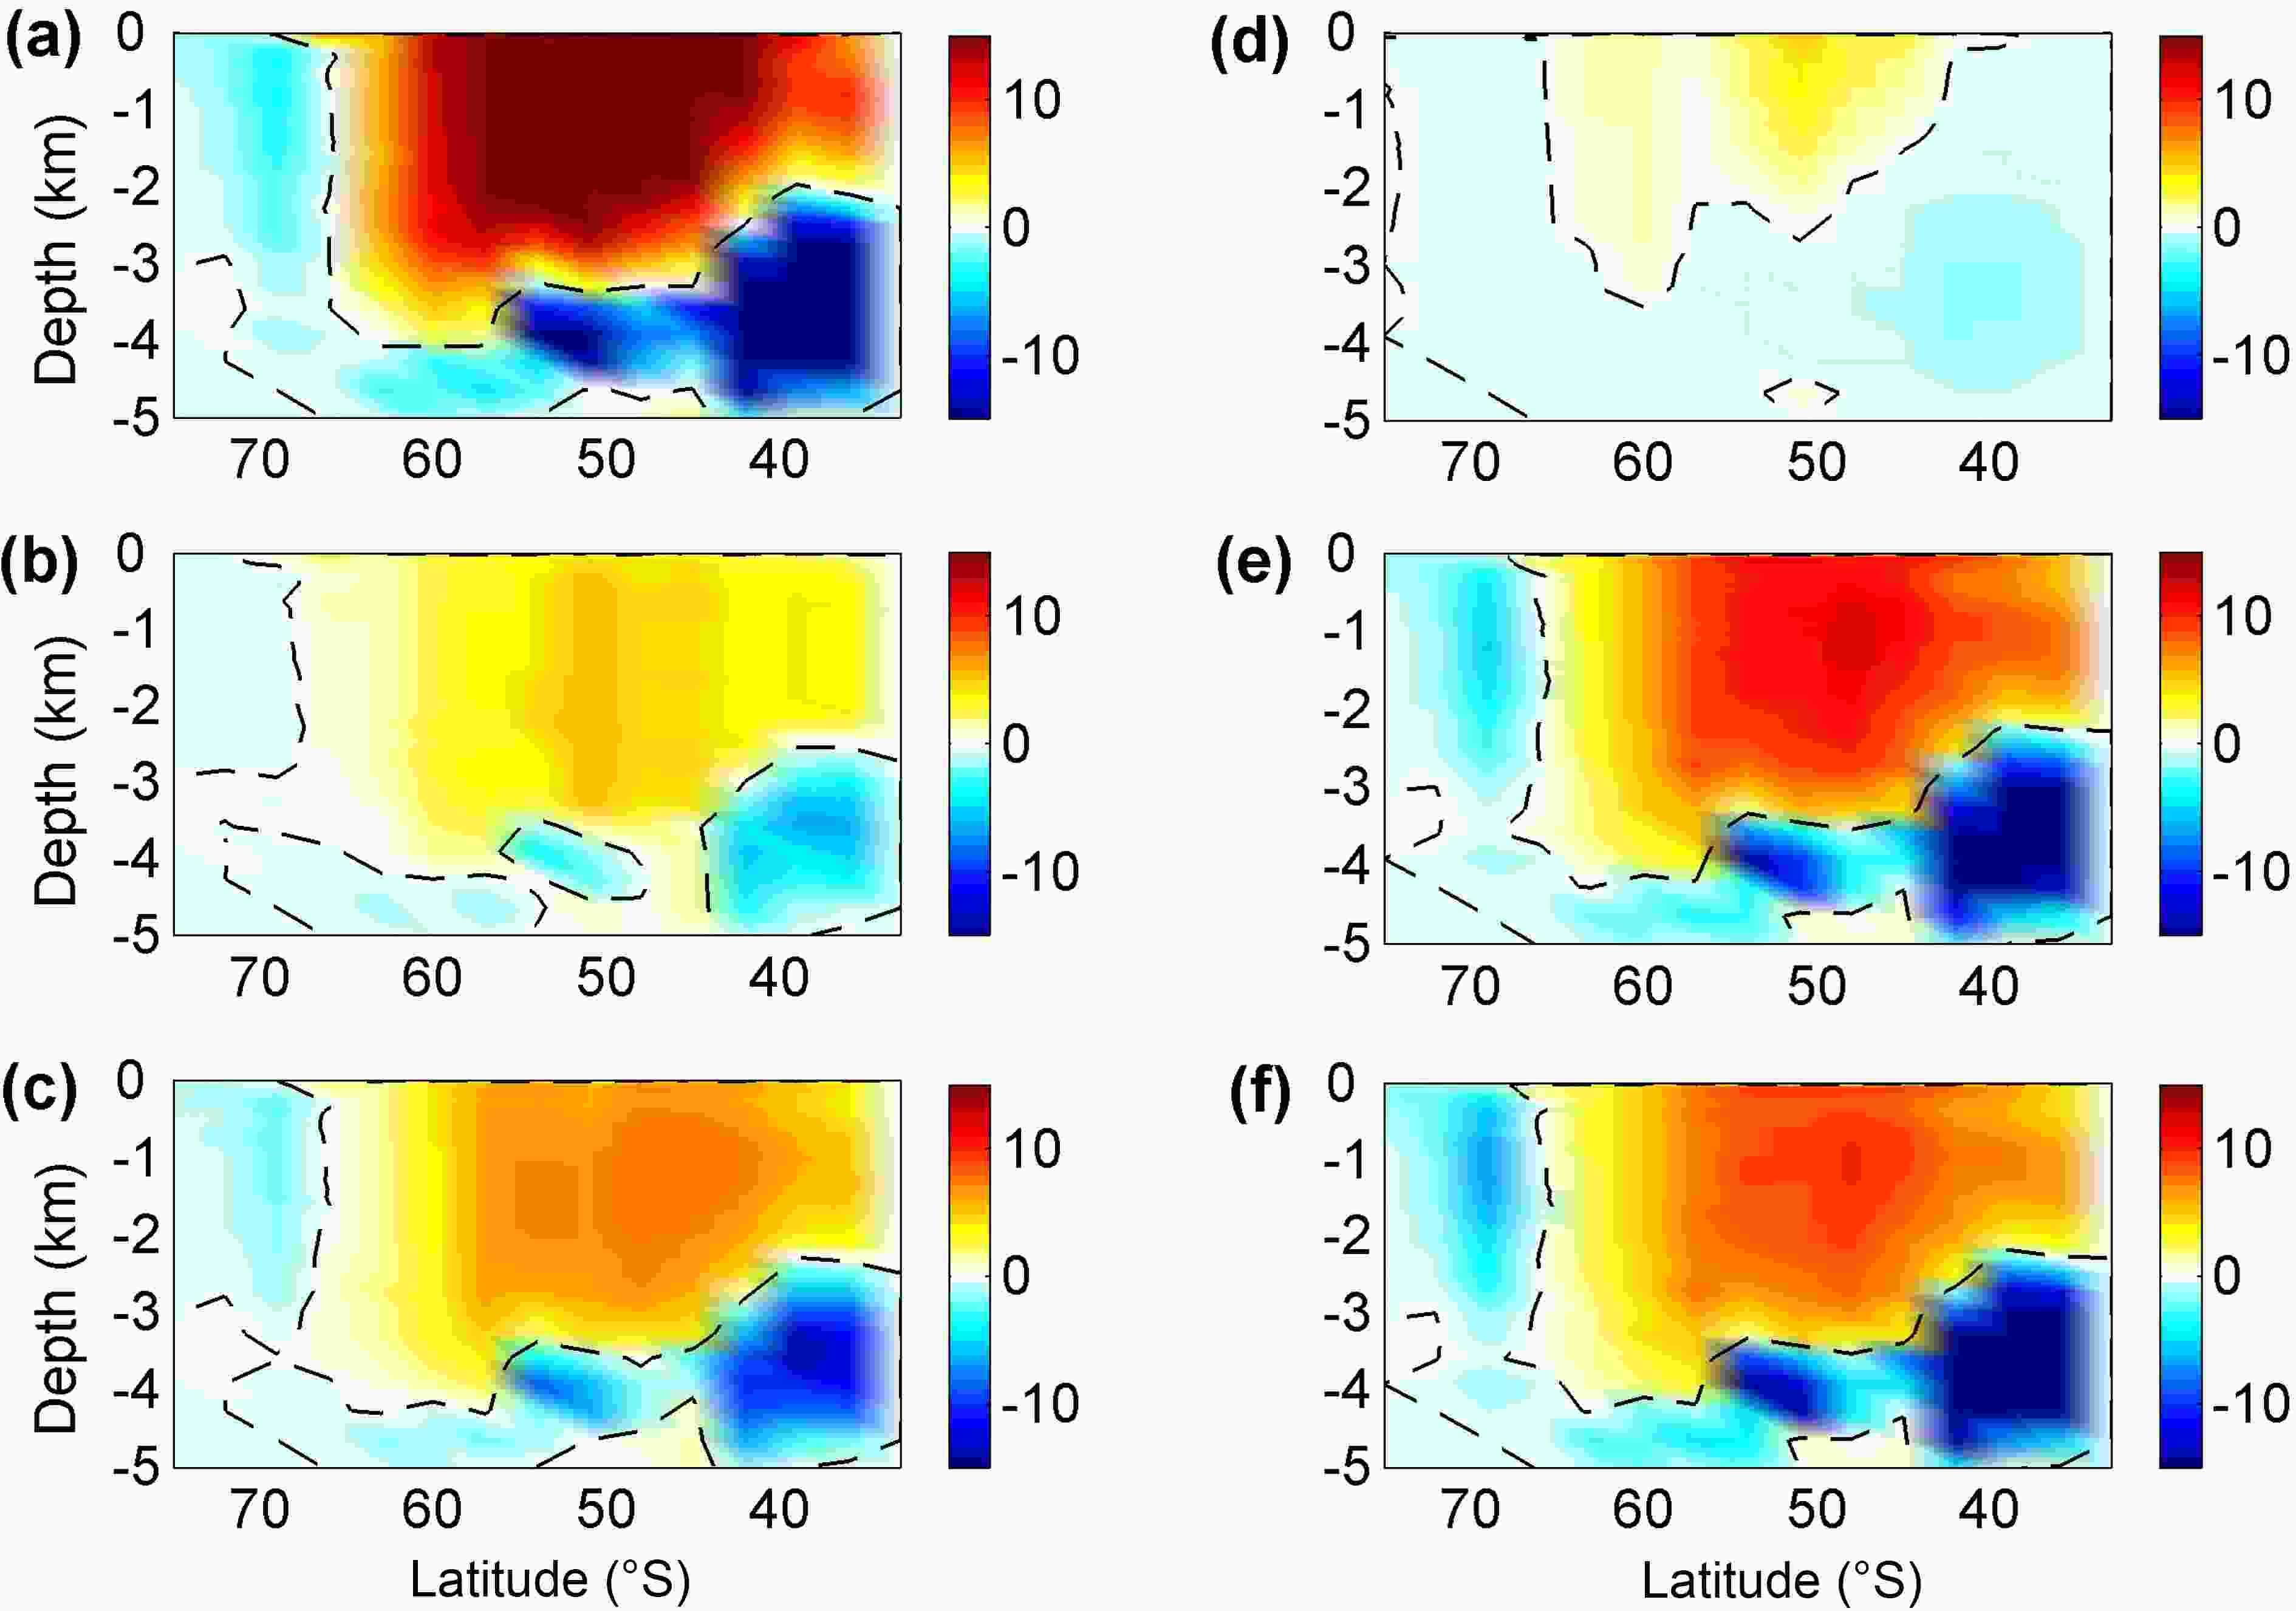 Figure11. Distributions of time-averaged MOC (units: Sv) in the SO in (a) EXP-6H, and the differences between the indicated simulations: (b) EXP-6H minus EXP-6H_2D; (c) EXP-6H minus EXP-2D_8D; (d) EXP-6H minus EXP-8D_1M; (e) EXP-6H minus EXP-MON; (f) EXP-6H minus EXP-MW. The dashed black lines are the zero contours.
(1) The time-averaged (2003?12) surface wind stress and its curl averaged over the SO increase from 0.06 N m?2 and 2.1 × 10?8 N m?3 derived from using monthly mean winds to 0.1 N m?2 and 6.0 × 10?8 N m?3 derived from using six-hourly winds, respectively. The 2?8 d winds cause about 60% and 72% of these increases in the time-averaged wind stress and its curl, respectively, while the contributions from the 6 h?2 d and 8 d?1 month winds are relatively small: about 38% and 2% of the increase in wind stress, and about 22% and 6% of the increase in wind stress curl.
(2) Including 2?8 d atmospheric forcing strengthens the WG, RG, and AG by about 6.0 Sv, 3.9 Sv, and 2.8Sv; and about 4.0 Sv, 2.9 Sv, and 2.4 Sv of the increases are attributable to 6 h?2 d atmospheric forcing, respectively. The ACC transport, however, is relatively insensitive to the inclusion of the transient winds, due to the insensitivity of ACC transport to the changes in wind stress on the decadal time scale, owing to the so-called eddy saturation mechanism.
(3) When the high-frequency atmospheric variability is included in the wind stress calculation, the WPI rate increases from 0.4 TW when monthly mean winds are used to 1.9 TW when six-hourly winds are used, with the increases of about 0.5 TW, 0.8 TW, and 0.1 TW being caused by 6 h?2 d, 2?8 d, and 8 d?1 month winds, respectively. The increased mechanical energy input then results in the increases of about 30%, 58%, and 10% in EKE caused by the 6 h?2 d, 2?8 d, and 8 d?1 month wind fluctuations.
(4) Transient atmospheric forcing at 6 h?2 d and 2?8 d leads to comparable expansion of the Antarctic sea ice, while the forcing at 8 d?1 month contributes slightly. When the 6 h?2 d (2?8 d) atmospheric variability is excluded, the decreased heat loss and air?ice stress lead to the decreases in the SIA, SIE, SIV, sea-ice EKE and MKE, by about 20%, 21%, 13%, 50%, and 28% (13%, 11%, 17%, 25%, and 31%), respectively, relative to those in the experiment forced by six-hourly atmospheric variables.
(5) High-frequency atmospheric forcing enhances the buoyancy loss, which in turn leads to much deeper MLD, mainly in the northern flank of the ACC, but not in the sea-ice-covered region in this particular model, which has a fresh bias. This buoyancy loss, combined with the enhanced momentum flux, strengthens the MOC in the SO; for example, the atmospheric forcing on the 6 h?2 d, 2?8 d, and 8 d?1 month time scales increases the strength of the upper cell (Deacon cell) by 2 Sv, 8 Sv, and 1 Sv, respectively.
(6) The time-mean impacts of atmospheric variability shorter than one month on the SO circulation and Antarctic sea ice found here mainly result from the wind fluctuations, while the effects of atmospheric thermodynamic variable fluctuations are weak.
These results indicate that 2?8 d atmospheric fluctuations play a fundamental role in driving SO circulation, while 6 h?2 d and 2?8 d atmospheric fluctuations play a comparable role in driving Antarctic sea-ice circulation. These results suggest that climate change studies should properly resolve the variability in weather systems and higher frequency fluctuations. Recent simulations of future climate changes project a substantial enhancement of storm activities in both the Southern Hemisphere and Northern Hemisphere (Zahn and von Storch, 2010; Chang et al., 2012). According to the findings in this study, the future changes in storm activities will likely lead to large changes in air?sea fluxes and hence impact the ocean and sea-ice circulations.
Acknowledgements. This study was supported by the National Natural Science Foundation of China (Grant No. 41806216), the China Postdoctoral Science Foundation (Grant Nos. 2019T120379 and 2018M630499), and the Fundamental Research Funds for the Central Universities (Grant No. 2018B19214). Zhaomin WANG was supported by the National Natural Science Foundation of China (Grant Nos. 41941007 and 41876220). Xia LIN was supported by a project of the National Natural Science Foundation of China (Grant No. 41906190), the China Postdoctoral Science Foundation (Grant No. 2019M661705), and the Fundamental Research Funds for the Central Universities (Grant No. 2019B19014). The atmospheric forcing data are available from
