HTML
--> --> -->Understanding how terrestrial vegetation responds to drought is a great challenge because the physiological and biochemical activities of vegetation, especially its assimilation of CO2, are largely constrained by varying degrees of droughts at various time scales (Ciais et al., 2005). Relevant studies have been restricted by many factors, such as the proper quantification of drought severity (Huang et al., 2017) and combined effects of high temperature, reduced precipitation, and ambient nutrients (Allen et al., 2010). Nevertheless, many drought indices have been established, such as self-calibrated palmer drought severity index (scPDSI), standardized precipitation index (SPI), standardized precipitation evapotranspiration index (SPEI), and standardized runoff index (SRI) to assess the evolution of droughts and to understand underlying mechanisms from various subfield perspectives. The scPDSI, which considers antecedent precipitation, soil moisture, streamflow, and potential evapotranspiration (PET), has been widely used in drought analysis and monitoring (Wells et al., 2004; Dai, 2011). The SPI operates on multiple time scales and can be used to monitor moisture conditions in different locations (McKee et al., 1993). The SPEI, which accounts for the contribution of temperature, overcomes the limitation of the SPI under global warming (Vicente-Serrano et al., 2010, 2013). The SRI, based on runoff, partly represents the differences between precipitation and actual evapotranspiration (AET) and makes a useful complement to the SPI for hydrological aspects of drought (Shukla and Wood, 2008; Lee et al., 2019). Among these drought indices, those that consider evapotranspiration (e.g., SPEI) can more accurately identify the evolution of droughts and the effects on ecosystems, as compared to the precipitation-only indices (e.g., SPI) (Vicente-Serrano et al., 2013).
With respect to evapotranspiration, according to atmospheric observations and theories, PET denotes the atmospheric potential to receive water and crucially regulates its water stress conditions. So, it is an important indicator of droughts in terms of atmospheric conditions (McEvoy et al., 2016). However, PET does not necessarily depend on the actual water storage on the land, and hence it is different from AET, which represents the amount of water transported into the atmosphere from the land in the forms of evaporation and transpiration, driven by solar radiation energy (Hobbins et al., 2001; Han et al., 2014). As such, the drought indices accounting for the combination of AET and PET have more potential to highlight the intensity of water stress and influence on vegetation than the individually based indices (e.g., scPDSI, SPEI, SRI). Recently, studies have focused on the use of evapotranspiration to define drought indices. For instance, Yao et al. (2010) developed an evaporative drought index (EDI) using MODIS satellite data and NCEP2 reanalysis data, and characterized the surface drought conditions across the continental United States at a fine spatial resolution. Anderson et al. (2011) defined another evaporative stress index, based on remotely sensed evapotranspiration, and showed its ability to reasonably capture drought conditions in areas with intense irrigation or a shallow water table. Kim and Rhee (2016) proposed a standardized evapotranspiration deficit index (SEDI) using AET estimated based on Bouchet’s complementary hypothesis. The results suggested that SEDI is useful in assessing agricultural droughts in regions with strong land–atmosphere interaction. Furthermore, based on probability distributions, Vicente-Serrano et al. (2018) suggested the efficiency of SEDI in monitoring global drought. These studies have shown the potential of SEDI for applications in drought detection and linking drought evolution to the ecological responses of terrestrial ecosystems.
The potential for SEDI-type drought indices to highlight vegetation responses to dry and wet climatic fluctuations and heavy droughts has not yet been clearly assessed in previous studies, in contrast to the evaluation of its detection ability. The object of this study is to define a drought index based on the standardized evapotranspiration deficit and systematically assess its efficiency in highlighting vegetation responses to drought dynamics. We estimate the category thresholds in section 2, and then in section 3 evaluate its ability to detect climatic dry and wet evolutions and to represent the vegetation response to drought evolution. Finally, discussion and conclusions are given in sections 4 and 5.
2.1. Definition of SEDI
For each grid cell, the SEDI in this study is defined as the standardized anomalies of the difference between AET and PET, as follows:where D is the difference between AET (mm) and PET (mm), and DAVE and DSTU denote the multi-year mean and standard deviation, respectively. This approach can highlight dry and wet conditions by detecting local water storage changes, compared with direct evapotranspiration (Chattopadhyay and Hulme, 1997; Kim and Rhee, 2016; Vicente-Serrano et al., 2018). In terms of ecophysiology, the evapotranspiration deficit can explicitly account for the potential of the atmosphere (PET), but also the water actually lost from soil or vegetation (AET), which involves the physiological behavior of vegetation (Leuning, 1995). If the difference becomes large enough to lower soil moisture below wilting point, plants may die as a result of vascular damage (Anderegg et al., 2015).
Additionally, we adopted a percentile approach (Svoboda et al., 2002) to classify SEDI dry and wet conditions (Table 1). SEDI values from ?0.8 to 0.8 denote dry (negative values) and wet (positive values) conditions. The larger the absolute value, the stronger the dry and wet intensity.
| Drought condition | Percentile chance (k) | SEDI | scPDSI | SPEI/ SPI |
| Extreme | k ≤ 5 | ≤ ?0.8 | ≤ ?4 | ≤ ?2 |
| Severe | 5 < k ≤ 10 | ?0.8 to ?0.63 | ?4 to ?3 | ?2 to ?1.5 |
| Moderate | 10 < k ≤ 20 | ?0.63 to ?0.42 | ?3 to ?2 | ?1.5 to ?1 |
| Slightly | 20 < k ≤ 30 | ?0.42 to ?0.26 | ?2 to ?1 | ?1 to ?0.5 |
| Normal | 30 < k ≤ 70 | ?0.26 to 0.27 | ?1 to 1 | ?0.5 to 0.5 |
| Wet | k > 70 | > 0.27 | > 1 | > 0.5 |
Table1. Categories of drought magnitude corresponding to four drought indices.
2
2.2. Data
The AET data were derived from the observation-based FLUXNET-MTE (Model Tree Ensemble) and reanalysis data of ERA-Interim and CFSR (Climate Forecast System Reanalysis). The PET data were from CRU-TS3.23 (Climate Research Unit) and CFSR. These datasets were at a monthly temporal resolution and 0.5° × 0.5° spatial resolution during 1982–2011. The gridded FLUXNET-MTE dataset was taken from Jung et al. (2009), which integrated the observations from global 253 FLUXNET eddy covariance towers by a machine learning technology, the MTE algorithm. Its evapotranspiration data have been verified against observations from FLUXNET sites, estimates from 112 catchment water balances, and simulations of 16 land surface models in GSWP-2 (Global Soil Wetness Project 2), with correlation coefficients over 0.9 (Jung et al., 2010). The gridded dataset is incomplete over the Sahara Desert and Greenland, due to the lack of in-situ observations. For assessment purposes, we estimated SEDI using averaged AET from FLUXNET-MTE and ERA-Interim, which have high temporal and spatial consistency (Zhang et al., 2018), along with PET from CRU-TS3.23 (hereafter known as AVG-SEDI). The estimate based on AET and PET, both from CFSR, is referred to as CFSR-SEDI.Three drought indices (scPDSI, SPI, and SPEI) were used to compare with SEDI. These monthly datasets for 1982–2011 are available at 0.5° spatial resolution for SPEI, and 2.5° for scPDSI and SPI. Table 1 shows the details of SEDI, scPDSI, SPI, and SPEI classifications. The scPDSI, SPI, and SPEI were obtained from NCAR’s Research Data Archive, NOAA–NCEP Climate Prediction Center, and SPEIbase v2.5, respectively. The scPDSI was derived from PDSI by calibration with local conditions (Wells et al., 2004). The calculation of SPEI was the same as that of the SPI algorithm except that SPEI used the difference between precipitation and PET instead of precipitation anomalies. The scPDSI and SPEI were calculated using the CRU high-resolution surface climate dataset of the University of East Anglia, except that the precipitation data used to calculate the scPDSI were from the Global Precipitation Climatology Project (GPCP). The SPI was calculated by gauge-satellite-merged precipitation datasets, with the difference from GPCP being less than 10% for nearly the whole land area (Janowiak and Xie, 1999). The gridded CRU and GPCP datasets are in good agreement at low–middle latitudes (Decharme and Douville, 2006), and have high temporal correlations, especially in all semi-arid regions (Los, 2015). In addition, a surface wetness index defined as the ratio of annual accumulated precipitation to PET, whose datasets are both from CRU-TS3.23, was used to determine the dry and wet climatic boundary.
The leaf area index (LAI) dataset has an 8-km spatial resolution and 15-day interval from the year 1981 onwards. The dataset was derived from GIMMS LAI3g (the third-generation Global Inventory Modeling and Mapping Studies LAI product), which is considered suitable to estimate the long-term LAI variability (Zhu et al., 2013). Here, we bilinearly interpolated the LAI data to 0.5° × 0.5° resolution. The land-use and land-cover data for the year 2011 at 500-m horizontal resolution were obtained from the Moderate Resolution Imaging Spectroradiometer (Friedl et al., 2010). Monthly soil moisture, and temperature and precipitation with 0.5°×0.5° spatial resolution during 1982–2011 were obtained from ERA-Interim and CRU-TS3.23, respectively.
2
2.3. Estimation of AET and statistical methods
Due to the lack of long-term AET observations at the global scale, we estimated AET using the latent heat flux data, according to a theoretical linear function (Jacobson, 2005; Lorenz and Kunstmann, 2012):where AET is in units of mm, the latent heat flux λE (units: W m?2) refers to the latent heat released as water evaporates, and the latent heat of evaporation Le is the energy variation as the water phase changes, which is taken as a constant (2.501 × 10⁶ J kg?1).
The main statistical methods used here are the Pearson correlation coefficient and least-squares linear trend estimation. We tested the significance of correlation using the Student’s t-test and that of linear trends using the F-test.
2
3.1. Skill of SEDI in identifying dry and wet variations
We evaluated the capability of SEDI to characterize dry and wet variations at both global and regional scales. Globally, we divided the land into five regions: South America, Africa, Australia, and two areas in North America and Eurasia south of 60°N. Figure 1 shows the dynamics of SEDI and four reference indices (scPDSI, SPI, SPEI, and soil moisture) over these five regions. SEDI had consistent interannual variations and long-term trends with the reference indices, according to the Pearson’s correlation coefficient analysis (Table 2). The two SEDI estimates had a significant correlation and comparable linear trends with the reference indices (Table 3), suggesting similar skill of SEDI to the reference indices in depicting interannual variations and long-term trends. According to the long-term trends, the SEDI values in North America and Eurasia were negative, similar to the reference indices, denoting a drying climate, whereas all indices in Africa presented wetting trends. Moreover, the coefficients of CFSR-SEDI, SPI, and SPEI were positive in South America, while the AVG-SEDI, scPDSI, and soil moisture were opposite; the coefficients of AVG-SEDI, SPI, and soil moisture were negative in Australia, but the CFSR-SEDI, scPDSI, and SPEI were non-significantly positive. The highest consistency between SEDI and the reference indices was achieved in Australia, with a correlation coefficient up to 0.90. This was largely related to the uniform climate (about 70% of Australia is shared by arid and semi-arid climates). Furthermore, this suggests that SEDI is sensitive to the dry and wet variations over arid and semi-arid regions. A remarkable difference can be seen between SEDI and the reference indices as dry and wet signals weaken; for example, in the year 1999 in North America, and 1992 in South America. However, high consistency was observed for periods with strong dry and wet signals, such as 1984 in Africa and 2000 in South America. These discrepancies indicate that SEDI can comparably detect extreme dry and wet climatic fluctuations at a global scale, but also sensitively sense the effects of land processes because the contribution from land processes was enhanced during weak dry and wet periods. Figure1. Temporal evolutions of standardized SEDI and four reference indices (scPDSI, SPI, SPEI, and soil moisture) in (a) North America, (b) South America, (c) Africa, (d) Eurasia, and (e) Australia during 1982–2011.
| Dataset | North America | South America | Africa | Eurasia | Australia | |
| scPDSI | AVG | ?0.07 | 0.15 | 0.59* | 0.20 | 0.60* |
| CFSR | 0.70* | ?0.0003 | 0.31 | 0.24 | 0.90* | |
| SPI | AVG | ?0.03 | ?0.21 | 0.39* | 0.37* | 0.62* |
| CFSR | 0.68* | 0.21 | 0.44* | 0.22 | 0.79* | |
| SPEI | AVG | 0.05 | ?0.29 | 0.46* | 0.16 | 0.41* |
| CFSR | 0.69* | 0.30 | 0.26 | 0.12 | 0.79* | |
| Soil moisture | AVG | ?0.02 | 0.57* | 0.35 | 0.73* | 0.73* |
| CFSR | 0.41* | ?0.19 | ?0.29 | 0.10 | 0.86* | |
| Note: * represents value significant at 95% confidence level. | ||||||
Table2. Correlation coefficients between SEDI and four reference indices for five continents during 1982–2011.
| North America | South America | Africa | Eurasia | Australia | |
| AVG-SEDI | ?0.10 | ?1.01* | 0.04 | ?1.12* | ?1.94 |
| CFSR-SEDI | 0.21 | 1.87* | 0.45 | ?0.48* | 1.12 |
| scPDSI | ?0.006 | ?0.02* | 0.01 | ?0.002 | 0.006 |
| SPI | ?0.001 | 0.003 | 0.001 | ?0.001 | ?0.001 |
| SPEI | ?0.003 | 0.01 | 0.01* | 0.001 | 0.01 |
| Soil moisture (×10?3) | ?0.33* | ?0.27* | ?0.24* | ?0.24* | ?0.02 |
| Note: * represents value significant at 95% confidence level. | |||||
Table3. Linear trend coefficients (yr?1) of SEDI and four reference indices for five continents during 1982–2011.
At regional scales, we evaluated SEDI in four regions of China (Fig. 2e), which were located over transitional zones that have frequent droughts (Ma and Shao, 2006; Huang et al., 2012). The temporal evolutions of SEDI, along with the four reference indices, in these four regions (Figs. 2a–d) show the significantly positive correlations between CFSR-SEDI and reference indices, especially in Northeast China, where the coefficient reached 0.74 (Table 4). Both the AVG-based and CFSR-based SEDI datasets had consistent annual variations and long-term trends, but with different significances of the trend coefficients; for example, only the AVG-SEDI and scPDSI in North China were significant at the 95% level (Table 5). Similar to that at the global scale, the consistency of SEDI and the reference indices was lower during periods of weak dry and wet signals, such as the year 1984 in eastern Northwest China, in comparison to that of strong signals such as 2001 in North China. This variation is largely attributable to effects exerted by land processes, such as vegetation.
 Figure2. As in Fig. 1 but for (a) eastern northwest China, (b) North China, (c) Northeast China, and (d) Southwest China. The rectangles in (e) denote the four regions, and the contours represent the spatial distribution of the mean annual precipitation during 1982–2011.
| Dataset | Eastern Northwest | North | Northeast | Southwest | |
| scPDSI | AVG | 0.31 | 0.32 | 0.32 | 0.36 |
| CFSR | 0.73* | 0.65* | 0.74* | 0.68* | |
| SPI | AVG | 0.23 | 0.06 | 0.51* | 0.26 |
| CFSR | 0.42* | 0.32 | 0.43* | 0.23 | |
| SPEI | AVG | 0.27 | 0.13 | 0.25 | 0.15 |
| CFSR | 0.60* | 0.67* | 0.65* | 0.08 | |
| Soil moisture | AVG | 0.07 | 0.46* | 0.25 | 0.17 |
| CFSR | 0.54* | 0.41* | 0.64* | 0.41* | |
| Note: * represents value significant at 95% confidence level. | |||||
Table4. As in Table 2 but for four typical regions of China.
| Eastern Northwest | North | Northeast | Southwest | |
| AVG-SEDI | 0.01 | ?1.93* | ?0.81 | ?1.24* |
| CFSR-SEDI | 0.67 | ?0.59 | ?1.9* | ?1.45* |
| scPDSI | 0.01 | ?0.06* | ?0.06* | ?0.11* |
| SPI | 0.01* | 0.01 | 0.0001 | ?0.01* |
| SPEI | 0.01 | ?0.003 | ?0.03* | 0.01 |
| Soil moisture (×10?3) | 0.52* | ?0.24 | ?0.75* | ?0.07 |
| Note: * represents value significant at 95% confidence level. | ||||
Table5. As in Table 3 but for four typical regions of China.
2
3.2. Performance of SEDI in detecting the vegetation response to drought
This analysis aimed to confirm that the evapotranspiration-based SEDI is more closely related to the physiological response of vegetation to the evolution of drought than commonly used indices based on factors other than evapotranspiration. We compared the performance of each drought index in describing drought impacts on vegetation growth, using LAI. In addition, because of their similar skill in drought detection, we averaged the CFSR-SEDI and AVG-SEDI into one index, known as FNL-SEDI hereafter.On the global scale, we evaluated the sensitivity of vegetation growth to dry and wet variations in each index. Figure 3 shows the spatial patterns of correlation coefficients between the five indices and LAI in the growing season (spring, summer, and autumn). The correlation coefficients between SEDI and LAI in most areas were over 0.4 (p < 0.05). In contrast, the correlations between the reference indices and LAI were substantially lower with fewer significant grid cells (p < 0.05). The spatial pattern of correlation between SEDI and LAI was largely the same as that between soil moisture and LAI, which indicates that SEDI can detect stronger signals from land processes as they respond to dry and wet climatic variations. Furthermore, the correlation patterns between SEDI and LAI showed seasonality. In spring and autumn, negative correlations occurred in areas north of 30°N and south of 30°S, but positive correlations were found in low latitudes; in summer, as temperature increased, positive correlations occurred in most areas of the world. A potential reason for this contrast is the different response times of various vegetation types to dry and wet variations (Braswell et al., 1997; Adams et al., 2009).
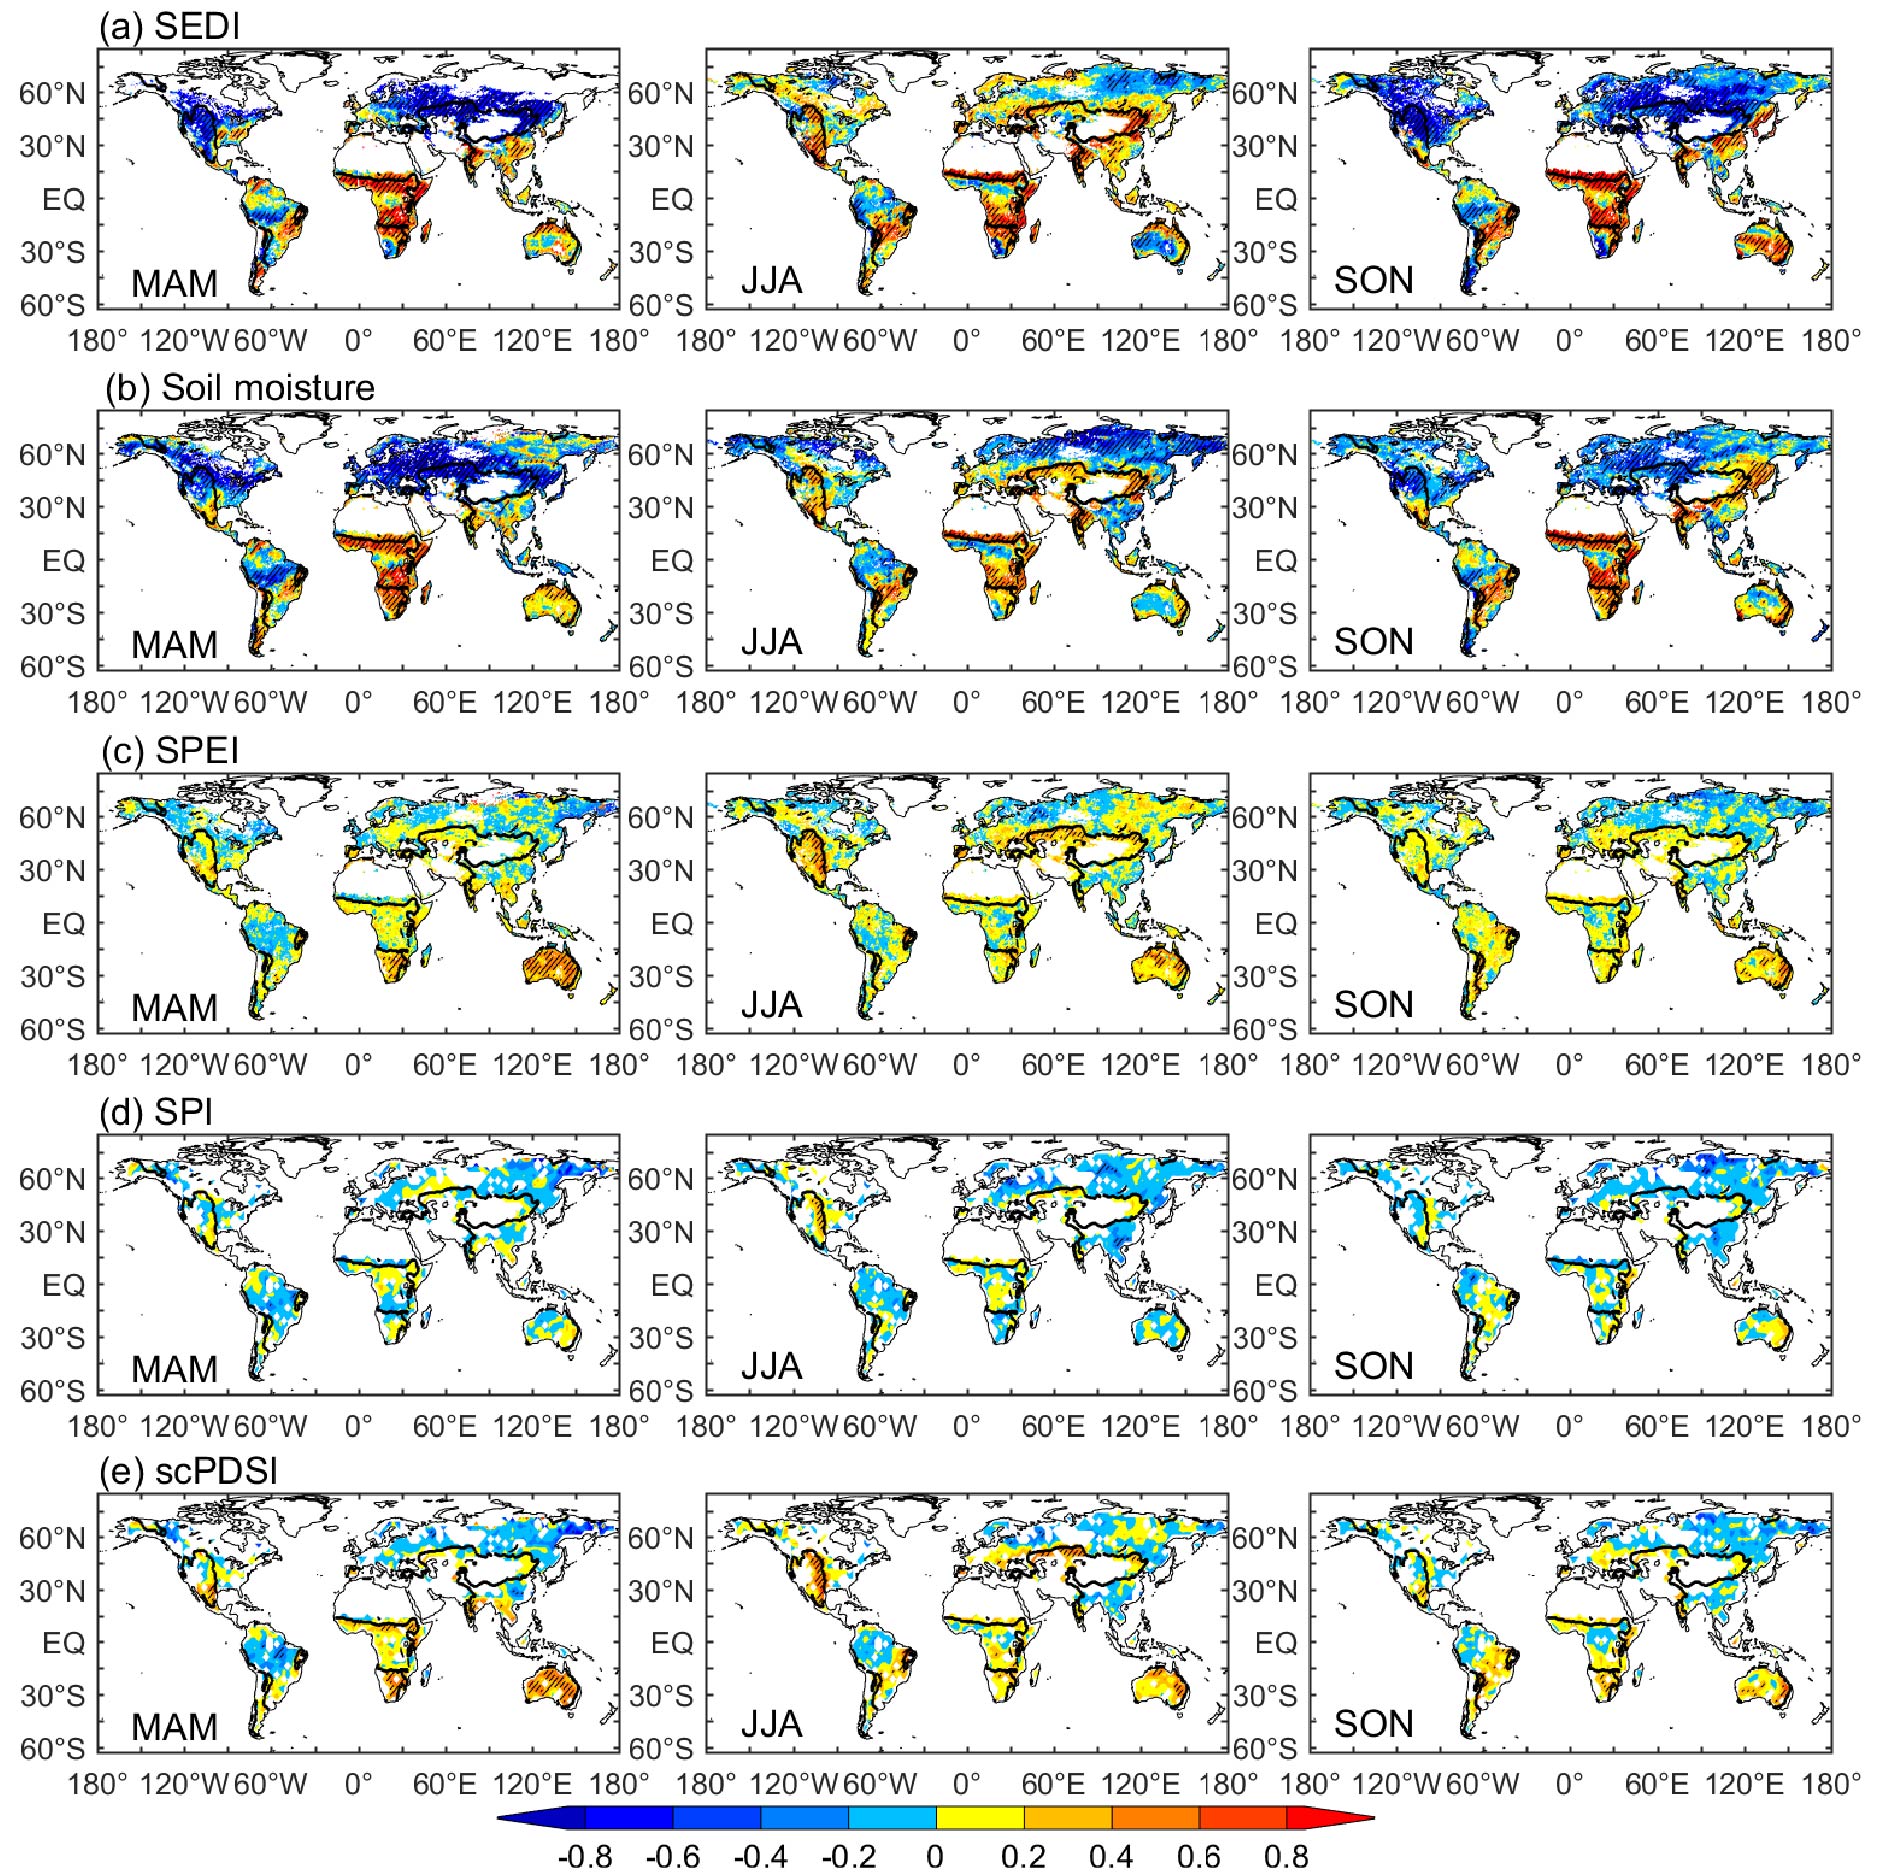 Figure3. Global spatial patterns of correlation coefficients between LAI and (a) SEDI, (b) soil moisture, (c) SPEI, (d) SPI, and (e) scPDSI in spring (MAM), summer (JJA), and autumn (SON) during 1982–2011. Hatched areas denote the 95% confidence level. Black curves (surface wetness index equal to 0.5) denote the arid and semi-arid boundary.
From the perspective of vegetation type, we further quantified the sensitivity of the vegetation response to droughts detected by the four indices in forest, cropland, and grassland regions (Fig. 4a). Table 6 shows the correlation coefficients of the drought indices (CFSR-SEDI, AVG-SEDI, FNL-SEDI, scPDSI, SPEI, SPI, and soil moisture) and LAI in spring, summer, and autumn from 1982 to 2011. In forest, SEDI and LAI in spring, summer, and autumn had significant negative correlations, especially spring and autumn, with most coefficients more than ?0.7. The maximal correlation coefficients occurred in the spring (?0.83). In contrast, the reference indices showed smaller correlation coefficients. In cropland, SEDI was significantly correlated with LAI throughout the growing season, with coefficients over 0.65, whereas the reference indices had weak correlation coefficients with LAI, with a maximum of 0.22. In grassland, the correlation showed a clear seasonality (negative correlations in spring and autumn, and positive correlations in summer). The correlation coefficients were over 0.75 between SEDI and LAI, whereas a significant correlation between the reference indices and LAI was only observed in summer. Similarly, soil moisture and LAI were significantly correlated and with a spatial pattern similar to that of SEDI. As a result, from a global perspective, SEDI can more sensitively detect the response of vegetation growth to dry and wet variations than the reference indices, but the sensitivity varies with vegetation types.
 Figure4. Spatial distribution of global land use/land cover for the (a) global scale and (b) regional scale. The rectangles denote three selected typical vegetation cover areas.
| Spring (MAM) | Summer (JJA) | Autumn (SON) | |||||||||
| Forest | Cropland | Grassland | Forest | Cropland | Grassland | Forest | Cropland | Grassland | |||
| CFSR-SEDI | ?0.83* | 0.80* | ?0.80* | ?0.47* | 0.71* | 0.44* | ?0.66* | 0.74* | ?0.90* | ||
| AVG-SEDI | ?0.76* | 0.81* | ?0.75* | ?0.05 | 0.65* | 0.04 | ?0.74* | 0.43* | ?0.91* | ||
| FNL-SEDI | ?0.83* | 0.82* | ?0.83* | ?0.23* | 0.68* | 0.17 | ?0.80* | 0.6* | ?0.93* | ||
| scPDSI | ?0.14 | 0.06 | ?0.04 | ?0.36* | ?0.08 | 0.40* | ?0.13 | 0.22* | ?0.09 | ||
| SPI | 0.02 | ?0.05 | ?0.07 | ?0.35* | 0.06 | 0.19 | ?0.08 | 0.03 | ?0.05 | ||
| SPEI | ?0.02 | 0.12 | 0.02 | ?0.24* | 0.07 | 0.52* | ?0.09 | 0.20 | 0.03 | ||
| Soil moisture | ?0.89* | ?0.13 | ?0.67* | ?0.44* | 0.66* | 0.21 | ?0.59* | 0.71* | ?0.61* | ||
| Note: * represents value significant at 95% confidence level. | |||||||||||
Table6. Correlation coefficients between LAI and drought indices (CFSR-SEDI, AVG-SEDI, FNL-SEDI, SPEI, SPI, scPDSI, and soil moisture) for forest, cropland, and grassland at a global scale in spring, summer, and autumn during 1982–2011.
We further evaluated the performance of SEDI at regional scales. Figure 5 shows the spatial pattern of correlation of the drought indices versus LAI across China in the growing seasons. SEDI had a significant correlation with LAI in most areas of China, but much less correlation passing the 95% confidence level between the references and LAI. The correlation of SEDI versus LAI also showed clear seasonality; negative (positive) correlations occurred in areas north (south) of 33°N in spring and autumn, whereas many more positive correlation coefficients occurred in summer. The difference stemmed from SEDI and soil moisture becoming more distinct compared with those at the global scale. The humid and semi-humid areas in spring and summer presented positive correlations between SEDI and LAI, but negative for soil moisture; the arid and semi-arid areas in autumn presented negative correlations for SEDI, whereas they were positive for soil moisture.
 Figure5. As in Fig. 3 but for China.
Regarding vegetation effects on regional scales, for three typical vegetation types (Fig. 4b), we compared the correlation coefficients of drought indices versus LAI in spring, summer, and autumn (Table 7). In forest, significant correlation coefficients between SEDI and LAI were found throughout the growing seasons; in cropland, significant correlation coefficients were observed in spring and summer; and significant negative values were found in grassland regions in spring and autumn, but positive values in summer. In contrast, the correlation between the reference indices and LAI was non-significant in all regions and seasons.
| Spring (MAM) | Summer (JJA) | Autumn (SON) | |||||||||
| Forest | Cropland | Grassland | Forest | Cropland | Grassland | Forest | Cropland | Grassland | |||
| CFSR-SEDI | 0.51* | ?0.24* | ?0.77* | ?0.01 | 0.73* | 0.71* | 0.41* | 0.3* | ?0.53* | ||
| AVG-SEDI | 0.54* | 0.04 | ?0.89* | 0.28* | 0.76* | 0.81* | 0.61* | 0.58* | ?0.66* | ||
| FNL-SEDI | 0.64* | ?0.1 | ?0.9* | 0.27* | 0.80* | 0.82* | 0.66* | 0.55* | ?0.67* | ||
| scPDSI | ?0.1 | 0.05 | 0.05 | ?0.1 | ?0.03 | ?0.02 | ?0.09 | ?0.05 | ?0.02 | ||
| SPI | ?0.01 | 0.03 | 0.002 | ?0.18 | 0.03 | 0.15 | ?0.12 | ?0.04 | 0.03 | ||
| SPEI | ?0.01 | ?0.01 | 0.04 | 0.09 | ?0.02 | 0.17 | 0.04 | ?0.01 | 0.06 | ||
| Soil moisture | 0.22* | ?0.01 | ?0.52* | ?0.26* | 0.58* | 0.57* | 0.15 | 0.35* | 0.42* | ||
| Note: * represents value significant at 95% confidence level. | |||||||||||
Table7. As in Table 4 but for forest, cropland, and grassland in China at a regional scale.
2
3.3. A drought case test of SEDI: the course of vegetation–drought interactions
We classified SEDI using a percentile approach (section 2.3). The dry and wet classifications were then used in Southwest China to examine the performance of SEDI in describing the heavy drought process and vegetation responses. The annual temporal evolution of SEDI is shown in Fig. 6. The SEDI values in 2006 and 2010 were ?0.42 and ?0.64, respectively, and in the dry and wet classifications (Table 1) they fell into moderate and severe droughts. Figures 7a and b show the spatial distributions of the SEDI and LAI anomalies during the 2010 severe drought. The SEDI values in the southwest increased gradually, indicating expansion in both the range and intensity of severe drought, as shown in previous studies (Li et al., 2009; Qian et al., 2011; Huang et al., 2012). The LAI sensitively followed the spatiotemporal evolution of drought detected by SEDI. The range and intensity of vegetation browning correspondingly increased, up to the autumn of 2010, and then the relief of the drought stress accelerated the recovery of vegetation from drought disturbance. The monthly time series (Fig. 7c) illustrates that SEDI presented a downward trend after September 2009, and by January to April of 2010 the drought signal occurred when the SEDI values were less than ?0.26. In particular, the value in May was ?0.82, denoting an extreme drought. Accordingly, vegetation browning occurred from mid-February to July of 2010 when the LAI values presented negative anomalies. The minimum LAI negative value of ?0.51 occurred in March, and it corresponded to the minimum SEDI. As such, SEDI was able to regenerate the entire drought evolution process at the monthly scale, and clearly characterize the response of vegetation growth to dry and wet variations. Figure6. Temporal evolution of SEDI over Southwest China (21°–30°N, 95°–110°E) during 1982–2011. The y-axis is the dry and wet classification of SEDI (Table 1). The black dotted line denotes a ?0.26 threshold for drought events.
 Figure7. Spatial distributions for standardized seasonal values of (a) SEDI and (b) LAI with the annual cycle removed during 2009–10. The rectangles denote Southwest China. (c) intra-annual time series of SEDI and LAI with the annual cycle removed during 2009–10. The red dotted line denotes the ?0.26 threshold for drought events, and the blue dotted line denotes vegetation growth, with below or above zero indicating poor or good growth, respectively.
2
4.1. Superiority of SEDI in describing the interaction between dry and wet variations and vegetation growth
Compared with precipitation and air temperature, evapotranspiration combines water and energy balances, and connects the climate system with terrestrial ecosystems. With enhanced atmospheric evaporative demand under global warming (Huang et al., 2017), the surface water budget is altered (Huntington, 2006) and surface evapotranspiration changes accordingly (Jung et al., 2010). Observed vegetation greenness has shown that climate change can alter ecosystems and thus the physiological activities of vegetation (Zhu et al., 2016). In addition, vegetation change is presumably the primary driver of the global evapotranspiration trend (Zhang et al., 2015). For example, the 1991 Mount Pinatubo eruption caused a temporary global cooling and vegetation browning event, resulting in a temporary decrease in evapotranspiration (Lucht et al., 2002). These findings indicate relatively strong interaction between vegetation and evapotranspiration. As a result, SEDI, based on both PET and AET, may better quantify the impact of water stress conditions on vegetation growth under global warming. Individually considered, PET is an efficient variable to quantify drought severity (Hobbins et al., 2016; McEvoy et al., 2016), and AET is a direct indicator of the physiological activities vegetation.2
4.2. Comparison of SEDI with scPDSI, SPI, and SPEI
Comparisons of SEDI with previous indices (section 3.1) verified the consistency between the different indices, but the relationships varied by region and period. These discrepancies may stem from the following reasons:First, according to the definition of SEDI, the difference between AET and PET is that AET is controlled by energy in humid zones and by water in arid zones, whereas PET is always restricted by energy (Budyko, 1948). In humid and semi-humid regions, SEDI tends to have large uncertainty because of the slight difference between AET and PET, both of which are restricted by energy. Consequently, SEDI is more applicable to arid and semi-arid regions. In addition, scPDSI, SPEI, and SPI have similarly large uncertainties in humid areas (Heim, 2002).
Second, according to evapotranspiration theory, PET reflects the atmospheric status, whereas AET contains vegetation transpiration and is thus closely related to ecosystems. However, the reference indices lack a direct variable describing the vegetation process (for example, AET), and some of those indices only reflect the atmospheric status, such as SPI, whereas others partly consider soil moisture, such as scPDSI and SPEI. In addition, the results presented in section 3.2 showed that SEDI and soil moisture, which directly support vegetation growth, had a closer correlation than those that did not. Therefore, the differences between SEDI and the reference indices theoretically indicate the potential of SEDI to link climate change to vegetation responses.
Finally, the data quality accounts for part of the differences. Taking scPDSI for example, the calculation includes precipitation, soil water, runoff, and PET, so the accumulated errors may cause large uncertainties in scPDSI. The SEDI estimate is influenced by the uneven distribution of observational sites, as well as the uncertainties in reanalysis data. The SEDI results based on different datasets were not perfectly consistent; for example, the differences between CFSR-SEDI and AVG-CFSR were large in South America. However, as the data quality of satellite-based and field observations improves in the future, we will obtain more high-quality data to further analyze SEDI.
2
4.3. Regional variability of relationships between SEDI and LAI
Vegetation is distributed in a complex manner across the world, and different vegetation types have different response times (McKee et al., 1993; Pasho et al., 2011; Vicente-Serrano et al., 2013), resistance, and resilience (Chaves et al., 2003; Peng et al., 2012) to droughts. Hence, the correlations between the SEDI and LAI vary with different vegetation types and geographic locations. The forests located in western Russia presented negative correlations (Table 6), because evapotranspiration and vegetation growth are both regulated by temperature, but they have inconsistent response times, i.e., lagged effects (Adams et al., 2009). It should be noted that the negative correlations reflect lagged intra-annual changes, but the long-term trend of vegetation growth is positively correlated with evapotranspiration. The cropland located in India had positive correlations because thriving vegetation growth and large evapotranspiration are supported by the abundant rainfall and mild temperature (Sorooshian et al., 2012), with an annual average precipitation of 1046.5 mm and temperature of 26.3°C. For the grassland located in the semi-arid southwest U.S., the water stress condition is the dominant factor controlling evapotranspiration and vegetation growth. The correlations in grassland presented apparent seasonal differences. The evaporation in spring is so strong that temperature and precipitation do not replenish the water vapor loss caused by evaporation, thus decreasing soil moisture; however, the vegetation is greening, so a negative correlation was observed. Yet, the positive correlation that occurred in summer was due to the increasing soil moisture and greening vegetation supplied by abundant rainfall and suitable temperature (Zuo and Zhang, 2007; Liu et al., 2017). The seasonal contrasts mainly occurring in grassland were because the correlation was not only related to energy and water balance, but was also influenced by the root depth of various vegetation types (Lowman and Barros, 2018). In addition, the forest located in the Qinling Mountains of China presented an opposite correlation (Table 7) that differed from the negative value in western Russia (Table 6). Because the forests located in the Qinling Mountains are in a humid and monsoon region, with annual average rainfall of 1014 mm and temperature of 14.3°C, vegetation growth thus flourishes and soil moisture (evapotranspiration difference) is reinforced.Furthermore, although the spatial distribution of the correlations between SEDI and LAI resembles that between soil moisture and LAI, there were still distinct differences (Figs. 3 and 5). Such differences are mainly understood by the fact that evapotranspiration has high consistency with soil moisture in humid and semi-humid regions where they are controlled by energy, but low consistency in arid and semi-arid regions controlled by water (Heim, 2002). Soil moisture is therefore not suitable to describe the relationship between vegetation growth and climate change in regions including oversaturated water, such as tropical rainforest where there are no clear seasonal changes of soil moisture and the vegetation growth is dominantly restricted by energy (Rowland et al., 2015). SEDI is superior to soil moisture in characterizing the interaction between vegetation growth and climate change.
SEDI can reasonably capture dry and wet climatic changes, especially over arid and semi-arid regions. SEDI has consistent interannual variations and long-term trends with scPDSI, SPI, SPEI, and soil moisture. Moreover, SEDI can detect extreme drought events at monthly to annual scales.
SEDI can closely link vegetation variations with dry and wet climate fluctuation signals. In addition, although SEDI is associated with soil moisture, it involves water and energy balance processes that are capable of describing the interaction between vegetation and water stress conditions.
This study suggests that SEDI is more practical than precipitation and temperature indices in highlighting signals of biological effects in climatic droughts. In the future, we will quantify the relationship between dry and wet change and ecological processes to project the future potential changes in regional ecological environments.
Acknowledgments. This study was jointly sponsored by the National Key R&D Program of China (Grant No. 2018YFA0606002), the National Natural Science Foundation of China (Grant Nos. 41575087 and 41875082), the Jiangsu Collaborative Innovation Center for Climate Change, and the UK–China Research & Innovation Partnership Fund through the Met Office Climate Science for Service Partnership (CSSP) China as part of the Newton Fund.
