HTML
--> --> -->China is the most populous country and a huge energy consumer. Against the background of global warming, the rate of temperature rise across China has been 0.9°C–1.5°C since 1909, slightly higher than the global average (The Third National Assessment Report on Climate Change, 2015). Most previous studies are based on CMIP5 simulations and the Community Earth System Model (CESM) low-warming projections, and they mainly focused on the EHT changes, specific to the 1.5°C and 2.0°C global warming scenarios (Sanderson et al., 2017; Lin et al., 2018; Shi et al., 2018a; Yang et al., 2018; Yu et al., 2018). For example, Li et al. (2018) and Zhang et al. (2020b) both found that the annual temperature in China was projected to increase at a rate that is approximately 10% higher than the global average level in the 1.5°C and 2.0°C warming scenarios. According to the conclusion from Yu et al. (2018) and Shi et al. (2018a), EHT events in China will increase significantly at the 1.5°C and 2.0°C thresholds, especially for the indices affected by maximum temperature. In addition, some studies also focused on even more extreme scenarios, such as 3°C, 4°C, and 5°C (Wang et al., 2018; Weber et al., 2018). Xu et al. (2017) and concluded that the mean surface temperature over Asia would increase about 4.6°C and 6.0°C at 3°C and 4°C global warming, and more substantial warming would occur in high latitudes than in low latitudes. Overall, most studies conclude that China will be warmer than global averages (Hu et al., 2017; Li et al., 2018; Shi et al., 2018b). However, due to the earlier modeling framework not accounting for population changes, previous studies have rarely considered the number of people in China that will suffer due to China’s warming exceeding that of the global average level.
The Coupled Model Intercomparison Project Phase 6 (CMIP6) provides the latest outputs of many climate models developed by institutions around the world for Scenario Model Intercomparison Project designed for climate projection in different emission scenarios. The new phase of the CMIP is designed to improve climate simulations and provide for additional modeling groups that are expected to be more reliable (Eyring et al., 2016). Some researchers have already examined the newly released simulations (Chen et al., 2020; Jiang et al., 2020; Yang et al., 2020; Zhou et al., 2020; Zhu et al., 2020). Zelinka et al. (2020) pointed out that for the implied social scenarios in CMIP6, the models responded in such a way that suggested higher equilibrium climate sensitivity. Chen et al. (2020) have compared the simulating climate extremes in CMIP6 and CMIP5 models, and they found that the models in CMIP6 had finer resolution that ultimately resulted in improved dynamical processes. Zhu et al. (2020) concluded that, compared with CMIP5, the CMIP6 multi-model ensemble mean not only simulates the spatial pattern of air temperature well, but out performs the CMIP5 in modeling China's climate index. Since the CMIP6 simulations were recently released and designed to incorporate population changes, they are well-suited to studying future changes in China's EHT and determining how many people in China will experience warming above the global average level.
This study aims to analyze future changes in EHT based on the recently released CMIP6 outputs, and addresses following questions at the 1.5°C, 2°C, 3°C, 4°C, and 5°C global warming scenarios; (1) How many people in China will experience warming at higher than global average levels? (2) What is the future trend regarding the frequency of EHT in China? (3) How many impacts might be avoided by limiting warming under 1.5°C compared to the higher scenarios?
| No | Model name | Group | Resolution (lat × lon) |
| 1 | ACCESS-CM2 | CSIRO/Australia | 1.25°×1.875° |
| 2 | ACCESS-ESM1-5 | CSIRO/Australia | 1.25°×1.875° |
| 3 | AWI-CM-1-1-MR | AWI/Germany | 0.94°×0.94° |
| 4 | CanESM5 | CCCma/Canada | 2.8°×2.8° |
| 5 | CESM | NCAR/USA | 0.94°×1.25° |
| 6 | CESM-WACCM | NCAR/USA | 0.94°×1.25° |
| 7 | CNRM-CM6-1 | CNRM-CERFACS/France | 1.4° ×1.4° |
| 8 | CNRM-ESM2-1 | CNRM-CERFACS/France | 1.4°×1.4° |
| 9 | EC-Earth3 | EC-Earth-Consortium/Europe | 0.7°×0.7° |
| 10 | EC-Earth3-Veg | EC-Earth-Consortium/Europe | 0.7°×0.7° |
| 11 | HadGEM3-GC31-LL | MOHC/UK | 1.25°×1.875° |
| 12 | IPSL-CM6A-LR | IPSL/France | 1.26°×2.5° |
| 13 | KACE-1-0-G | NIMS-KMA/South Korea | 1.25°×1.875° |
| 14 | MRI-ESM2-0 | MRI/Japan | 1.125°×1.125° |
| 15 | NESM3 | NUIST/China | 1.875°×1.875° |
| 16 | UKESM1-0-LL | MOHC/UK | 1.25°×1.875° |
Table1. Basic information (name and group) and atmospheric resolution (latitude × longitude) of sixteen CMIP6 global climate models.
The population datasets under three SSPs (SSP1, SSP2, and SSP5), named Global One-Eighth Degree Population Base Year and Projection Grids Based on the SSPs (V1.01), were used in this study (Jones and O’Neill, 2016, 2020). They can be considered as a sustainable development scenario, a business-as-usual scenario, and a fossil-fueled development scenario. The model uses global total population data at 10-year intervals from 2010 to 2100, with a horizontal resolution of 0.125° × 0.125°. The datasets were developed by the Center for International Earth Science Information Network (CIESIN), Columbia University, and were obtained from the NASA Socio-economic Data and Applications Center (SEDAC). Spatially explicit population projections of the SSP project are up-scaled to a 1.0° × 1.0° spatial resolution to match the resolution of the climate model.
3.1. Periods of preindustrial, present-day, and specific warming thresholds
The period spanning 1995–2014 in the historical simulation represents the present-day, which is the same as the definition in Jiang et al. (2020). Consistent with previous researchers that used CMIP5, the pre-industrial period is defined to be 1861–1900 (Xu et al., 2017; Fu et al., 2018). The specific global warming periods in this study (i.e., 1.5°C, 2°C, 3°C, 4°C, and 5°C) use the pre-industrial level as a baseline for comparison. For each climate model, we calculated the 20-year moving average of the GMT anomaly (by subtracting it from the average of the pre-industrial period) and then found the particular year in this time series that reached a specific warming threshold, which is then defined as the final year. We designate the final year as the temporal mid-point and take 10 years forward and nine years backward in order to establish the specific 20-year warming period. Consistent with previous studies (Collins et al., 2013; Zhou et al., 2018; Jiang et al., 2020), the changes in this study are deemed to be robust if at least 2/3 of total models agree on the sign of change.2
3.2. Extreme high temperature indices
This study used three EHT indices, warmest day (TXx), warm days (TX90p), and warm spell duration indicator (WSDI) to analyze the impacts of global warming on EHT in China. Their definitions are shown in Table 2 (Meehl and Tebaldi, 2004; Smith et al., 2013). The present-day period (1995?2014) is referred to as the baseline. The EHT indices are calculated based on all days of the present-day period and the future period (2015?2100). The calculations of TX90p and WSDI use the 90th percentile of the baseline maximum temperature as their threshold. These respective values are then tallied individually for each calendar day. For example, the threshold for January 1st should exceed 90th percentile of the days on the same date during the present-day period. Therefore, TX90p is defined as the number of days with the daily maximum SAT higher than the threshold, and WSDI is defined as the number of occurrences with at least six consecutive days that had a maximum SAT higher than the threshold (Table 2). Furthermore, we calculated the indices separately for each model and averaged them to display as the multi-model ensemble mean (MME).| Acronym | Indicator | Definitions | Units |
| TXx | Warmest day | Maximum Tmax in a year | °C |
| TX90p | Warm days | Days when Tmax >90th percentile of all days in the present-day | d |
| WSDI | Warm spell duration indicator | At least 6 consecutive days’ Tmax higher than 90% days of present-day | d |
| *Where Tmax means daily maximum SAT. | |||
Table2. Definitions of extreme high temperature indices.
2
3.3. Response to global warming
To investigate the response of EHT to global warming, the projections of EHT indices and GMT are averaged over 10-year periods to eliminate interannual variability (Collins et al., 2013; Jiang et al., 2020). From 2016 to 2100, a five-year moving average is calculated to obtain a running-mean time series of sixteen values (i.e., the averages of 2016?2025, 2021?2030, and up to 2091?2100). The linear regression between these running-mean EHT indices and GMT is then computed, and the resulting regression coefficient is referred to as the response rate of EHT to global warming, which is recognized as the long-term forced signal. It is used to figure out the amount by which EHT indices will change in response to a global mean temperature rise of 1°C.2
3.4. Avoided Impacts
The avoided impacts (AI) of EHT caused by additional warming were studied by using formula 1 (Li et al., 2018).Here AI represents avoided impacts, Cx and C1.5 represent the changes in EHT indices at the x°C (x can be 2, 3, 4 and 5) and 1.5°C global warming relative to the present-day level. The AI is used to infer the degree of impact that can be avoided by maintaining global warming at 1.5°C, as opposed to other higher warming thresholds (2°C, 3°C, 4°C and 5°C).
In addition, we also calculated the avoided impacts of population-weighted changes (AIpop), by applying formula 2.
Here, CPx and CP1.5 represent the changes in the population-weighted EHT indices at the x°C (x can be 2, 3, 4 and 5) and 1.5°C scenarios compared with the present-day level. For example, CP1.5 is the result of EHT indices multiplied by the population at 1.5°C global warming minus the EHT indices multiplied by the population at the present-day level. The calculations above are performed at each specific grid point..
4.1. Future changes in surface air temperature
As shown in Figures 1 and 2a, the results of CMIP6 indicate that global warming following the high-emission pathway (e.g., SSP5-8.5) will increase more dramatically than that following the low-emission pathway (e.g. SSP1-2.6), which is consistent with the previous conclusions derived from CMIP5. For example, the specific warming threshold under SSP5-8.5 will be reached sooner compared to the threshold times indicated for the SSP1-2.6 and SSP2-4.5 scenarios (Fig. 1). The multi-model ensemble mean (MME) results show that the annual GMT anomalies relative to pre-industrial levels under SSP5-8.5 will exceed 5°C before 2100, while under SSP1-2.6 and SSP2-4.5 it will only reach 2°C and 3°C. Although there are some differences between the time sensitivity of each model, it can be concluded that global warming will reach 1.5°C (2°C) before 2030 (2050) under the aforementioned three future scenarios. As displayed in Fig. 2a, after 2050, global warming under the SSP1-2.6 scenario projects the warming to become stable, while it will continue to increase under SSP2-4.5 and SSP5-8.5. Under SSP2-4.5, global warming will reach 3°C at about 2070. Under SSP5-8.5, global warming will reach 3°C, 4°C, and 5°C before 2060, 2080, and 2100, respectively. Figure1. The timing of reaching the specific warming threshold under SSP1-2.6 (green), SSP2-4.5 (blue) and SSP5-8.5 (red). The MME indicates the multi-model ensemble mean results.
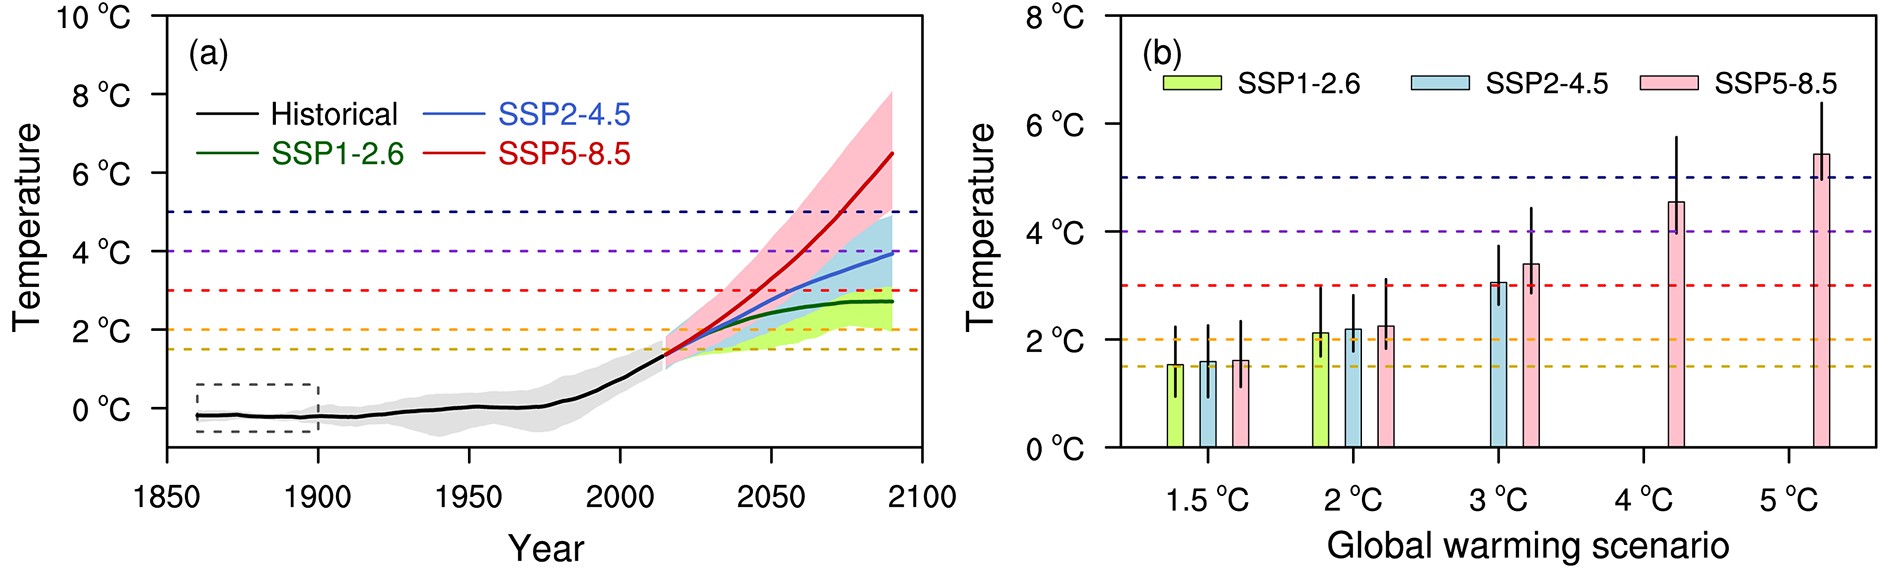 Figure2. (a) Annual global mean surface air temperature (SAT) anomalies relative to pre-industrial levels (1861?1900) from 1850 to 2100. The black line is from 1850 to 2014 (the historical period), and the green, blue and red lines are from 2015 to 2100 (future period) under SSP1-2.6, SSP2-4.5, and SSP5-8.5, respectively. Shading indicates the uncertainties of the multi-model ensemble. (b) China’s regional mean SAT changes relative to the pre-industrial level at 1.5°C–5°C global warming. Green, blue and red bars represent results of SSP1-2.6, SSP2-4.5, and SSP5-8.5. The perpendicular black lines at the top of the bars represent the variation between the 10th and 90th percentiles of the multi-model ensemble.
Many previous studies have pointed out that at 1.5°C and 2°C global warming, China’s temperature rise (relative to pre-industrial levels) will exceed the global average level. The CMIP6 results also show that not only at 1.5°C and 2°C, but also at the 3°C, 4°C, and 5°C global warming scenarios, the increases in China’s regional mean SAT will be higher than the global average (Fig. 2b). Under the 1.5°C and 2°C scenarios, the annual SAT over China is projected to increase by 1.55°C and 2.12°C, under the SSP1-2.6, by 1.59°C and 2.18°C under the SSP2-4.5, and by 1.60°C and 2.20°C under SSP5-8.5. Intuitively, the temperature increases are projected to be greatest under SSP5-8.5 and least pronounced under SSP1-2.6. Furthermore, when the warming threshold increases, the average SAT in China will increase more than the global average level. For example, the SSP5-8.5 scenario, which suggests when global warming reaches 3°C, the average increase of regional SAT in China is approximately 3.40°C, which is about 13% higher than the global level, while the increase at 2°C global warming (2.20°C) is about 10% higher than the global level.
The spatial patterns of changing SAT relative to the pre-industrial level, displayed in Fig. 3, are used to display which regions will experience warming above the global average. In order to reduce the complicated description, we named the areas that will experience warming above the global average level as overheating areas. For example, at 1.5°C global warming, the areas where the increases in SAT exceed 1.5°C are the overheating regions. As shown in Fig. 3, the overheating areas at 1.5°C–5°C are mostly located in Tibet and northern China (i.e., Northwest China, North China and Northeast China). This is similar to the conclusions drawn by previous studies that northern China and Tibet will experience more warming in the future (Zhang et al., 2020b). Analogous results, under different emission scenarios, found that the high-emission scenario (SSP5-8.5) will have more overheating area. Under SSP1-2.6/SSP2-4.5/SSP5-8.5 (Fig. 4a), about 56%/57%/58% and 60%/61%/64% areas of China will experience warming above the global level at 1.5°C and 2°C global warming. At 3°C global warming, the land fraction of overheating areas in China will be 52% under SSP2-4.5, while the value under SSP5-8.5 will reach 69%. Meanwhile, when global warming increase to 4°C and 5°C under SSP5-8.5, the land fraction of overheating areas in China will reach nearly 70%.
 Figure3. Spatial patterns of SAT changes relative to pre-industrial levels. (a), (b) and (c) are for 1.5°C global warming under SSP1-2.6, SSP2-4.5 and SSP5-8.5, respectively. (d), (e) and (f) are for 2°C global warming under SSP1-2.6, SSP2-4.5, and SSP5-8.5, respectively. (g) and (h) are for 3°C global warming under SSP2-4.5 and SSP5-8.5. (i) and (j) are for 4°C and 5°C global warming under SSP5-8.5. Dotted areas denote where at least 2/3 models agree on the sign of the change.
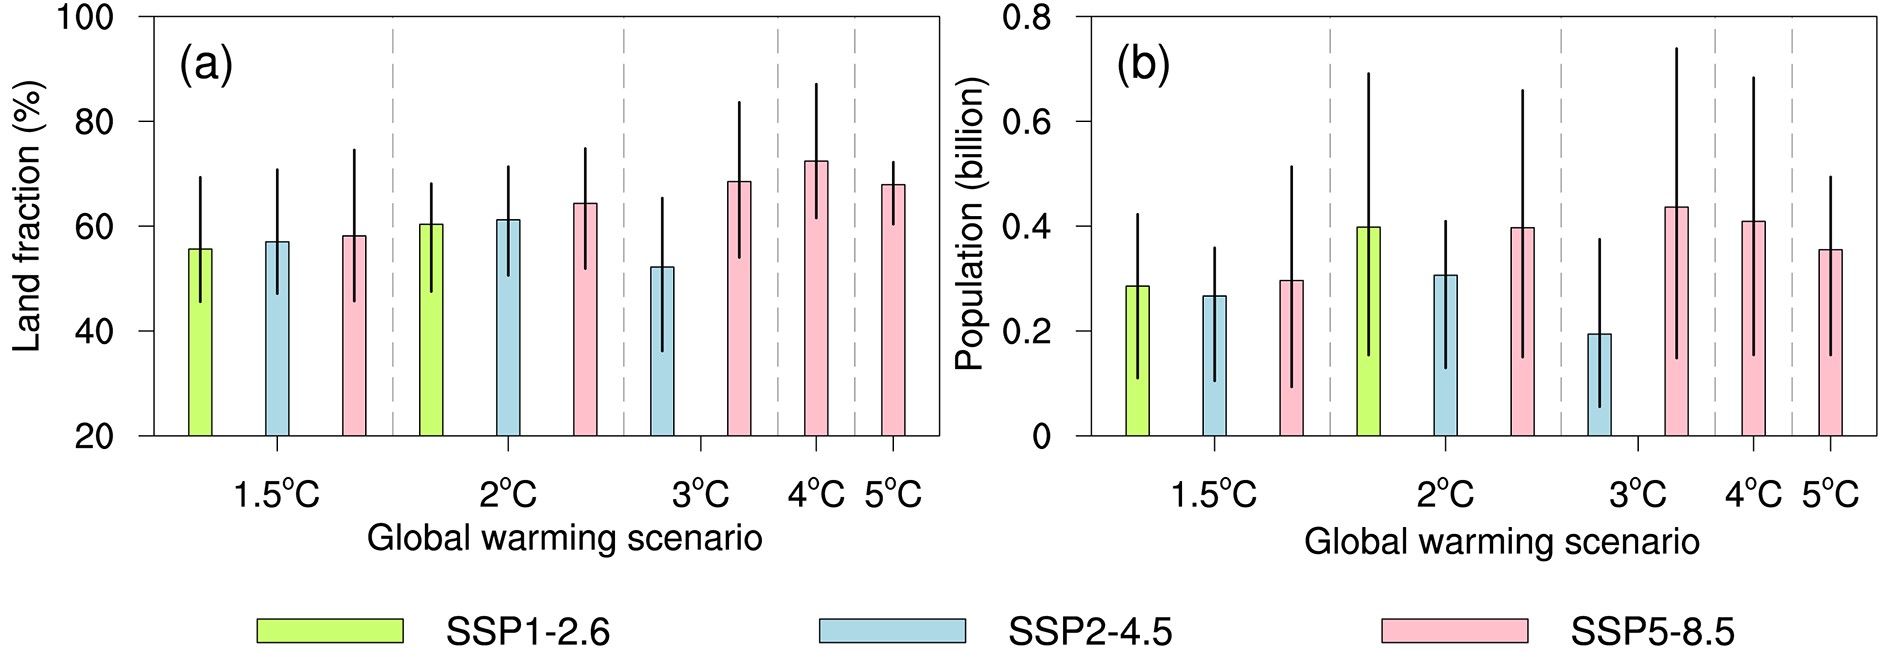 Figure4. (a) The land fraction of China where warming is higher than the global average (%), and (b) the population of these regions (billion). Green, blue and red bars represent results of SSP1-2.6, SSP2-4.5, and SSP5-8.5. The perpendicular black lines at the top of the bars represent the variation between the 10th and 90th percentiles of the multi-model ensemble.
The population in these overheating areas of China (Fig. 4b) indicate that there will be more people living in the overheating regions under SSP1-2.6 and SSP5-8.5 than under SSP2-4.5. For example, at 1.5°C (2°C) global warming, the population in the overheating areas under SSP1-2.6 and SSP5-8.5 will be 0.29 (0.40) billion and 0.30 (0.40) billion, accounting for 21% (30%) and 22% (30%) of China’s total population, while the number under SSP2-4.5 will be 0.27 (0.31) billion, accounting for 19% (30%) of China’s total population. The number at 3°C global warming under SSP2-4.5 will decrease to 0.19 billion (16% of China’s total population). While under SSP5-8.5, when global warming rises to 3°C/4°C/5°C, there will be about 0.44/0.41/0.36 billion people in the overheating areas, accounting for 37%/41%/34% of China’s total population. Overall, approximately 0.19 to 0.44 billion people in China will experience warming that is higher than the global level in the future.
2
4.2. Future changes in extreme high temperature
In an effort to quantify the response of EHT events to global warming, we calculated the response rate of the EHT indices to GMT (Fig. 5). The results indicate that EHT events in China are expected to continue to increase as global warming continues. In most parts of China, the response rates of TXx (Figs. 5a–c), TX90p (Figs. 5d–f), and WSDI (Figs. 5g–i) to global warming are higher than 0.4°C °C?1, 10 d °C?1, and 5 d °C?1, respectively. The response rates of TX90p and WSDI demonstrate remarkable spatial consistency as opposed to the TXx. For TX90p and WSDI, there will be a significant response in southern China, with increased rates exceeding 30 d °C?1 and 15 d °C?1. This is particularly true in southern Tibet and South China, TX90p and WSDI will increase by more than 40 and 20 days annually when the GMT goes up by 1°C. The spatial distribution of the TXx shows almost an inverse distribution, that is, the high response areas are mostly located in northern China. For illustration, under SSP5-8.5 (Fig. 5c), the TXx in most parts of northern China will increase by at least 1.2°C for every 1°C rise in GMT, while the increases in the south will be lower than this.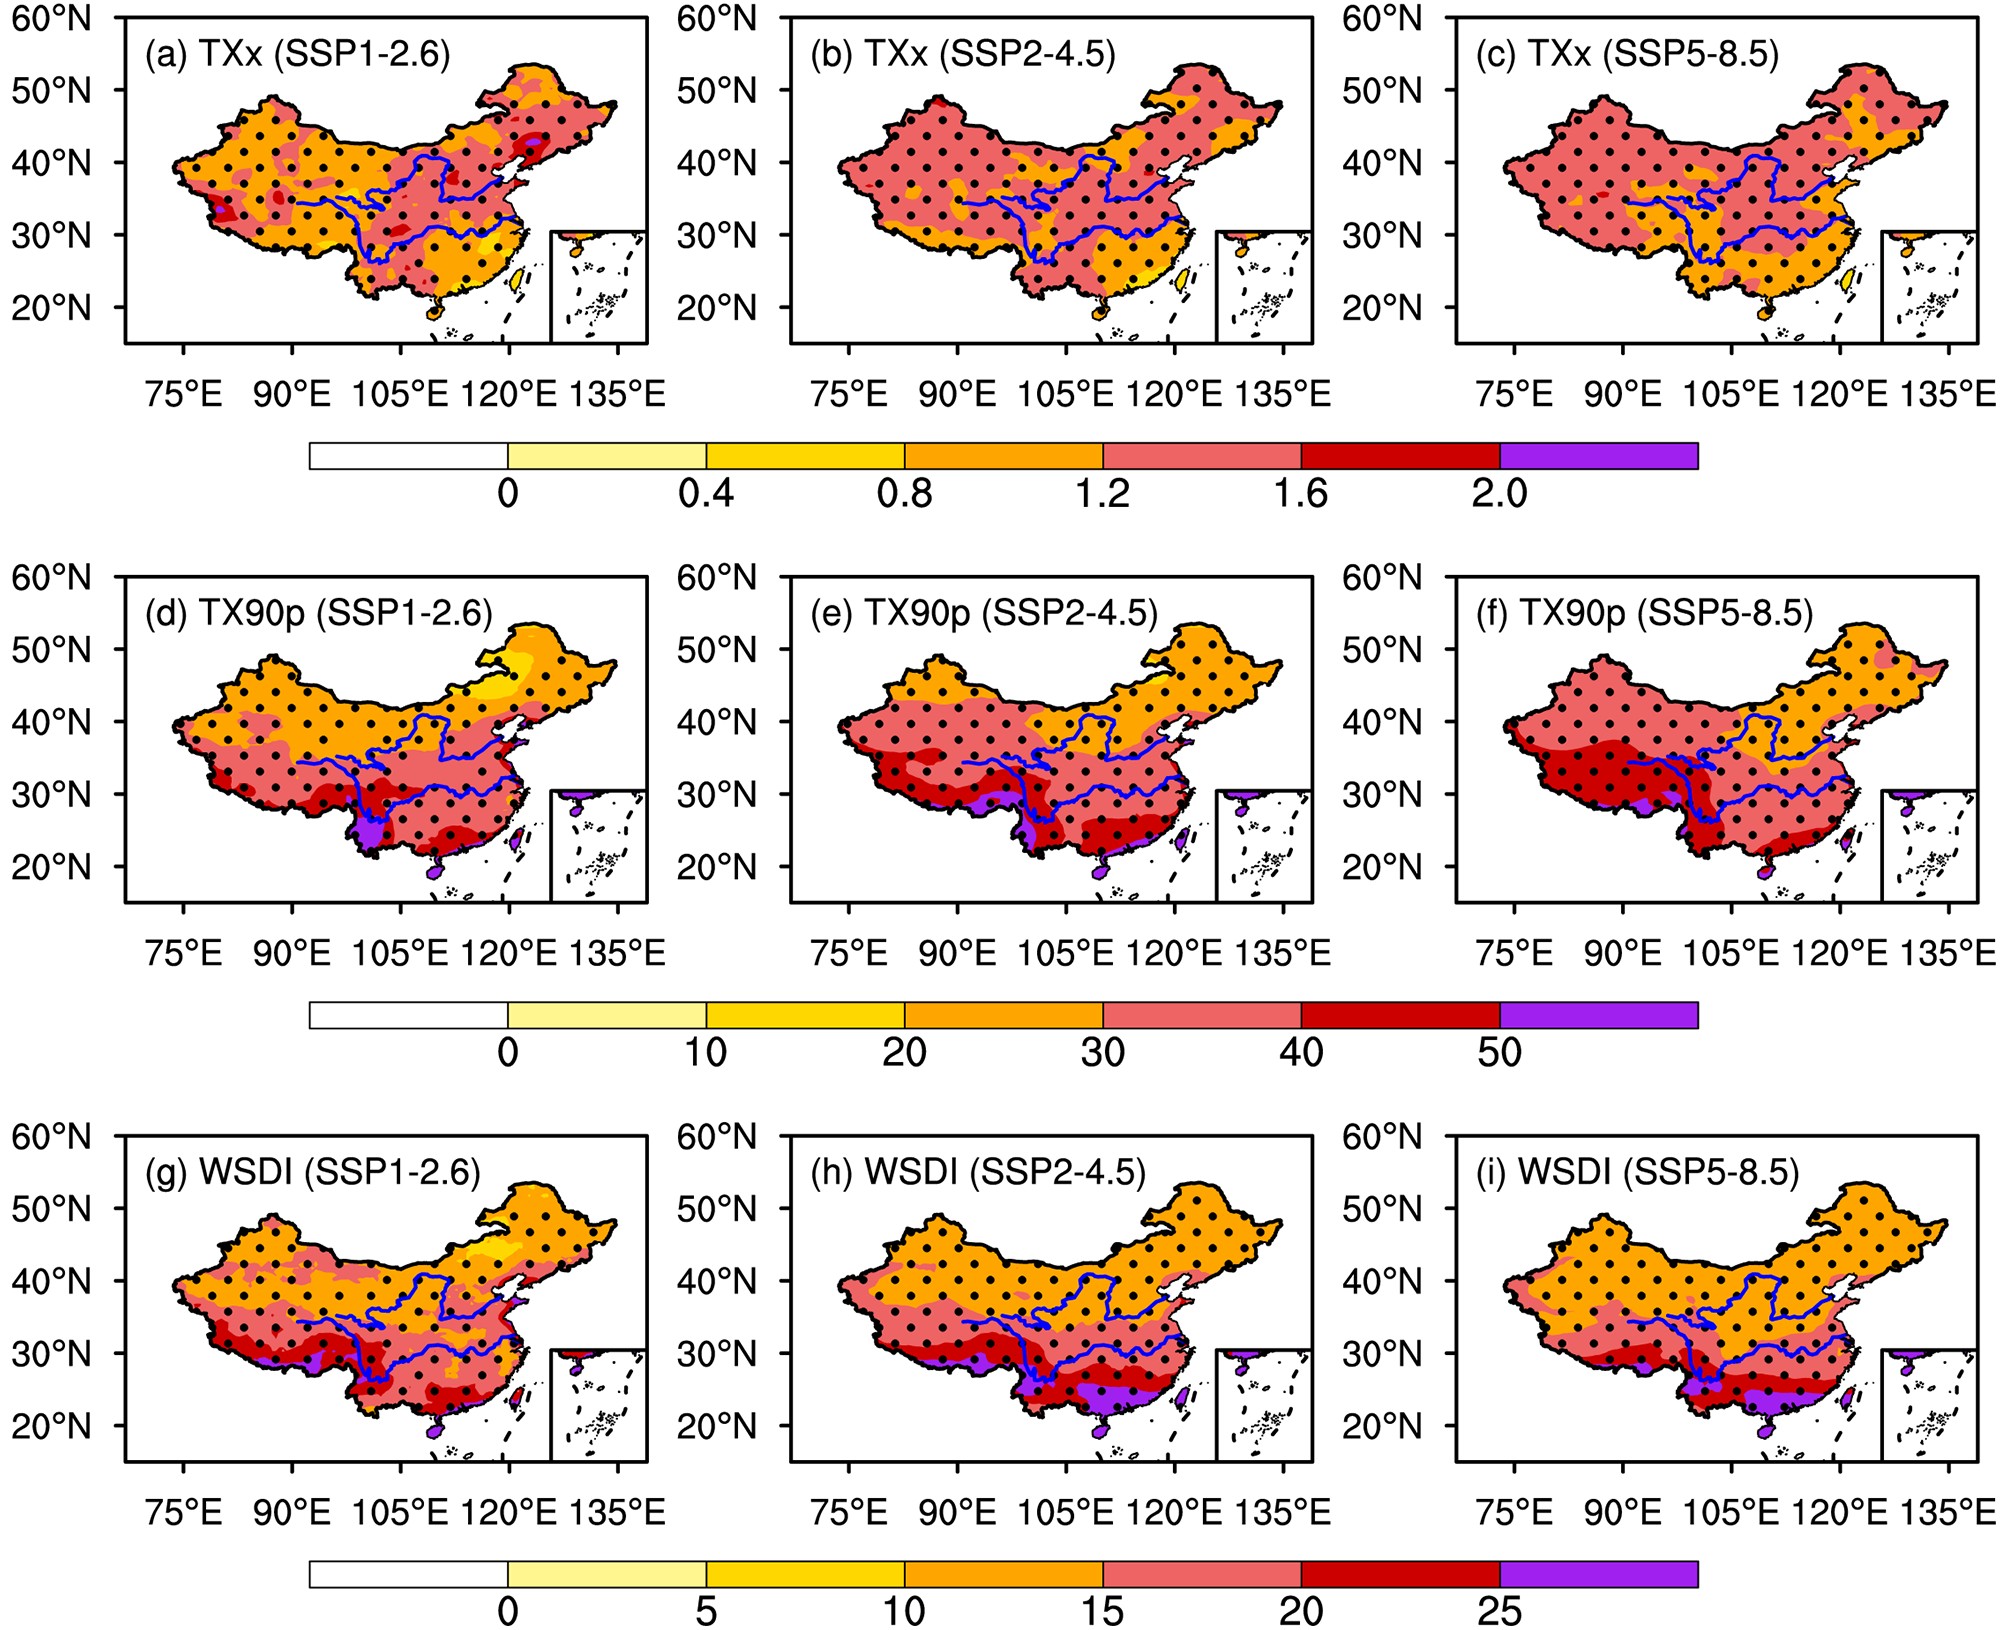 Figure5. The responses of EHT changes to global warming under SSP1-2.6, SSP2-4.5 and SSP5-8.5. (a)–(c) are for TXx (°C °C?1); (d)–(f) are for TX90p (d °C?1); (g)–(h) are for WSDI (d °C?1). Dotted areas denote where at least 2/3 models agree on the sign of the change.
We used the present-day period (1995–2014) as the baseline to discuss future changes in EHT at each specific global warming scenario (1.5°C–5°C). As shown in Fig. 6, the spatial distribution of the TXx changes indicates that the increase in northern China will be greater than in southern China. For example, under the 1.5°C global warming scenario, the increased TXx in southern China will be less than 1°C, while the increases in some parts of Northeast China will be higher than 1.5°C (Figs. 6a–c). The increase under the SSP5-8.5 scenario is slightly higher than those under SSP1-2.6 and SSP2-4.5. For example, at 3°C global warming, the areas where increased TXx exceed 3°C are larger under SSP5-8.5 (Fig. 6g) than those under SSP2-4.5 (Fig. 6h). For the regional mean results of China (Fig. 9a), the increased TXx at 1.5°C and 2°C global warming is similar in each scenario, ranging from 0.2°C–2.1°C and 1.1°C–2.9°C respectively. When global warming reaches 3°C, 4°C, and 5°C, China's regional mean TXx will increase by 2.1°C–4.2°C, 3.6°C–5.4°C, and 4.1°C–6.8°C relative to present-day levels, respectively (Fig. 9a).
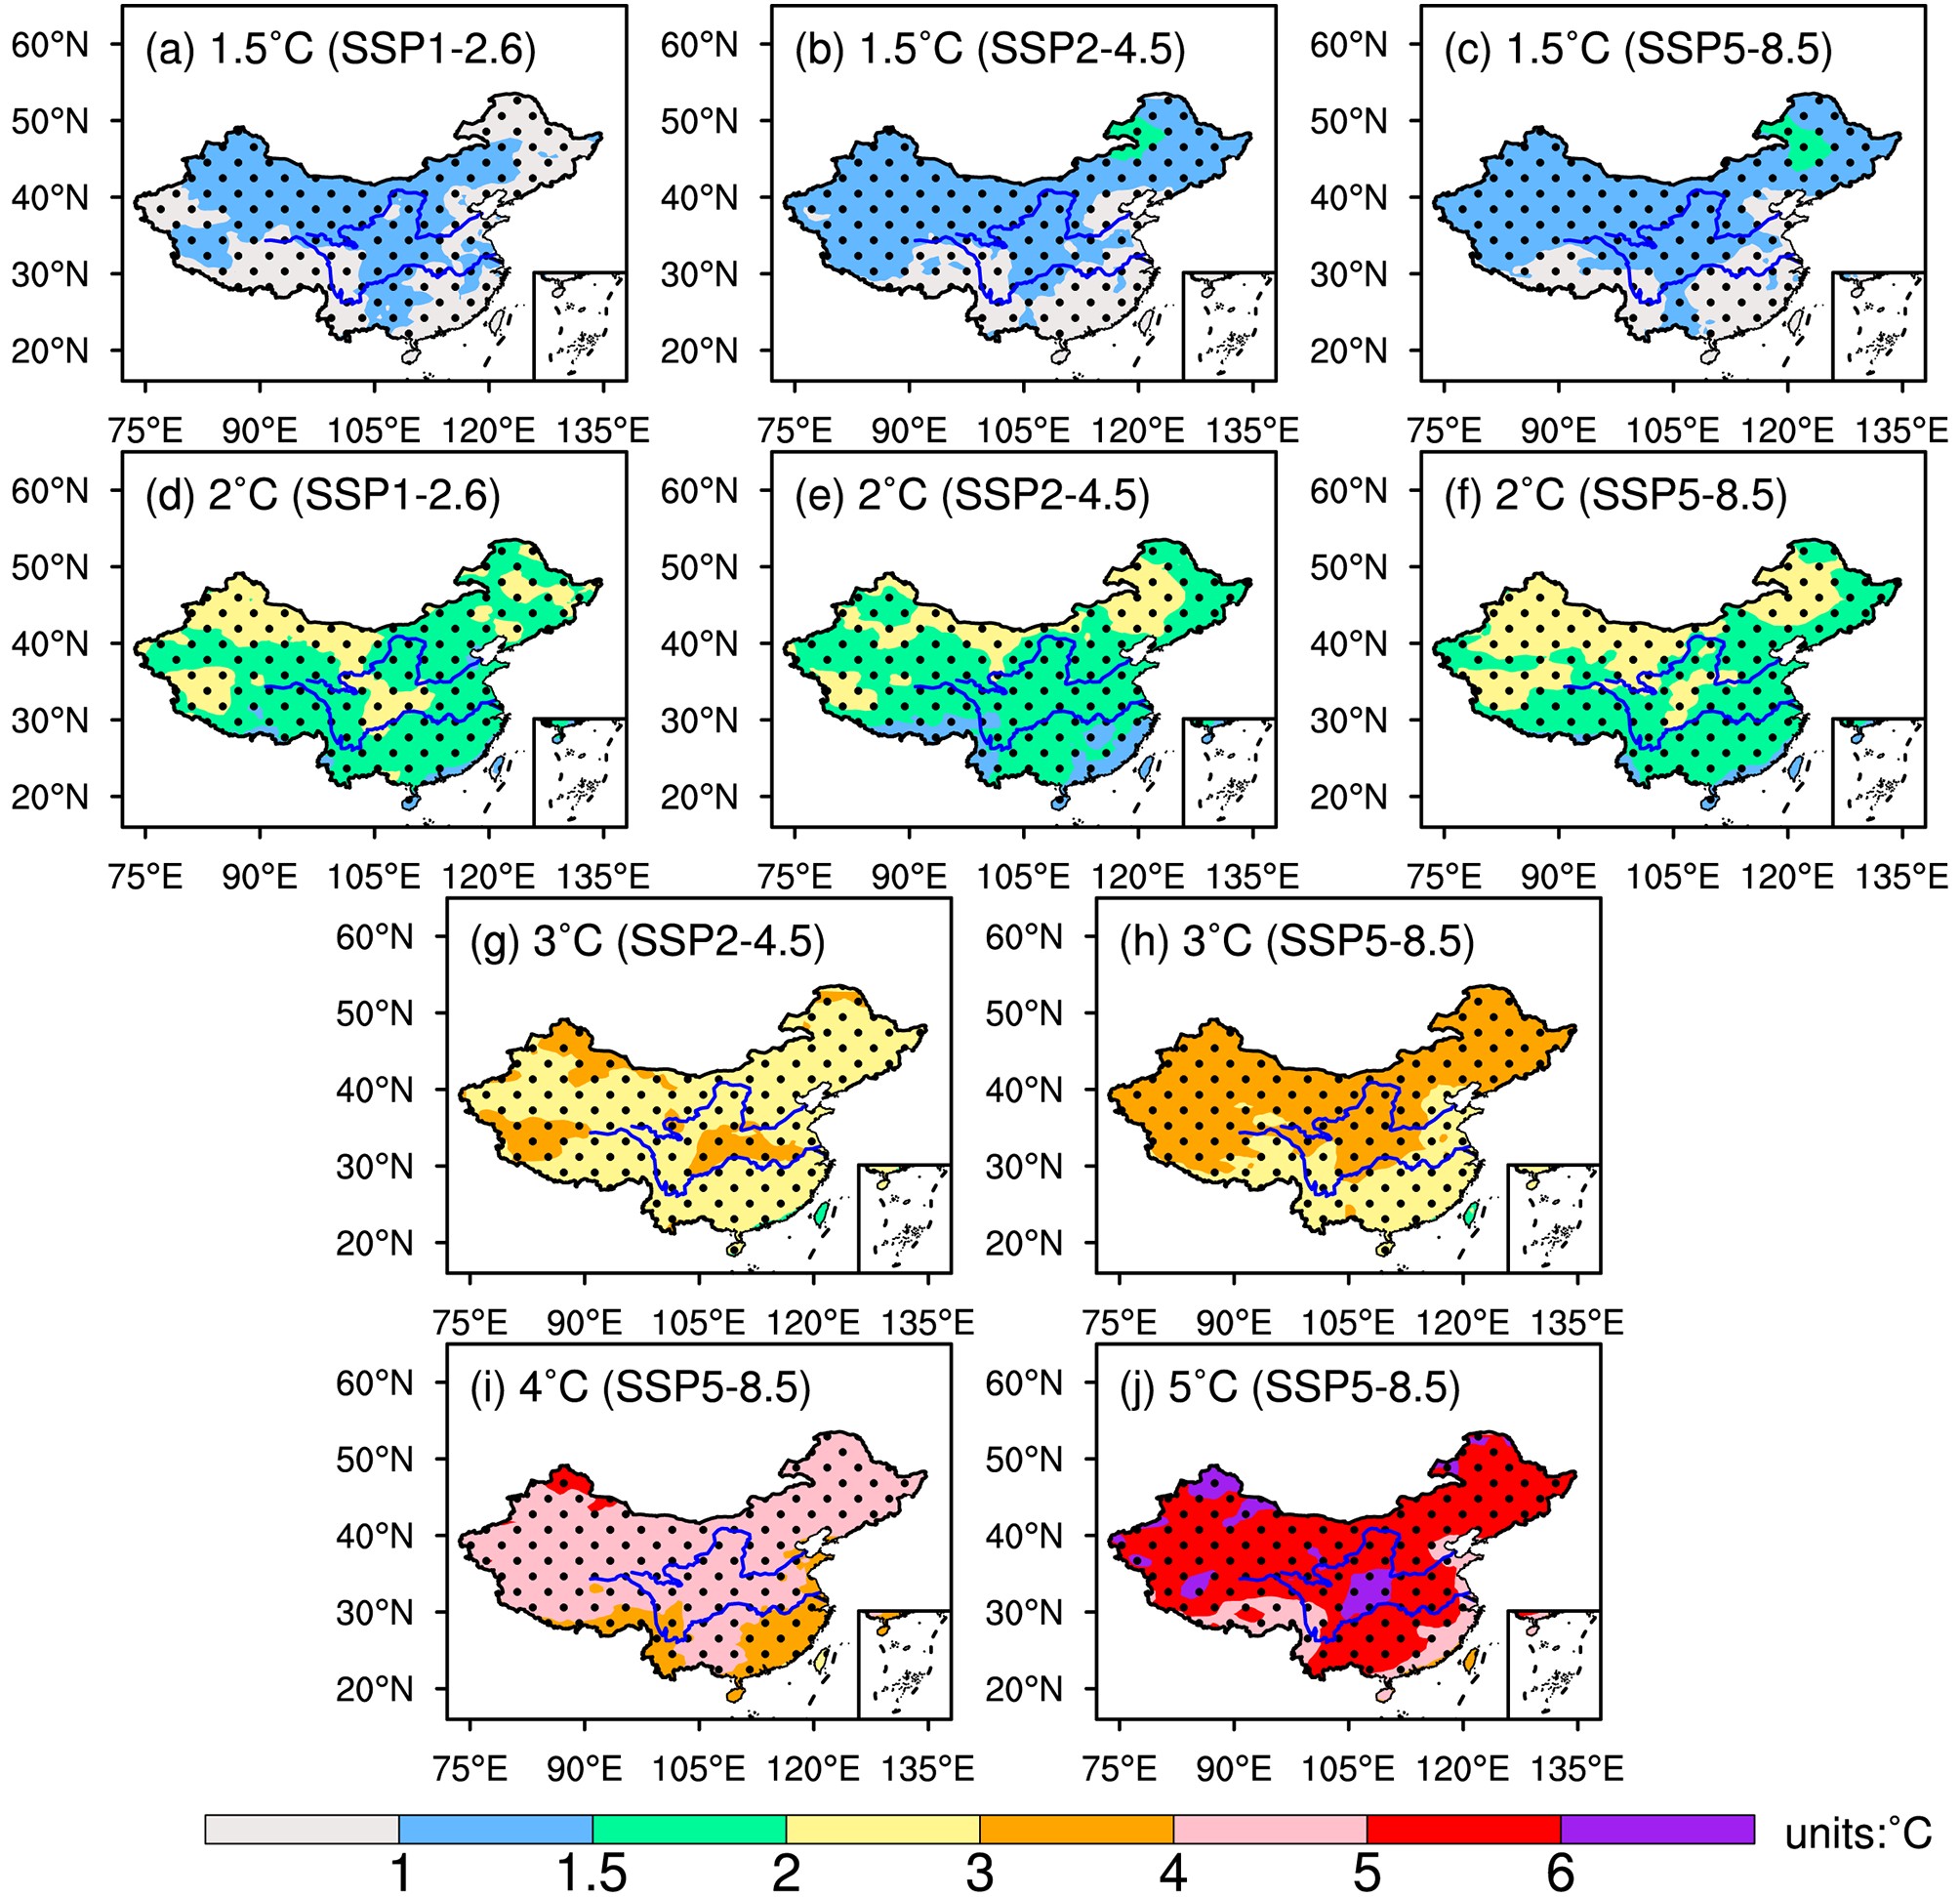 Figure6. Spatial patterns of TXx changes relative to the present-day. (a), (b) and (c) are for 1.5°C under SSP1-2.6, SSP2-4.5 and SSP5-8.5, respectively. (d), (e) and (f) are for 2°C under SSP1-2.6, SSP2-4.5, and SSP5-8.5, respectively. (g) and (h) are for 3°C under SSP2-4.5 and SSP5-8.5. (i) and (j) are for 4°C and 5°C under SSP5-8.5. Dotted areas denote where at least 2/3 models agree on the sign of the change.
 Figure9. Compared to present-day, China’s regional mean increases in TXx (a), TX90p (b), and WSDI (c) at 1.5°C–5°C global warming. Green, blue and red box whisker plots represent results of SSP1-2.6, SSP2-4.5, and SSP5-8.5. The box-whisker plots show the 10th, 25th, 50th, 75th, and 90th percentiles of the multi-model ensemble.
Interestingly, the spatial distribution of changing TX90p (Fig. 7) and WSDI (Fig. 8), is similar to the results of the response rate to global warming, yet they are still almost the reverse of TXx. Large areas of increased frequency for TX90p and WSDI will occur in southern China, especially in southern Tibet and South China. For example, when global warming reaches 3°C, the increase in TX90p (WSDI) in southern China will exceed 75 (40) days per year, with parts of southern Tibet and southern China exceeding 100 (60) days per year. Furthermore, the increases under SSP5-8.5 will be higher than those under SSP1-2.6 and SSP2-4.5. For instance, compared to SSP1-2.6 and SSP2-4.5, the WSDI will increase by 10 days or more over more areas than under SSP5-8.5 (Figs. 8a-c). Overall, compared to the present-day level, China’s TX90p (WSDI) will increase by 7–45 (3–23) days, 31–64 (15–33) days, 31–64 (30–52) days, 58–105 (30–52) days, 99–146 (48–68) days, and 121–183 (60–87) days at 1.5°C, 2°C, 3°C, 4°C, and 5°C global warming, respectively (Figures 9b and c).
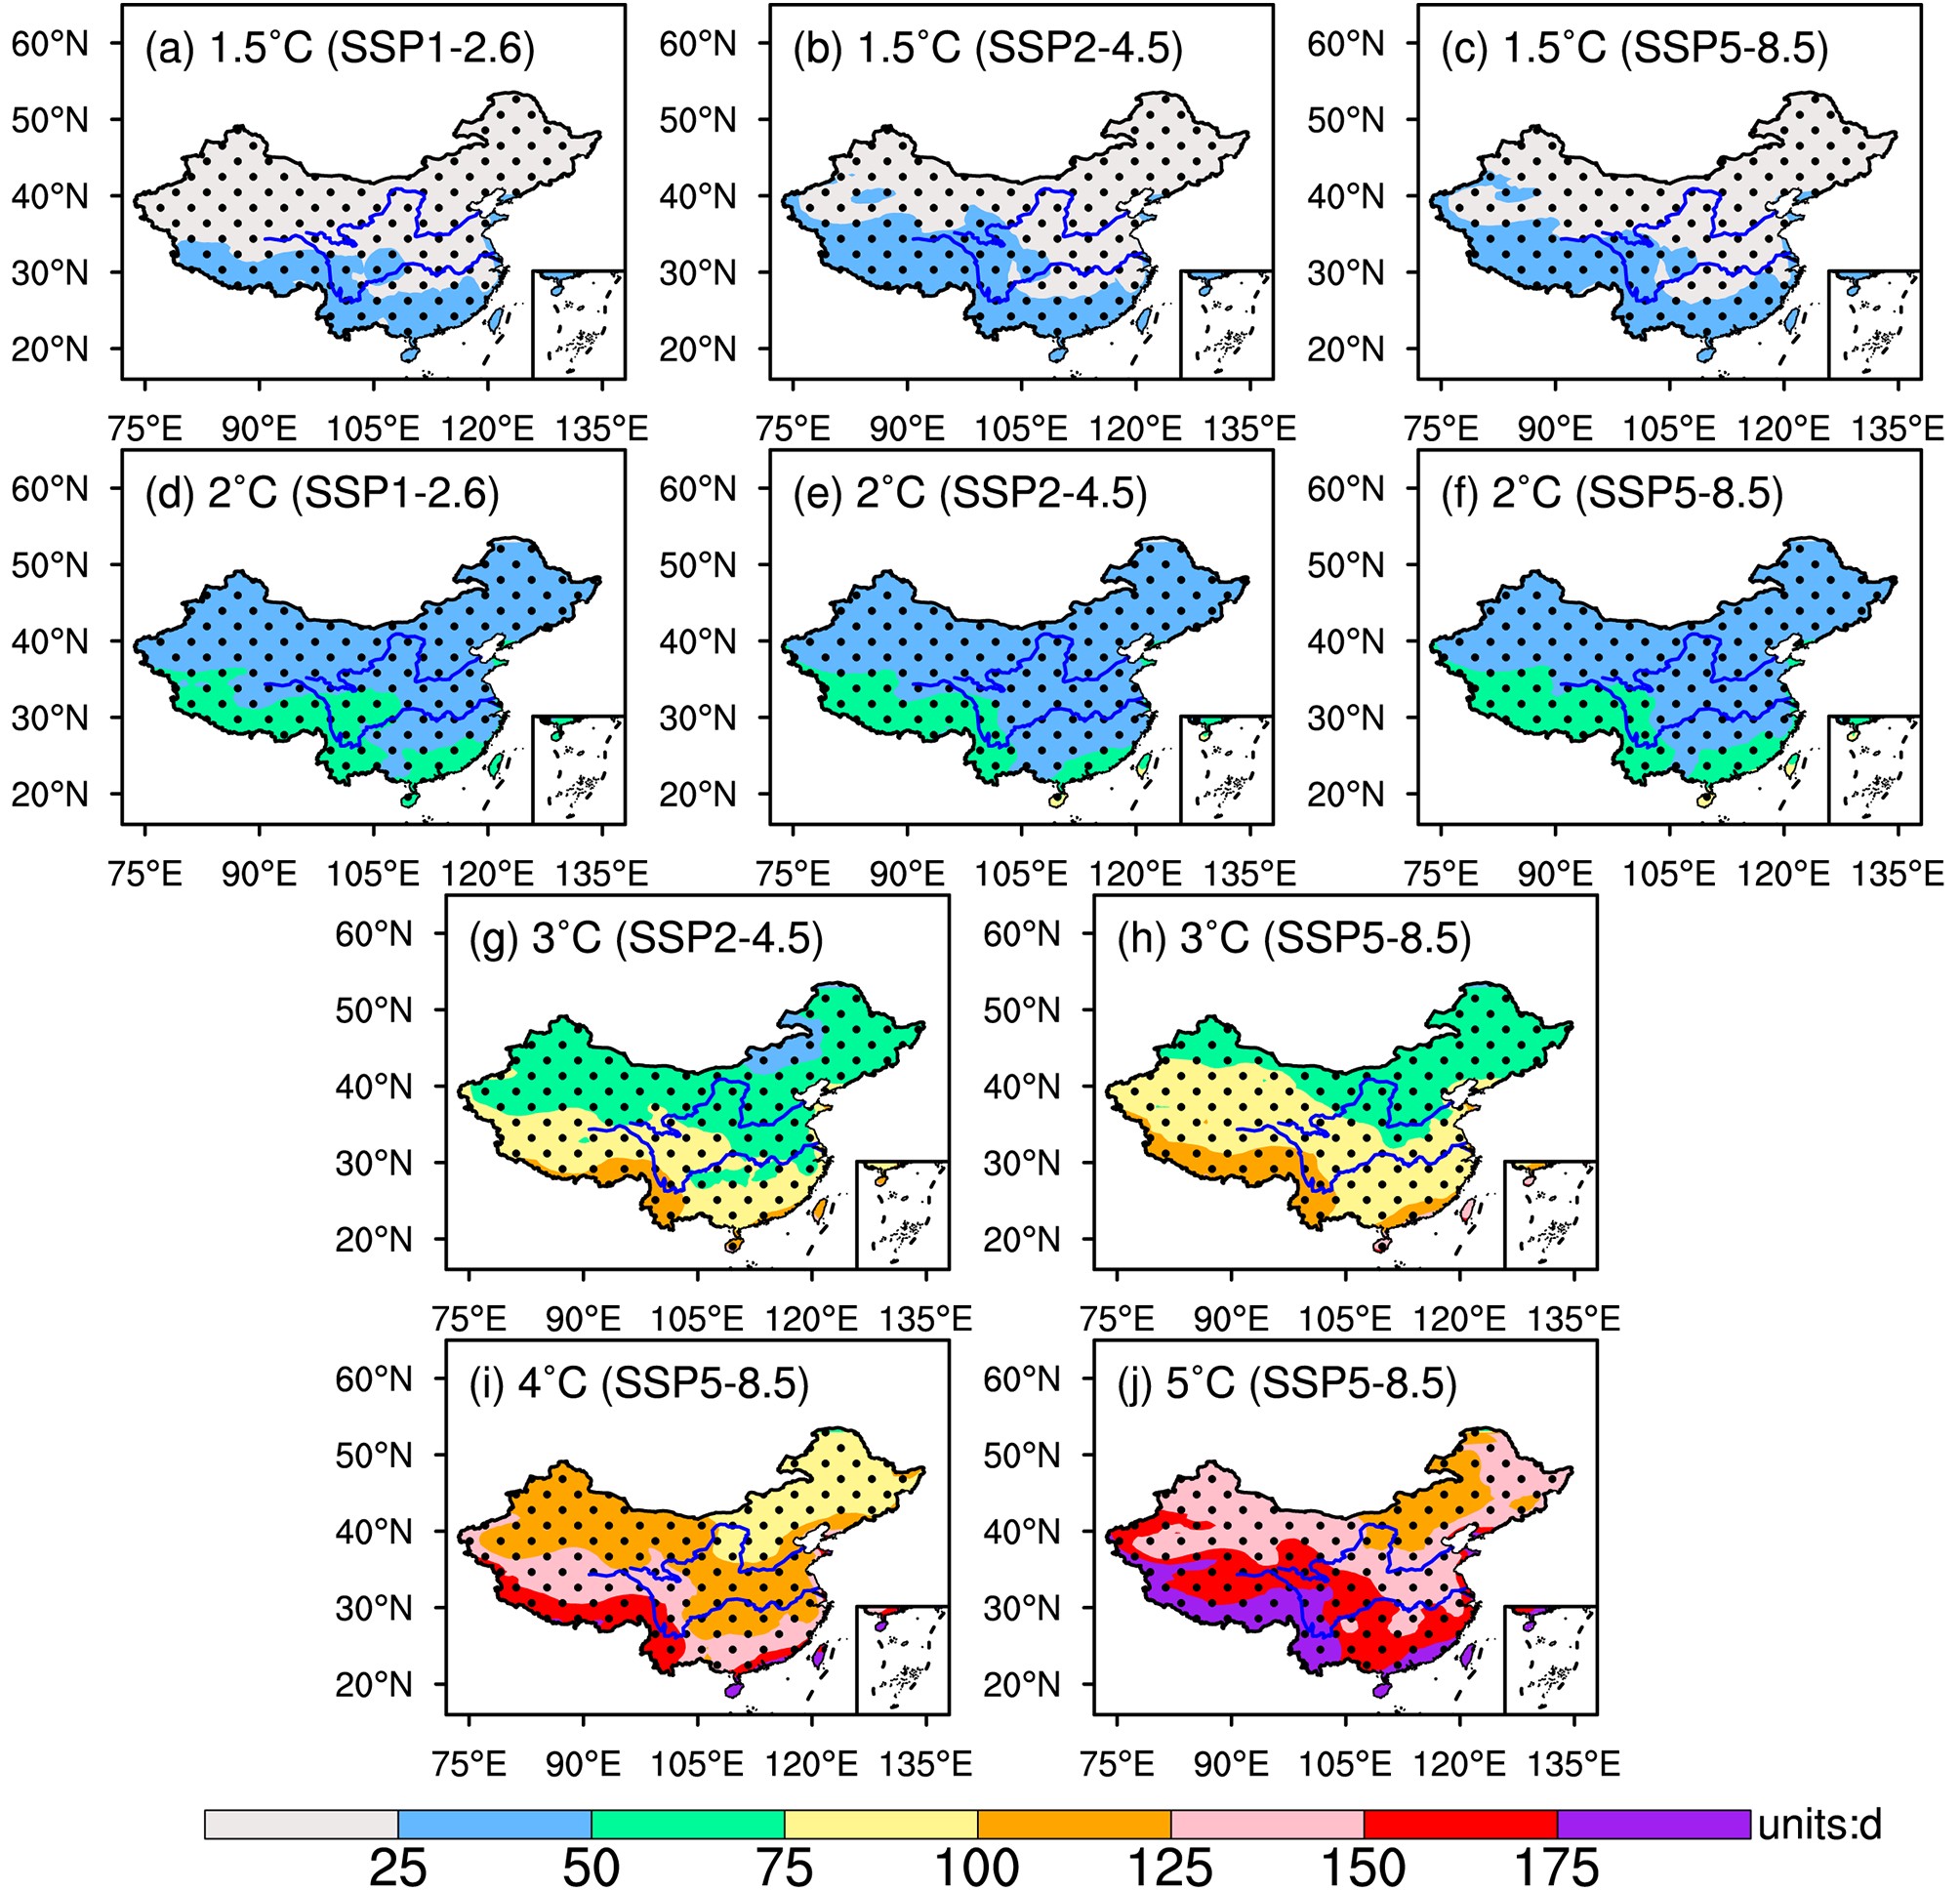 Figure7. The same as Fig. 6, but for the changes in TX90p (units: d).
 Figure8. The same as Fig 6, but for the changes in WSDI (units: d).
2
4.3. Avoided Impact at 1.5°C global warming
Formula (1) quantifies the impacts avoided at 1.5°C global warming compared with other higher warming thresholds (2°C–5°C). As shown in Figures 10a–c, in comparison to 2°C–5°C global warming, the reduced warming in 1.5°C global warming scenario will serve to avoid approximately 36%–87%,47%–89%, and 46%–86% of the increases in TXx, TX90p, and WSDI, respectively. The avoided impacts for a 2°C warming scenario project a 20% reduction compared to the results for the 3°C–5°C scenarios, all of which exceed 65%. For example, when compared to the 3°C scenario, limiting the global warming to under 1.5°C in SSP2-4.5 will help avoid 68%, 80%, and 76% of the increases in TXx, TX90p, and WSDI, respectively. Formula (2) was used to investigate the population-weighted avoided impacts. When population changes are considered, the avoided impacts of TXx will increase significantly, while the results of TX90p and WSDI will change marginally (Figures 10e–f). For the TXx, the population-weighted avoided impacts are about 80%–100% for 2°C–5°C, which is 30%–40% higher than the results without considering population changes. While for the TX90p and WSDI (Figures 10e and 10f), the results are about 10% lower than the results displayed in Figures 10b and 10c. For instance, the population-weighted avoided impacts of WSDI for 2°C–5°C are 35%–80%. Figure10. The avoided impacts (%) of TXx (a), TX90p (b), and WSDI (c) at 2°C, 3°C, and 4°C global warming relative to 1.5°C global warming. (d)–(f) are the same as (a)–(c) but for the population-weighted results (%). Green, blue and red bars represent the results of SSP1-2.6, SSP2-4.5, and SSP5-8.5, respectively. The perpendicular black lines at the top of the bars represent the variation between the 10th and 90th percentiles of the multi-model ensemble.
Overall, constraining global warming to 1.5°C rather than 2°C, 3°C, 4°C, and 5°C will help avoid approximately 36%, 73%, 80%, and 87% of the EHT indices increases in China. When considering the population changes, the population-weighted avoided impact will increase to 30%–40% in the TXx.
However, the merits of this study are not without its limitations. For example, in an attempt to match the same resolution, both the climate model data and population data were interpolated. The difference is that the model data was mostly processed by the bi-linearly downscaled method and the population data was processed by the bi-linearly upscaled method. These differential methods may add some uncertainties, however it is worth noting that dynamic downscaling is not only a viable methodology to improve the horizontal resolution of the models (Liang et al., 2019), but this process has also been shown to improve the model performance in China in some cases (Liang et al., 2019). Furthermore, there are still some issues worthy of further study. For instance, the time needed to reach the specific global warming thresholds (time points) seems slightly earlier than those concluded by previous studies (Xu et al., 2017; Shi et al., 2018a). This is likely attributed to the higher average climate sensitivity in CMIP6, especially regarding the response to aerosols (Flynn and Mauritsen, 2020; Zelinka et al., 2020). Limiting global warming to 1.5°C or 2.0°C will require significant reductions in anthropogenic greenhouse gas emissions. Consequently, anthropogenic aerosol emissions are expected to decline as a result of reduced greenhouse gas emissions and air quality improvement measures. Samset et al. (2018) showed that aerosol removal would cause a global surface warming of 0.5°C–1.1°C and EHT indices to increase. EHT events in major aerosol emission regions (mainly China and the U.S.) are more sensitive to aerosol emission reductions. Therefore, an in-depth study concerning the impact of aerosol removal on China is necessary. Additionally, our results indicate that the TXx would increase most notably in northern China while the increases in TX90p and WSDI would be most pronounced in southern China. Since northern China has both the largest forest and crop areas in China (Tao and Zhang, 2013; Huang et al., 2017) in addition to large expanses of arid areas, enhanced high temperatures in northern China may increase the frequency and intensity of forest fires and also lead to severe droughts (Allen et al., 2004; Chai et al., 2018). Increasing drought will affect agricultural production, such as wheat and cotton in Northwest China (Wang et al., 2008). Since southern China is an important industrial region (e.g. Shanghai, Shenzhen, Hong Kong), high temperatures are likely to result in the consumption of more energy, therefore it is necessary to investigate the impacts of high temperatures on the economy (Jiang et al., 2017; Yu et al., 2019; Zhu et al., 2020), and to quantify the future heat-related risks in China, such as energy consumption (Yu et al., 2019), forest fires (Li et al., 2019), and droughts (Huang et al., 2017; Su et al., 2018).
In summary, this study projected future EHT changes in China under five specific warming thresholds (1.5°C–5°C), which can provide the basis for an in-depth future projection study.
(1) CMIP6 simulations project that, under three future scenarios (SSP1-2.6, SSP2-4.5 and SSP5-8.5), the global mean temperature will increase by 1.5°C and 2°C relative to pre-industrial levels (1861–1900) before 2030 and 2050, respectively. Furthermore, the timing of the 1.5°C/2°C global warming threshold under SSP5-8.5 is reached slightly earlier than that under SSP1-2.6 and SSP2-4.5. Under SSP 5-8.5, global warming will eventually exceed 5°C by 2100. While under SSP1-2.6, global warming will stabilize at around 2°C after 2050.
(2) Under 1.5°C, 2°C, 3°C, 4°C, and 5°C global warming, China’s regional mean temperature increase relative to pre-industrial levels will be higher than the global average. For example, when global warming reaches 1.5°C and 2°C, China’s regional mean temperature is projected to increase by 1.55°C/1.59°C/1.60°C and 2.12°C/2.18°C/2.20°C relative to the preindustrial level under SSP1-2.6/SSP2-4.5/SSP5-8.5, respectively. In China, most of the areas where warming exceeds global average levels will occur in Tibet and northern China (Northwest China, North China and Northeast China), more than half the whole country. Especially under SSP5-8.5, this land fraction will reach nearly 70% of China. Furthermore, an estimated 0.19 to 0.44 billion people, accounting for 16% to 41% of the national population, will experience warming that is higher than the global average.
(3) Regarding changes in EHT compared to the present day, China will experience an increase in the TXx, TX90p, and WSDI by 0.2°C–6.8°C, 7–183 days, and 3–87 days at 1.5°C–5°C global warming, respectively. The highest increases will occur at 5°C global warming under SSP 5-8.5. Furthermore, the TXx will increase most dramatically in northern China, while the TX90p and WSDI increases will be greatest in southern China. For example, relative to the present-day (1995–2014), TXx in northern China will increase by at least 1°C–5°C, and TX90p (WSDI) in southern China will increase by more than 25–150 (10–80) days at 1.5°C–5°C global warming. Compared to 2°C, 3°C, 4°C, and 5°C, limiting global warming to 1.5°C will likely prevent about 36%, 73%, 80%, and 87% of the EHT increases in China. When considering population changes, the population-weighted avoided impacts of TX90p and WSDI will change not much, but the avoided impacts of TXx will increase by 30%–40%.
Acknowledgements. This research is supported by the National Key Research and Development Program of China (2017YFA0603804), the National Natural Science Foundation of China (41831174 and 41430528), and the Postgraduate Research & Practice Innovation Program of Jiangsu Province (KYCX19_1026). Guwei ZHANG was supported by the China Scholarship Council (NO. 201908320503). We acknowledge the High Performance Computing Center of Nanjing University of Information Science & Technology for their support of this work. We sincerely thank the editors and reviewers for their constructive critique and positive review.
