HTML
--> --> -->However, these small-scale coherent structures have not been well understood owing to the lack of direct observations. Over the past two decades, two types of small-scale structures have been detected in the TC boundary layer. One is horizontal streamwise rolls with wavelengths ranging from the sub- to multi-kilometer scale (e.g., Wurman and Winslow, 1998; Morrison et al., 2005; Foster, 2013). The occurrence of horizontal rolls is associated with the inflection point instability of the horizontal winds in the TC boundary layer (Gao and Ginis, 2014). The other is the eyewall vorticity maximum or tornado-scale vortex (Marks et al., 2008; Wu et al., 2018, 2019). A tornado-scale vortex can be compared with a weak tornado in terms of its diameter and peak vorticity magnitude (Marks et al., 2008). Using dropsonde data from 1997 to 2005, Stern and Aberson (2006) found that 90% of extreme updrafts (> 10 m s?1) in the eyewall below 3 km came from TCs with an intensity of categories 4 and 5.
Extreme updrafts in the middle and upper troposphere have also been documented in TCs. While Jorgensen et al. (1985) found that most vertical motion in the eyewall of Hurricane Allen (1980) was less than 6 m s?1 at the flight level (~3 km), Black et al. (1994) documented unusually strong updrafts—as strong as 24 m s?1 at 5 km and 19 m s?1 at 3 km—in the eyewall of Hurricane Emily (1987). At the flight altitude (700 hPa), an updraft of 31 m s?1 was observed in Hurricane Felix (2007) (Aberson et al., 2017). Black et al. (1996) analyzed airborne Doppler radar data and found that more than 70% of the vertical motion was between ?2 and 2 m s?1, and the vertical motion exceeding 5 m s?1 only accounted for 5% of the observation in the eyewall region. Extreme updrafts beyond the TC lower boundary may be associated with convective bursts (CBs) that contain a group of hot towers (Heymsfield et al., 2001). Riehl and Malkus (1958) used hot towers to describe deep tropical convection whose updrafts reach the upper troposphere. Studies have examined the structure of hot towers and subsidence regions within CBs (e.g., Heymsfield et al., 2001; Guimond et al. 2010). Heymsfield et al. (2010) found that peak updrafts were almost always above the 10-km level and were closer to the 12-km level in TCs. Guimond et al. (2010) reported that the updraft could have been as strong as 20 m s?1 at the height of 12?14 km in the eyewall of Hurricane Dennis (2005). It has been suggested that CBs are associated with the rapid intensification of TCs (Chen and Zhang, 2012; Rogers et al., 2013; Hazelton et al., 2017). Recently, Zhu et al. (2018) showed that intense turbulent mixing generated by cloud processes also exists above the boundary layer in the eyewall and rainbands.
TC simulations can be carried out when the horizontal grid spacing is less than 1 km (e.g., Zhu, 2008; Rotunno and Bryan, 2014; Stern and Bryan, 2018; Wu et al., 2018, 2019). The large-eddy simulation (LES) technique has been added into the Weather Research and Forecasting (WRF) model (Mirocha et al., 2010), and advances in computational capability and numerical models enable the simulation of the coherent small-scale structures associated with extreme updrafts.
Considering that few studies have focused on the capability of the WRF-LES framework in simulating eyewall extreme updrafts, the outputs of semi-idealized experiments with the finest horizontal resolutions of 111 m and 37 m were used in this study. Our analysis extends from the lower boundary to the outflow layer with two objectives. First, the eyewall extreme updrafts simulated in the WRF-LES framework with two different model resolutions are examined by comparing with those from limited observations to determine what horizontal resolution is needed to simulate the extreme updrafts associated with TCs. Second, the spatial and temporal distributions of the eyewall extreme updrafts and the associated small-scale features are investigated in the simulated TC.
The simulated TCs in the two experiments take a very similar track towards the northern northwest (figure not shown). Figure 1 shows the evolution of the TC intensity in terms of instantaneous and azimuthal maximum wind speeds at 10 m during the 12-h period. The instantaneous maximum wind speed fluctuates between 62.5 m s?1 and 78.1 m s?1 in LES-111, and between 61.8 m s?1 and 76.6 m s?1 in LES-37 (Fig. 1a). The azimuthal wind speed is quite steady during the 12-h period, fluctuating around the mean of 44.6 m s?1 in LES-111 and 44.0 m s?1 in LES-37 (Fig. 1b).
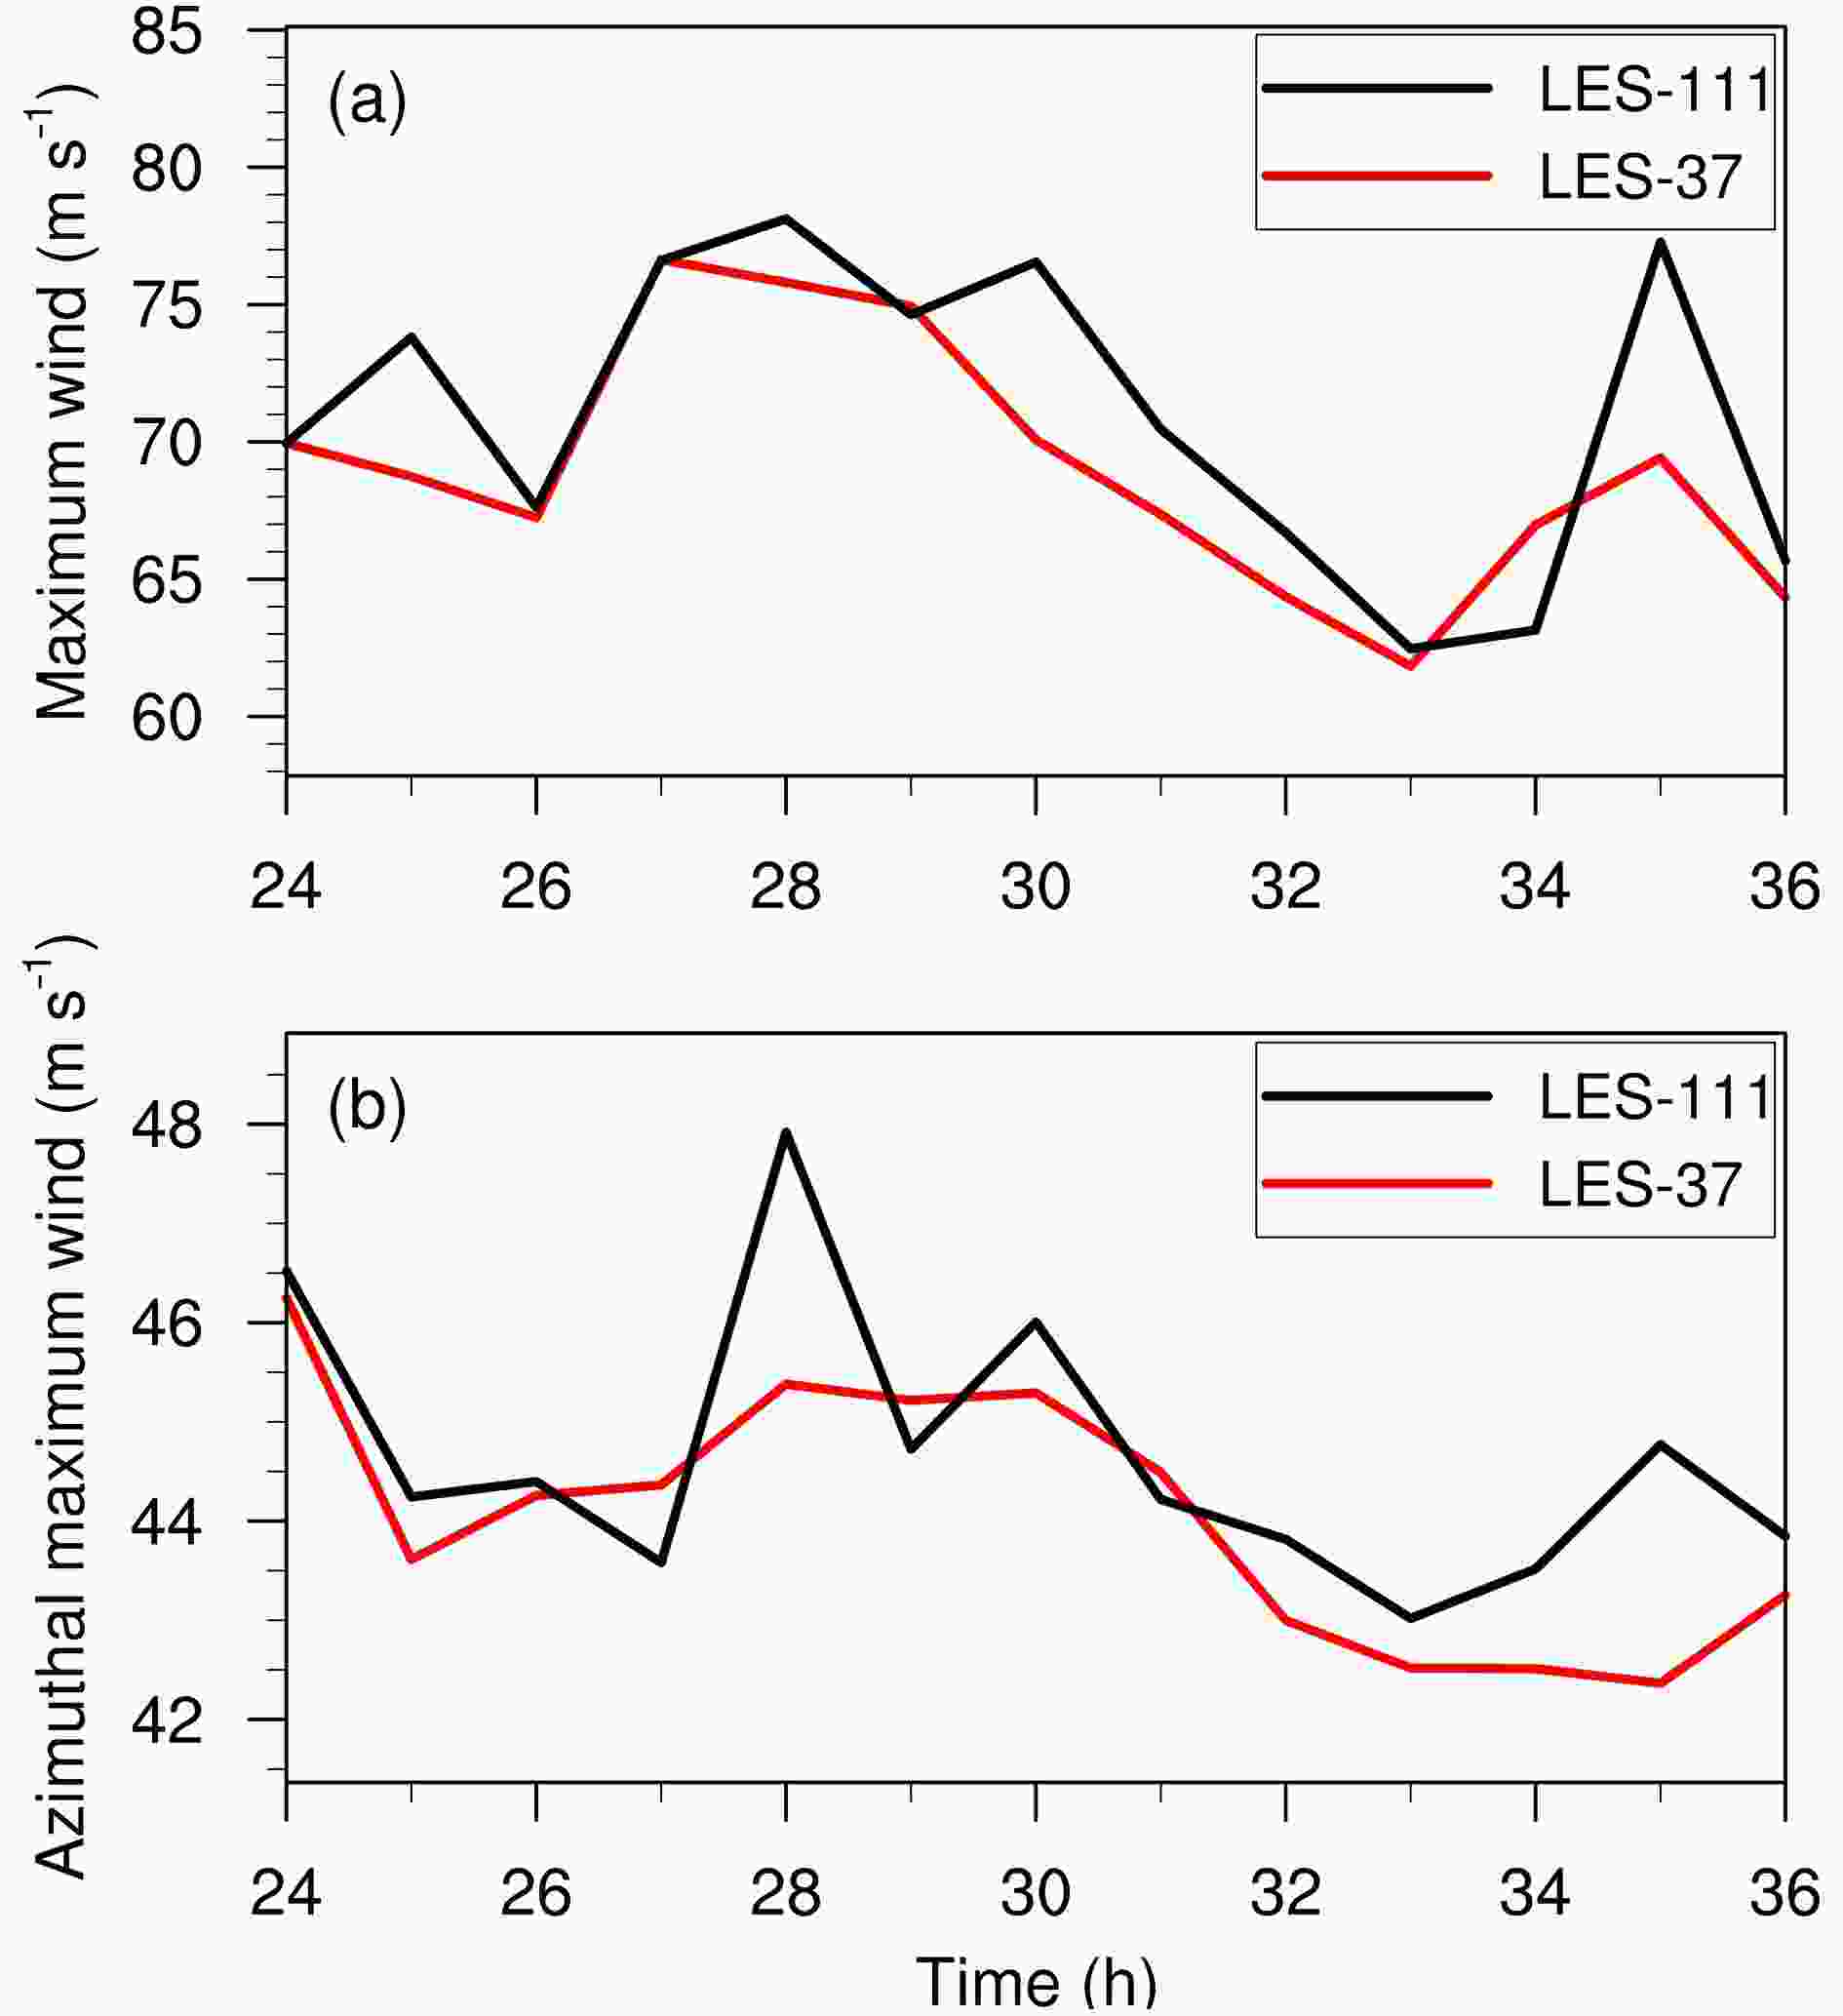 Figure1. Simulated TC intensity in terms of (a) maximum instantaneous and (b) azimuthal-mean wind speeds (units: m s?1) at 10 m during 24?36 h in LES-111 (black) and LES-37 (red).
Moreover, the simulated TC structure is also generally similar in the two numerical experiments. Figure 2 shows the simulated 3-km radar reflectivity at 27 and 33 h, mainly covering the TC eye and eyewall. Figure 2 also shows the vertical wind shear between 200 hPa and 850 hPa averaged over a radius of 500 km. The shear is northwesterly with a magnitude less than 8 m s?1 in the two experiments. In agreement with previous studies, the enhanced eyewall convection occurs in the down-shear left (Frank and Ritchie, 1999). Since the eyewall convection is mainly enhanced in the northeast quadrant, we further examine the vertical cross section of tangential wind, radar reflectivity, and vertical and radial velocities, which are averaged over the northeast quadrant at 27 h (Fig. 3). Figure 3b is plotted with the data in the 111-m resolution domain since the innermost domain in LES-37 is too small for the radial average. We can see that the simulated TC has a smaller radius of maximum wind in LES-111 than that in LES-37 at 27 h. In the two experiments, the strong inflow is mainly below 1 km and the strong upward motion extends up to 14 km along the inner side of the eyewall. These features are comparable to the observation documented by Heymsfield et al. (2001) and Guimond et al. (2010).
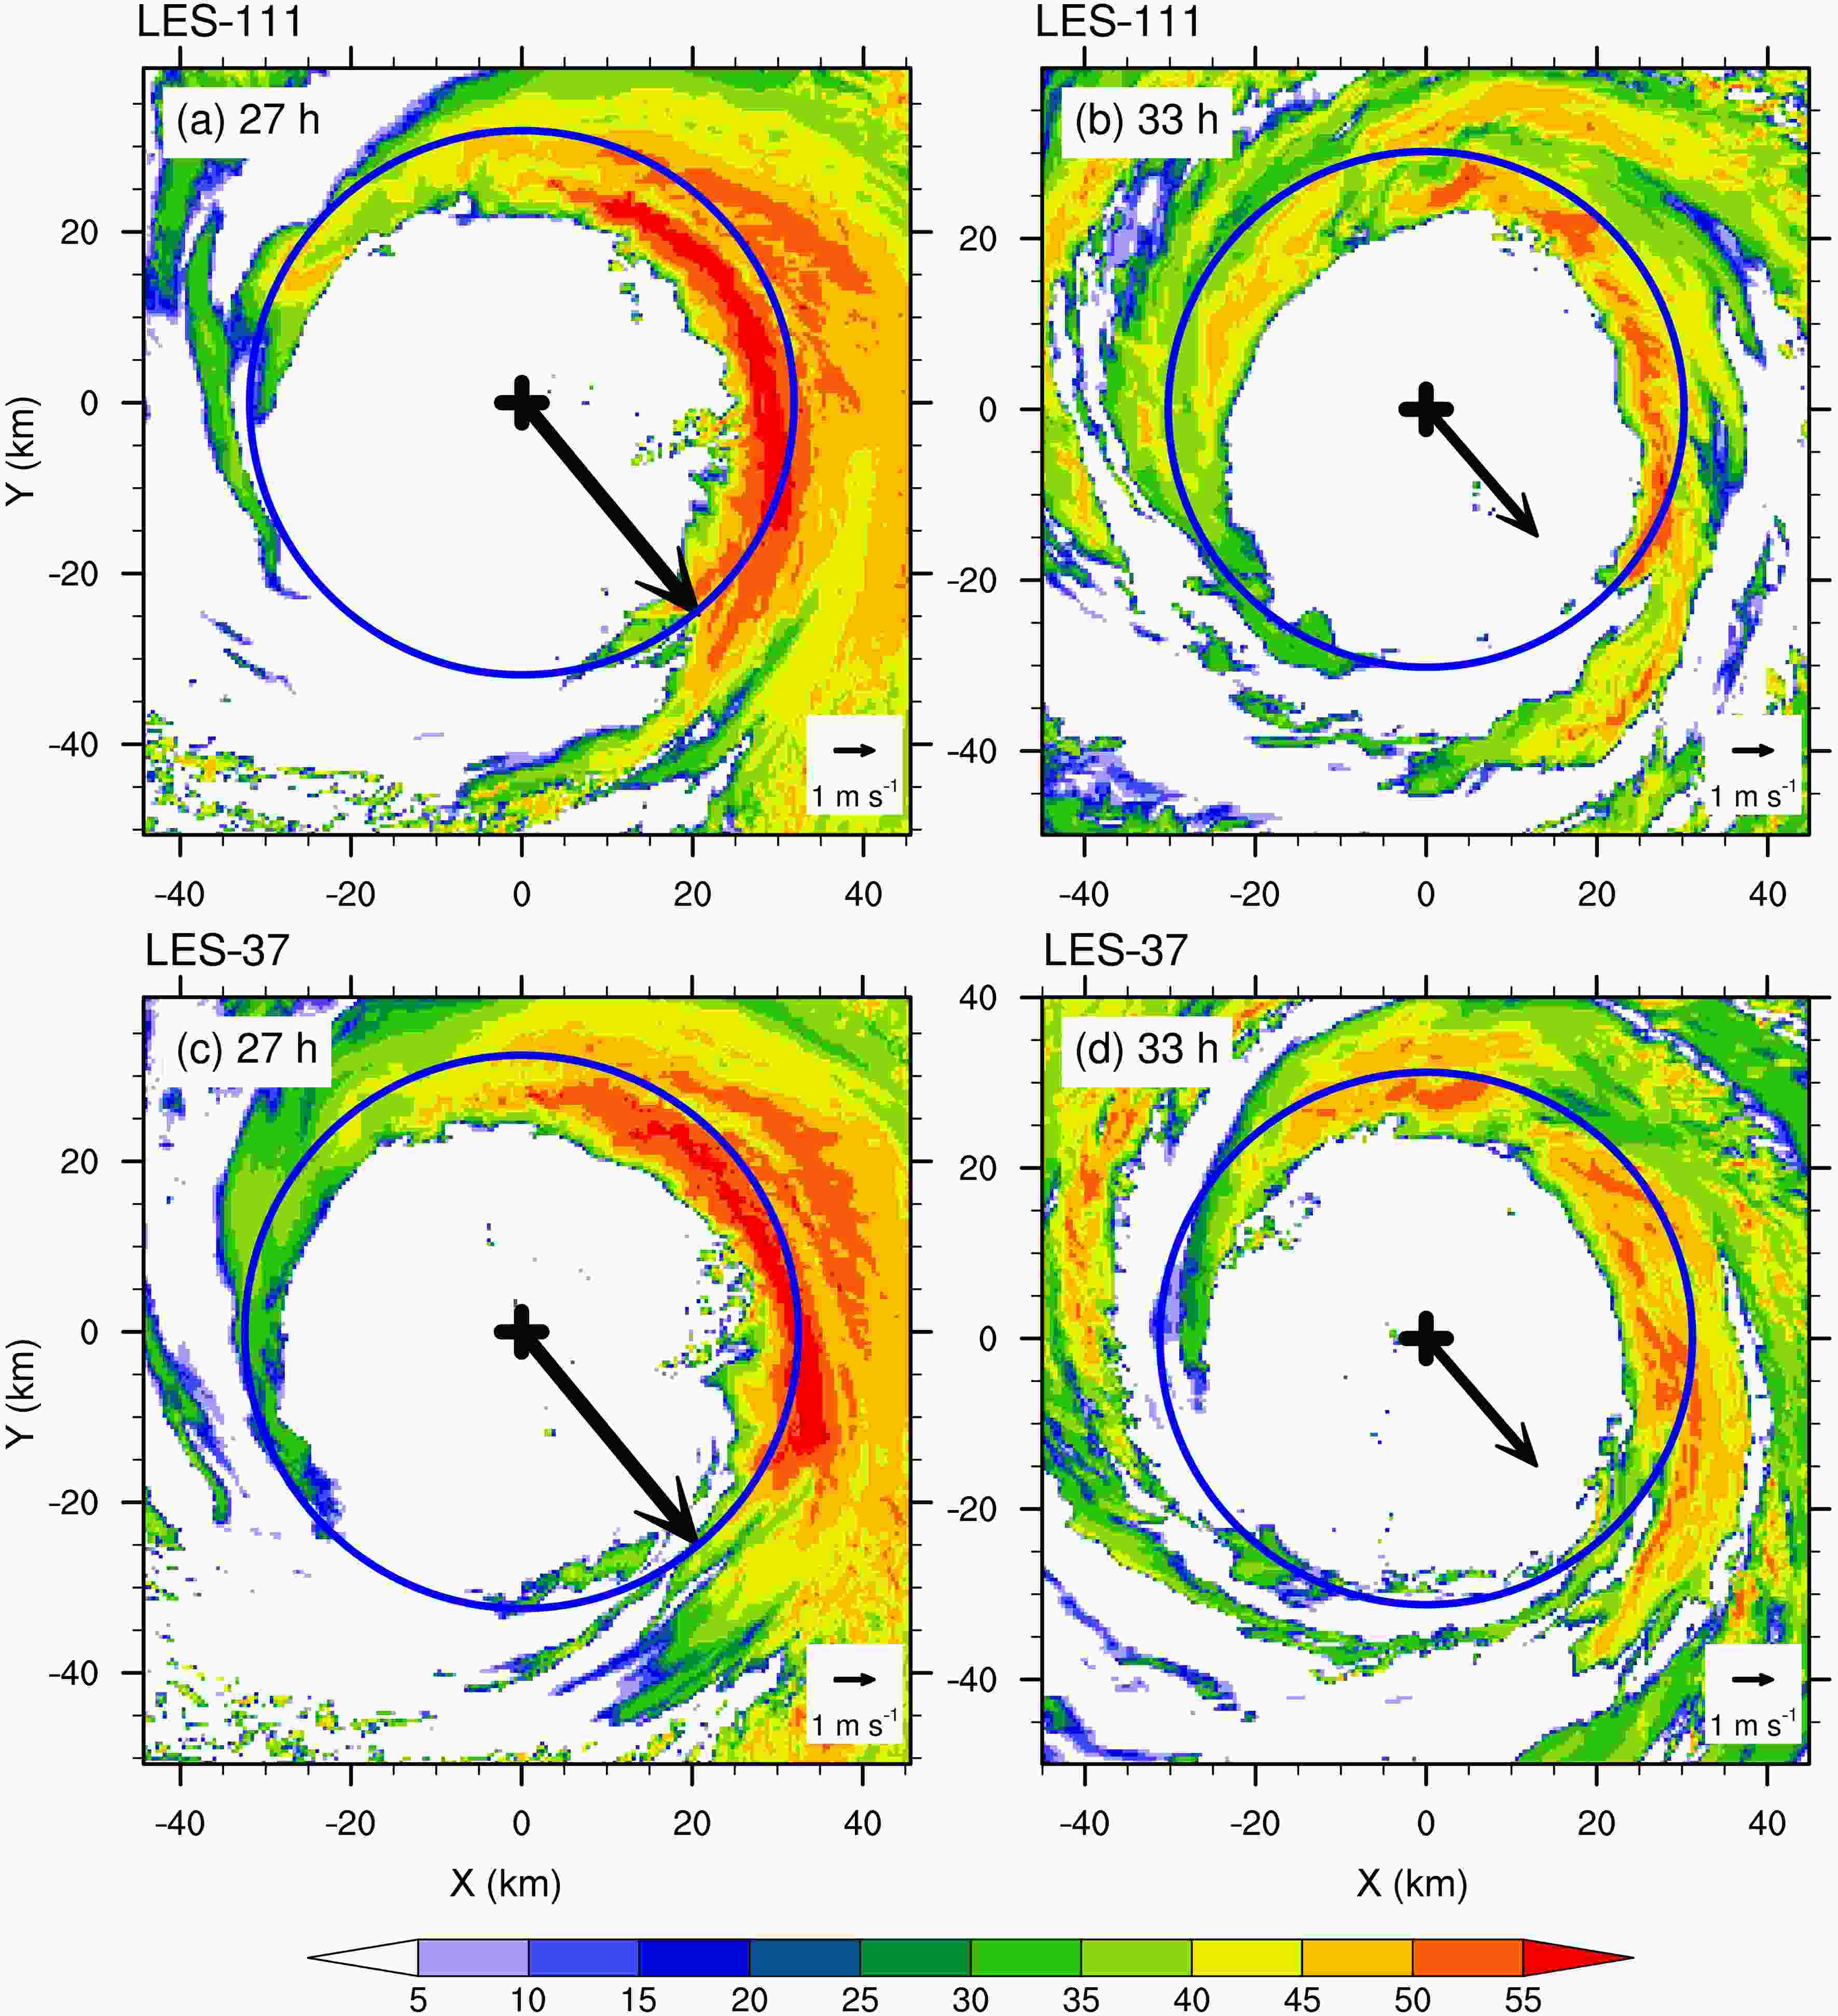 Figure2. The radar reflectivity (units: dBZ) at 3 km at 27 h and 33 h in (a, b) LES-111 and (c, d) LES-37. The arrow shows the vertical wind shear between 200 hPa and 850 hPa. The plus signs and blue circles show the TC center and the RMW.
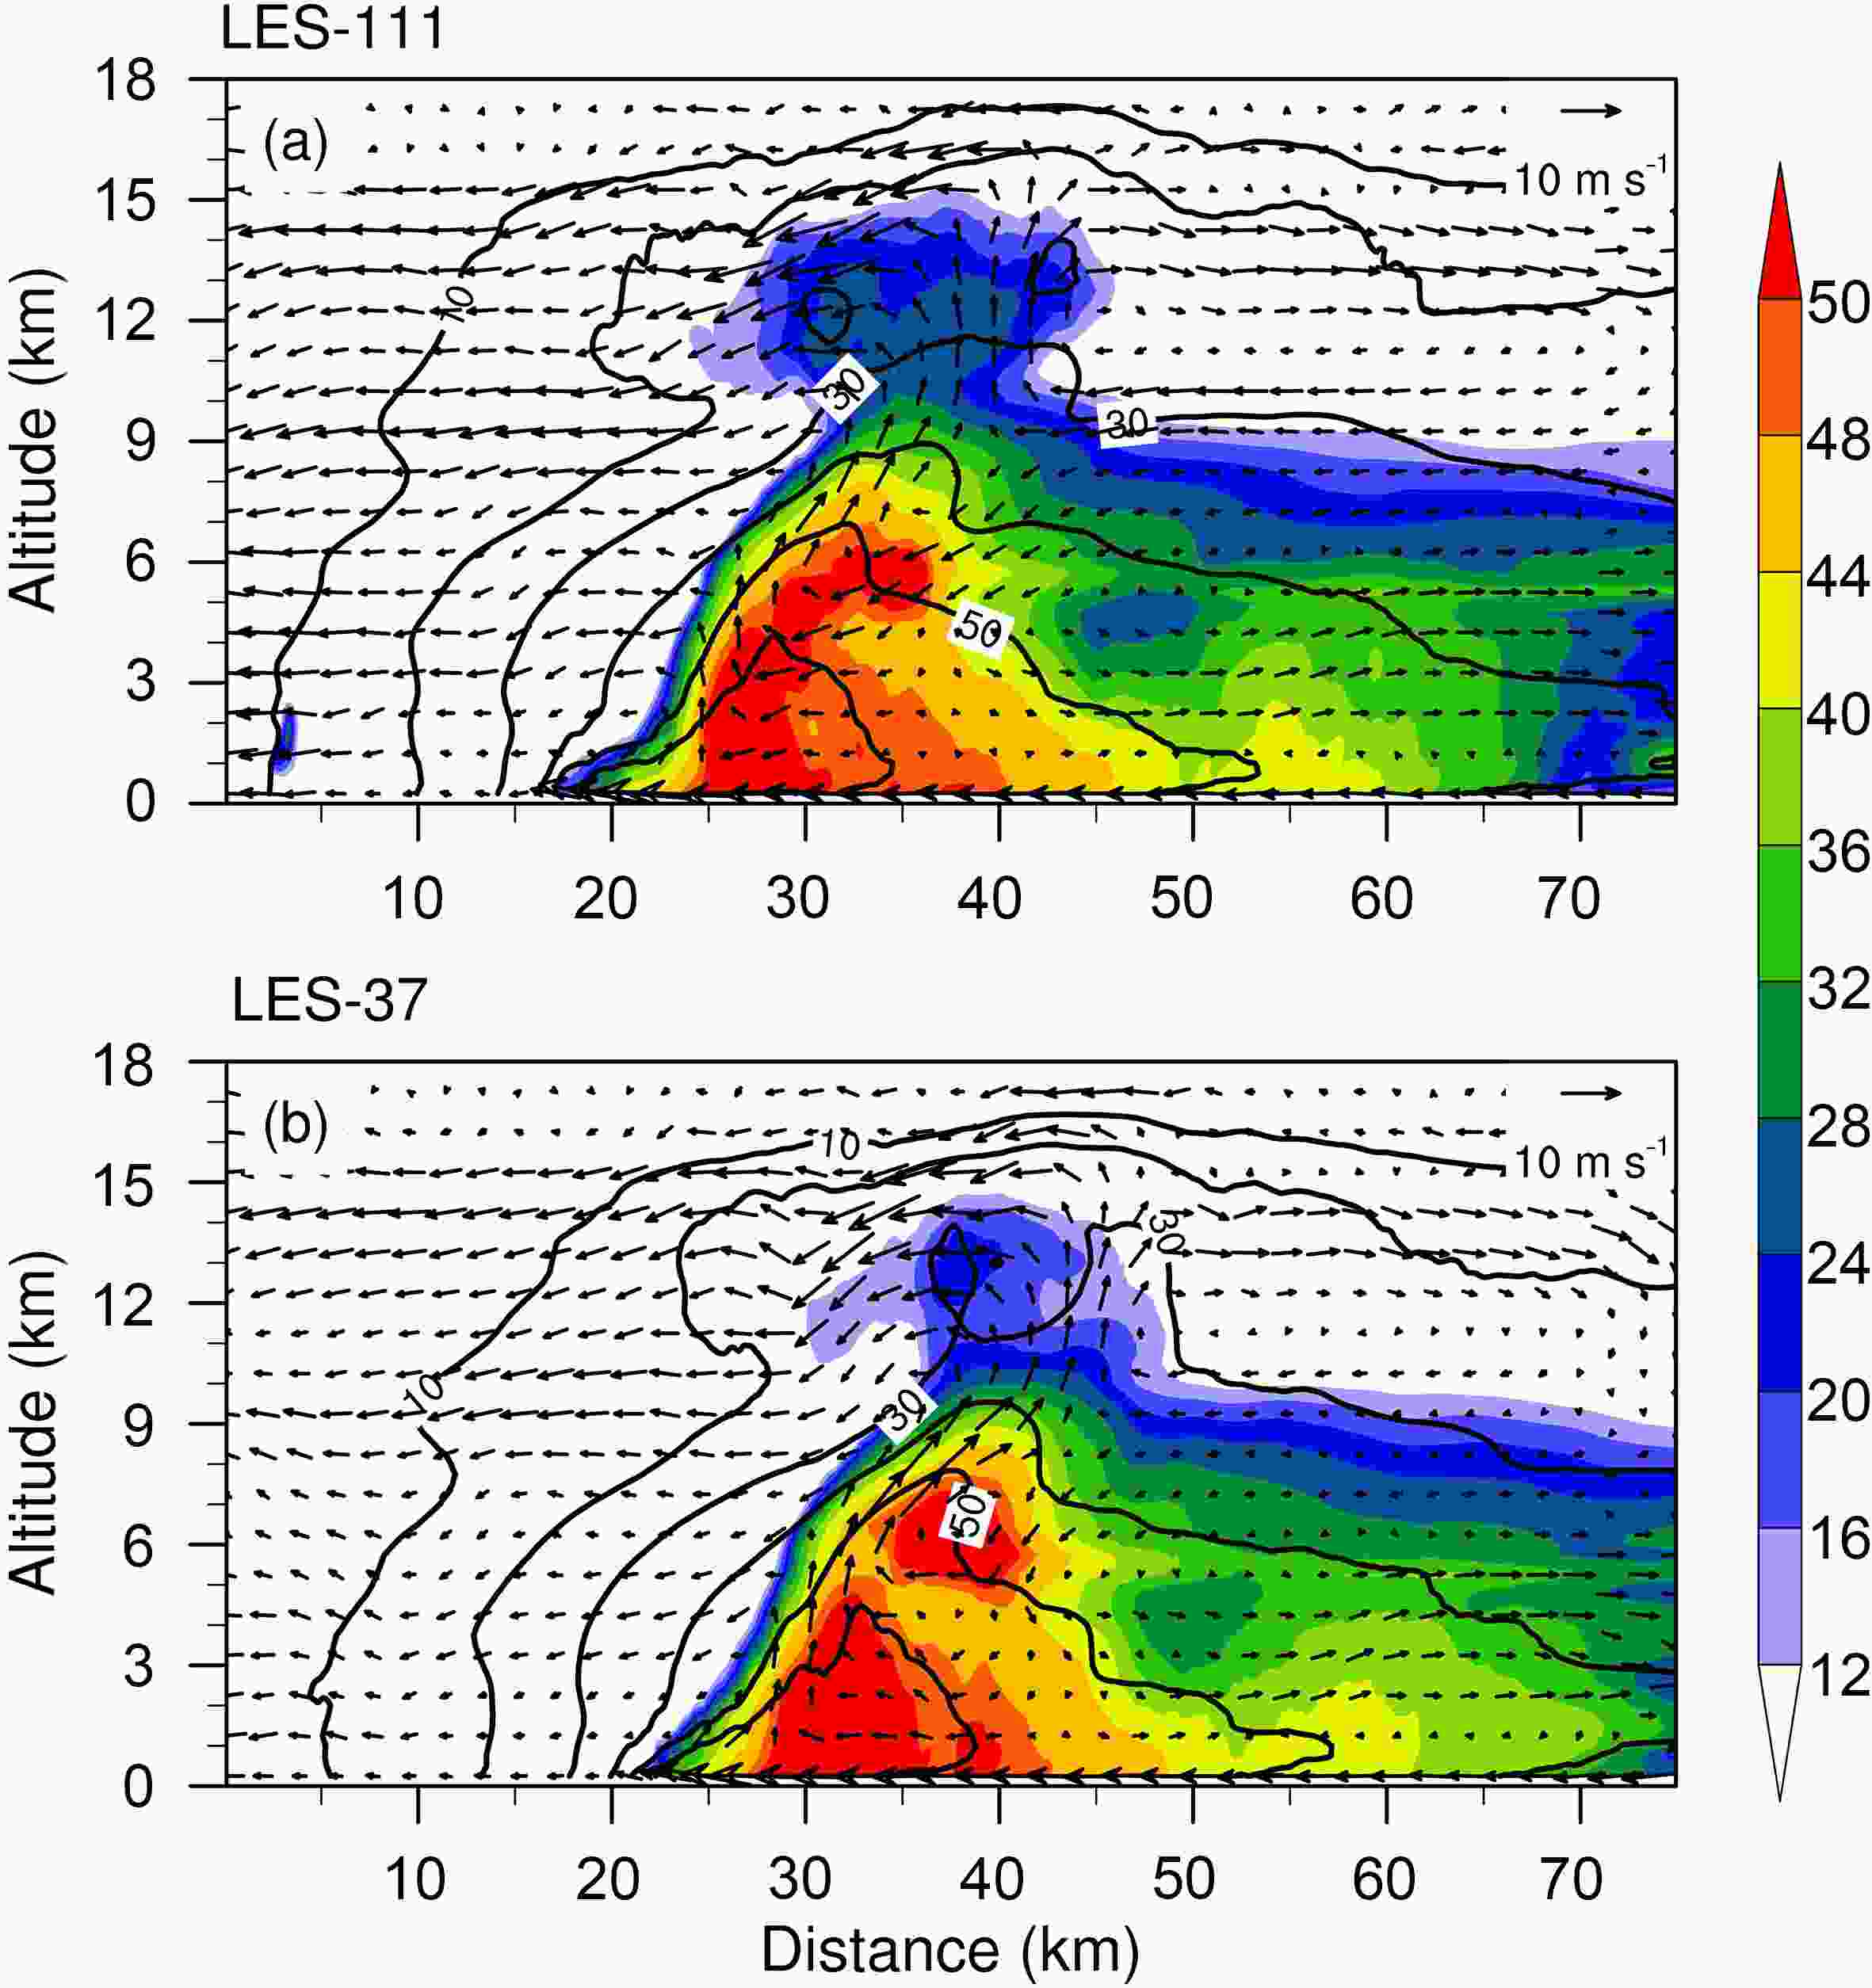 Figure3. Radius?altitude cross section of the vertical and radial motion (vectors; units: m s?1), radar reflectivity (shading; units: dBZ) and tangential wind speed (contours; units: m s?1) averaged over the northeast quadrant in (a) LES-111 and (b) LES-37.
3.1. Definition of an extreme updraft
In this study, we use the percentile rank to determine the thresholds of the extreme updraft and downdraft at each vertical level. The frequencies of the upward and downward vertical motion are first counted in intervals of 0.05 m s?1 during the 12-h period, and then the thresholds are selected for the top 5%, 1%, and 0.1% of samples. Note that the percentage depends on the size of the counting domain and speed interval. Figure 4 shows the thresholds as a function of altitude. Although the thresholds are slightly different, the vertical distributions are quite similar in the two experiments. For the updraft and downdraft, the magnitude of the threshold increases with altitude, especially for the 1% and 0.1% percentages.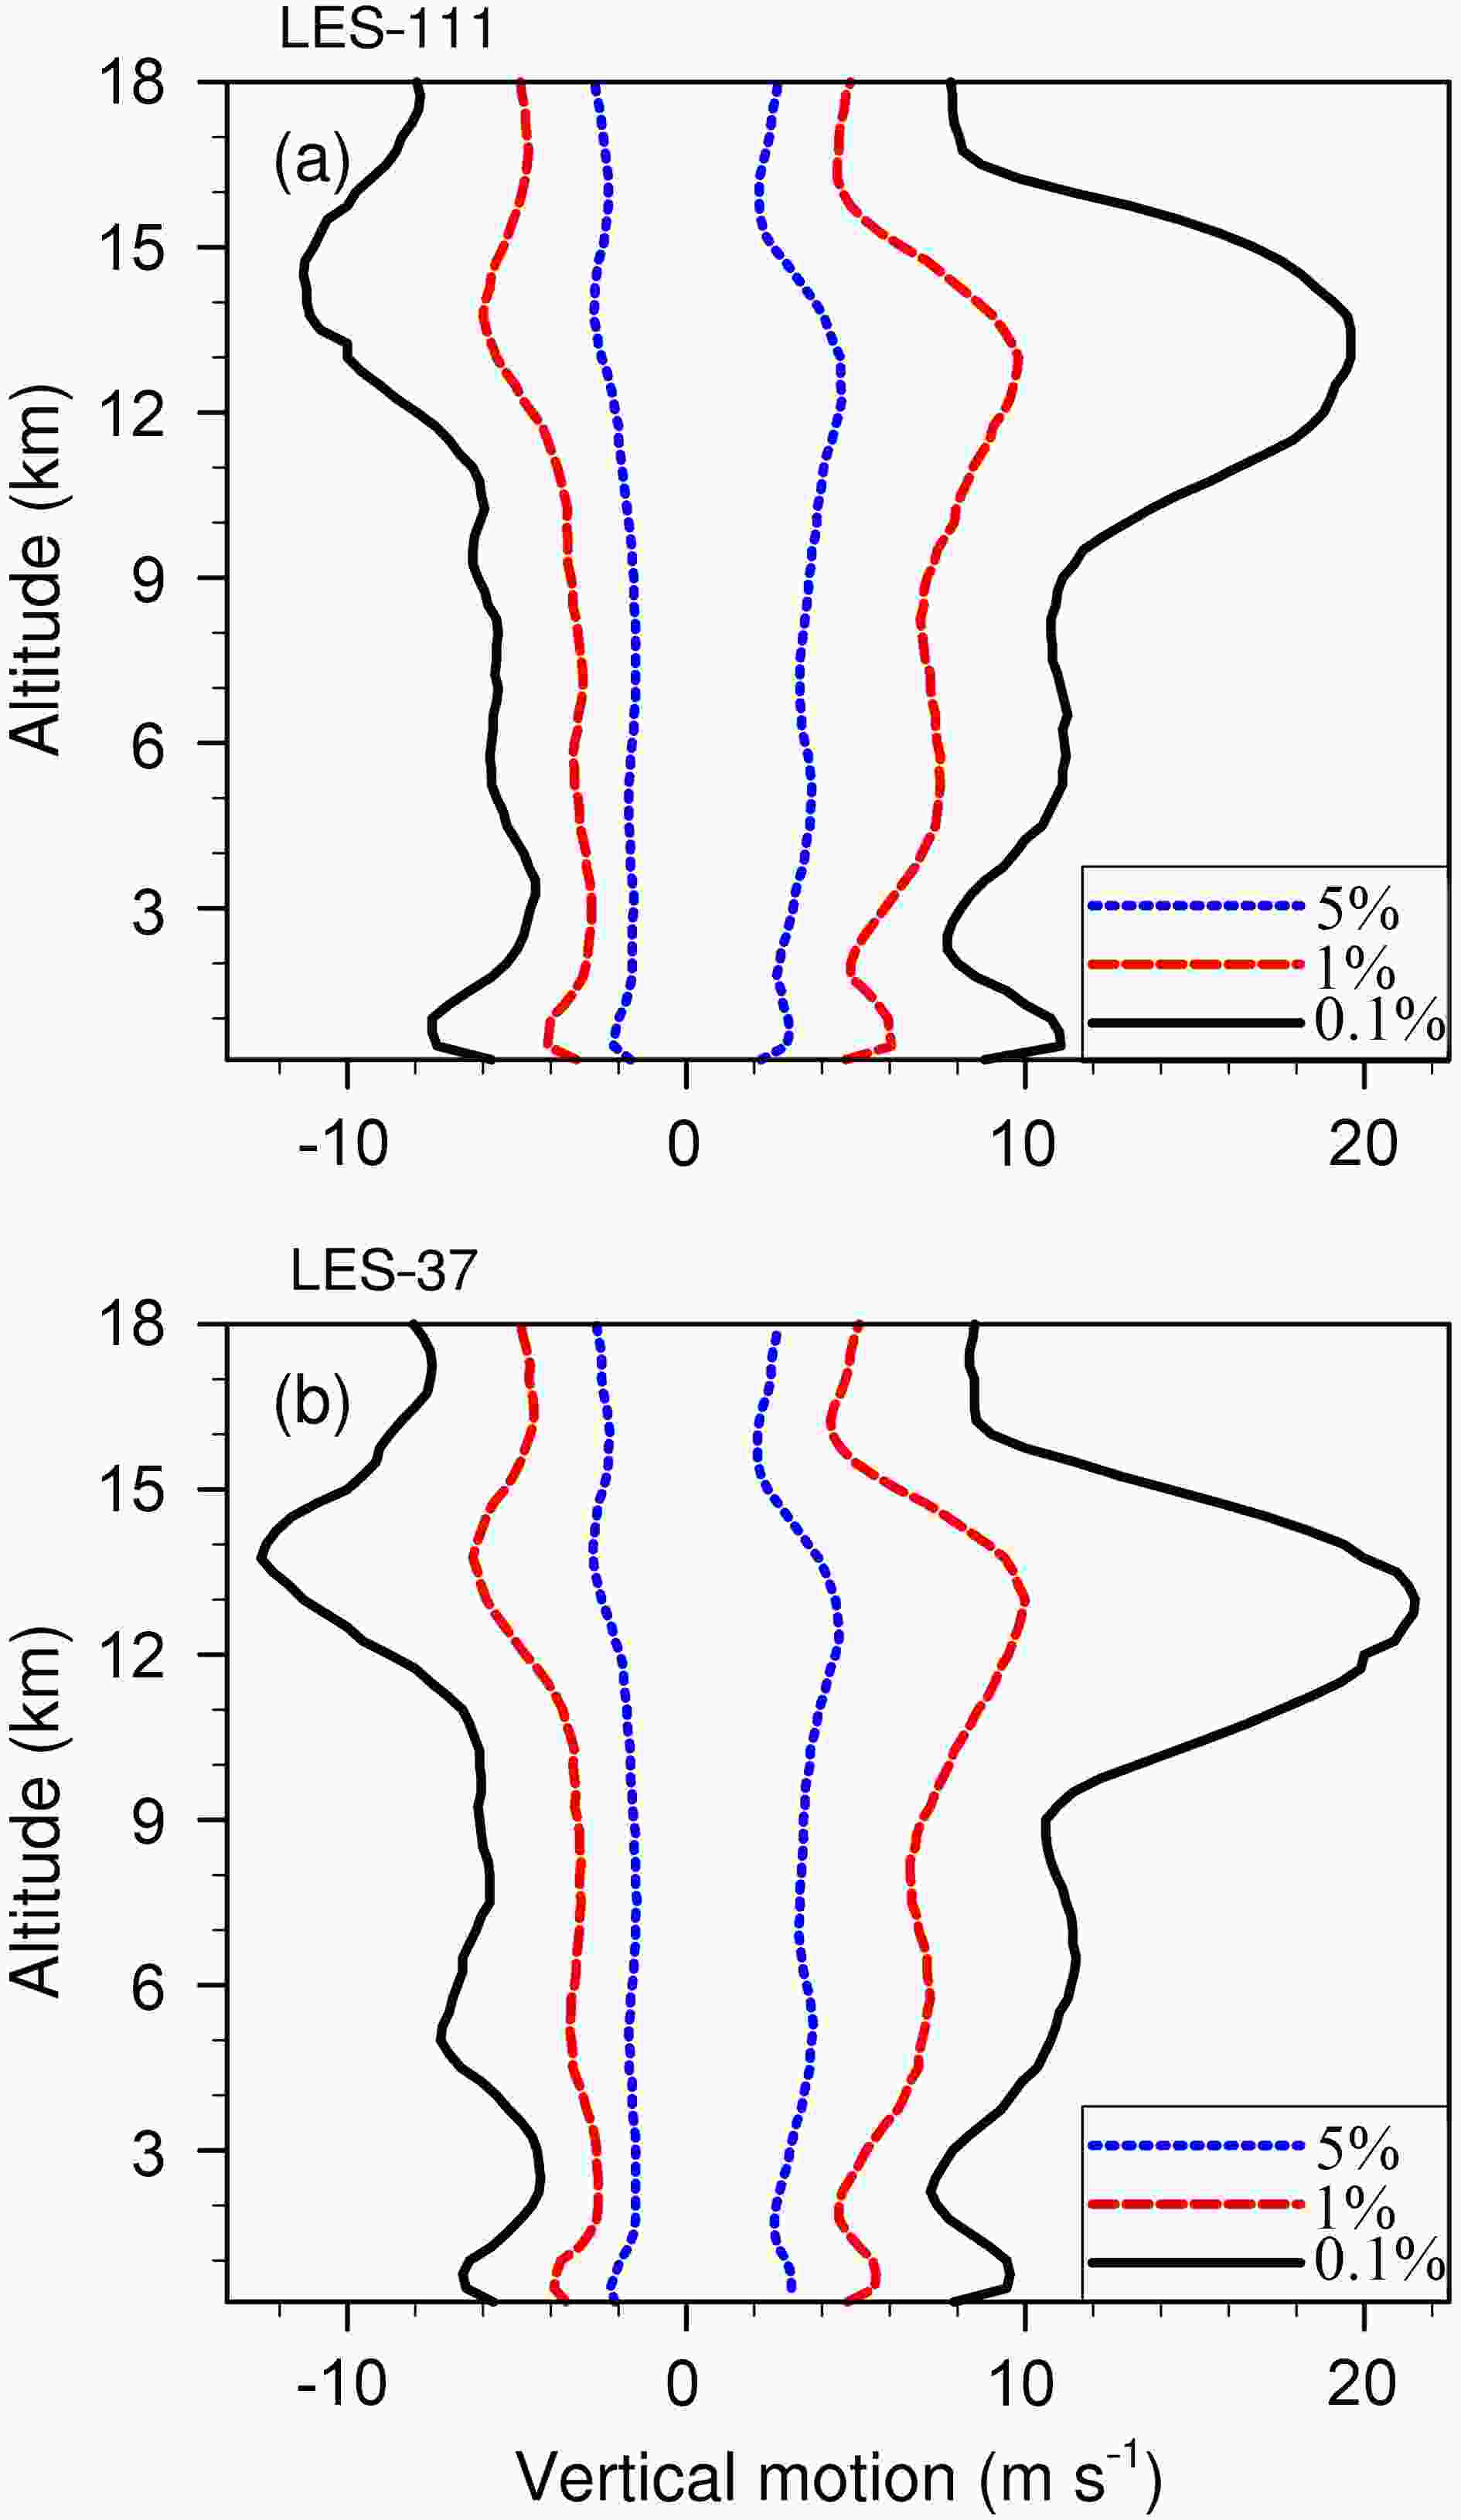 Figure4. Vertical distribution of the threshold of the extreme updraft and downdraft (units: m s?1) for the 5% (blue), 1% (red) and 0.1% (black) percentages during 25?36 h in (a) LES-111 and (b) LES-37.
Since the altitudes of the maximum thresholds and the associated magnitudes are only slightly different in the two experiments, we focus mainly on LES-37 in the following discussion. In Fig. 4, we can see three maxima at the lower, middle and upper levels for both the updraft and downdraft. Tables 1 and 2 list the thresholds for the 5%, 1% and 0.1% percentages at three typical levels. The selected three levels represent the altitudes of the threshold maxima of the extreme updraft (Fig. 4b). The extreme vertical motion thresholds of the 5% percentage are mainly between ?2 m s?1 and 2 m s?1, and the updraft thresholds of the 1% percentage are 5.6 m s?1 at 750 m, 7.2 m s?1 at 5.75 km and 10 m s?1 at 13 km. Stern et al. (2016) used a threshold of 10 m s?1 at lower levels. Guimond et al. (2010) found that the upper-level updraft can be 20 m s?1. We find that the typical updrafts in observations are closer to the maximum thresholds of the 0.1% percentage in our simulation, which are 9.6 m s?1 at 750 m, 11.5 m s?1 at 6.5 km, and 21.5 m s?1 at 13 km. For this reason, we select the thresholds of the 0.1% percentage as the extreme updraft in this study. Note that the simulated peak updraft is 38.3, 20.6 and 32.8 m s?1 at the lower, middle and upper levels, respectively.
| LES-111 | LES-37 | ||||||
| 5% | 1% | 0.1% | 5% | 1% | 0.1% | ||
| Lower | 3.1 (0.75) | 6.1 (0.5) | 11.1 (0.5) | 3.1 (0.75) | 5.6 (0.75) | 9.6 (0.75) | |
| Middle | 3.7 (5.25) | 7.5 (5.25) | 11.3 (6.5) | 3.8 (5.25) | 7.2 (5.75) | 11.5 (6.5) | |
| Upper | 4.6 (12.25) | 9.8 (13) | 19.6 (13) | 4.5 (12.5) | 10 (13) | 21.5 (13) | |
Table1. Updraft thresholds (units: m s?1) at the selected altitudes in parentheses for the 5%, 1% and 0.1% percentages in LES-111 and LES-37.
| LES-111 | LES-37 | ||||||
| 5% | 1% | 0.1% | 5% | 1% | 0.1% | ||
| Lower | ?2.2 (0.5) | ?4.1 (0.5) | ?7.5 (0.75) | ?2.3 (0.5) | ?3.9 (0.5) | ?6.6 (0.75) | |
| Middle | ?1.7 (5) | ?3.4 (5.75) | ?5.8 (5.75) | ?1.7 (5) | ?3.5 (5.25) | ?7.3 (5) | |
| Upper | ?2.8 (13.75) | ?6 (13.75) | ?11.3 (13.75) | ?2.8 (13.75) | ?6.3 (13.75) | ?12.6 (13.75) | |
Table2. As in Table 1 but for the downdraft.
Comparing with the extreme updraft, the threshold of the downdraft is smaller at all altitudes. For the 0.1% percentage in LES-37, for example, the three minimum thresholds are ?6.6 m s?1 at 750 m, ?7.2 m s?1 at 5 km, and ?12.6 m s?1 at 13.75 km. The simulated peak downdraft is ?19.3, ?16.5 and ?41.1 m s?1 at the lower, middle and upper levels, respectively.
2
3.2. Temporal and spatial distributions of extreme updrafts
Figure 5 shows the percentage of 0.1% grid points with extreme updrafts, indicating the temporal variations of extreme updrafts at the lower (750 m), middle (6.5 km) and upper (13 km) levels. While it is found in each hourly output at the lower level, the extreme updraft/downdraft is not always detected at the middle and upper levels. The extreme updraft occurs only during 26?30 h at the middle and upper levels. Since we use the same percentile rank for all the vertical levels, the temporal distribution in Fig. 5 suggests that the horizontal scale of the small-scale structures associated with the extreme updraft/downdraft is larger in area at the middle and upper levels than that at the lower level, likely due to the relatively strong turbulence in the boundary layer. Note that the scale difference may arise from the relatively coarse vertical resolution above the lower boundary layer.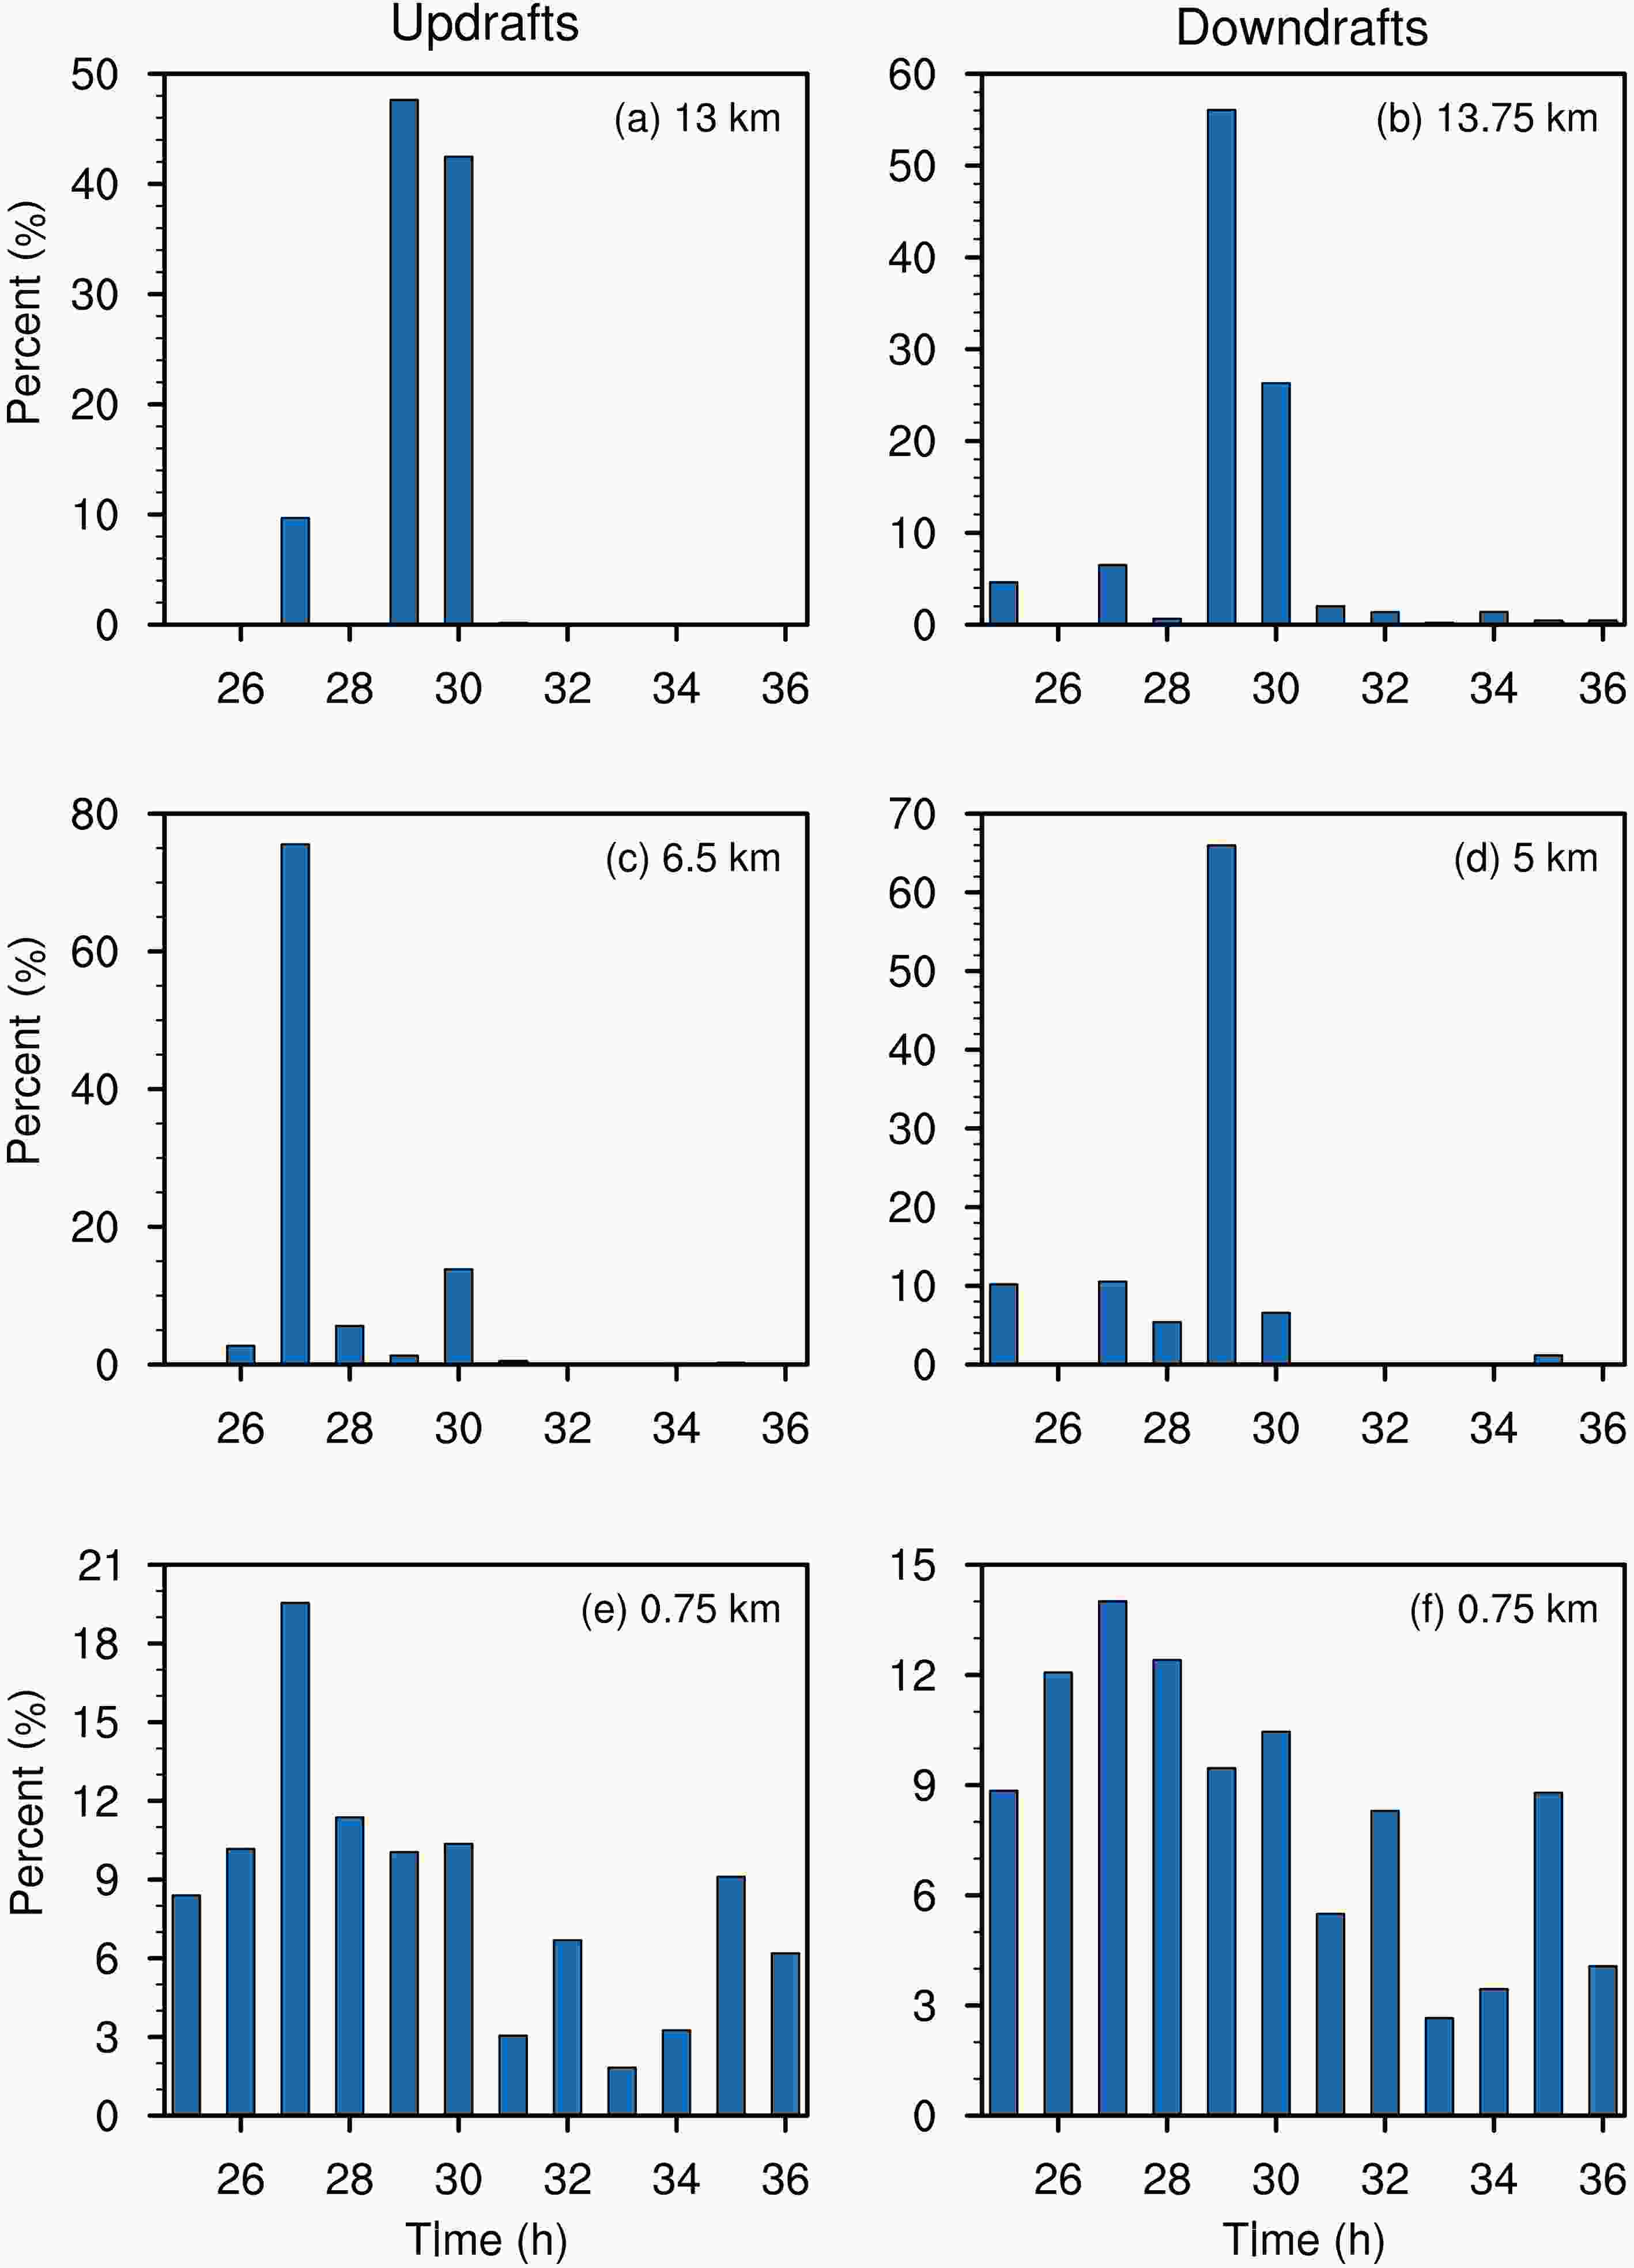 Figure5. Evolution of the percentage of grid points with the extreme updraft (left) and downdraft (right) for the 0.1% percentage during 25?36 h in LES-37. The altitude for each panel is shown in the figure.
Figure 6 shows the spatial distribution of extreme updrafts and downdrafts at 27, 29 and 30 h. In the figure, the locations of extreme updrafts and downdrafts are superposed on the simulated radar reflectivity. At the lower level (Figs. 6g-i), extreme updrafts are mainly at the inner edge of the eyewall convection, although some are radially outside the radius of maximum wind. Compared to the middle and upper levels, a prominent feature at the lower level is that the extreme updraft is accompanied immediately by the extreme downdraft, suggesting the presence of small-scale updraft/downdraft couplets (Marks et al., 2008).
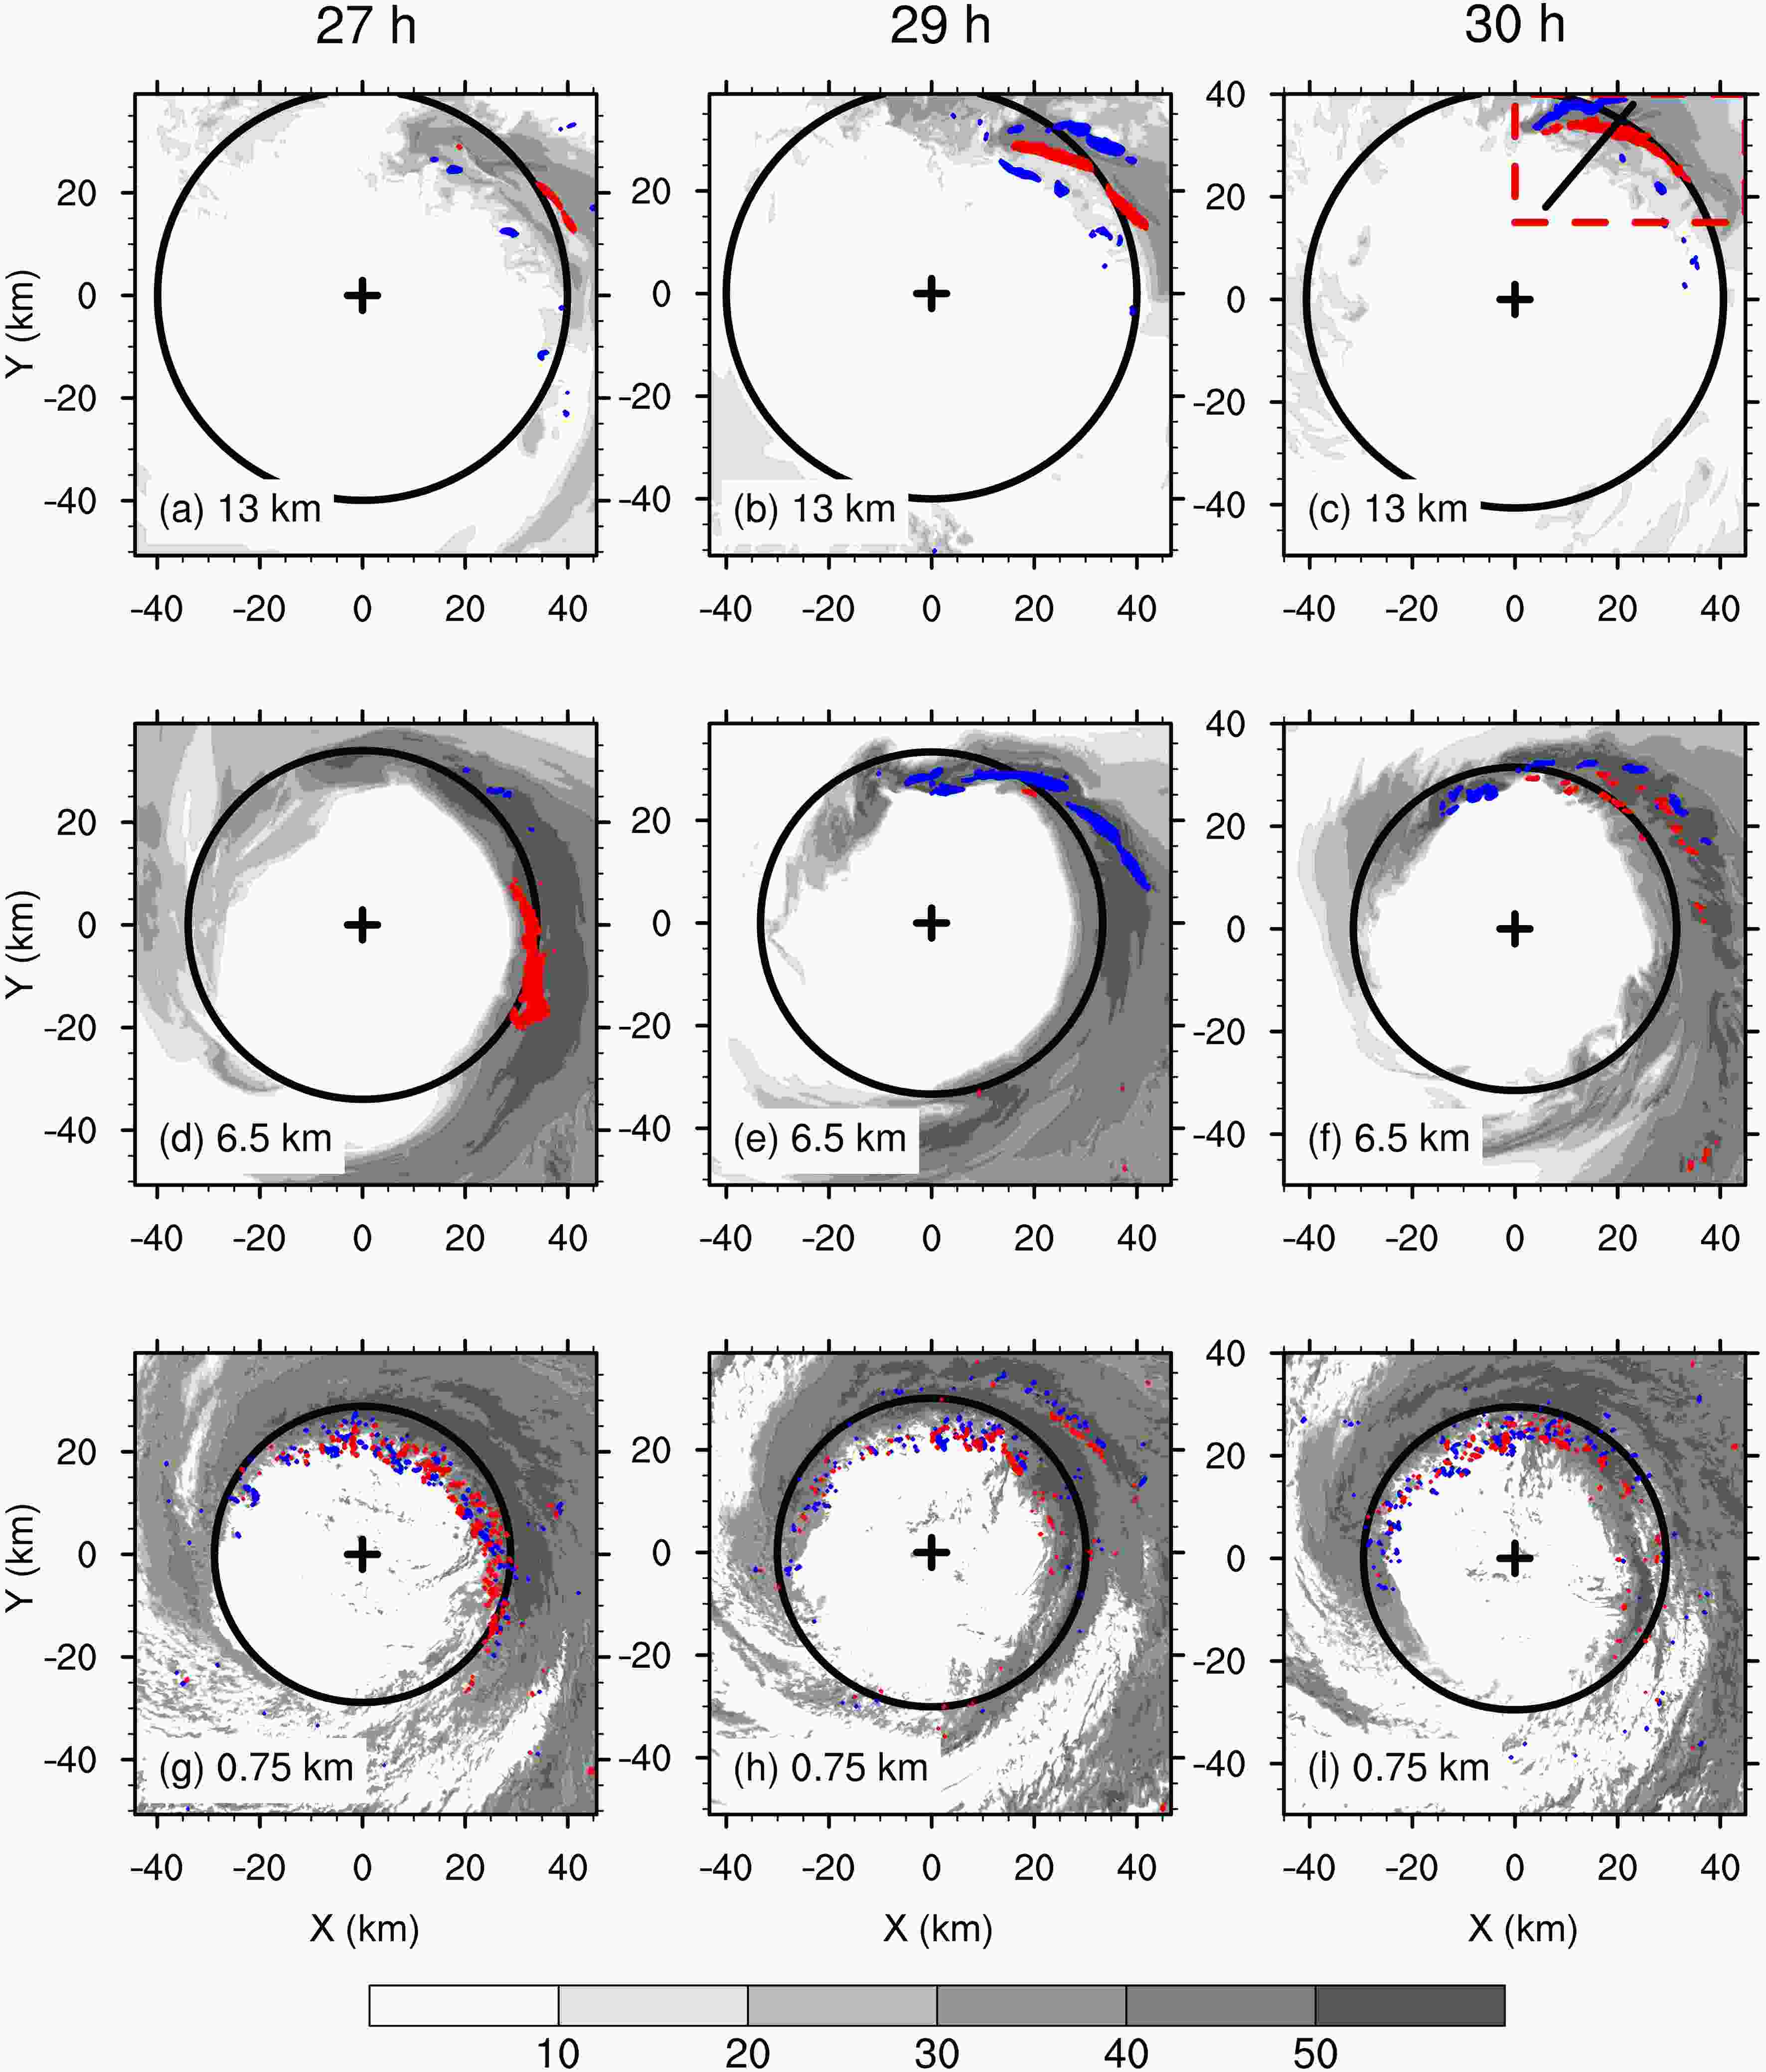 Figure6. Horizontal distribution of the extreme updrafts (red; units: m s?1) and downdrafts (blue; m s?1) at the three typical levels of updrafts at 27 h (left), 29 (middle) and 30 h (right). The shading indicates the radar reflectivity (units: dBZ). The plus signs and black circles show the TC center and the RMW. The altitude for each panel is shown in the figure.
In LES-37, Wu et al. (2018, 2019) suggested that very strong updrafts are associated with the tornado-scale vortex, which is prevalent at the inner edge of the eyewall. The tornado-scale vortex is subjectively detected as a small-scale cyclonic circulation in the TC boundary layer, with a diameter of 1?2 km, maximum vertical velocity more than 20 m s–1, and maximum vertical relative vorticity larger than 0.2 s?1. Wu et al. (2019) identified 10, 2 and 3 tornado-scale vortices in LES-37 at 27 h, 29 and 30 h, respectively. The maximum vertical motion and vorticity at 27 h were 31.98 m s?1 (at 400 m) and 0.55 s?1 (at 200 m). Note that the threshold of the updraft for detecting the tornado-scale vortex in Wu et al. (2019) was much larger than that for the extreme updraft in this study, implying that the weaker tornado-scale vortices were detected in this study.
As shown in Figs. 6a-f, the extreme updraft and downdraft at 6.5 km and 13 km are also associated with the enhanced eyewall convection, mainly in the northeast quadrant. The extreme updrafts and downdrafts are continuously arranged along the TC-scale tangential flow. As we know, convection bursts can be exceptionally deep and intense, with embedded updrafts of 10?20 m s?1 throughout the middle and upper troposphere (Houze et al., 2009). To examine the linkage with convection bursts, we plot the three-dimensional (3D) volumes of vertical motion (Fig. 7). This figure shows that the strong upward motion is embedded in the deep convection with stronger updrafts throughout the middle and upper levels. However, this figure also indicates that the extreme updrafts are associated with the local mid-level and upper-level structures.
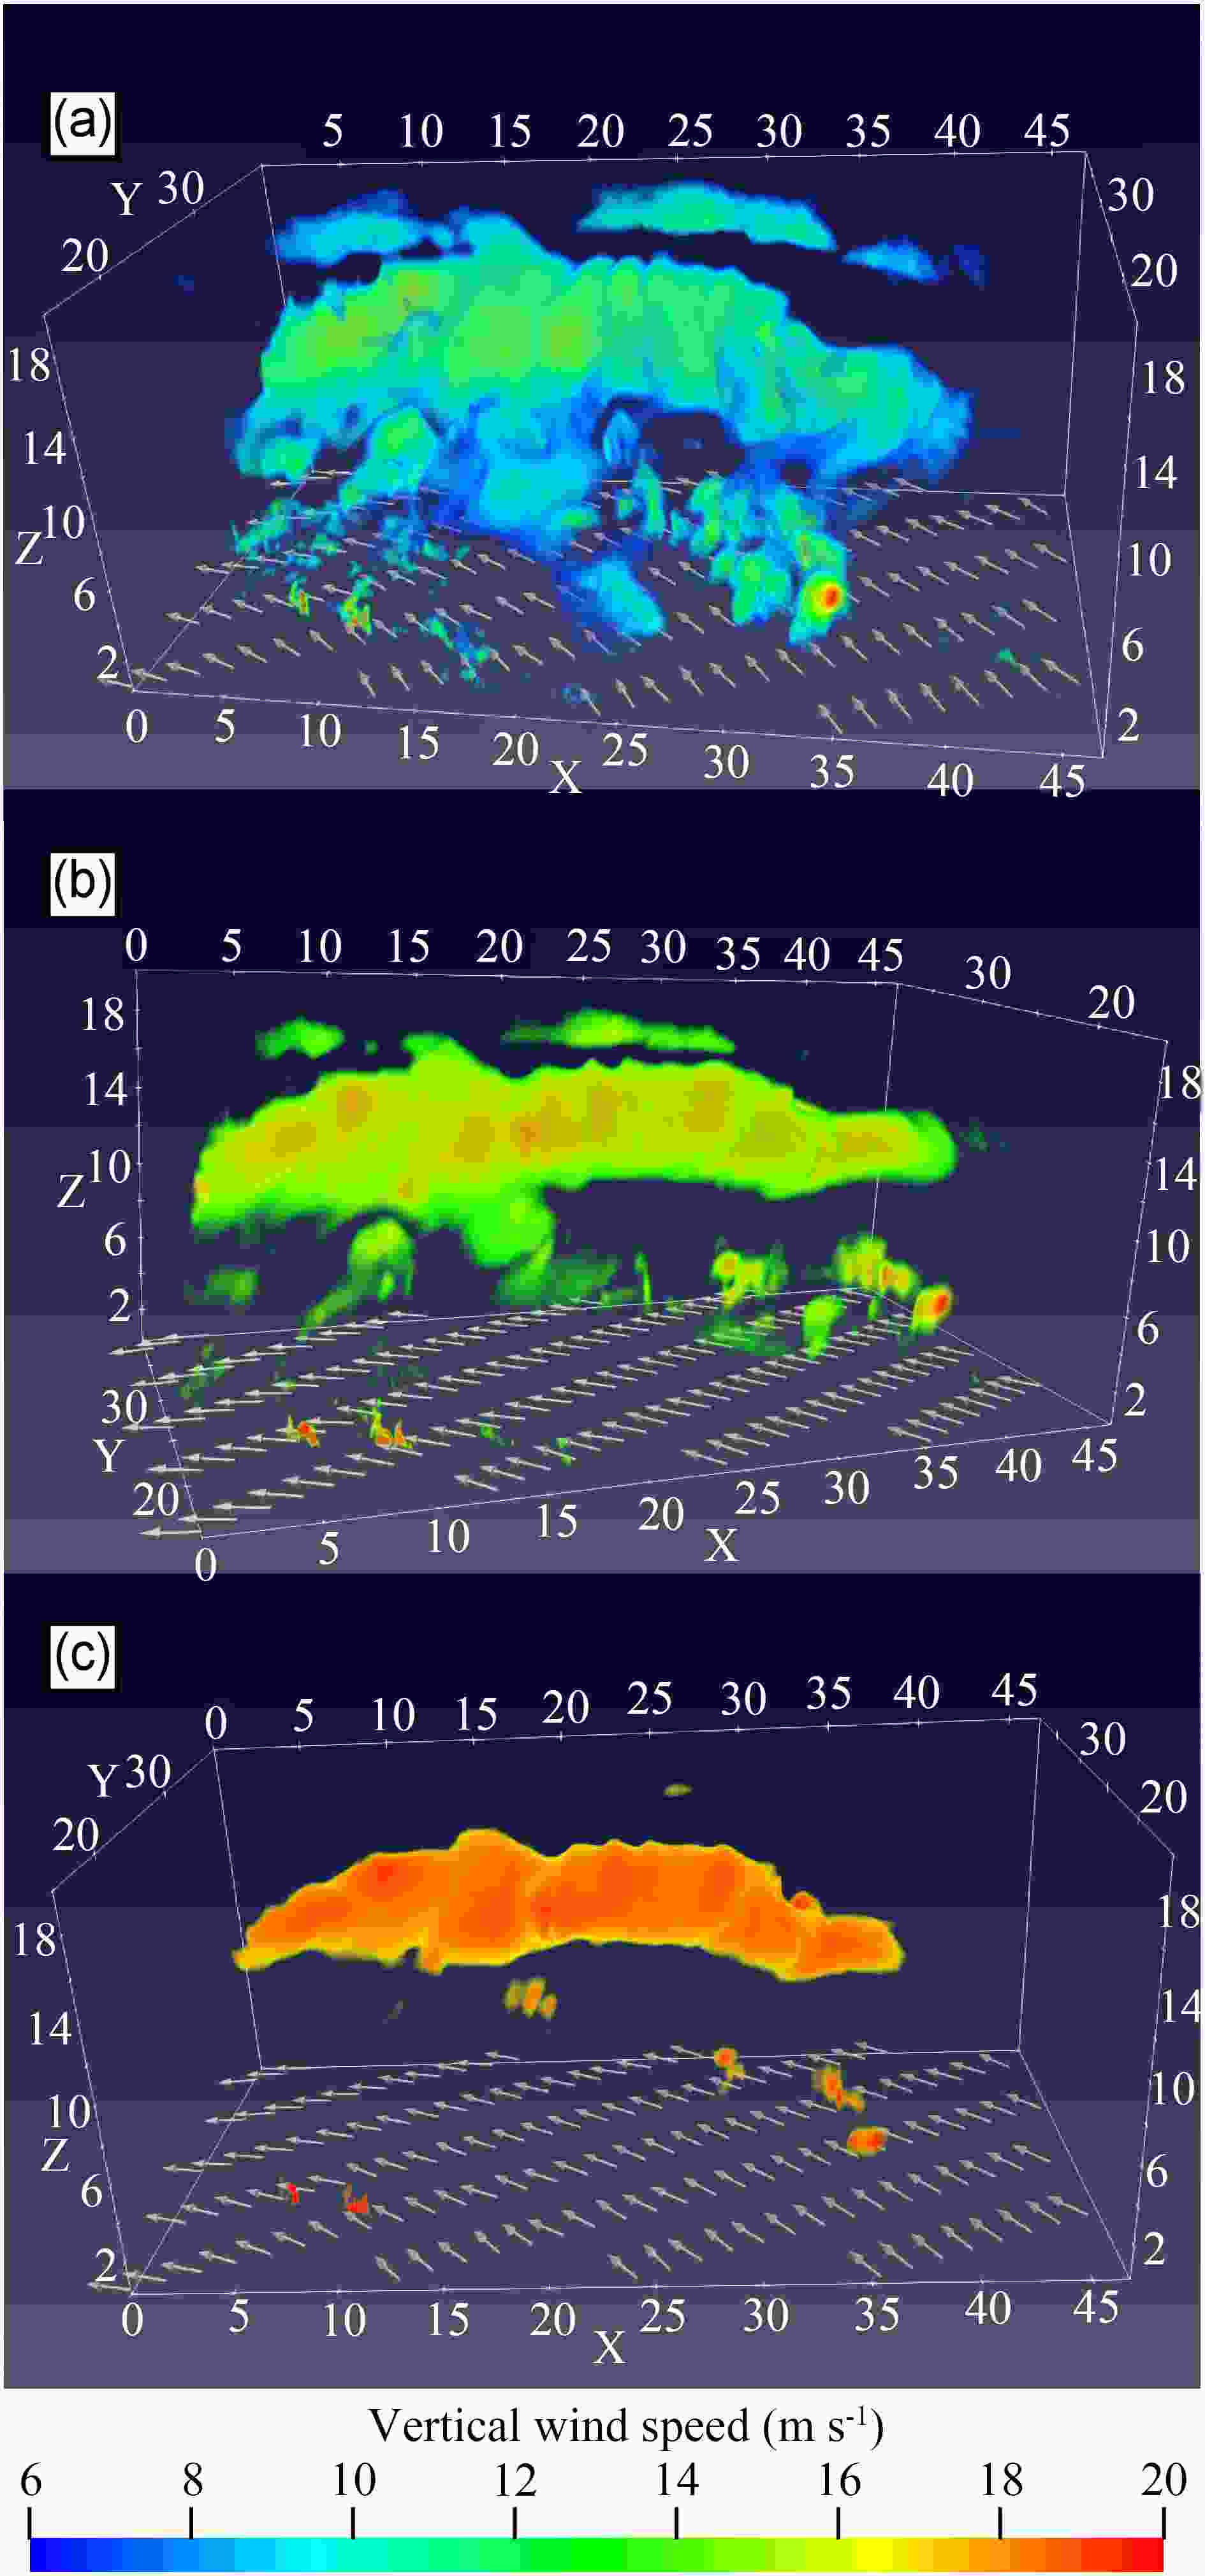 Figure7. The wind fields at 500 m (vector) and the volumes of the updrafts for the area of the rectangle in Fig. 6c. The minimum upward motion is 6 m s?1 in (a), 10 m s?1 in (b) and 15 m s?1 in (c). The TC-scale flow is indicated by white arrows.
We calculated the gradient Richardson number (Ri), which is a criterion for evaluating the stability of stratified shear flow (Molinari et al., 2014). Ri is defined as
where


Following Molinari et al. (2014), Fig. 8 shows the vertical distribution of the percentage of grid points with Ri < 1 and Ri < 0.25 during 25?36 h in LES-111 and LES-37. In the figure, we also plot the count of grid points with updrafts stronger than 10 m s?1 at all levels. We find that the vertical distributions in the two experiments are highly similar. The two maxima of the percentage of grid points with Ri < 1 and Ri < 0.25 occur mainly in the inflow and outflow layers, which correspond well with a relatively large count of grid points with updrafts stronger than 10 m s?1. Next, we show that the small-scale vortices in the upper and lower layers are associated with the strong vertical shear in the environment.
 Figure8. Vertical distribution of the frequency of grid points for Ri < 1 (black) and Ri < 0.25 (red) in (a) LES-111 and (b) LES-37. The blue bar indicates the frequency of grid points with perturbation updrafts of at least 10 m s?1 in (a) LES-111 and (b) LES-37. The frequency is normalized by the number of grid points in the innermost domain of LES-37.
2
3.3. Small-scale features associated with the mid- and upper-level extreme updrafts
Since the extreme updrafts at the lower levels are associated with the tornado-scale vortex at the inner edge of the eyewall, which has been discussed in Wu et al. (2018, 2019), here we focus mainly on the associated small-scale features at the middle and upper levels. Following Wu et al. (2019), the perturbation winds were calculated by subtracting an 8-km moving mean. Figure 9 shows a radius?height cross section of perturbation wind vectors and vertical velocity at 30 h. While the vertical motion extends to 14 km along the inner side of the eyewall (Fig. 3), Fig. 9 clearly indicates local enhancement of the vertical motion, which is related to the vortices at the upper levels (10?14 km) and middle levels (6?9 km). At the lower levels, the strong upward motion is located radially at the edge of the eyewall.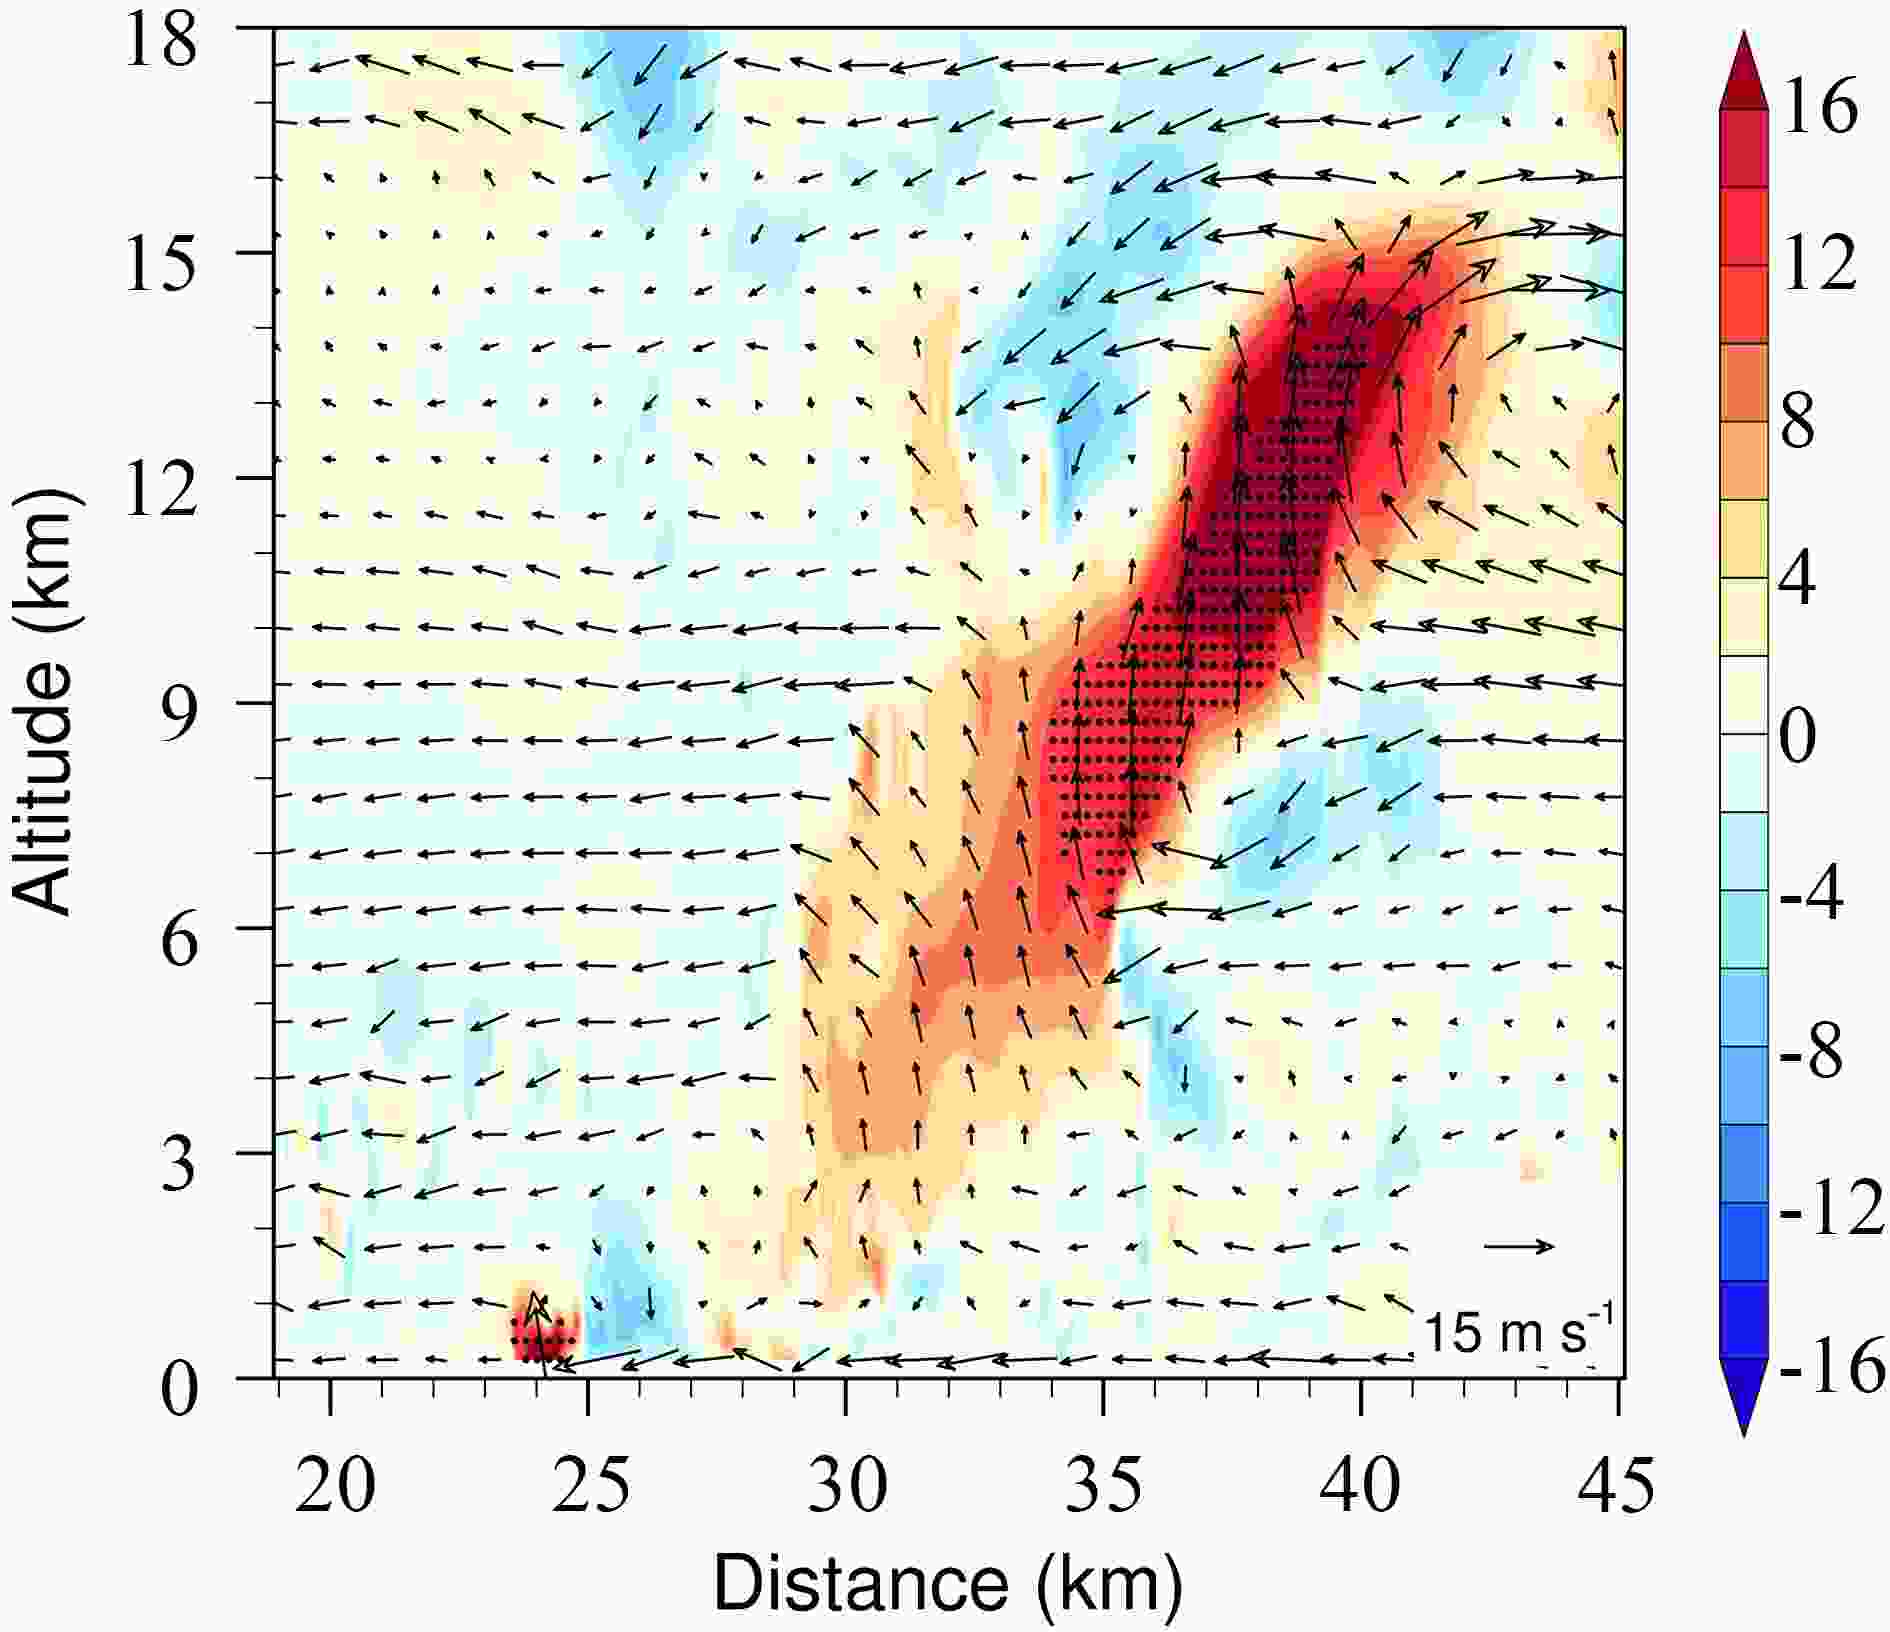 Figure9. Radius?height cross section of radial wind and vertical motion (vectors) in LES-37 along the line in Fig. 6c at 30 h. The shading indicates the magnitude of the vertical motion (units: m s?1). Vertical motions above the 0.1% percentage are denoted by dots.
In order to clearly demonstrate the 3D structure of the vortices, we plot the 3D streamlines of the perturbation winds. At the upper levels, the 3D streamlines of the perturbation winds in the northeast quadrant at 30 h are shown in Fig. 10a. The wind vectors at the 10-km altitude are also plotted to indicate the relative location of the small-scale structure. The figure includes all the identified upper-level extreme updrafts at 30 h. A robust feature is a pair of two elongated horizontal rolls generally oriented in the tangential direction. Note that the warm (cold) colors indicate the upward (downward) perturbation of vertical motion. The two counter-rotating rolls share the strong updrafts between them, and the downdrafts are on the radially outward and inward sides of the updrafts. Note that, as shown in Fig. 10a, one of the two horizontal rolls can be broken. We examine the extreme updrafts at 25, 27, 29 and 30 h and find that the patterns of perturbation winds are very similar to that in Fig. 10a.
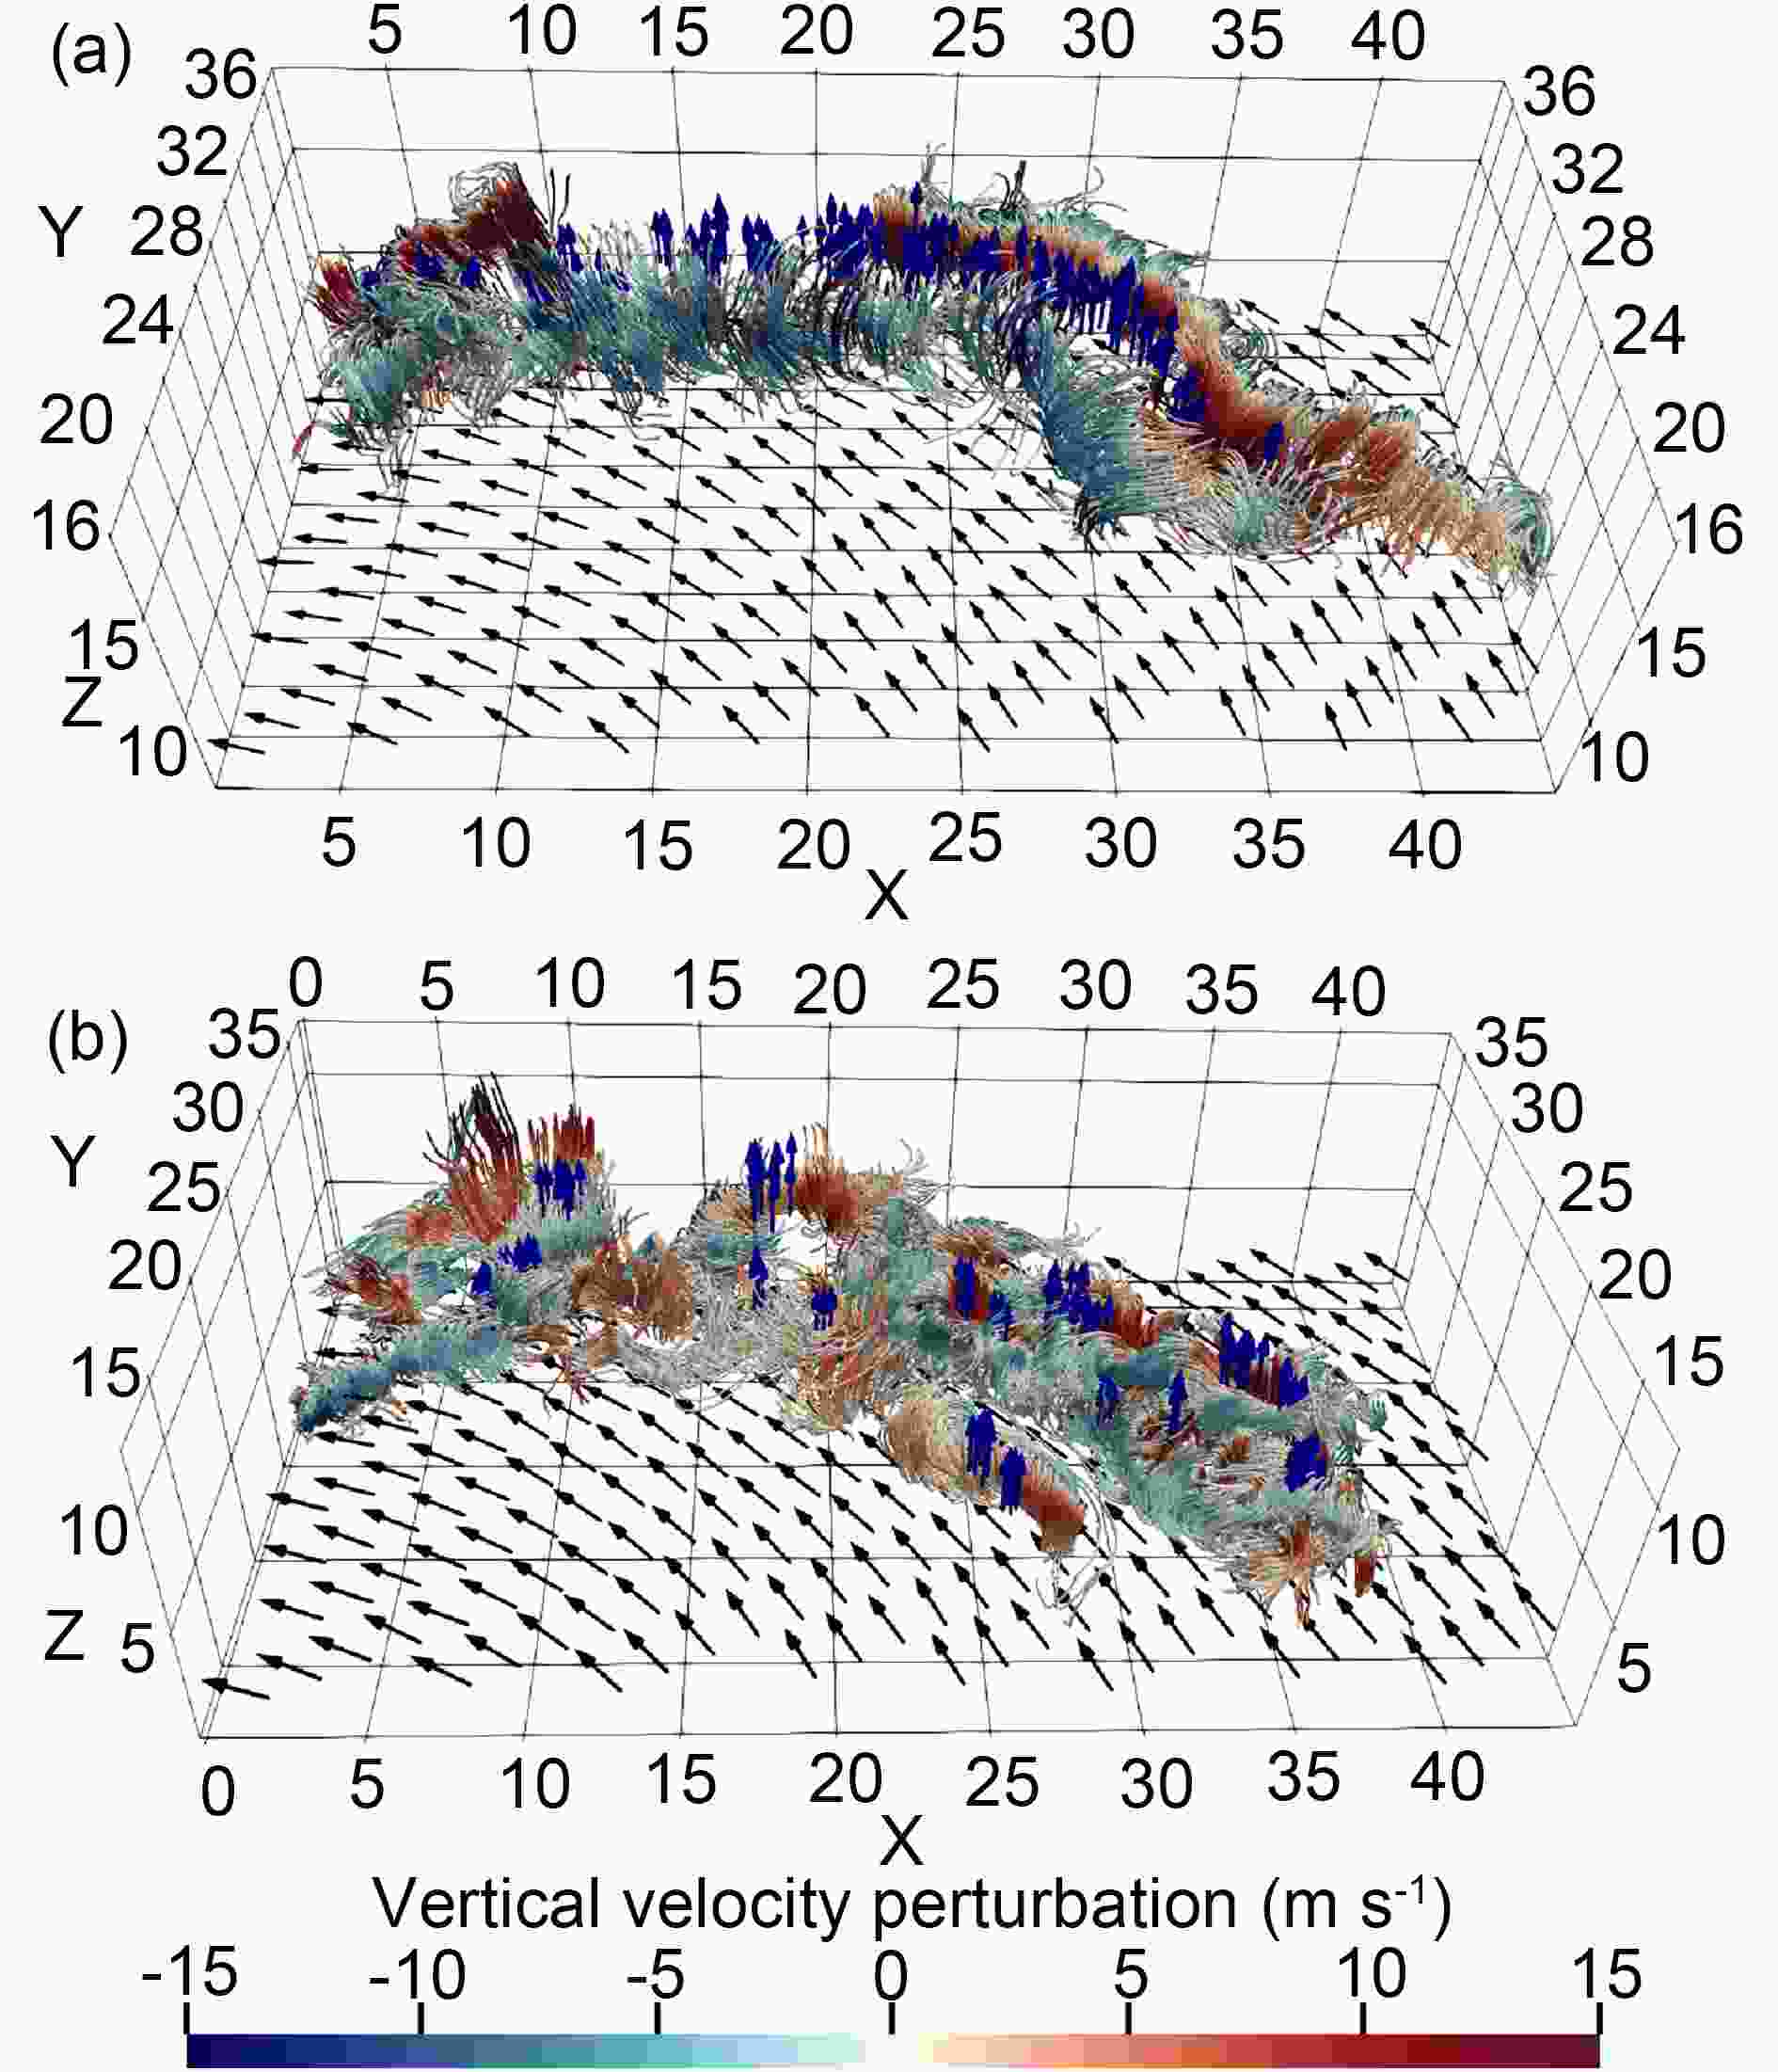 Figure10. Streamlines of the perturbation wind at the (a) upper and (b) middle levels in LES-37 at 30 h. The blue arrows indicate the extreme updrafts. The TC-scale flows are indicated by black arrows.
The horizontal rolls in Fig. 10a exhibit a vertical extent of 2?3 km around the altitude of 14 km, extending tens of kilometers generally along with the TC tangential flow. The vertical location of the upper-level rolls is consistent with the upper-level maximum frequency of the grids with Ri < 0.25 (Fig. 8). Figure 11 shows the vertical shear of the 8-km running averaged winds between 10 and 15 km and the vertical motion at 13 km. The vertical shear is dominated by the radial component, indicating the influence of the outflow and inflow of the enhanced eyewall convection around 14 km. It is suggested that the strong vertical shear resulting from the outflow and inflow of the enhanced eyewall convection is directly responsible for the upper-level extreme updrafts by inducing a pair of the counter-rotating horizontal rolls oriented along the TC-scale flow. This is why the upper-level extreme updrafts are closely associated with the enhanced eyewall convection in the northeast quadrant.
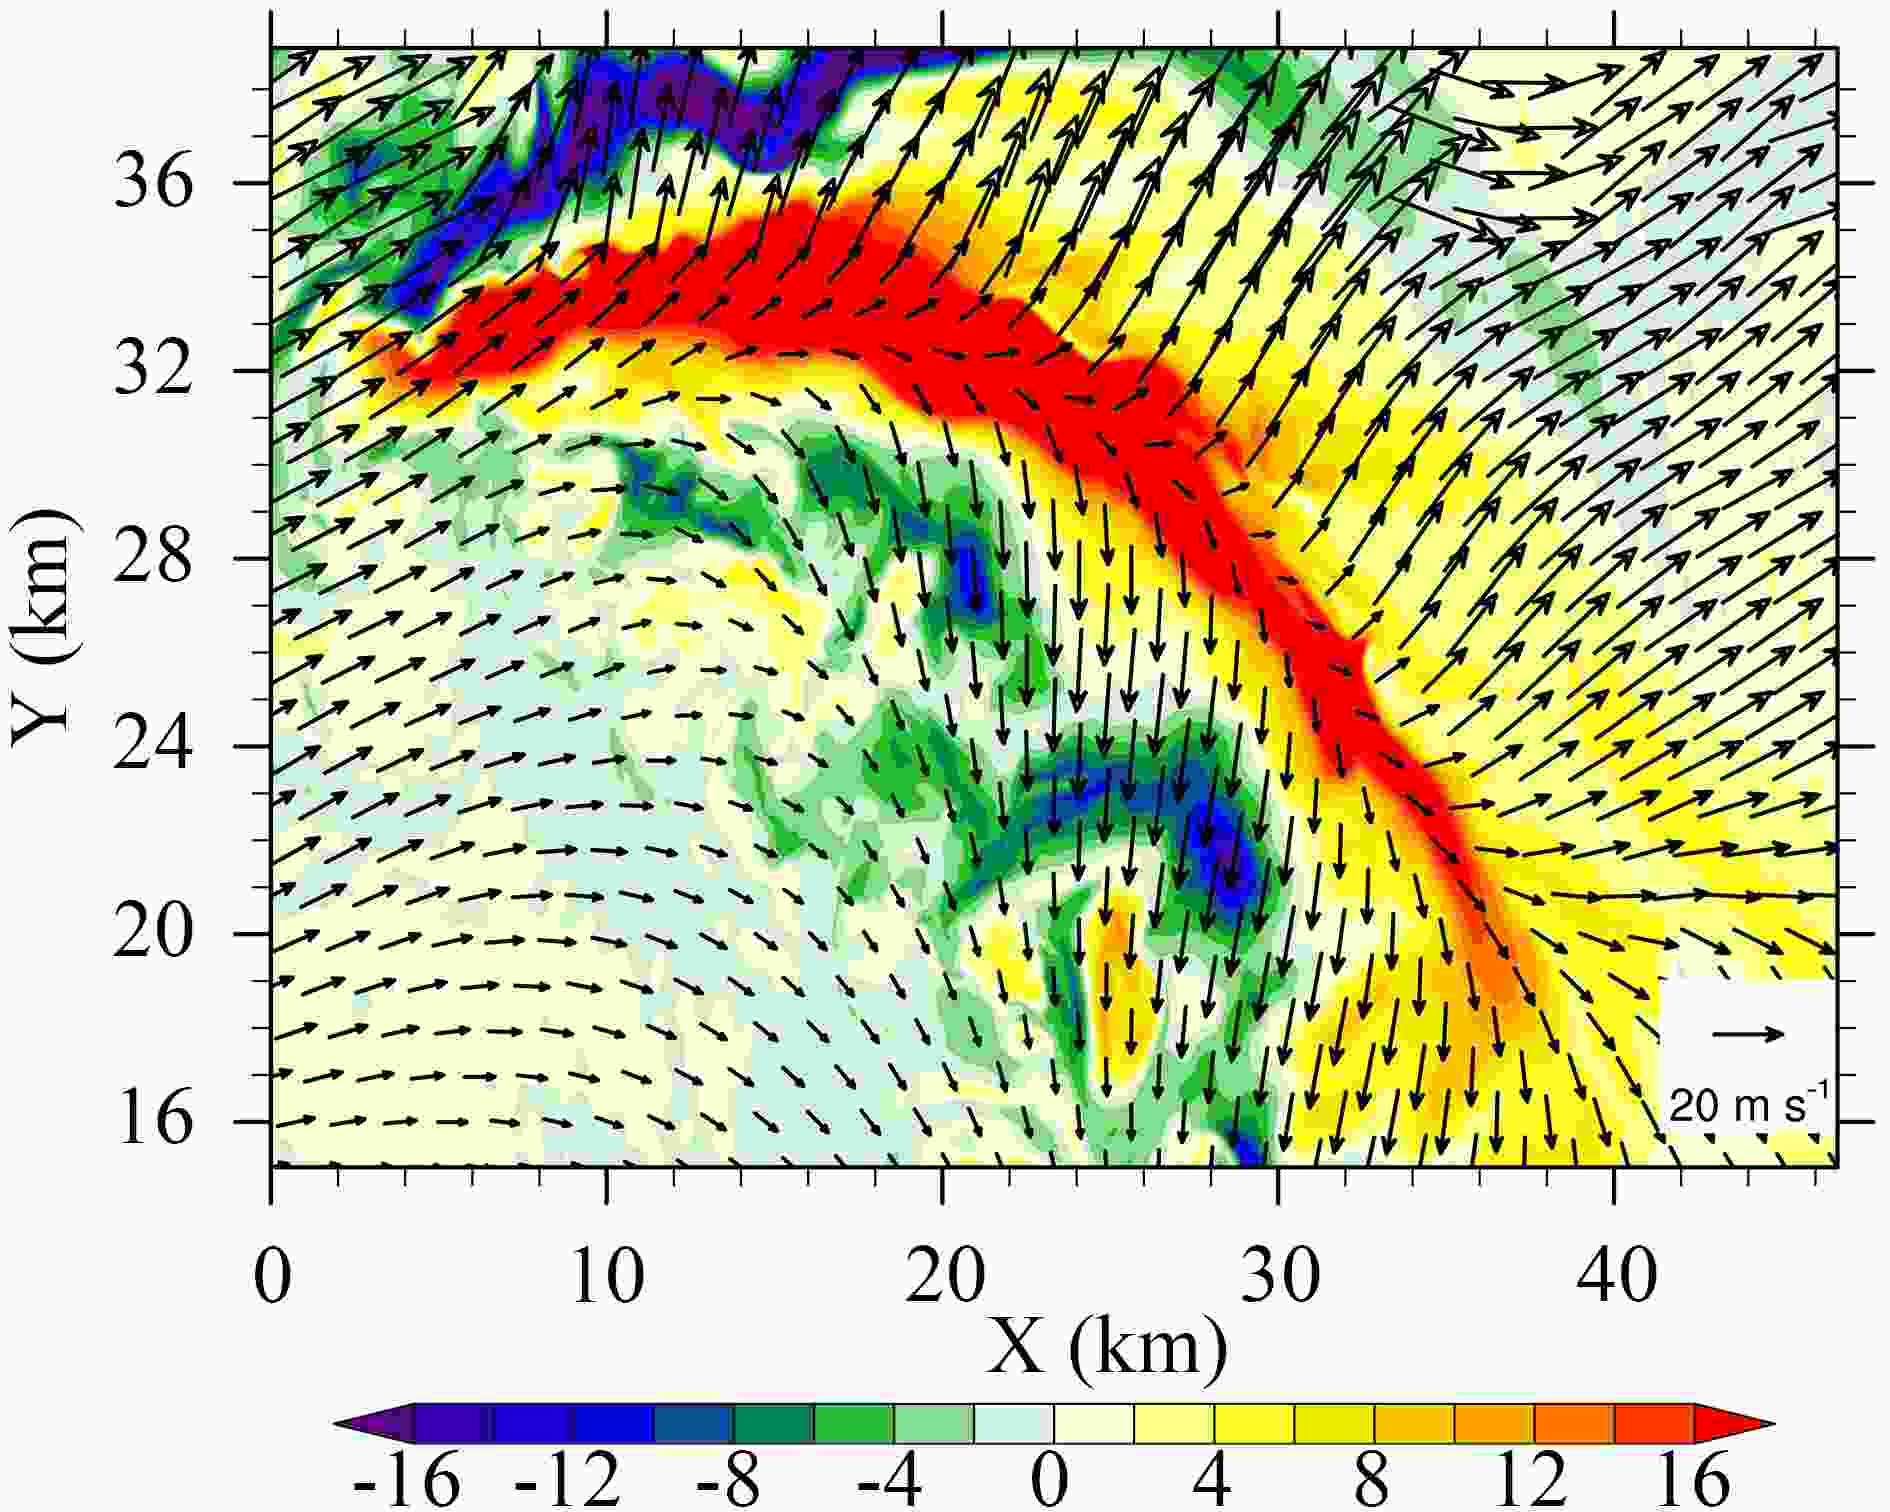 Figure11. Vertical wind shear of the 8-km mean winds between 10 and 15 km (vectors) and the 13-km vertical velocity (shading; units: m s?1) simulated in LES-37 at 30 h.
At the middle level, Fig. 8 suggests that the vertical wind shear is not a dominant factor for producing extreme updrafts. Figure 10b shows the 3D streamlines of the corresponding perturbation winds at the middle levels at 30 h. Although the pattern is roughly similar to Fig. 10a, close examination suggests that the small-scale features associated with the mid-level extreme updrafts are much more complicated than those at the upper levels. In the survey of the patterns of perturbation winds at the middle levels, there are three typical categories (Fig. 12). In the first category, the strong updraft is surrounded by the downdraft, forming a ring-like roll (Fig. 12a). The second category seems to be two counter-rotating rolls that lie horizontally, similar to the high-level system but with a smaller scale (Fig. 12b), and the third category is like a single roll, which is twisted and tilted in the vertical (Fig. 12c).
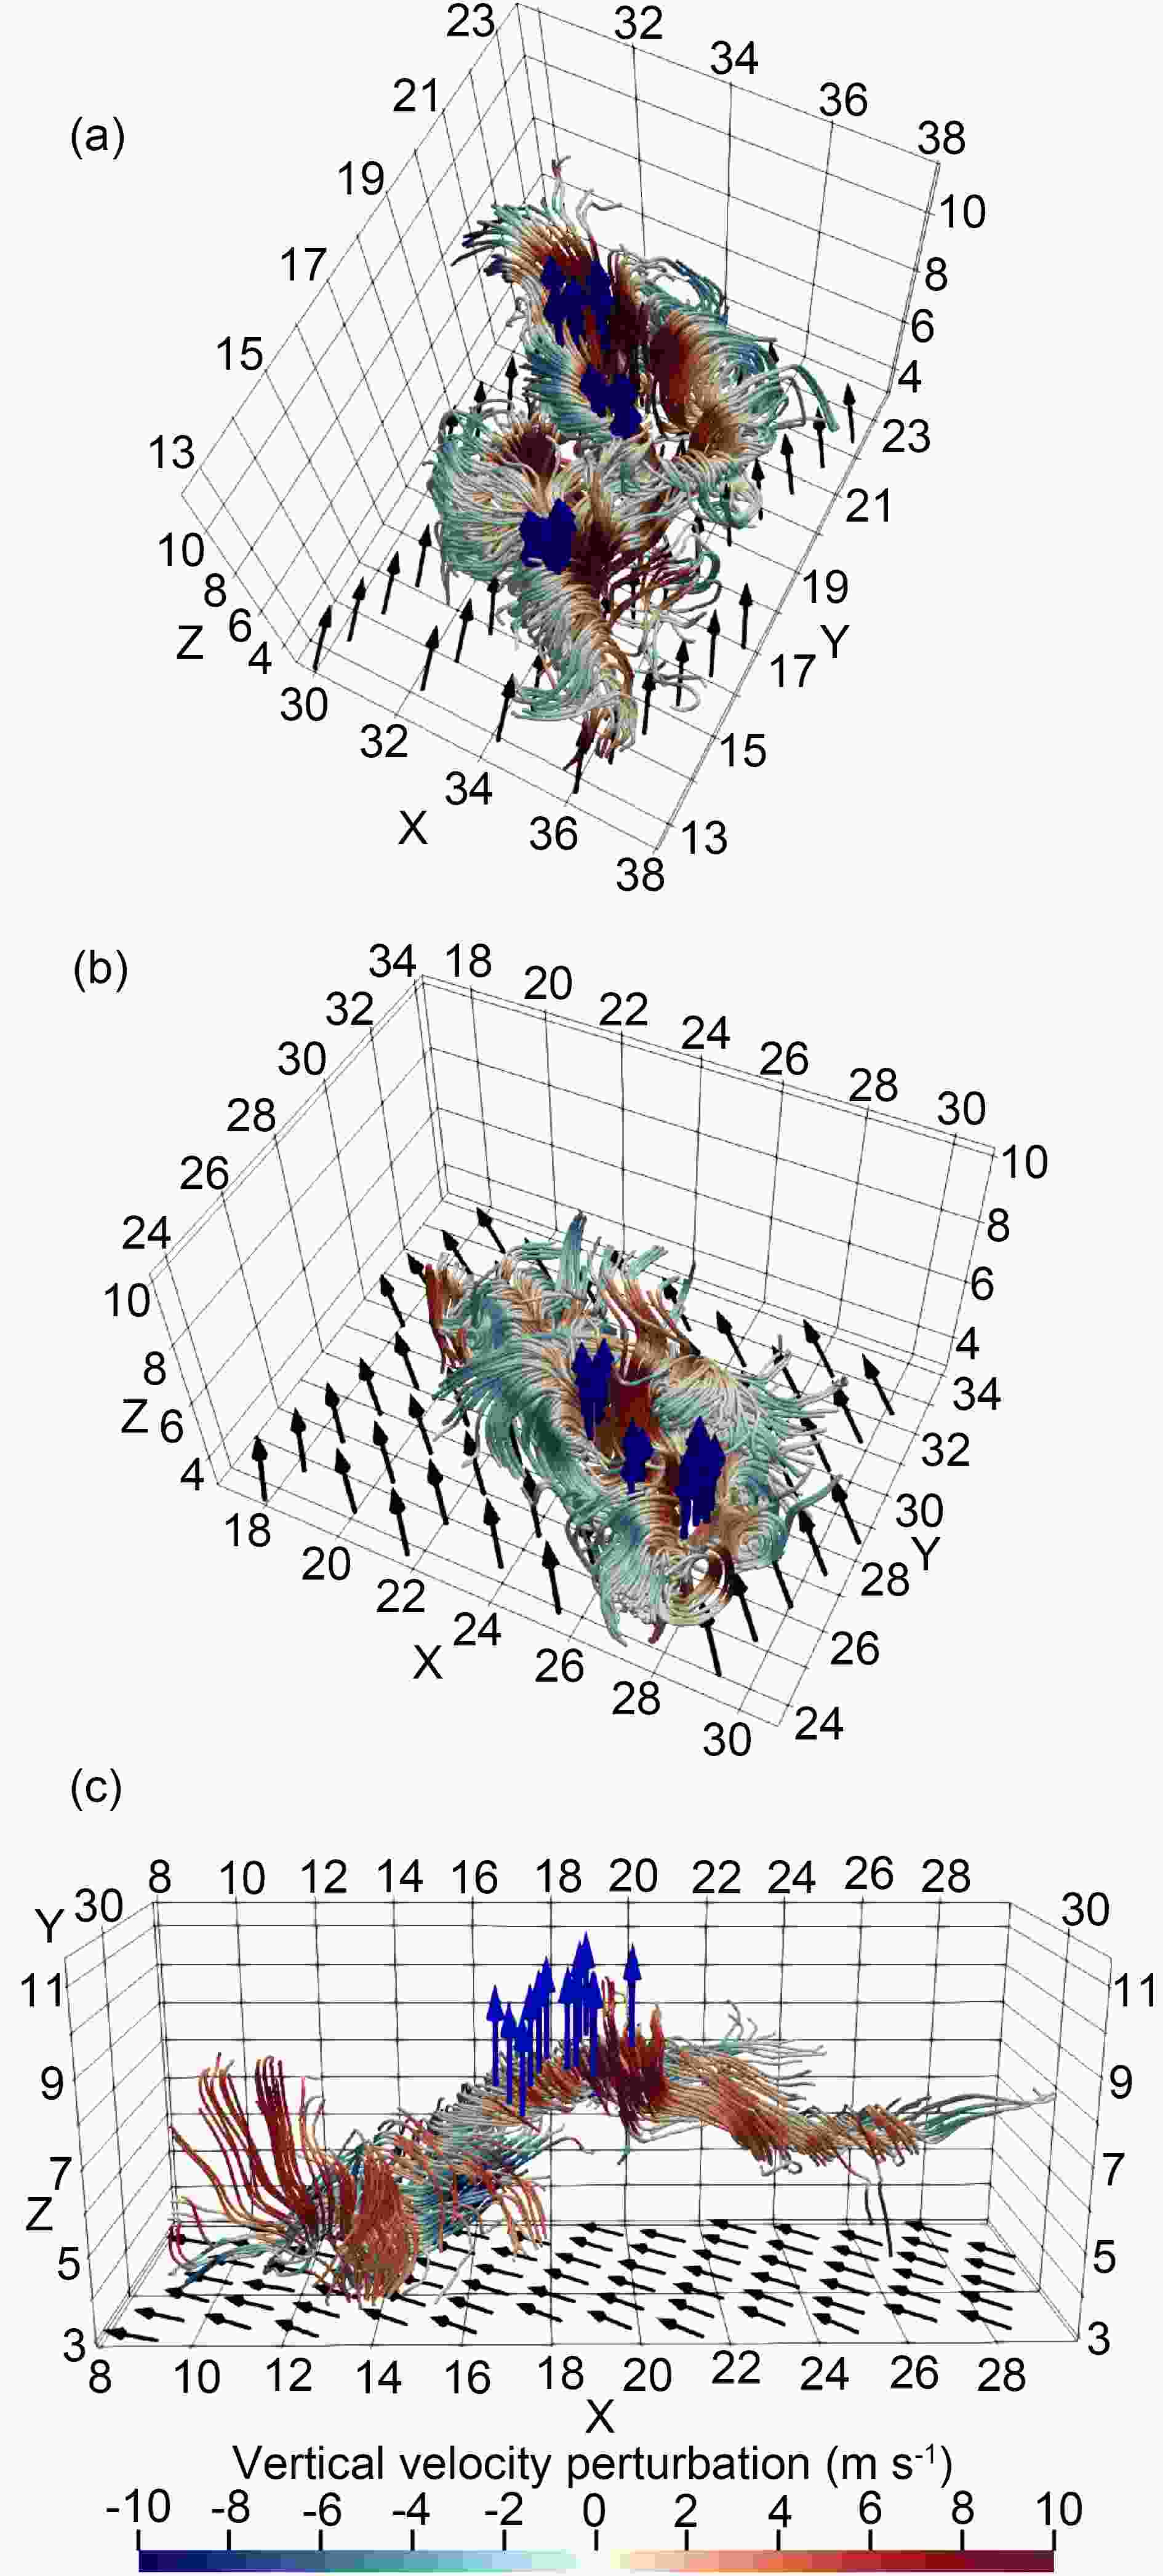 Figure12. Typical structures of small-scale features associated with the middle-level extreme updrafts (blue arrows) simulated in LES-37 at 30 h. The TC-scale flows are indicated by black arrows.
The updrafts are related to different small-scale features at the lower, middle and upper levels. While the extreme updrafts at the lower levels occur with the tornado-scale vortex (Wu et al., 2018, 2019), the extreme updrafts at the middle and upper levels are also collocated with strong vertical motion of the enhanced eyewall convection. The extreme updrafts at upper levels are closely associated with the strong vertical shear resulting from the outflow and inflow of the enhanced eyewall convection, forming a pair of counter-rotating horizontal rolls oriented along the tangential flow. The two counter-rotating horizontal rolls around the altitude of 14 km are elongated generally along the tangential flow with a vertical extent of 2?3 km. The extreme updrafts at the middle levels are associated with a ring-like roll, a single roll, or two counter-rotating rolls that lie horizontally and are twisted and tilted in the vertical. The spatial and temporal distributions of the extreme updraft show very similar features in the two numerical experiments. Moreover, the magnitude of the simulated extreme of vertical motion is comparable in the two experiments.
Note that the vertical resolution is not sufficiently high due to the limitation of computation capacity. The vertical resolution in the boundary can resolve the small-scale features (Wu et al., 2018, 2019), which is consistent with the observation (Marks et al., 2008; Stern et al., 2016; Aberson et al., 2017). At the middle and upper levels, extreme updrafts and downdrafts have been discussed in observed TCs (e.g., Jorgensen et al., 1985; Black et al., 1994, 1996; Heymsfield et al., 2001; Marks et al., 2008; Guimond et al., 2010; Aberson et al., 2017), but the observations are so limited that it is hard to verify the simulated small-scale features in this study. Given the importance of the small-scale features on TC structure changes and intensity (Zhu, 2008, 2015; Zhu et al., 2018), further investigation is needed to improve our understanding of the extreme updrafts and associated small-scale features in TCs by increasing the vertical resolution.
Acknowledgements. The study was jointly supported by the National Basic Research Program of China (Grant No.2015CB452803), the National Natural Science Foundation of China (Grant Nos. 41730961, 41675051, 41675009, 41905001, 61827901 and 41675072), and the Open Research Program of the State Key Laboratory of Severe Weather (Grant No. 2019LASW-A02).
