HTML
--> --> -->The importance of warm underlying oceanic conditions, favorable for a TC to undergo RI, has been well demonstrated in modeling and observational studies (Wang and Wu, 2004; Zeng et al., 2010; Duan et al., 2013; Zhang et al., 2017). Moreover, statistical studies show that significant differences exist between not only oceanic conditions but also atmospheric conditions (Kaplan et al., 2010). The results suggest that storms are more likely to undergo RI if they are located in regions of warmer-than-average sea surface temperature (SST) and upper-ocean heat content (OHC), higher-than-average low- to mid-tropospheric moisture, and weaker-than-average environmental vertical wind shear (VWS). We note that all ensemble forecasts presented here are run with the same high SST values, but even with a very similar track some undergo a much-delayed RI. As in earlier studies, this suggests that although high SSTs are necessary for RI, they are not a sufficient condition, and the environment and vortex structure should also be favorable to enable the RI. Environmental VWS has long been considered as a major influence on RI (Zeng et al., 2007, 2008; Wang et al., 2015; Chen et al., 2017). However, precisely how the shear influences the RI is still problematic.
It has been suggested that the structure of a TC is sensitive to VWS (e.g., Gu et al., 2015, 2016; Li et al., 2017). VWS acts to tilt the TC vortex downshear-left in the Northern Hemisphere, as suggested in theoretical studies (Jones, 1995; Reasor et al., 2004), in modeling studies (Braun et al., 2006; Wu et al., 2006; Nguyen and Molinari, 2015; Li et al., 2017), and in observational studies (Jiang, 2012; Sanger et al., 2014; Rogers et al., 2015). Thus, the predictability of TC intensity declines with increasing VWS as it plays a rather significant role in determining the vertical alignment of TC circulations (Zhang and Tao, 2013). A tilting TC vortex in response to moderate or strong VWS has pronounced asymmetries in structure and rainfall. These asymmetries primarily develop a downshear-right pattern of low-level convergence, and strong updrafts persist upshear-left during the intensifying period while descent dominates upshear-left during the TC weakening period (Rogers et al., 2016). Some previous studies have described pathways by which a tilting sheared TC vortex can inhibit TC intensification. The most efficient way—the so-called “ventilation” effect—is to reduce eyewall moist entropy located downshear-left and suppress convection within the eyewall, by means of a flux of low equivalent potential temperature (θe) air into the boundary layer from downward motions excited by the evaporation of precipitation or intrusion of ambient low-θe air (Riemer et al., 2010; Tang and Emanuel, 2010, 2012; Riemer and Laliberté, 2015). Low-θe downdraft air outside the storm’s inner core often does not recover its original θe before reaching the eyewall, thereby inhibiting the storm intensification (Molinari et al., 2013; Riemer et al., 2013).
The prevailing view on ventilation is that VWS modulates TC intensity through the inward mixing of ambient low-entropy air into the TC inner core. The adverse effects of ventilation on the intensity of a TC in shear are hypothesized by three possible but not necessarily independent mechanisms: (1) upper-level dilution of the TC warm core (Frank and Ritchie, 2001; Wong and Chan, 2004); (2) midlevel ingestion of dry environmental air into the TC eyewall (Simpson and Riehl, 1958; Cram et al., 2007; Tang and Emanuel, 2010; Ge et al., 2013; Kanada and Wada, 2015); and (3) low-level intrusion of cooler and drier ambient air from low to middle levels down into the TC inflow layer and then into the eyewall updrafts (Riemer et al., 2010; Riemer and Montgomery, 2011; Tang and Emanuel, 2012; Riemer and Laliberté, 2015). Using idealized simulations (Riemer et al., 2010; Tang and Emanuel, 2012; Riemer and Laliberté, 2015), some studies argue that the ventilation at low levels (pathway 3) is more efficient as an anti-fuel mechanism for the TC heat engine (Emanuel, 1986). Similarly, Onderlinde and Nolan (2017) also highlighted the importance of environmental wind shear in modulating the ventilation and hence TC intensity, during experiments on the impact of time-varying wind shear on intensity changes. Many aspects of their results are consistent with those presented here.
It has been noted that a sheared TC intensification can be promoted when a TC vortex undergoes a “downshear reformation” to suppress the ventilation effect via a two-step process: first, the new vortex forms within the downshear convection, and next, the TC intensifies via the combination of surface enthalpy fluxes and the absence of penetrative downshear-right downdrafts allowing the boundary layer moist entropy to increase (Molinari et al., 2004; Nguyen and Molinari, 2015; Reasor and Montgomery, 2015). These asymmetric processes associated with rotating convective updrafts in and around the developing eyewall region have been shown to contribute to an enhanced secondary circulation (Montgomery et al., 2014; Montgomery and Smith, 2014; Smith et al., 2017; Chen et al., 2018).
Recently, the linkage between rotating convective updrafts or deep convection around the storm center and RI has been highlighted. Indeed, the long-standing and validated method of Dvorak (1975, 1984) is based upon changes in the depth and structure of convection around the inner core—that is, the development of convective bursts (CBs). Based on observational studies, TCs experiencing episodes of intensification or RI have a relatively large amount of tall and vigorous convective clouds (i.e., CBs) inside the radius of maximum wind (RMW) (Chen and Zhang, 2013; Rogers et al., 2013, 2015, 2016; Sanger et al., 2014; Chen and Gopalakrishnan, 2015; Smith and Montgomery, 2015). Moreover, comparisons between RI and other examples of steady intensification suggest that both shallow-to-moderate convection and CBs inside the RMW contribute to RI (Kanada and Wada, 2015; Rios-Berrios et al., 2016; Chen et al., 2018). In addition, based on an 11-yr Tropical Rainfall Measuring Mission database, results showed that moderate-to-deep convection and associated latent heat release significantly increased only after RI had commenced, and identifying RI from the existence of CBs did not provide consistent forecast guidance (Jiang, 2012; Zagrodnik and Jiang, 2014). These results suggest that the complexity of different VWS patterns and different TC vortex structures—major influences on moist convection and intensity change—result in different outcomes for the intensification of a TC.
In a recent study, which also used an ensemble methodology similar that described here, Leighton et al. (2018), indicate that an analysis of the inner-core structure revealed that as deep convection wrapped around from the downshear side of the storm to the upshear-left quadrant for RI members, vortex tilt and asymmetry were rapidly reduced, and RI occurred. For non-intensifying members, deep convection was concentrated in the downshear/downshear-right quadrant, and storms did not intensify. A budget calculation of tangential wind tendency revealed that the positive radial eddy vorticity ?ux for RI members contributed signi?cantly to spinning up the tangential wind in the middle and upper levels and reduced vortex tilt. The evolution of convection illustrated in Leighton et al. (2018) is very similar to that described here. We suggest that different vortex structures, monitored in terms of the low-, mid- and upper-level vortex sizes, also plays an important role in the evolution of convection.
Super Typhoon Rammasun (2014) is the strongest-recorded TC at landfall over the Chinese mainland since 1949 (Zhang et al., 2017). Previous studies have discussed the cloud microphysical and surface energetics favorable for Rammasun’s intensification (Deng et al., 2016; Zhang et al., 2017). The objectives of the current study are: (1) to run and verify an ensemble of high-resolution forecasts using version 3.6.1 of the Advanced Research version of the Weather Research and Forecasting (WRF) model (ARW-WRF) (Skamarock et al., 2008) of the RI of Rammasun; (2) to evaluate the sensitivity of forecasting RI to initial conditions; (3) to analyze and compare the ensemble members that forecast the RI with generally correct timing, against those with a much-delayed RI; and (4) to isolate the critical atmospheric environmental mechanisms that differentiated successful RI forecasts from failed or much-delayed RI forecasts. These objectives are sequentially considered.
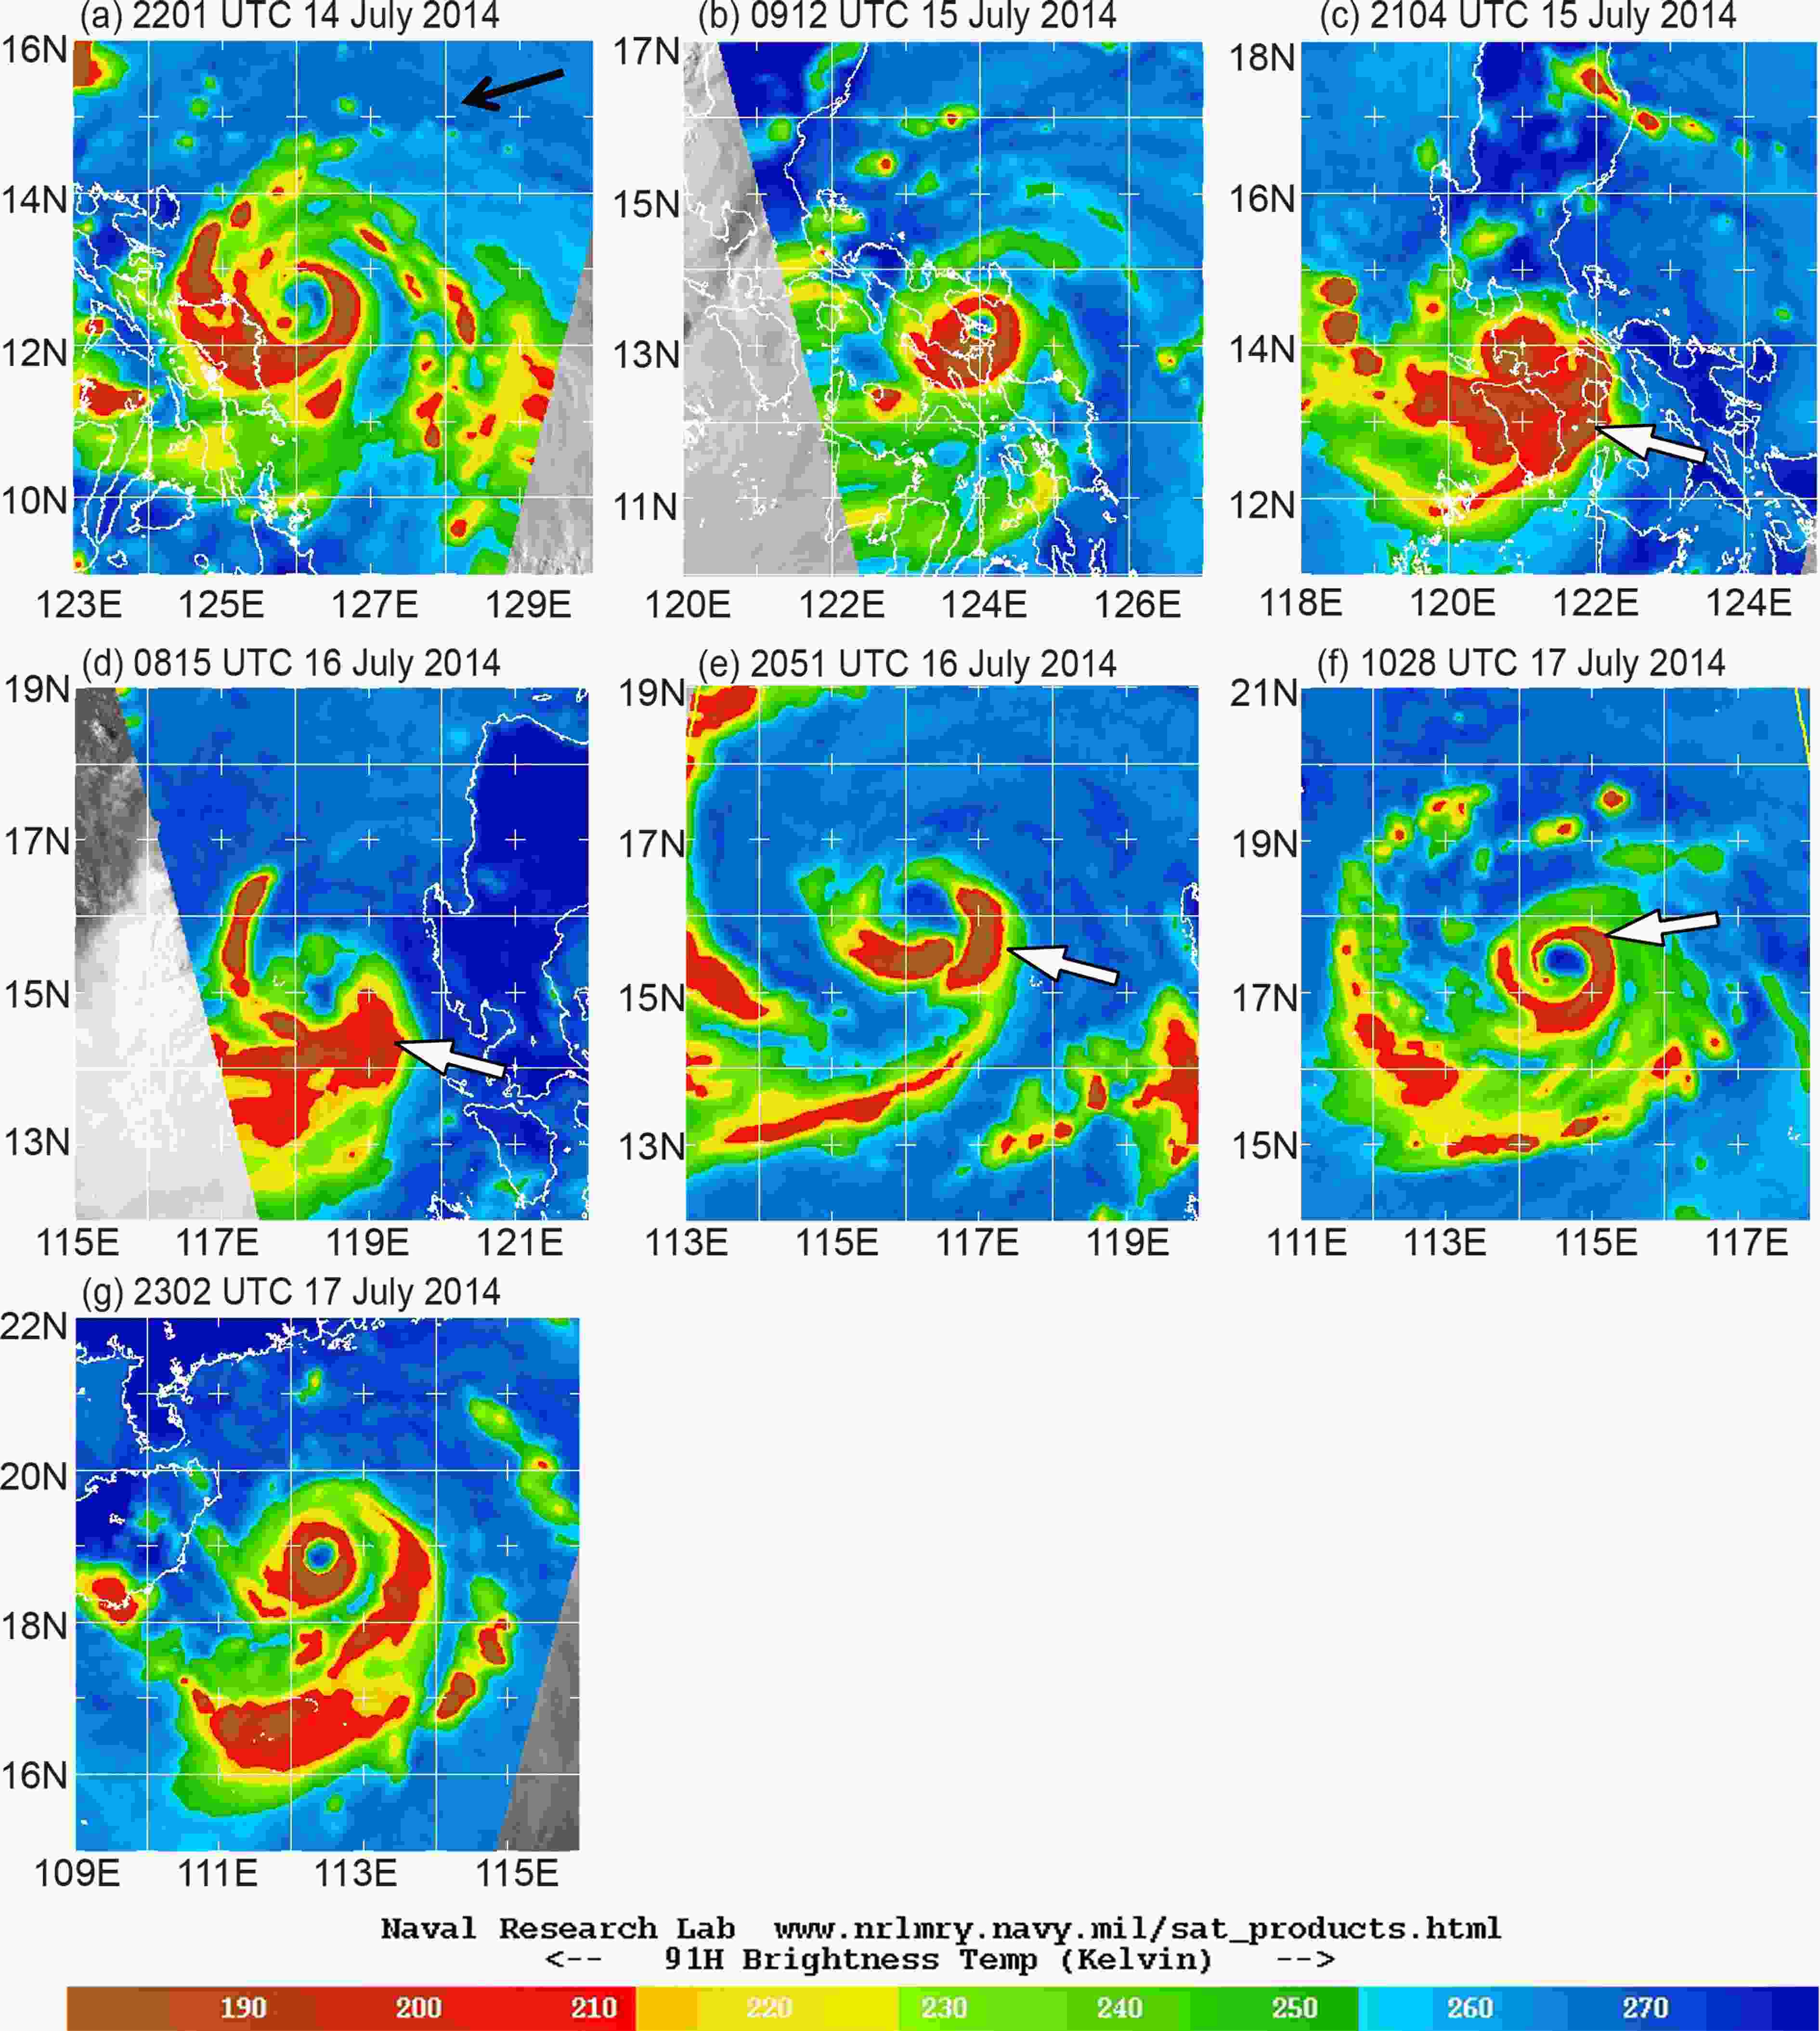 Figure1. Satellite images at given times showing structural changes as Super Typhoon Rammasun (2014) crossed the Philippines and underwent rapid intensification over the South China Sea. Black arrow denotes the direction of environmental vertical wind shear. Images courtesy of the Naval Research Laboratory (www.nrlmry.navy.mil/sat_products.html). White arrows point to the developing inner cloud band that wraps inwards to form the eyewall cloud.
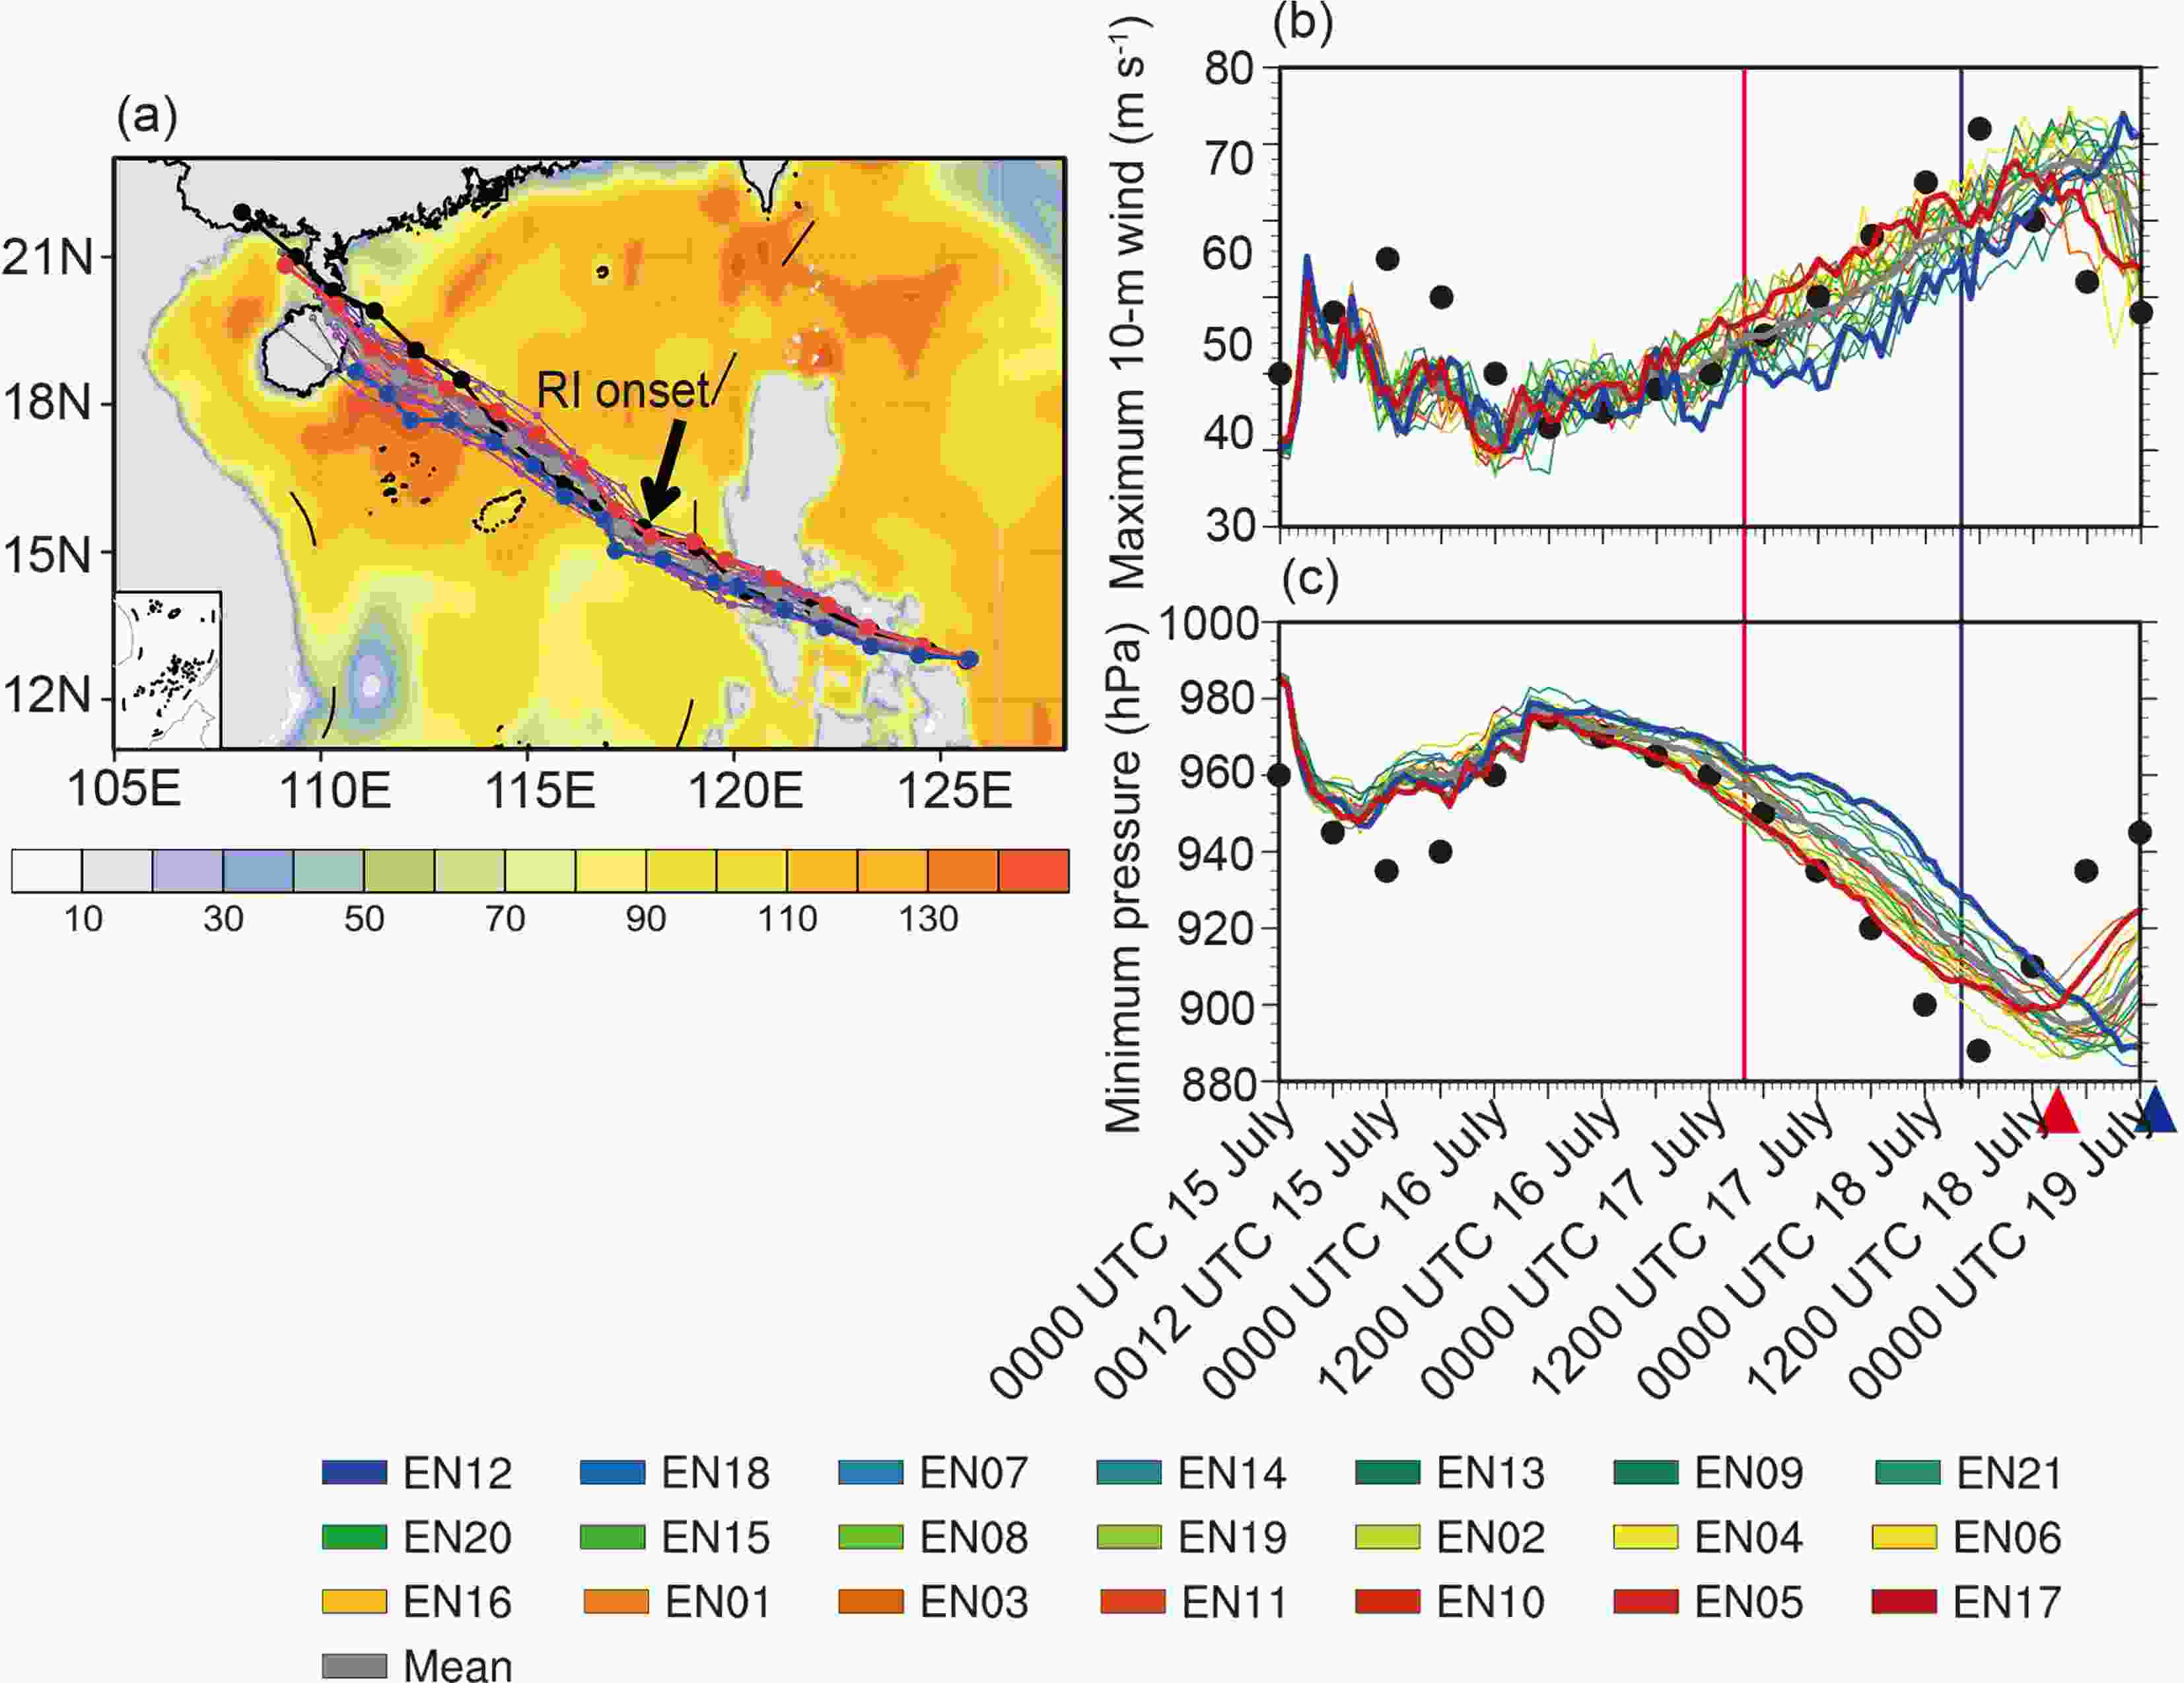 Figure2. (a) Ensemble track forecasts initialized at 0000 UTC 15 July 2014. The various tracks depict six-hourly storm positions of the individual ensemble members (purple), the ensemble mean of individual members (grey), the track of member 17 (EarlyRI) (red, which gave the best forecast of RI), the track of member 12 (LateRI) (blue, which gave a much-delayed forecast of RI), and the best track (black). Shading indicates an analysis of daily averaged upper OHC (kJ cm?2) on 16 July 2014 derived from the OceanMaps 2.0 dataset. (b, c) Ensemble intensity forecasts of (b) storm minimum central pressure and (c) storm maximum 10-m wind for the individual ensemble members, the ensemble mean of individual members (grey line), EarlyRI (red line), LateRI (blue line), and the best track (black dots). Vertical lines (red, blue) indicate the RI onset times for the EarlyRI and LateRI simulations. Red and blue arrows indicate the landfall time for the EarlyRI and LateRI simulations.
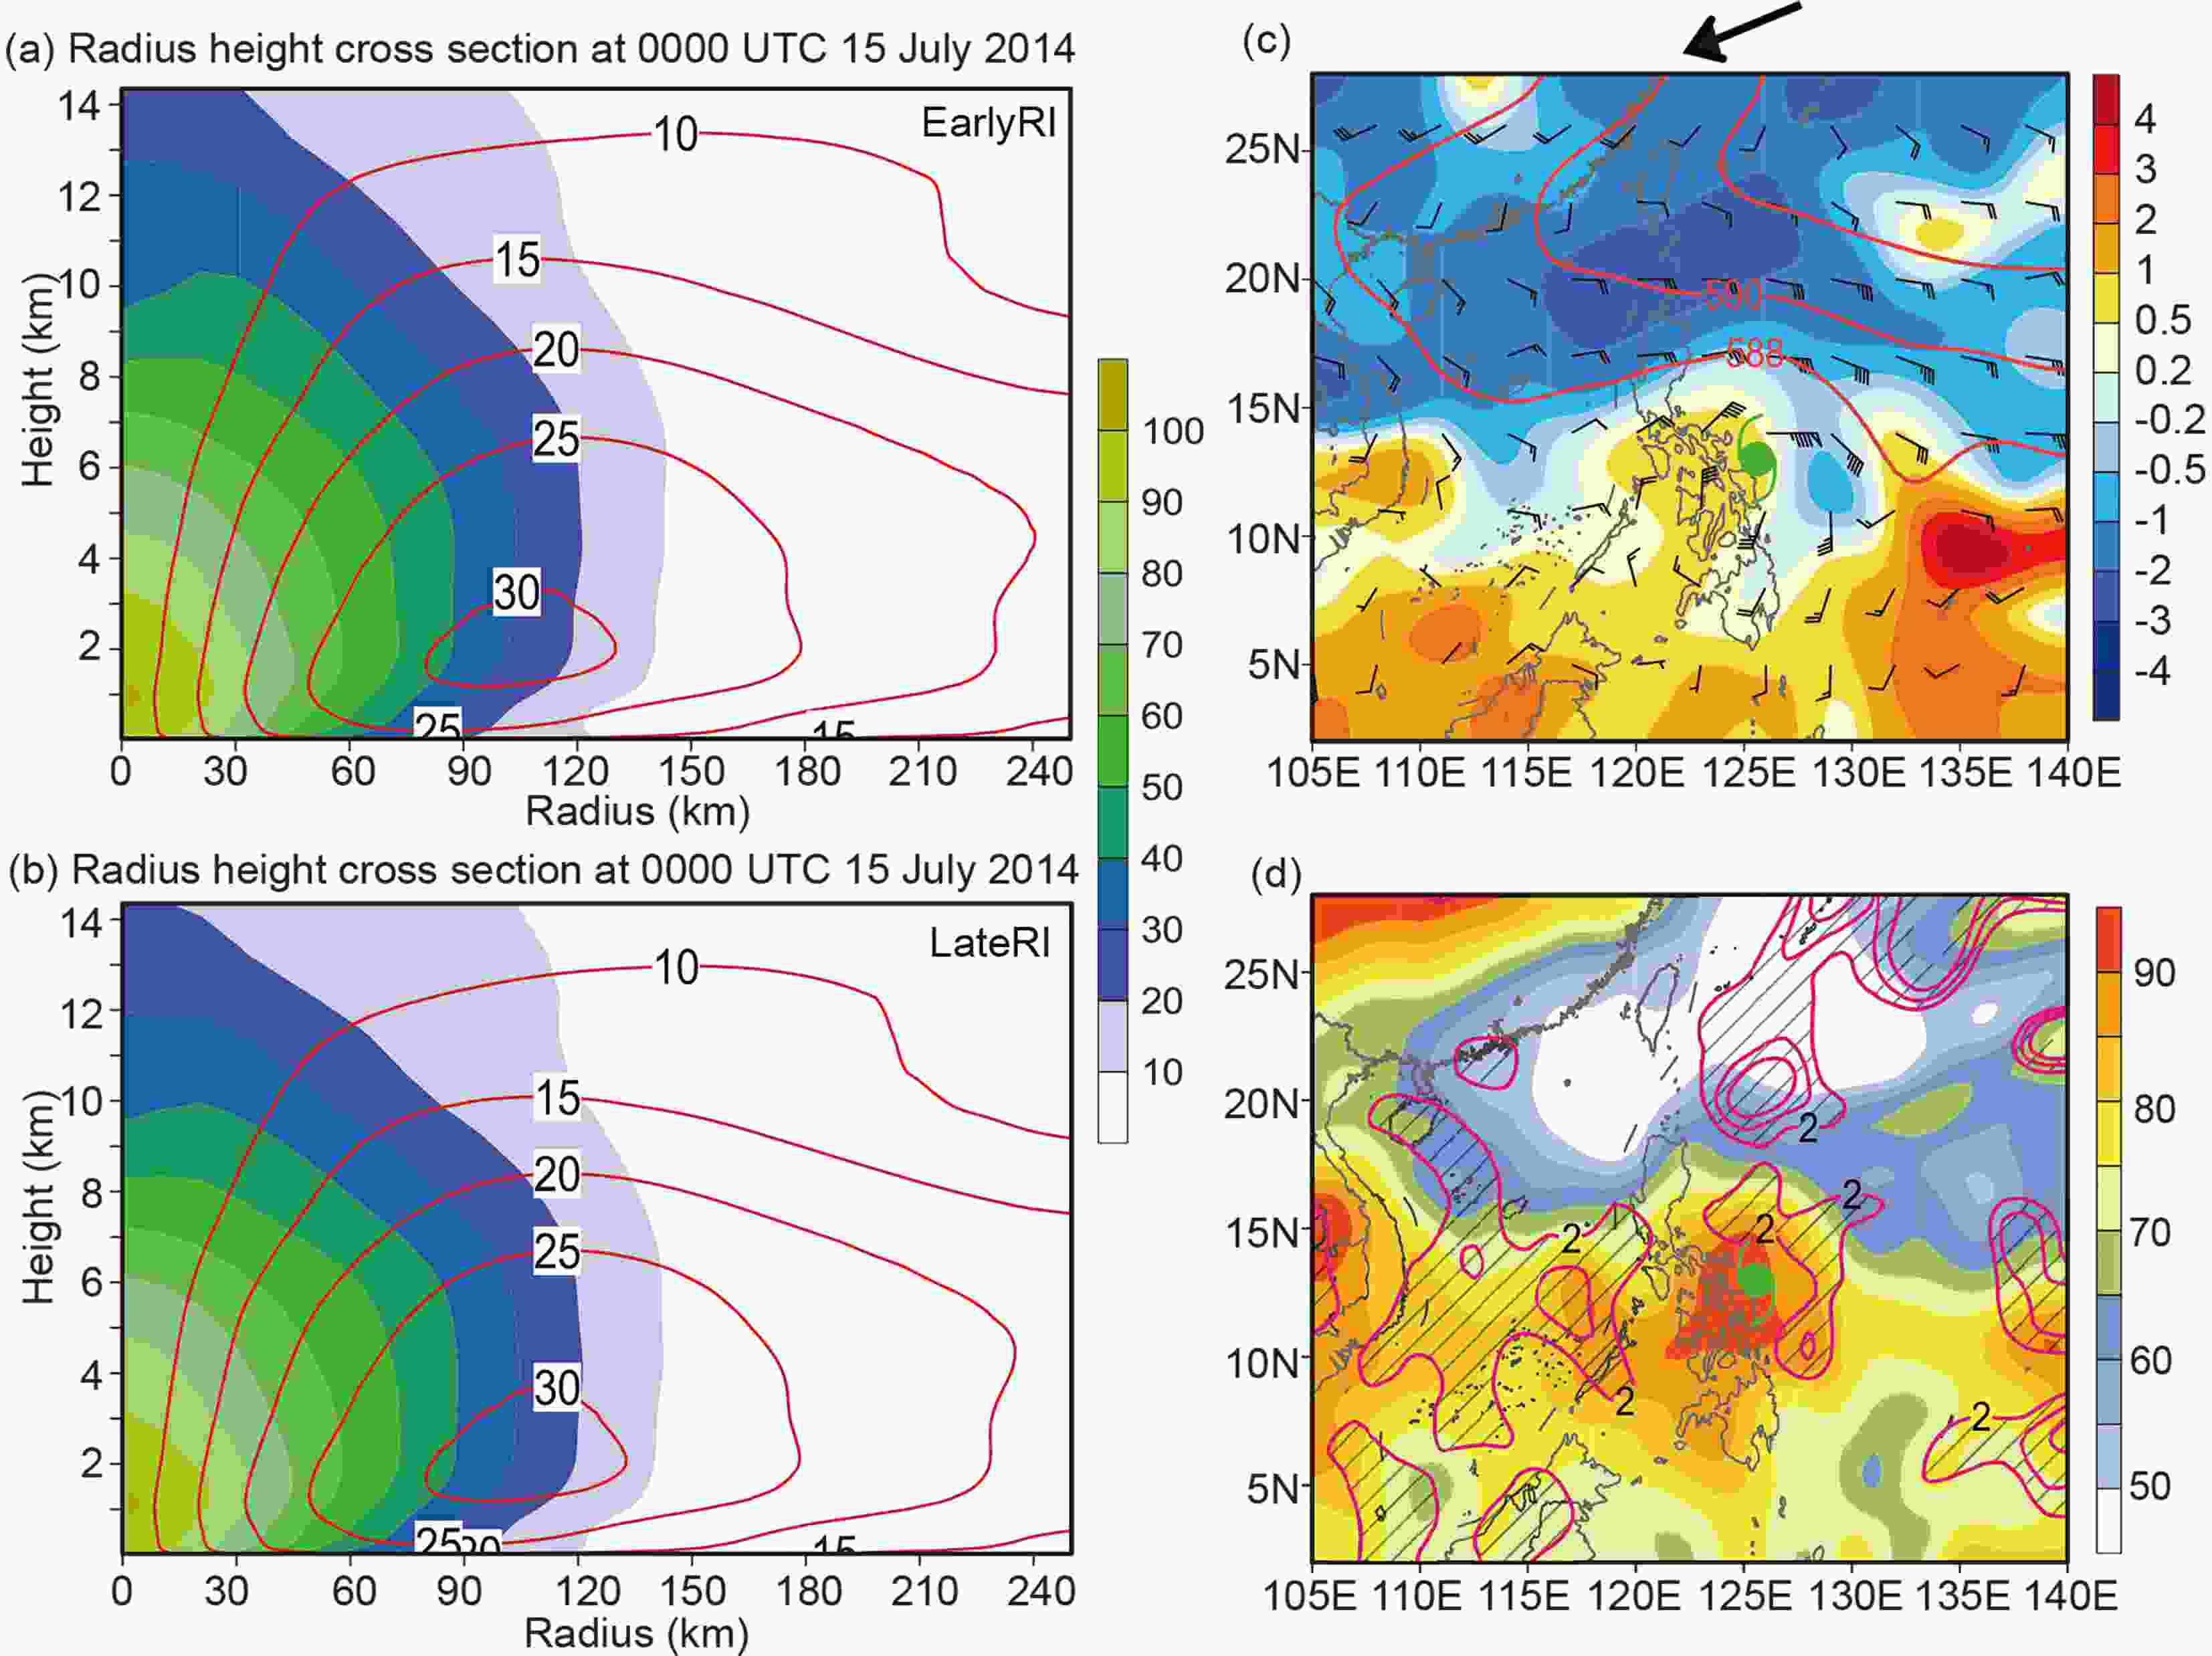 Figure3. A comparison of model initializations from the NCEP GEFS for azimuthal-mean, radial-height cross sections of vorticity and tangential wind component for (a) EarlyRI and (b) LateRI. (c) 500-hPa wind barbs from EarlyRI with zonal wind component differences shaded (m s?1, blue shading indicates weaker winds in EarlyRI) and the geopotential height field (red contours, intervals of 2 decameters starting at 588 decameters) at 0000 UTC on 15 Jul 2014. Black arrow in Fig. 3 and hereafter denotes the direction of environmental vertical wind shear. (d) Relative humidity integrated from 850 hPa to 500 hPa (shaded, %) for EarlyRI, with differences between EarlyRI and LateRI (positive contours and magenta hatching indicate EarlyRI is moister, with a contour interval of 8% starting at 2%).
Simulations were initialized at 0000 UTC 15 July 2014 and integrated for 96 h to 0000 UTC 19 July, which corresponds with the time from when Rammasun was passing through the Philippines as a strong tropical storm, until the time after Rammasun made landfall over Hainan Island.
The model domain was two-way interactive and triply nested. The three meshes had 381 × 351, 321 × 321 and 451 × 451 grid points, and horizontal grid spacings of 18, 6 and 2 km, respectively. The resolutions of the terrain height and land-use data for the three meshes were 5 min, 2 min, and 30 s (about 9, 4, and 1 km), respectively. There were 43 uneven σ levels in the vertical using terrain-following, hydrostatic pressure as the vertical coordinate extending from the surface to the model top at 50 hPa. The two nested inner meshes automatically moved following the TC during the model integration so that the model TC was always located near the mesh center, while the outermost 18-km mesh was fixed.
The other model physics included: (1) the WRF single-moment 6-class cloud microphysics scheme (Hong and Lim, 2006) for grid-scale moist processes; (2) the Mellor?Yamada?Nakanishi?Niino level-2.5 turbulence closure scheme (Nakanishi and Niino, 2004) for sub-grid-scale vertical mixing coupled with Monin?Obukhov similarity theory for surface flux calculations over the ocean where the roughness length for momentum was modified for TC strength winds (Moon et al., 2007); (3) the Rapid Radiative Transfer Model (Mlawer et al., 1997) for longwave radiation calculations and the Dudhia scheme (Dudhia, 1989) for shortwave radiation calculations; and (4) the Noah land-surface scheme (Ek et al., 2003) for land-surface processes. Convection was assumed to be explicitly resolved in the two nested inner meshes, while the Kain?Fritsch cumulus convection scheme (Kain, 2004) was used for the outermost domain.
The track and intensity of the ensemble members are compared with those from CMA best-track data in Figs. 2b and c. The ensemble runs generally captures the storm’s northwestward movement after it made landfall over Luzon Island, though most members show a slightly slower motion than that of the best track. The ensemble mean forecasts the storm to make landfall over Hainan about six hours later than observed and is rather skillful. The intensity forecasts generally reproduce the evolution of Rammasun as it rapidly deepened and then weakened after making landfall over Hainan (Figs. 2b and c). However, the timing of the intensification differs markedly among members, with some forecasts showing strong deepening slightly earlier than observed, while others indicating deepening as taking place much later. The forecast periods of RI differ by up to about 24 hours.
To avoid noise in the pressure field associated with vigorous convection in the eyewall, the storm center for each ensemble member was defined following Braun et al. (2006). The location of the minimum pressure was used as an approximate geometric center—a first guess for the center. The location of the center was found when the azimuthal variance of the pressure field at all radii between the center and the outer portion of the eyewall (100 km) was minimized. As in previous studies (e.g., Wu et al., 2006; Kanada and Wada, 2015; Nguyen et al., 2015), the vortex center and tilt were determined using the pressure centroids at each vertical level.
All members undergo RI with central pressure falls of about 42 hPa and wind increases of 15.4 m s?1 within a 24-h period, as reflected in ensemble mean central pressure decreases and wind increases, despite some members reaching peak intensity much later than observed. These intensity forecasts exhibit large variability as members have different timings of RI; for instance, member 17 (EarlyRI) has a relatively early onset of RI, while member 12 (LateRI) has the latest onset of RI with a delay of up to 24 hours. EarlyRI has a period of RI starting at 0400 UTC 17 July, while LateRI commences at 0400 UTC 18 July. Such large variability motivated us to investigate what factors control the onset of RI, and what factors might delay the onset even further.
There are numerous factors that may influence the simulations of RI, one of which is the structure and intensity of the initialized vortex. Figures 3a and b show azimuthal-mean, radial-height cross sections of vorticity from EarlyRI and LateRI from the initial conditions. There are only slight differences in initial vortex structure, compared to other features. This does not rule out the importance of the initial structure, but does suggest that other aspects of the forecasts may be playing a more influential role for this case.
2
4.1. Environmental conditions
The onset of RI in a TC often occurs within favorable environmental conditions, as in the aforementioned studies, including warm underlying oceanic conditions monitored by high SST and OHC (e.g., Duan et al., 2013), weak to moderate VWS (e.g. Wang et al., 2015; Chen et al., 2015), and high low-to-mid-tropospheric relative humidity (e.g., Nguyen et al., 2015).An intensifying TC obtains considerable energy from the underlying ocean. High OHC serves as the energy source for RI and also limits the negative effect induced by ocean upwelling resulting from the intensifying cyclonic wind stress curl and the turbulent vertical mixing effect (e.g., Duan et al., 2013). Rammasun entered the warm SCS, and was characterized along its track with high OHC of over 100 kJ cm?2 (Fig. 2a). Therefore, the oceanic conditions were favorable for RI. Although, this does not guarantee RI, since we also require favorable atmospheric environmental conditions. Indeed, even with the same oceanic conditions, several ensemble members forecast a much-delayed RI. This reconfirms that favorable oceanic conditions are a necessary but not sufficient condition for RI (Kaplan et al., 2010).
Besides the oceanic conditions, the other main environmental influence on intensity change is thought to be VWS (e.g., Kaplan et al., 2010). The long-term, widely accepted and current prevailing view is that large VWS affects TC intensity by (1) tilting the vortex and preventing vertical alignment, and (2) promoting ventilation, which usually is associated with the intrusion of environmental, low-θe air into the TC’s inner core, inhibiting convective development and causing an erosion of the mid-to-upper-level warm core (e.g., Simpson and Riehl, 1958; Frank and Ritchie, 2001; Tang and Emanuel, 2010).
To illustrate the possible ventilation effects for Rammasun, Fig. 3 shows the initialized state of the storm and the differences in 500-hPa zonal wind (Fig. 3c), and low-to-mid-level specific humidity (Fig. 3d), between EarlyRI and LateRI. Before making landfall on Luzon Island and entering the SCS, Rammasun was located equatorward of the western Pacific subtropical high. Mid-tropospheric zonal wind differences highlight the ventilation difference to the north of the storm: weak-member LateRI has stronger mid-tropospheric easterlies to the north and east of the storm, which is on the upshear side. In contrast, EarlyRI has weaker subtropical easterlies and stronger mid-tropospheric westerlies to the south and west of the storm, which is on the downshear side. In addition, similar to Rios-Berrios et al. (2016), precipitable water (PW) differences around the storm show that the stronger-member EarlyRI initially had slightly more low-to-mid tropospheric moisture. This result suggests that, compared with EarlyRI, the storm circulation in LateRI is surrounded by relatively drier midlevel environmental air on the northern, upshear flank.
To further elucidate the VWS that affected the simulated storm intensity changes, the evolution of the large-scale mean flow in the vicinity of Rammasun from EarlyRI and LateRI is illustrated in Fig. 4 and shows time series of the vertical profile of area-mean winds, with the vortex removed (Kaplan et al., 2010), averaged within a 500-km radius centered on the storm (Figs. 4a and b), and time series of 200?850-hPa and 500?850-hPa VWS magnitudes for the individual ensemble members (Figs. 4c and d). EarlyRI has relatively weak easterlies and southwesterlies in the upper and lower troposphere, respectively, and eventually weak VWS over both the 200?850-hPa and 500?850-hPa layers. The shears in LateRI and EarlyRI are quite similar before the RI stage, but decrease rapidly in EarlyRI during the early RI stage to eventually become less than in LateRI (Figs. 4c and d). We suggest later in the text that these evolving changes in VWS are important for the tilt of the vortex, and the associated convective asymmetries.
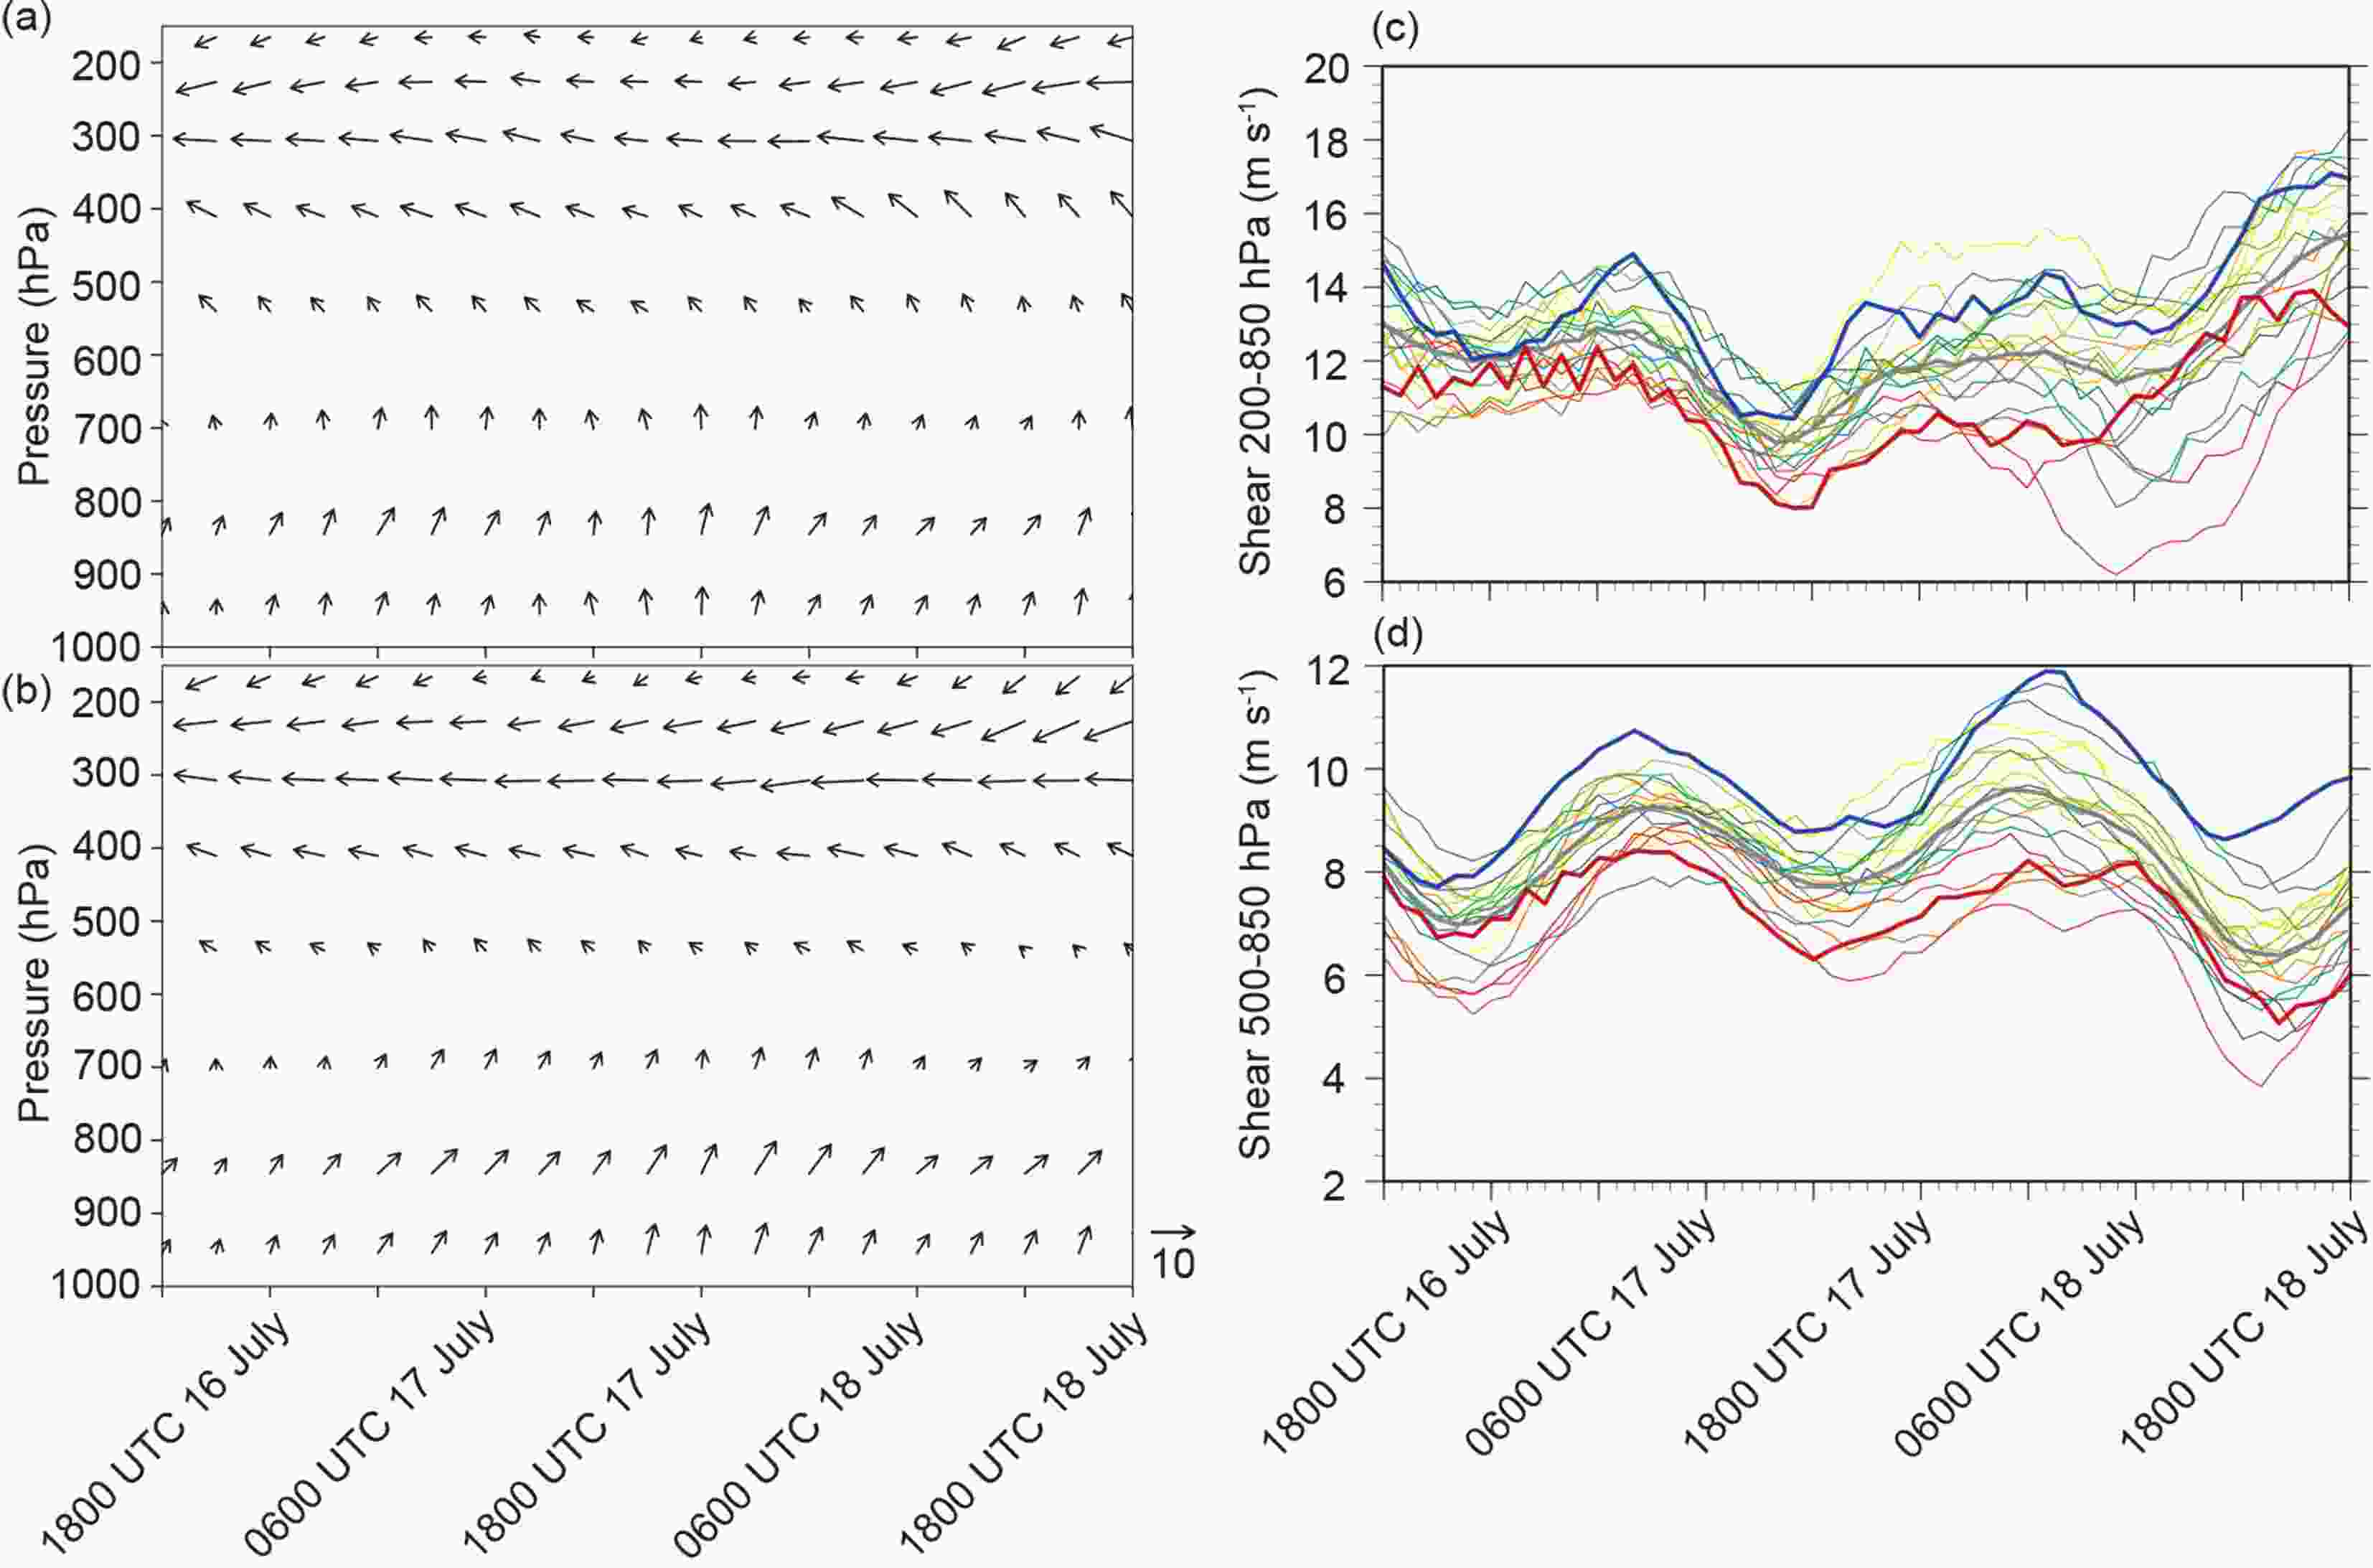 Figure4. Time series of area-averaged horizontal winds over a circle of 500-km radius centered on the Rammasun circulation from (a) EarlyRI and (b) LateRI. (c) 200?850-hPa and (d) 500?850-hPa environmental vertical wind shear magnitude (m s?1) for the individual ensemble members, and the ensemble mean of individual members (grey). Red and blue lines depict the EarlyRI and LateRI.
The environmental winds switch from southwesterly to northeasterly with height, indicating low shear below 7 km, and suggest that embedded circulations could stay upright over low- to midlevels. But how were these differences between EarlyRI and LateRI influencing the behavior of the simulated Rammasun circulations? Understanding this appears central to distinguishing the controls on RI in EarlyRI and LateRI, and then possibly in the real atmosphere.
2
4.2. Evolution of convective asymmetries and cloud bands in the observations and in EarlyRI and LateRI
We now compare the simulated and satellite-observed infrared cloud-top brightness temperatures (TBBs) during the RI period as a way of verifying the simulated storm structure and development. First, however, we again draw attention to the changes in observed rain bands during RI, shown in Fig. 1. Note the convective asymmetry to the southwest of the storm center and the inward-spiraling inner cloud band (ICB), which originates over the southwest sector and eventually forms the eyewall cloud. This is highlighted in the diagrams by the arrows and indicates a development of bands that resembles what Houze (2010) called a secondary cloud band. We later describe why we think this ICB is so important and provide reasons why it forms in EarlyRI but is delayed in LateRI. The modeled TBB was calculated by interpolating the temperature to the level of unit optical depth into the cloud. The satellite TBB is from the high-resolution (5 km) Multifunctional Transport Satellite (MTSAT) infrared image. Figure 5 shows the observed and simulated storm convective structures (from EarlyRI and LateRI) at the five given times. Convective asymmetries are evident in the satellite observations and simulated satellite imagery, with more extensive, more active convection located to the southwest of the storm center. From this convective asymmetry, clouds wrap inwards around the circulation in the observations (Figs. 1c-e and Figs. 5a-d) and in EarlyRI (Figs. 5f-j) in the simulation. But what is the origin of the band and what role does it play in the intensification? In LateRI the eyewall convective organization does not occur during this period, even though an active convective asymmetry is visible to the southwest of the circulation. The intensification in LateRI does eventually commence, but much later. The inward-spiraling convective band at small radii eventually forms the eyewall cloud in the observations and in EarlyRI. A re-intensification process of Rammasun, after it passed over the Philippines (Fig. 1), is indicated by an increase in inner-core size, as inferred from the widening of well-defined eyewall convection, and the axisymmetrization of inner-core convection in EarlyRI. This corresponds quite well with the actual imagery at the corresponding time (1200 UTC 17 July), and which is similar to that of Typhoon Megi (2010) discussed by Wang and Wang (2014). The ICB wraps in towards the center of the circulation to eventually form the eyewall cloud, which is similar to the structures illustrated in Houze (2010). On the other hand, over a small radius, LateRI has a relatively less symmetric structure compared to that observed and from EarlyRI. The eyewall cloud in LateRI does not develop on the time scales indicated in the actual imagery, but does develop some 24 hours later. In the following sections we link the observed and forecast structural changes to the impact of environmental shear, moisture and ventilation on the circulations.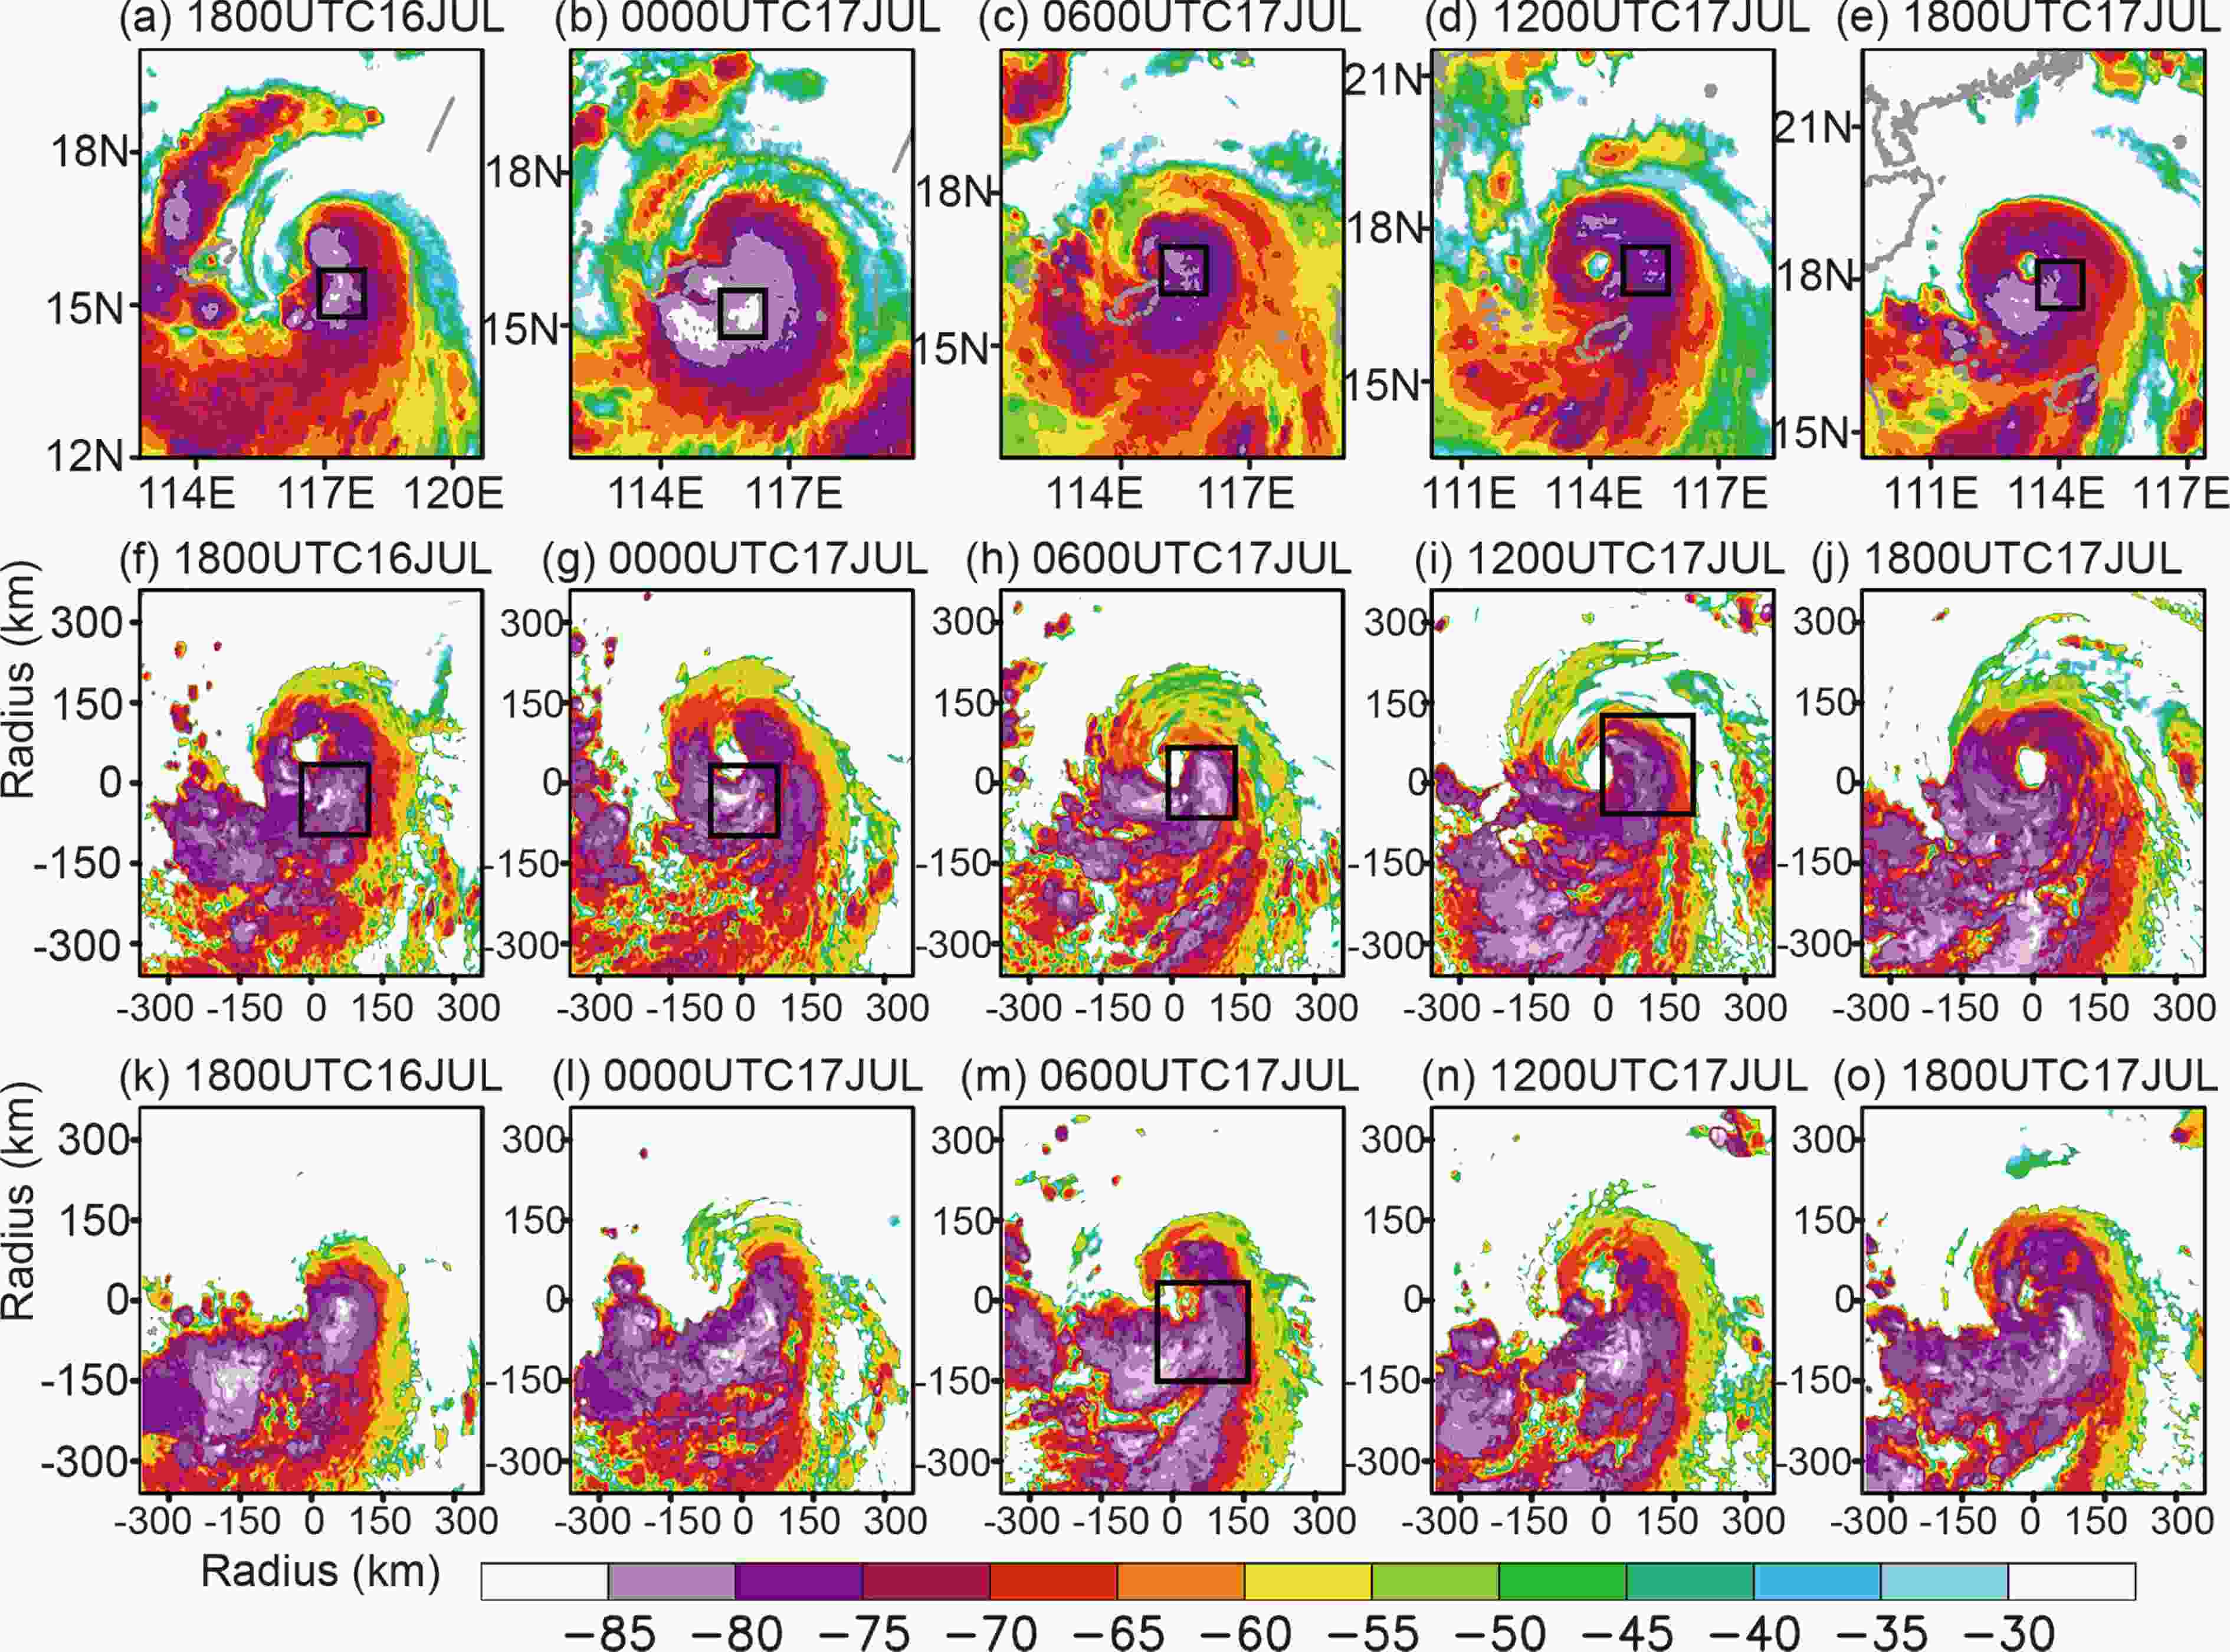 Figure5. MTSAT satellite infrared (5-km resolution) TBB (°C) images (a?e), and the simulated TBB from EarlyRI (f?j) and LateRI (k?o), at times indicated at the top of the panels. Black rectangles indicate the developing inner cloud band that wraps inwards to form the eyewall cloud.
2
4.3. Impact of environmental moisture and ventilation on thermodynamic storm structure in EarlyRI and LateRI
To further compare the conditions that might support or inhibit convection in EarlyRI and LateRI, we now describe the thermodynamic characteristics in the two members.Figure 6 shows time?radius distributions of the symmetric components of surface-based CAPE, layer-mean diabatic heating rates, and the RMWs from low to upper levels. In EarlyRI, the inward contraction of the RMW and the vertical synchronization of the circulation (or phase-locking of the RMWs) is implied from the decreasing radii and closer approach of the black and gray curves in Fig. 6. The onset of large values of diabatic heating in EarlyRI corresponds with lower values of CAPE (white hatching and shading), suggesting that in this case, (1) convection is exhausting the CAPE and stabilizing its environment, or (2) the circulation is intensifying as the diabatically driven secondary circulation is spinning up the system. This is balanced by an increasing warm core, which decreases the CAPE. LateRI has larger CAPE, initially weaker diabatic heating, and less synchronization of the low- and midlevel circulations (large separation of the black and gray curves). Again, the onset of enhanced diabatic heating about 2200 UTC 17 July corresponds with a reduction in CAPE. The circulation remained more tilted and asymmetric (section 4.3) over time. In the following we provide evidence that downdrafts over the downshear sector induced by the presence of dry-air intrusion limited the convection in LateRI, as suggested in other studies (e.g., Tang and Emanuel, 2012; Molinari et al., 2013; Kanada and Wada, 2015).
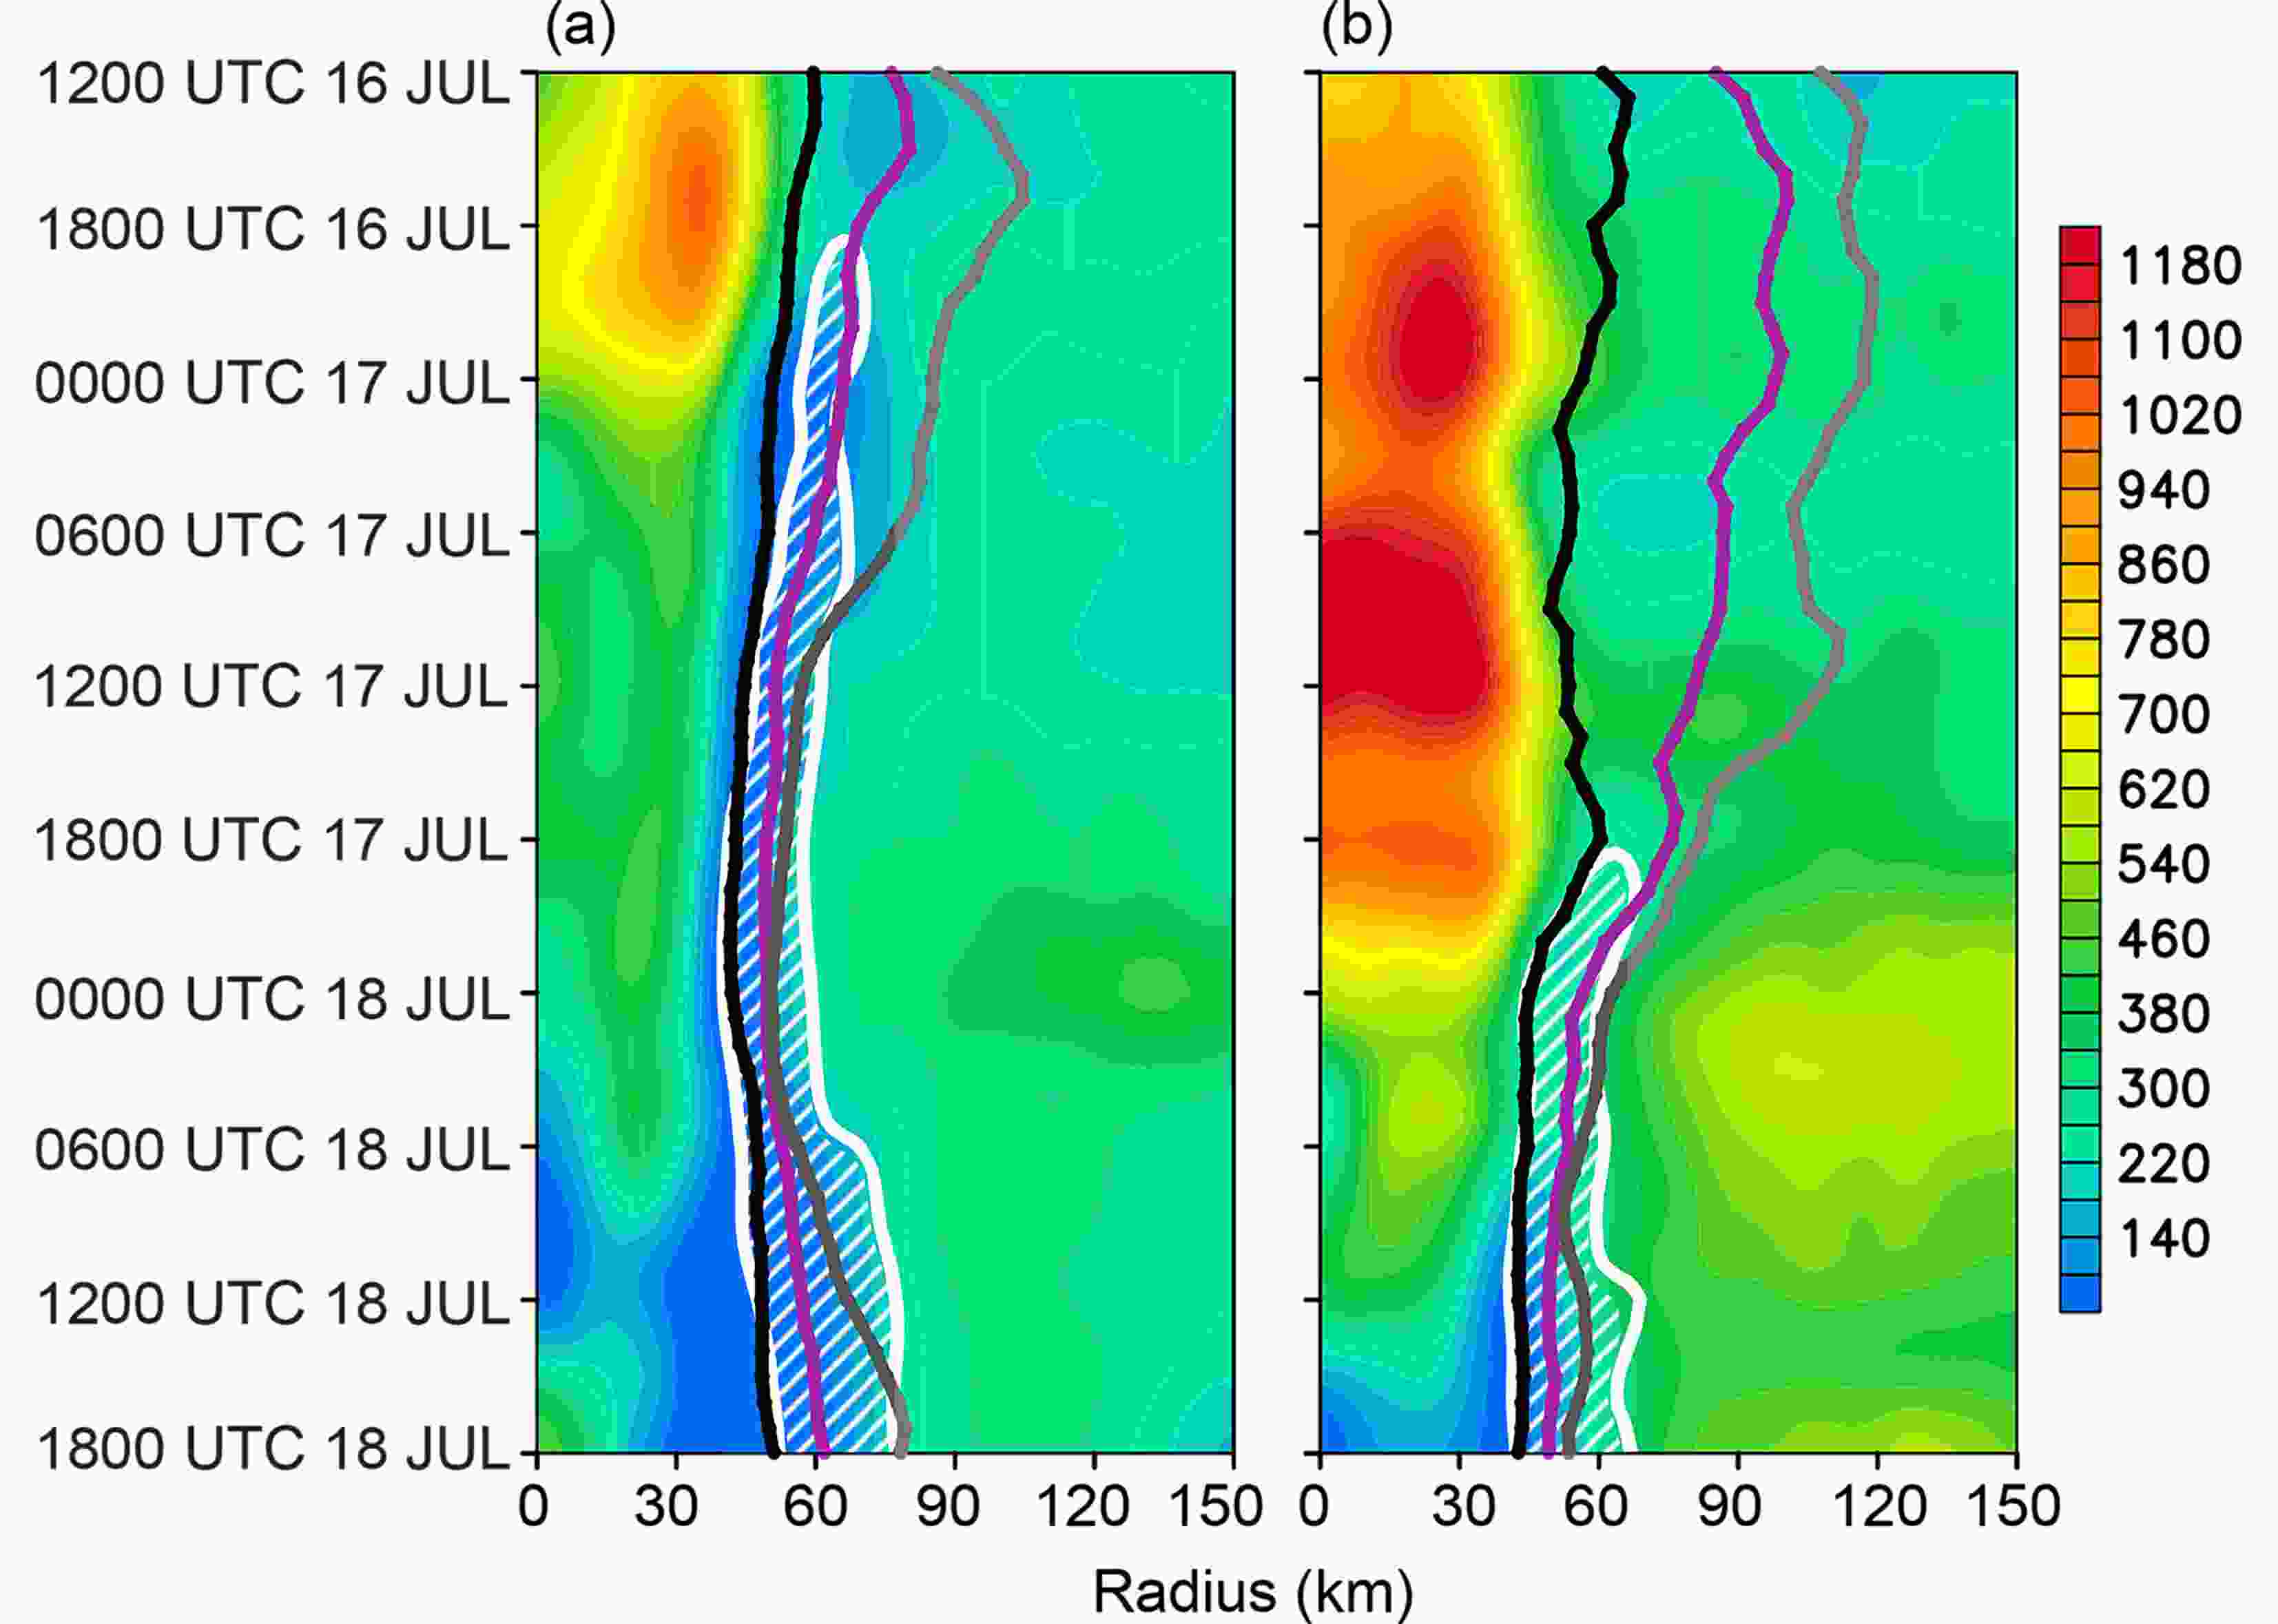 Figure6. Time?radius distribution of the symmetric components of the surface-based CAPE (shading, J kg?1) and 4-km to 12-km diabatic heating rate exceeding 20 K h?1 (white contours and hatching): (a) EarlyRI; (b) LateRI. Black, purple and gray lines depict the 2-km, 5-km and 8-km radius of maximum wind, respectively.
Azimuthal distributions of surface-based CAPE, overlaying 5?8-km-layer relative humidity, and low-level upward motion, are shown in Fig. 7. The upward motions utilizing upstream CAPE are located mainly in the downshear or downshear-left sectors of the storm, on the southern side, as indicated in Fig. 7. We note that CAPE in EarlyRI is smaller than in LateRI. It seems that CAPE is being consumed more rapidly in EarlyRI, while in LateRI inhibition to active convection is preserving the high values. Relatively drier air (black contours and hatching) exists over the north and northwest sectors in LateRI, while moister air (no black contours) is evident through middle levels in EarlyRI. This is consistent with the environments in LateRI (and the lack of convection) and EarlyRI (and the presence of active convection). The upshear flank (northern region) is a source region for air entering the convective asymmetry to the southwest of the storm center over the downshear quadrant as the storm moves through the SCS, while LateRI has other dry air entering the convective asymmetry from the left-shear to right-shear quadrants during the period 0300 UTC 17 July to 1200 UTC 17 July. In the following we show that, in LateRI, a significant inhibitor of convective development over this region is the intrusion of this dry air. Downdrafts with low-θe air enter the boundary layer, and this air is then transported into the eyewall, which plays a major role in limiting the intensification in LateRI. The dry air intrusion in LateRI is associated with ventilation and with stronger environmental wind shear.
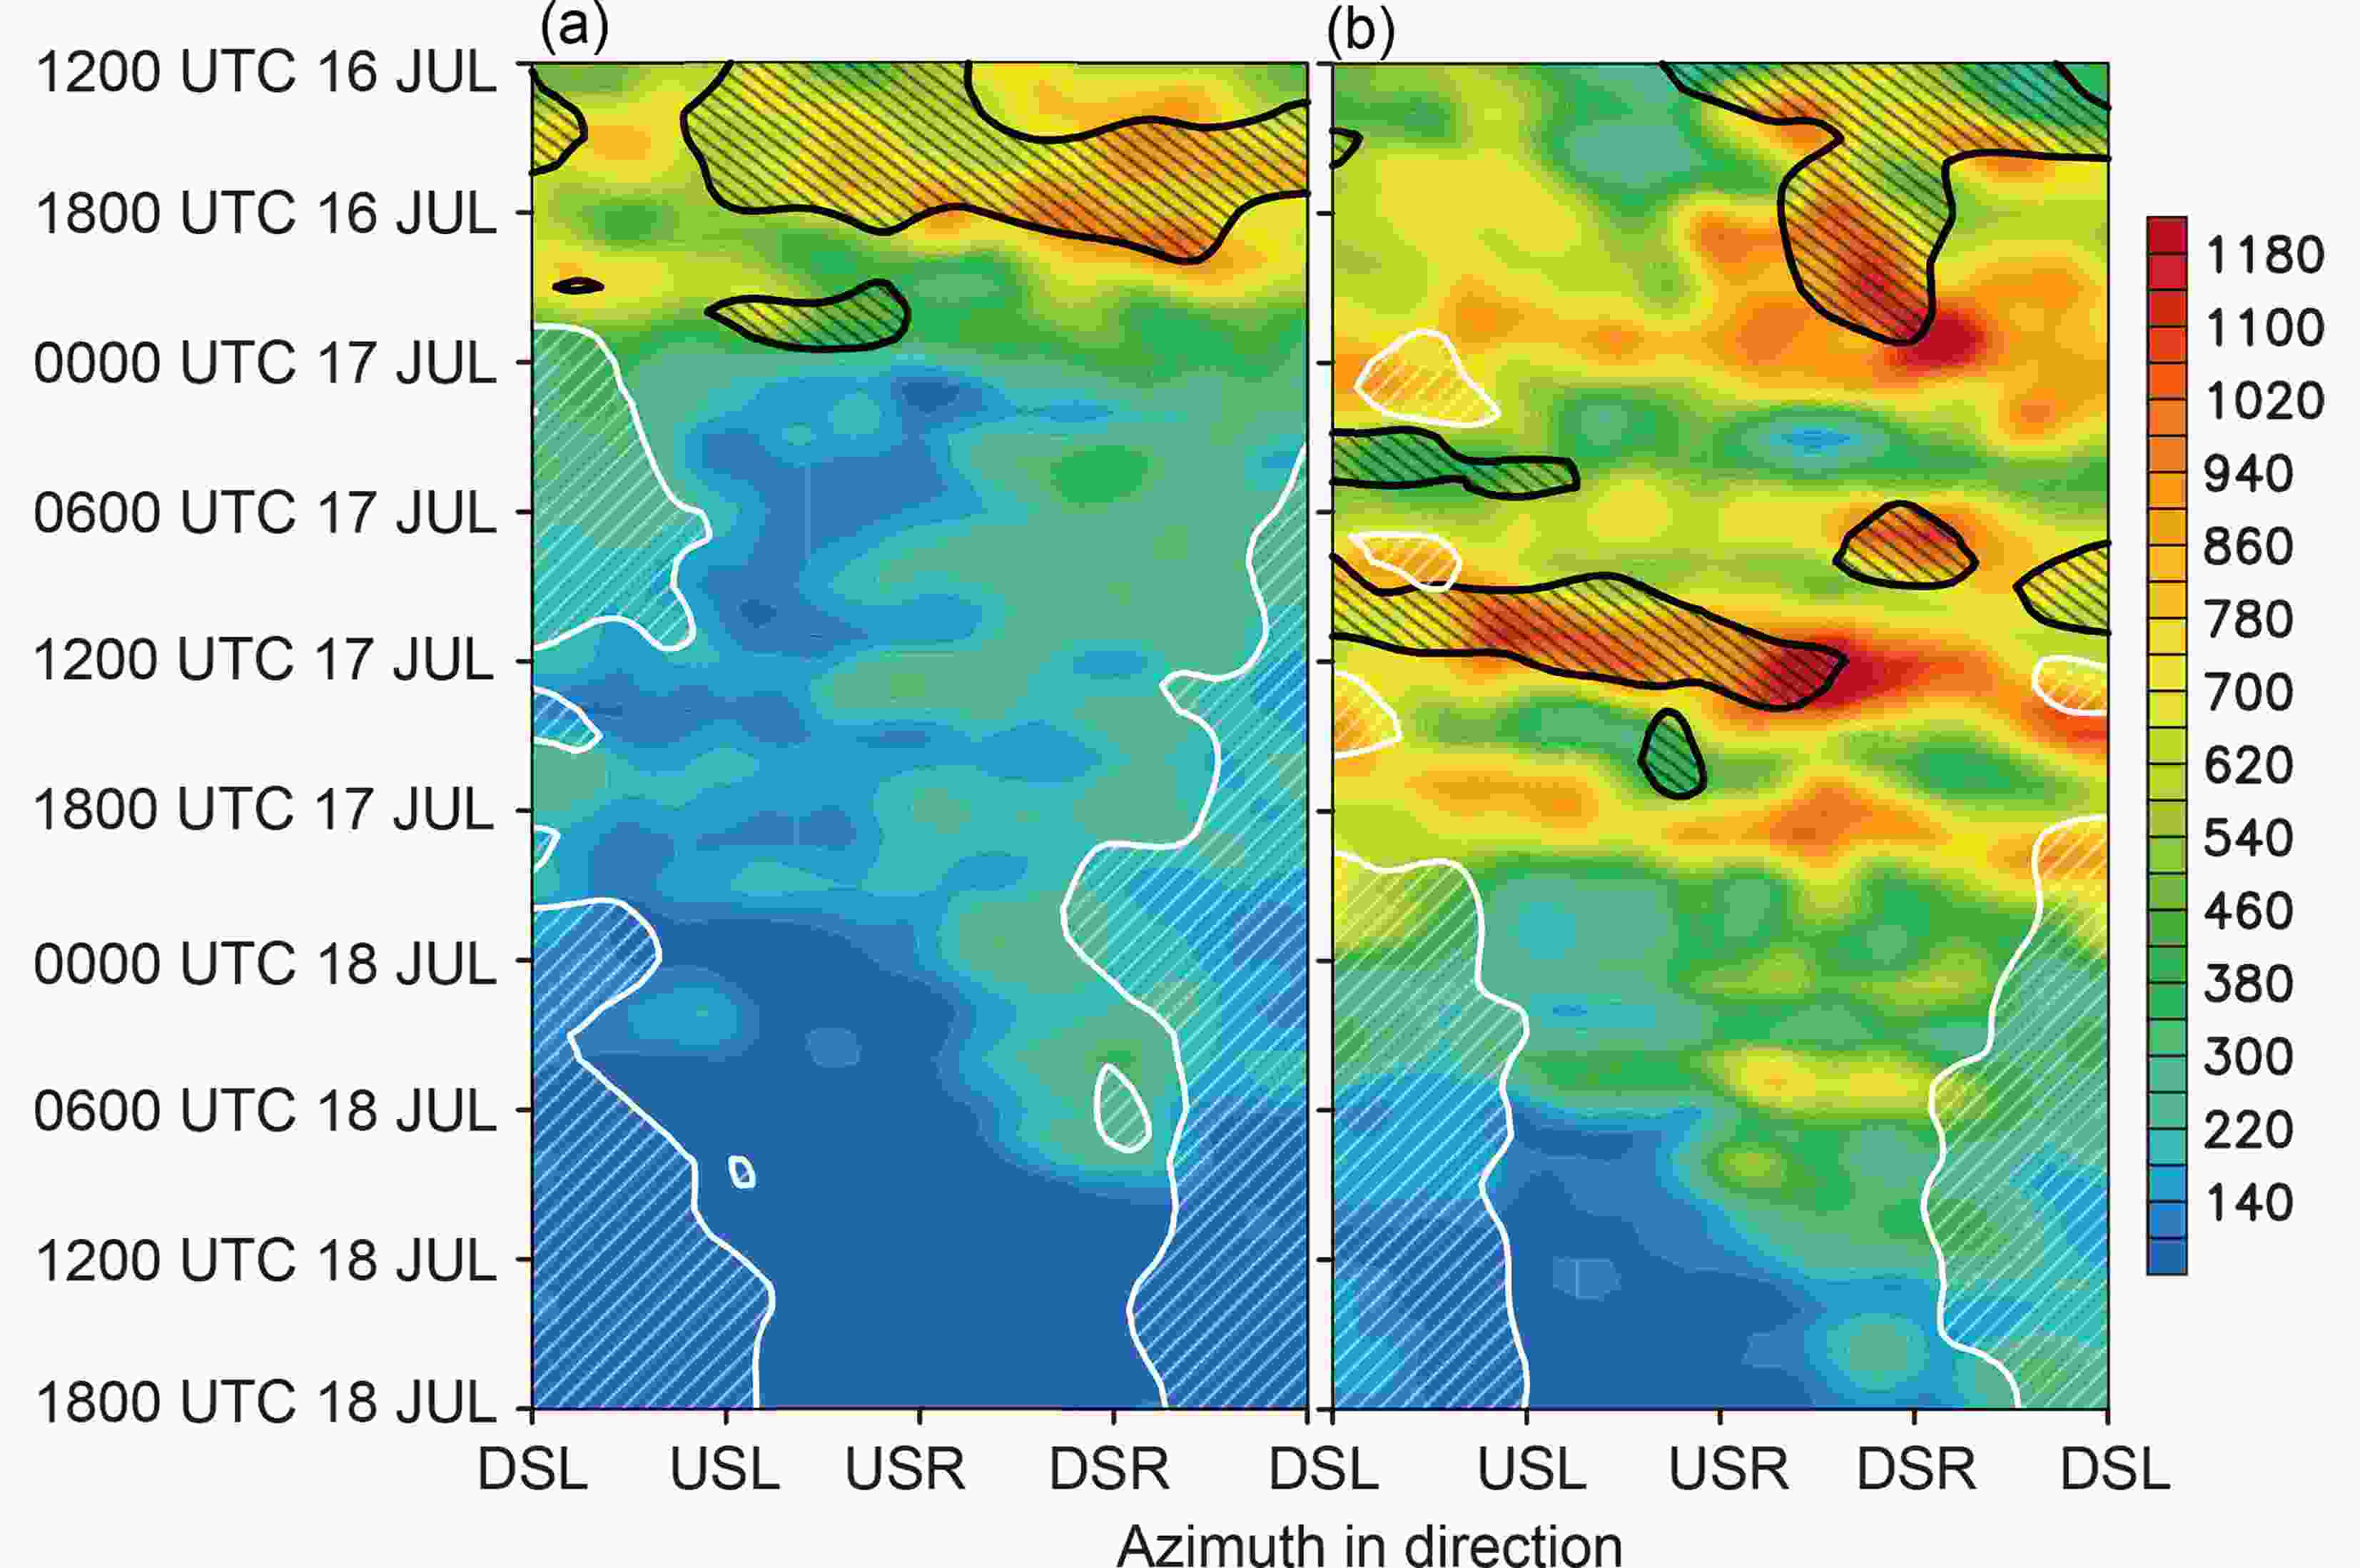 Figure7. Time?shear-oriented direction (Hovm?ller) diagrams of surface-based CAPE (shaded, J kg?1), 3-km updrafts (white contours and hatching starting at 1.0 m s?1), and relative humidity over the 5?8-km layer (black hatching less than 50%) over a radius from 30 km to 60 km for (a) EarlyRI and (b) LateRI. DSL, USL, USR and DSR are short for downshear-left, upshear-left, upshear-right and downshear-right, respectively.
The convective asymmetries appear to be an inherent feature of baroclinic vortices and are associated with a shear-induced tilted vortex, as discussed in previous studies (e.g., Jones, 1995; Wu et al., 2006; Nguyen et al., 2015). To illustrate the vertical structure of the baroclinic vortices associated with shear-induced vortex tilt we show the shear-relative, quadrant-averaged asymmetric potential temperature and its perturbation in Fig. 8. As a result, a balanced thermal asymmetry develops in response to the vortex tilt and the potential temperature is cooler downshear-left (downtilt) than upshear-right (uptilt) below the height of 7 km in both EarlyRI and LateRI. Noting that LateRI has a downshear-left cooler anomaly in the lower troposphere than EarlyRI, it appears possible that this may be the result of more evaporative cooling associated with more wavenumber-one convective downdrafts, as discussed by Nguyen et al. (2015). This aspect, which in these forecasts is related to lower environmental moisture and stronger ventilation in LateRI, is discussed in more detail in the following section. In addition, there are very modest differences in midlevel temperature anomalies in EarlyRI and LateRI. The warm temperature anomaly is much deeper in EarlyRI, extending to low levels, again consistent with (1) a more intense vortex, and (2) the possible role of cold downdrafts in the downshear-left quadrant in LateRI. The largest difference is the relatively cool air in the downshear-left quadrant in LateRI. This is a source region for air entering the eyewall cloud from the convective asymmetry and is a very likely factor in delaying the onset of RI in LateRI.
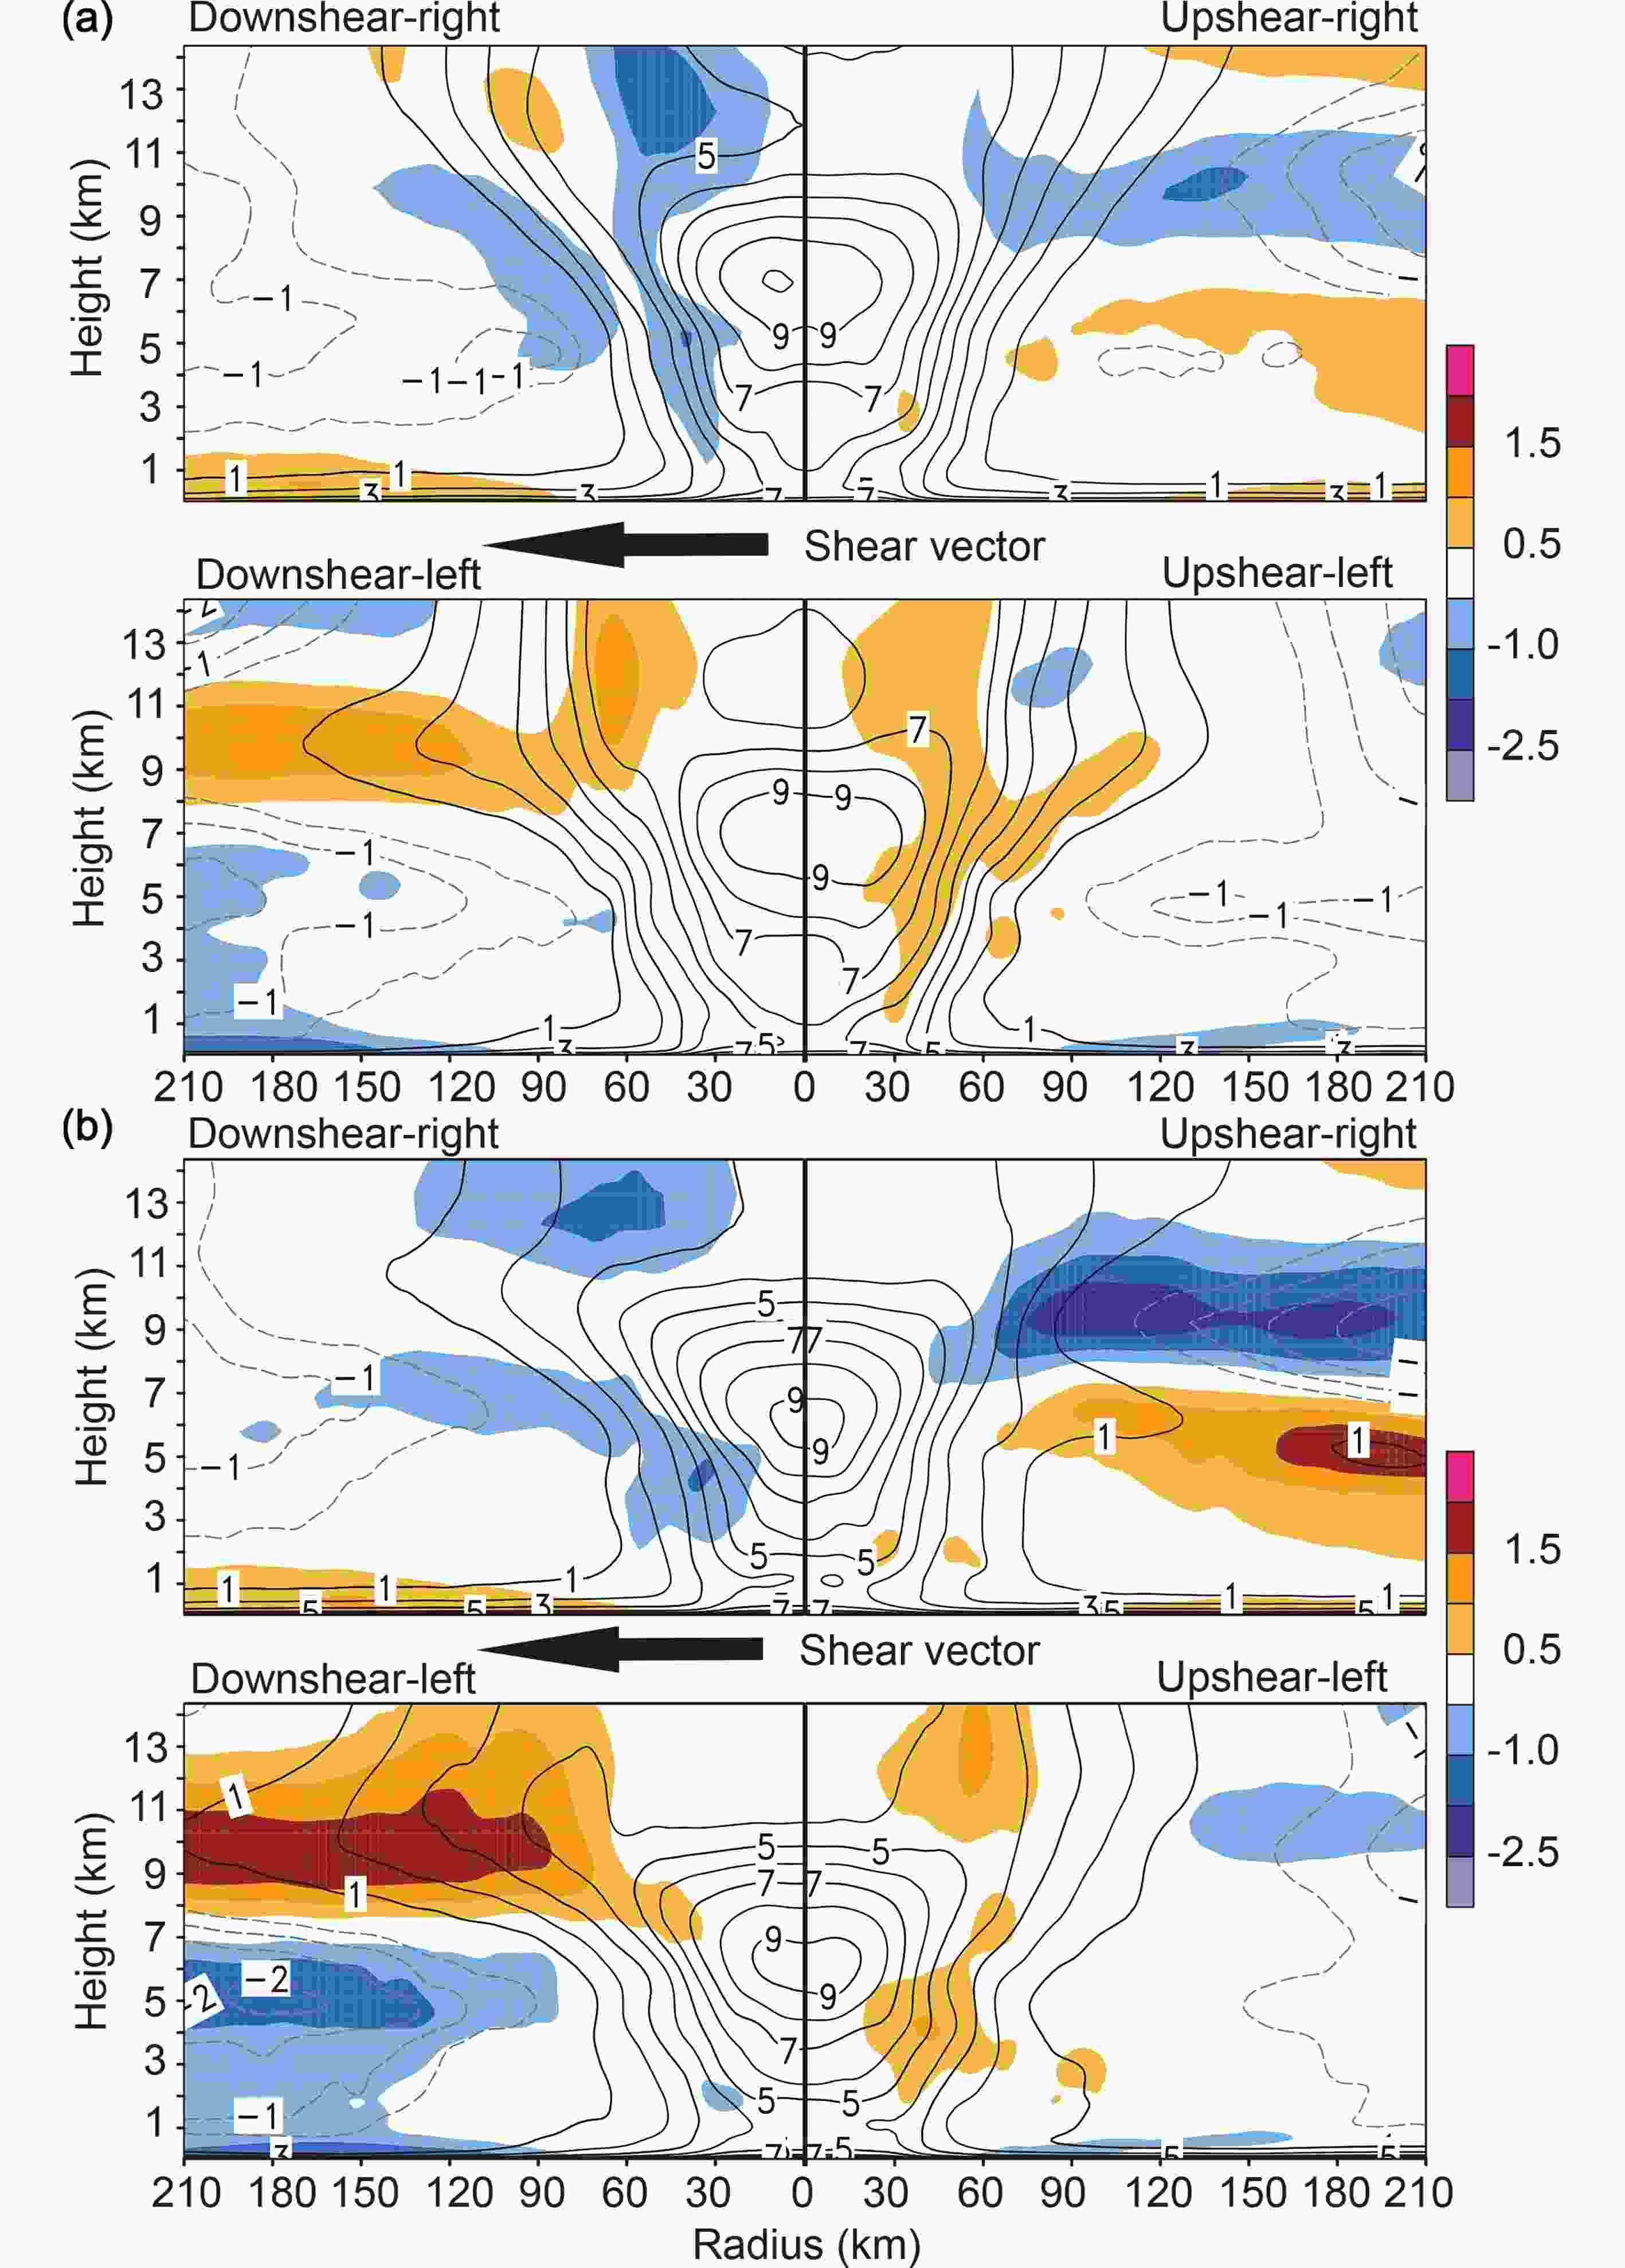 Figure8. Asymmetric potential temperature (deviation from the mean over a 500-km radius circle, black solid for positive values; contoured every 1.0 K starting at 1.0 K; gray-dashed for negative values; contoured every 0.5 K starting at ?0.5 K) and its perturbation (shaded) in each shear-relative quadrant, averaged from 2100 UTC 16 July to 0600 UTC 17 July for (a) EarlyRI and (b) LateRI.
Figure 9 shows the shear-relative quadrant-averaged θe, radial inflow and tangential wind components and downdrafts. Relatively higher mid-to-upper-level θe is evident in the downshear- and upshear-right quadrants in EarlyRI, compared with LateRI. This appears to be the result of the convective transport of high boundary layer θe upward through the free troposphere, as indicated in Nguyen et al. (2015). Dry midlevel air (see Fig. 7) intrudes to within a radius of 30?60 km in LateRI prior to the observed onset of RI, while high θe is evident out to at least 80 km in EarlyRI. This shows a moist, midlevel cyclonic vortex has formed, indicated by the stronger upper-tropospheric tangential wind and weaker dry-air entrainment into the ascent (Fig. 9) (e.g., Nguyen et al., 2015). Boundary layer inflow and a much broader moist vortex are evident in EarlyRI. In LateRI, drier low-level air intrudes to within 60 km of the center, consistent with the structure discussed above.
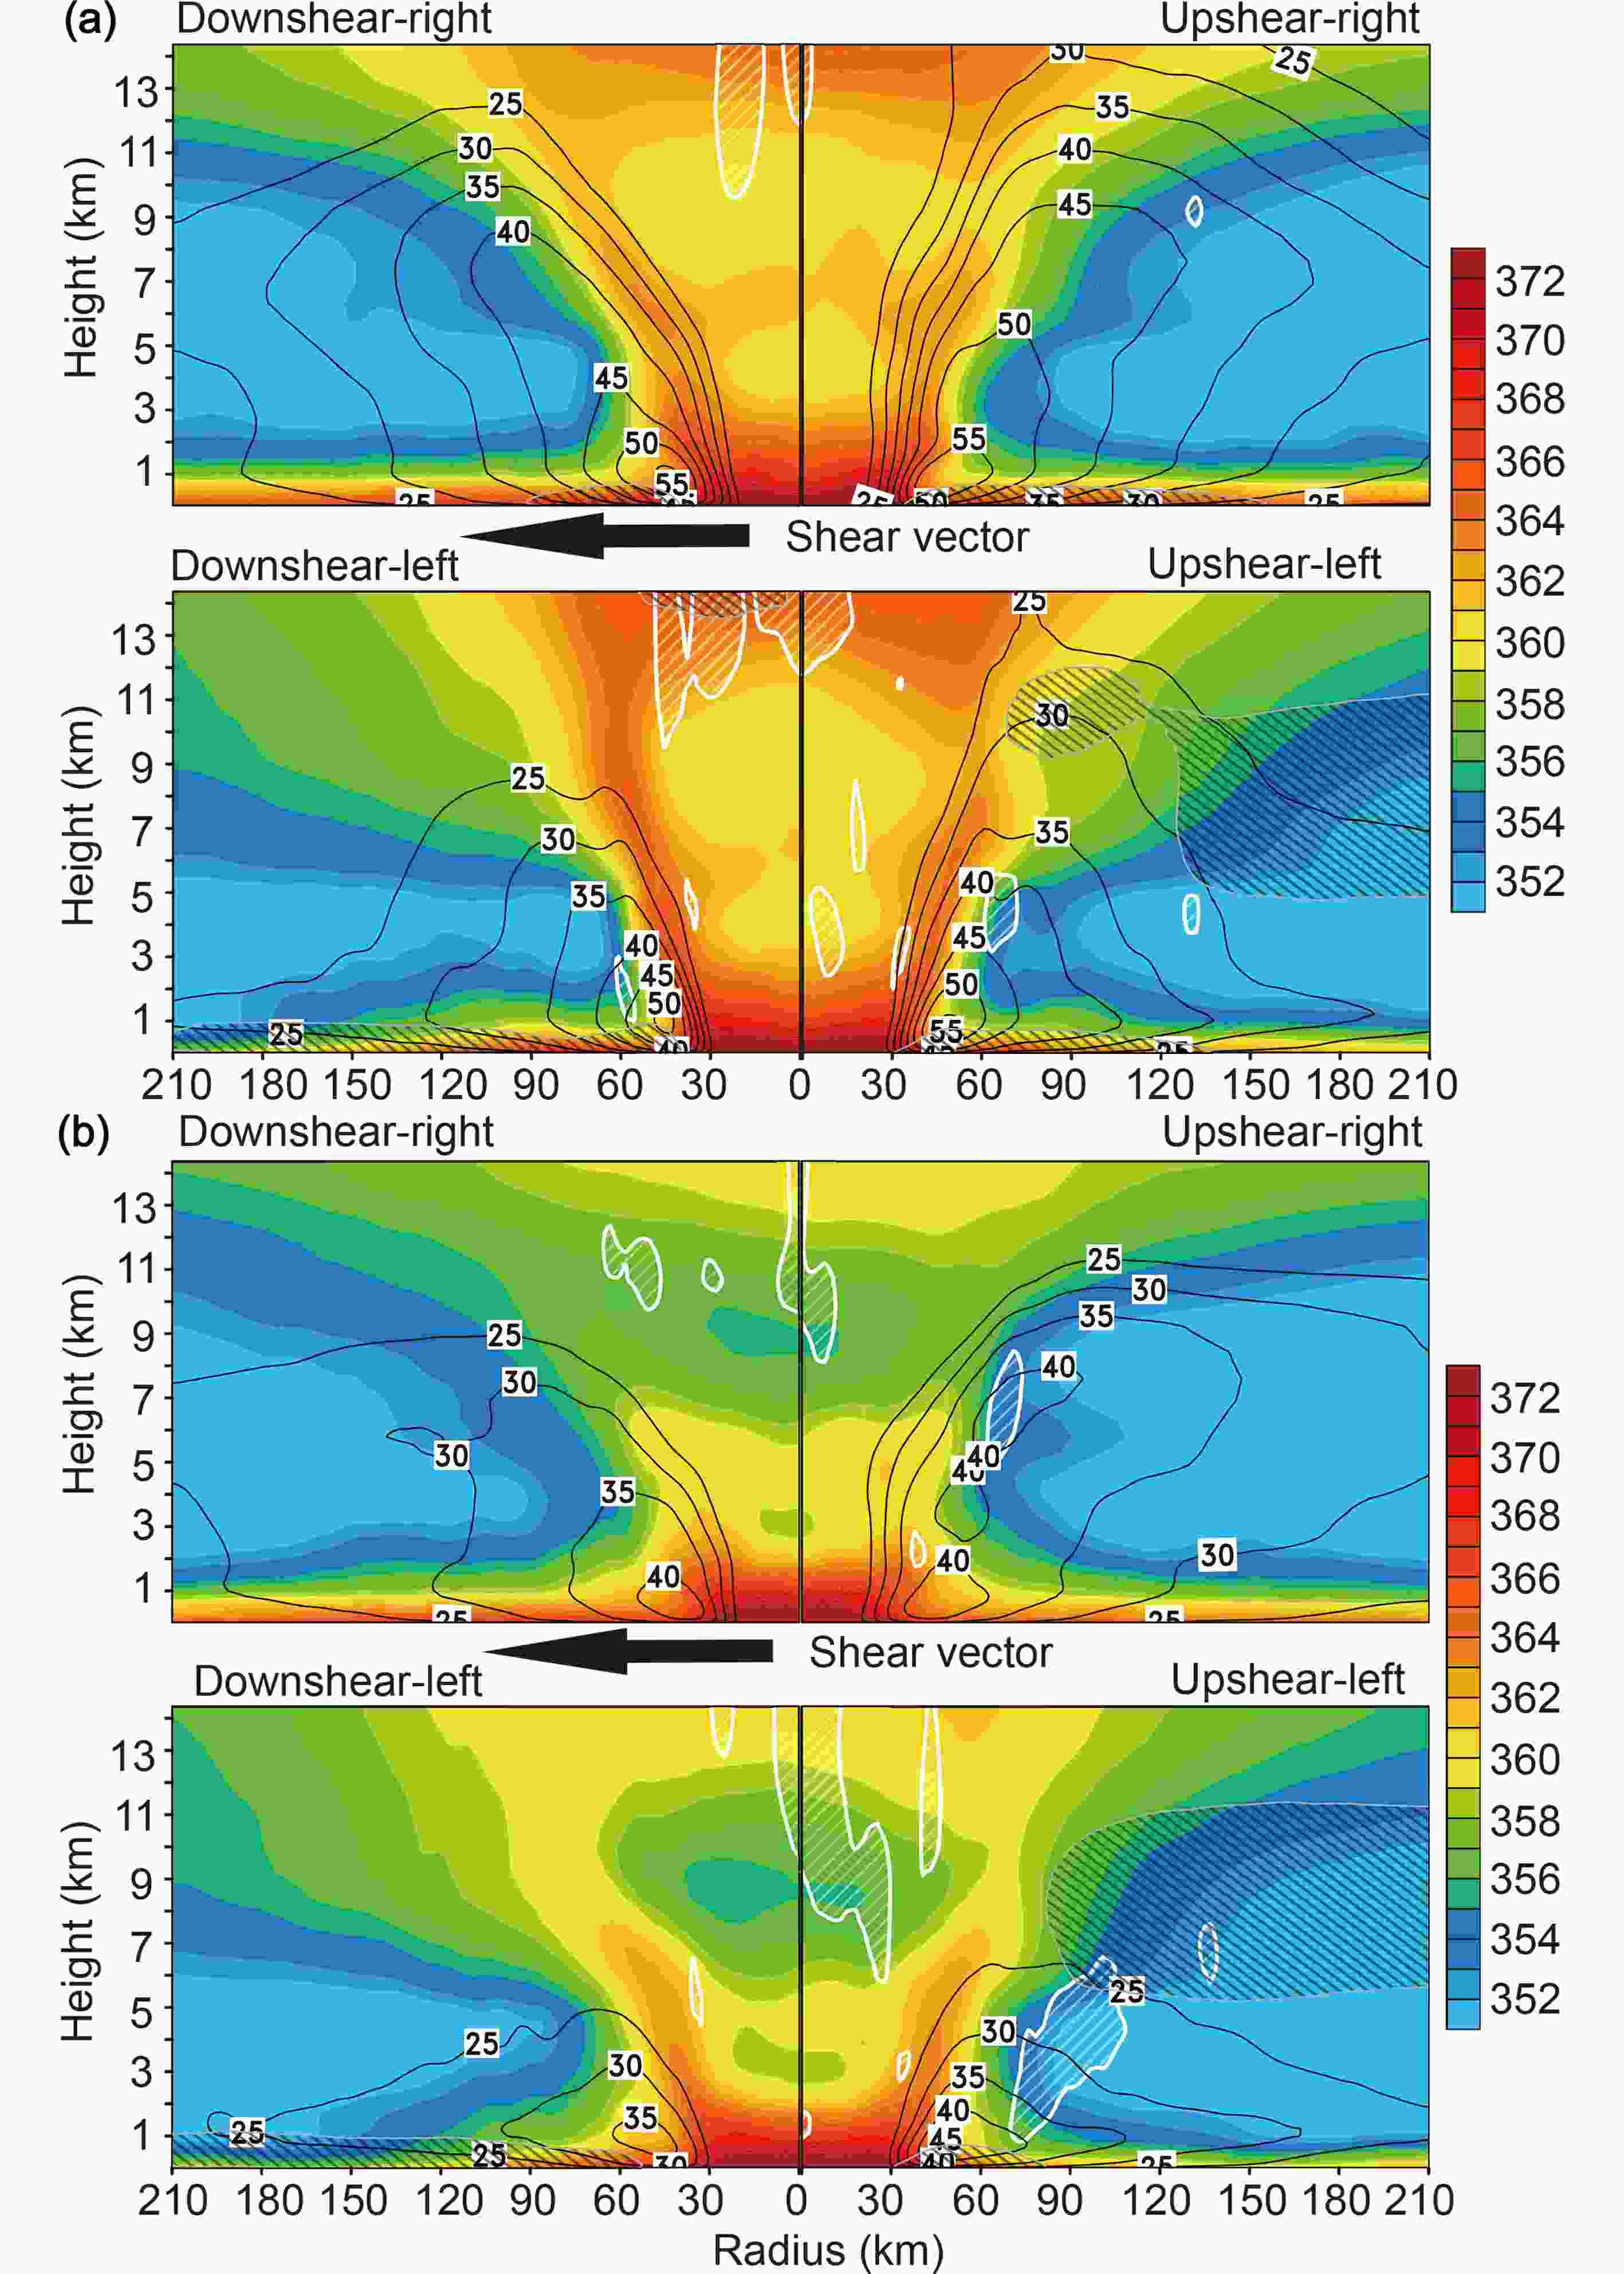 Figure9. As in Fig. 8, but for equivalent potential temperature (shaded, units: K), tangential winds (solid black contours every 5 m s?1 starting at 25 m s?1), radial inflow (black hatching less than ?10 m s?1), and downdrafts (white contours and hatching for less than ?0.5 m s?1) over shear-relative sectors for (a) EarlyRI and (b) LateRI.
For decades, the role of VWS in TC intensity has focused on the negative impact of ventilating the TC warm core at mid-to-upper levels and the suppression of eyewall convection (e.g., Simpson and Riehl, 1958; Frank and Ritchie, 2001). Cram et al. (2007) suggested that, in practical situations, ventilation may occur as a sheared storm approaches a mid- and upper-tropospheric air mass with low entropy. The relatively low, downshear-right, upper-tropospheric θe in LateRI is shown in Fig. 9b and is consistent with cold and dry air intrusions, which inhibit convective development. To illustrate this effect in EarlyRI and LateRI, Fig. 10 presents time?height series of shear-relative, radial and quadrant-averaged distributions of relative humidity, and radial and vertical velocities over the eyewall region. In EarlyRI, during pre-RI and RI onset stages (Fig. 10a, upper), the strongest and deepest upward motion occurs with maxima at midlevels, while boundary-layer inflow and mid-to-upper-level outflow downshear are evident during this stage. This result implies a rapid enhancement of the secondary circulation, as emphasized in Wu et al. (2006). However, the enhancement may be associated with the onset of enhanced convective activity over a region with a radius of 30?60 km. As discussed earlier and implied in Fig. 9a, the downshear side in EarlyRI is moistened with the convective transport of boundary-layer θe. In contrast, LateRI has a shallow in-up-out flow pattern corresponding with relatively dry air downshear-left (Fig. 10a, lower). In addition, LateRI has midlevel downdrafts in the downshear-left quadrant, associated with the intrusion of dry midlevel environmental air, and low-level downdrafts over the upshear flank, possibly in association with dry low-level air transported upshear following downdrafts over the downshear-left quadrant. Similar processes were described by Riemer and Laliberté (2015). As a result of mid-to-upper-tropospheric ventilation, shown in Figs. 9b and 10a, the secondary circulation and the mid-to-upper-level warm-core development has been delayed in LateRI. This is depicted in Fig. 10c, which shows time series of the temperature anomalies over inner radii from EarlyRI and LateRI. In EarlyRI, enhanced warming commences just after 0000 UTC 17 July, which is consistent with the observational study of Wang et al. (2016). In LateRI, warming is slow until nearly 24 hours later.
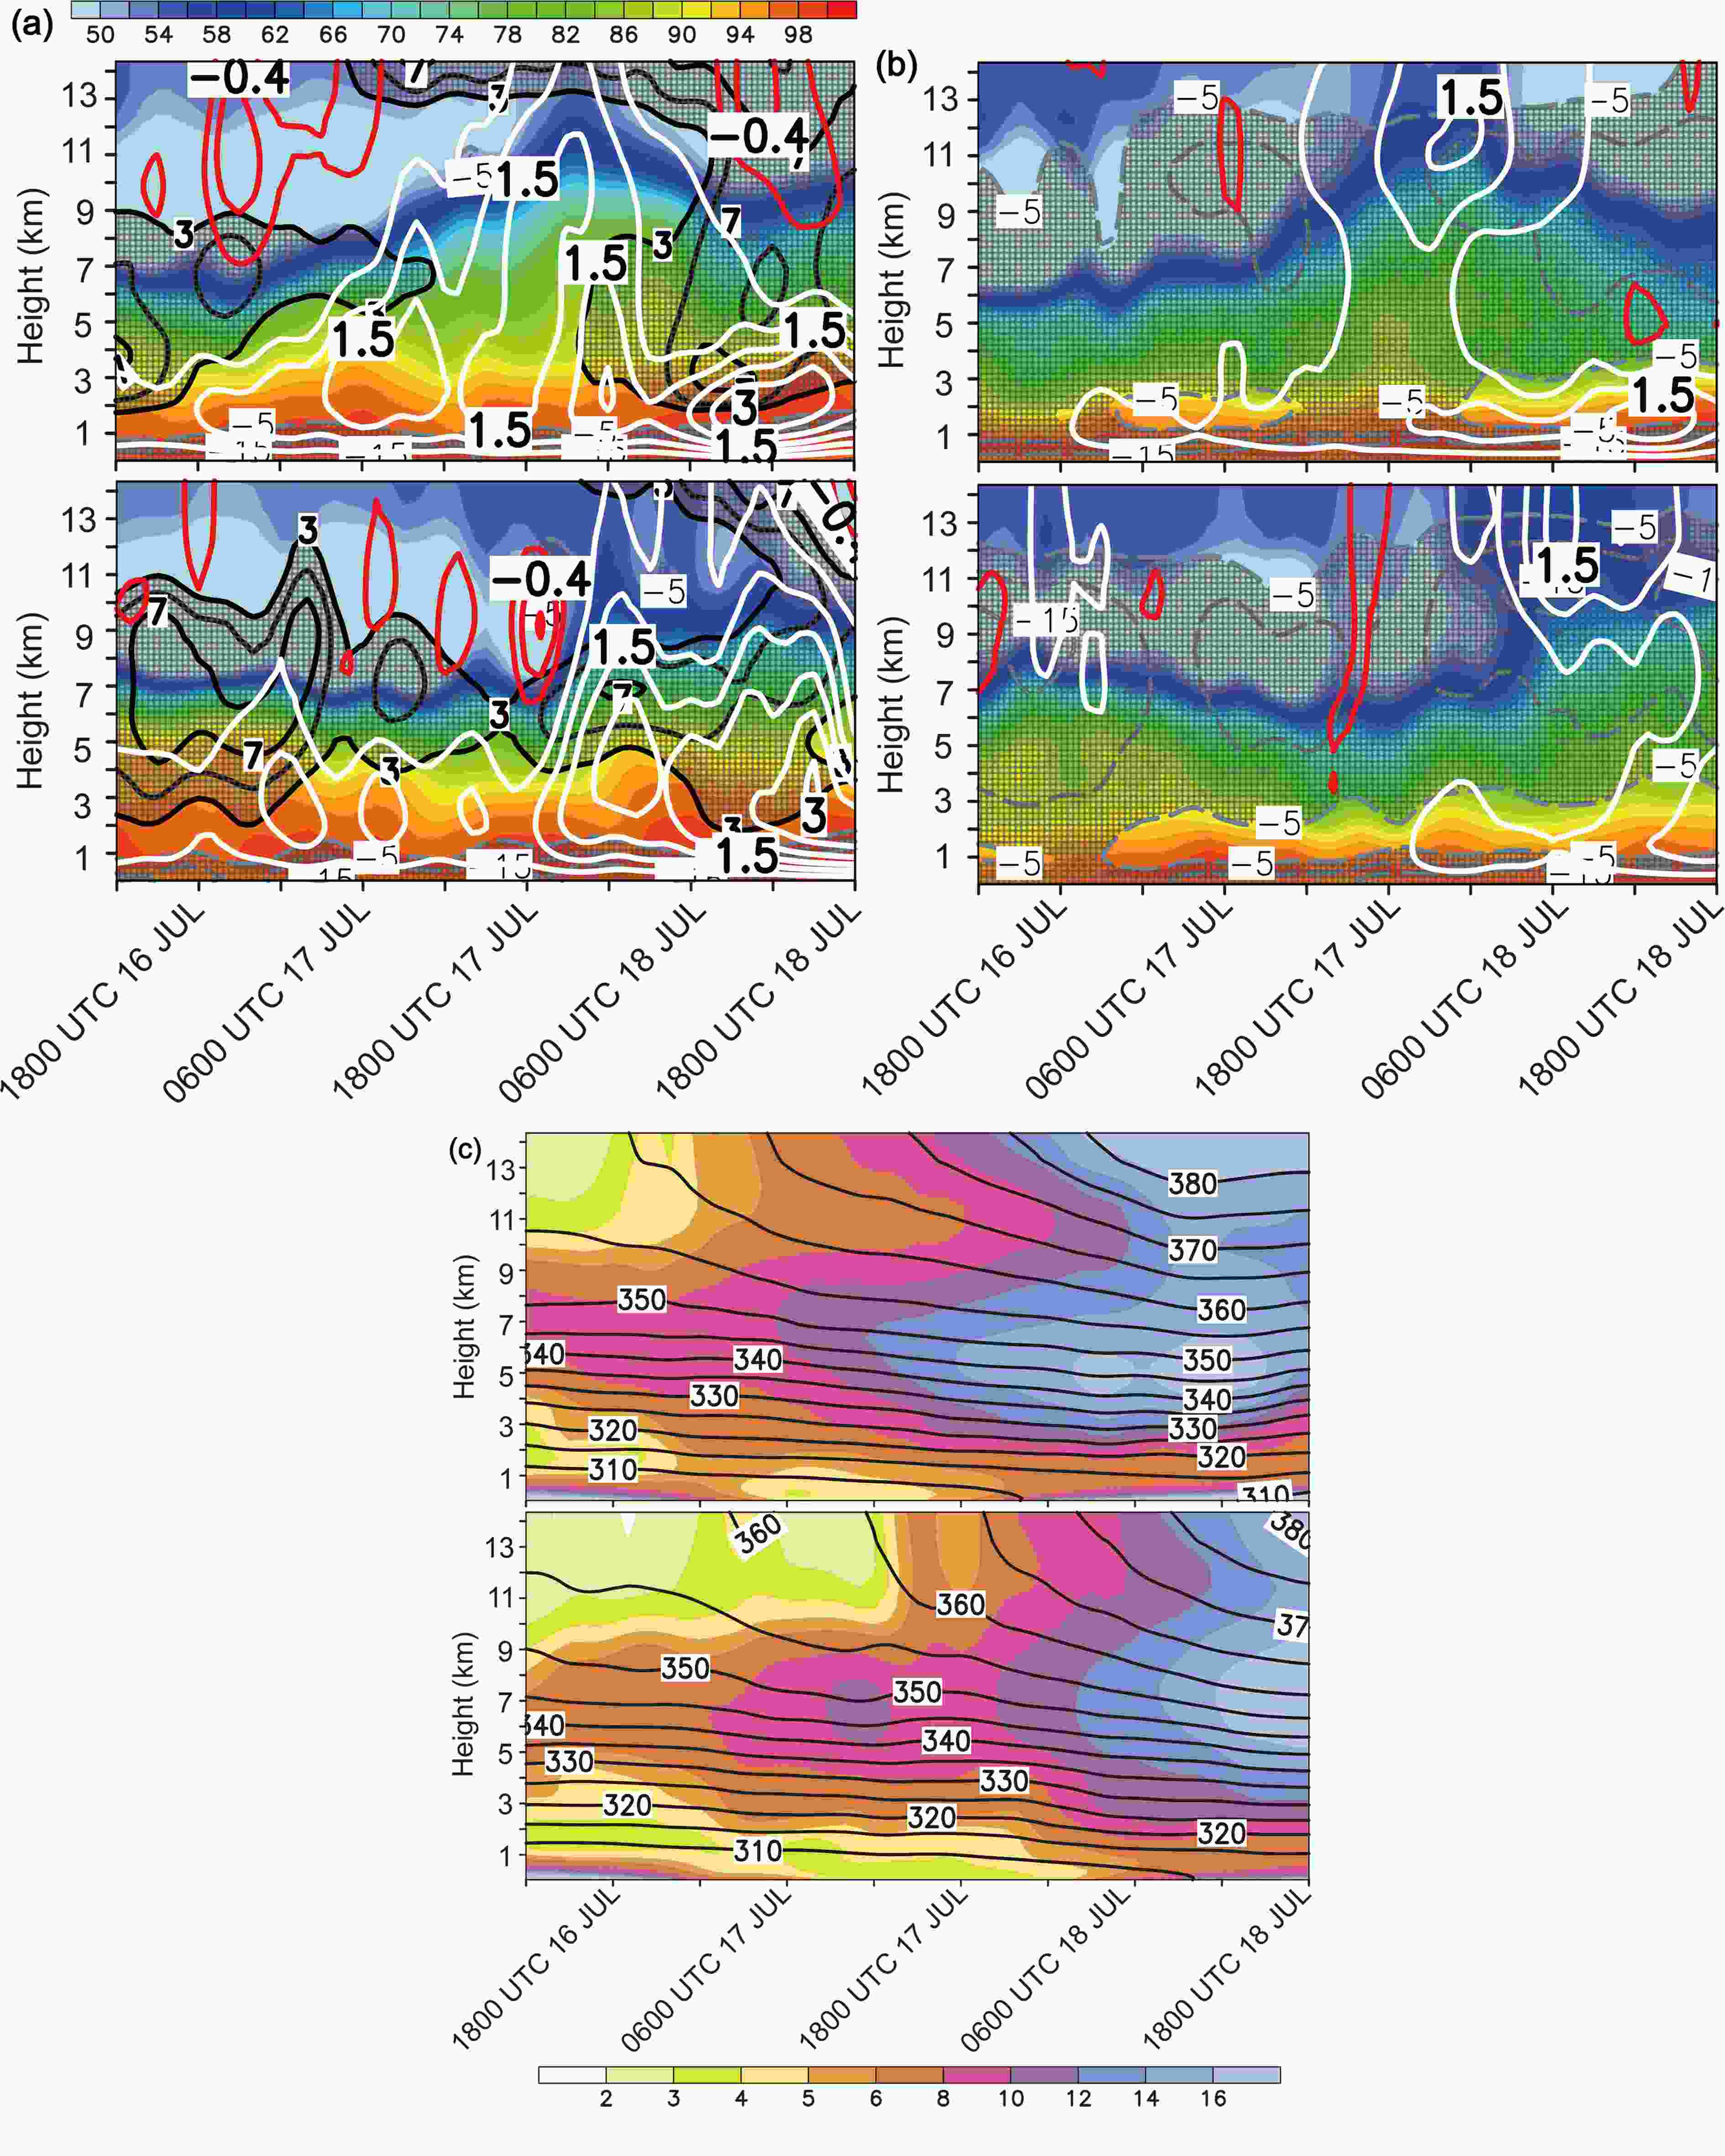 Figure10. Time?height series of azimuthally and radially averaged distributions of relative humidity (shaded), radial inflow (dashed gray, contoured every 5 m s?1 starting at ?5 m s?1), radial outflow (solid black, contoured every 5 m s?1 starting at 1 m s?1), ascent (solid white, contoured every 0.5 m s?1 starting at 0.5 m s?1) and descent (solid red, contoured every 0.2 m s?1 starting at ?0.2 m s?1) in the (a) downshear-left (top for EarlyRI, bottom for LateRI) and (b) upshear-right (top for EarlyRI, bottom for LateRI). The radial wind is averaged over 60?120-km radii, while vertical motion is averaged over 30?60-km radii. (c) Azimuthally and radially averaged (0?30 km) distributions of temperature anomalies (K, shaded) and potential temperature (K, contours) (top for EarlyRI, bottom for LateRI).
To better understand the origin and role of convective downdrafts, we now illustrate the boundary-layer structure and downward flux of θe. Following Riemer et al. (2010), we calculate the downward flux at the top of the frictional boundary layer, defined as

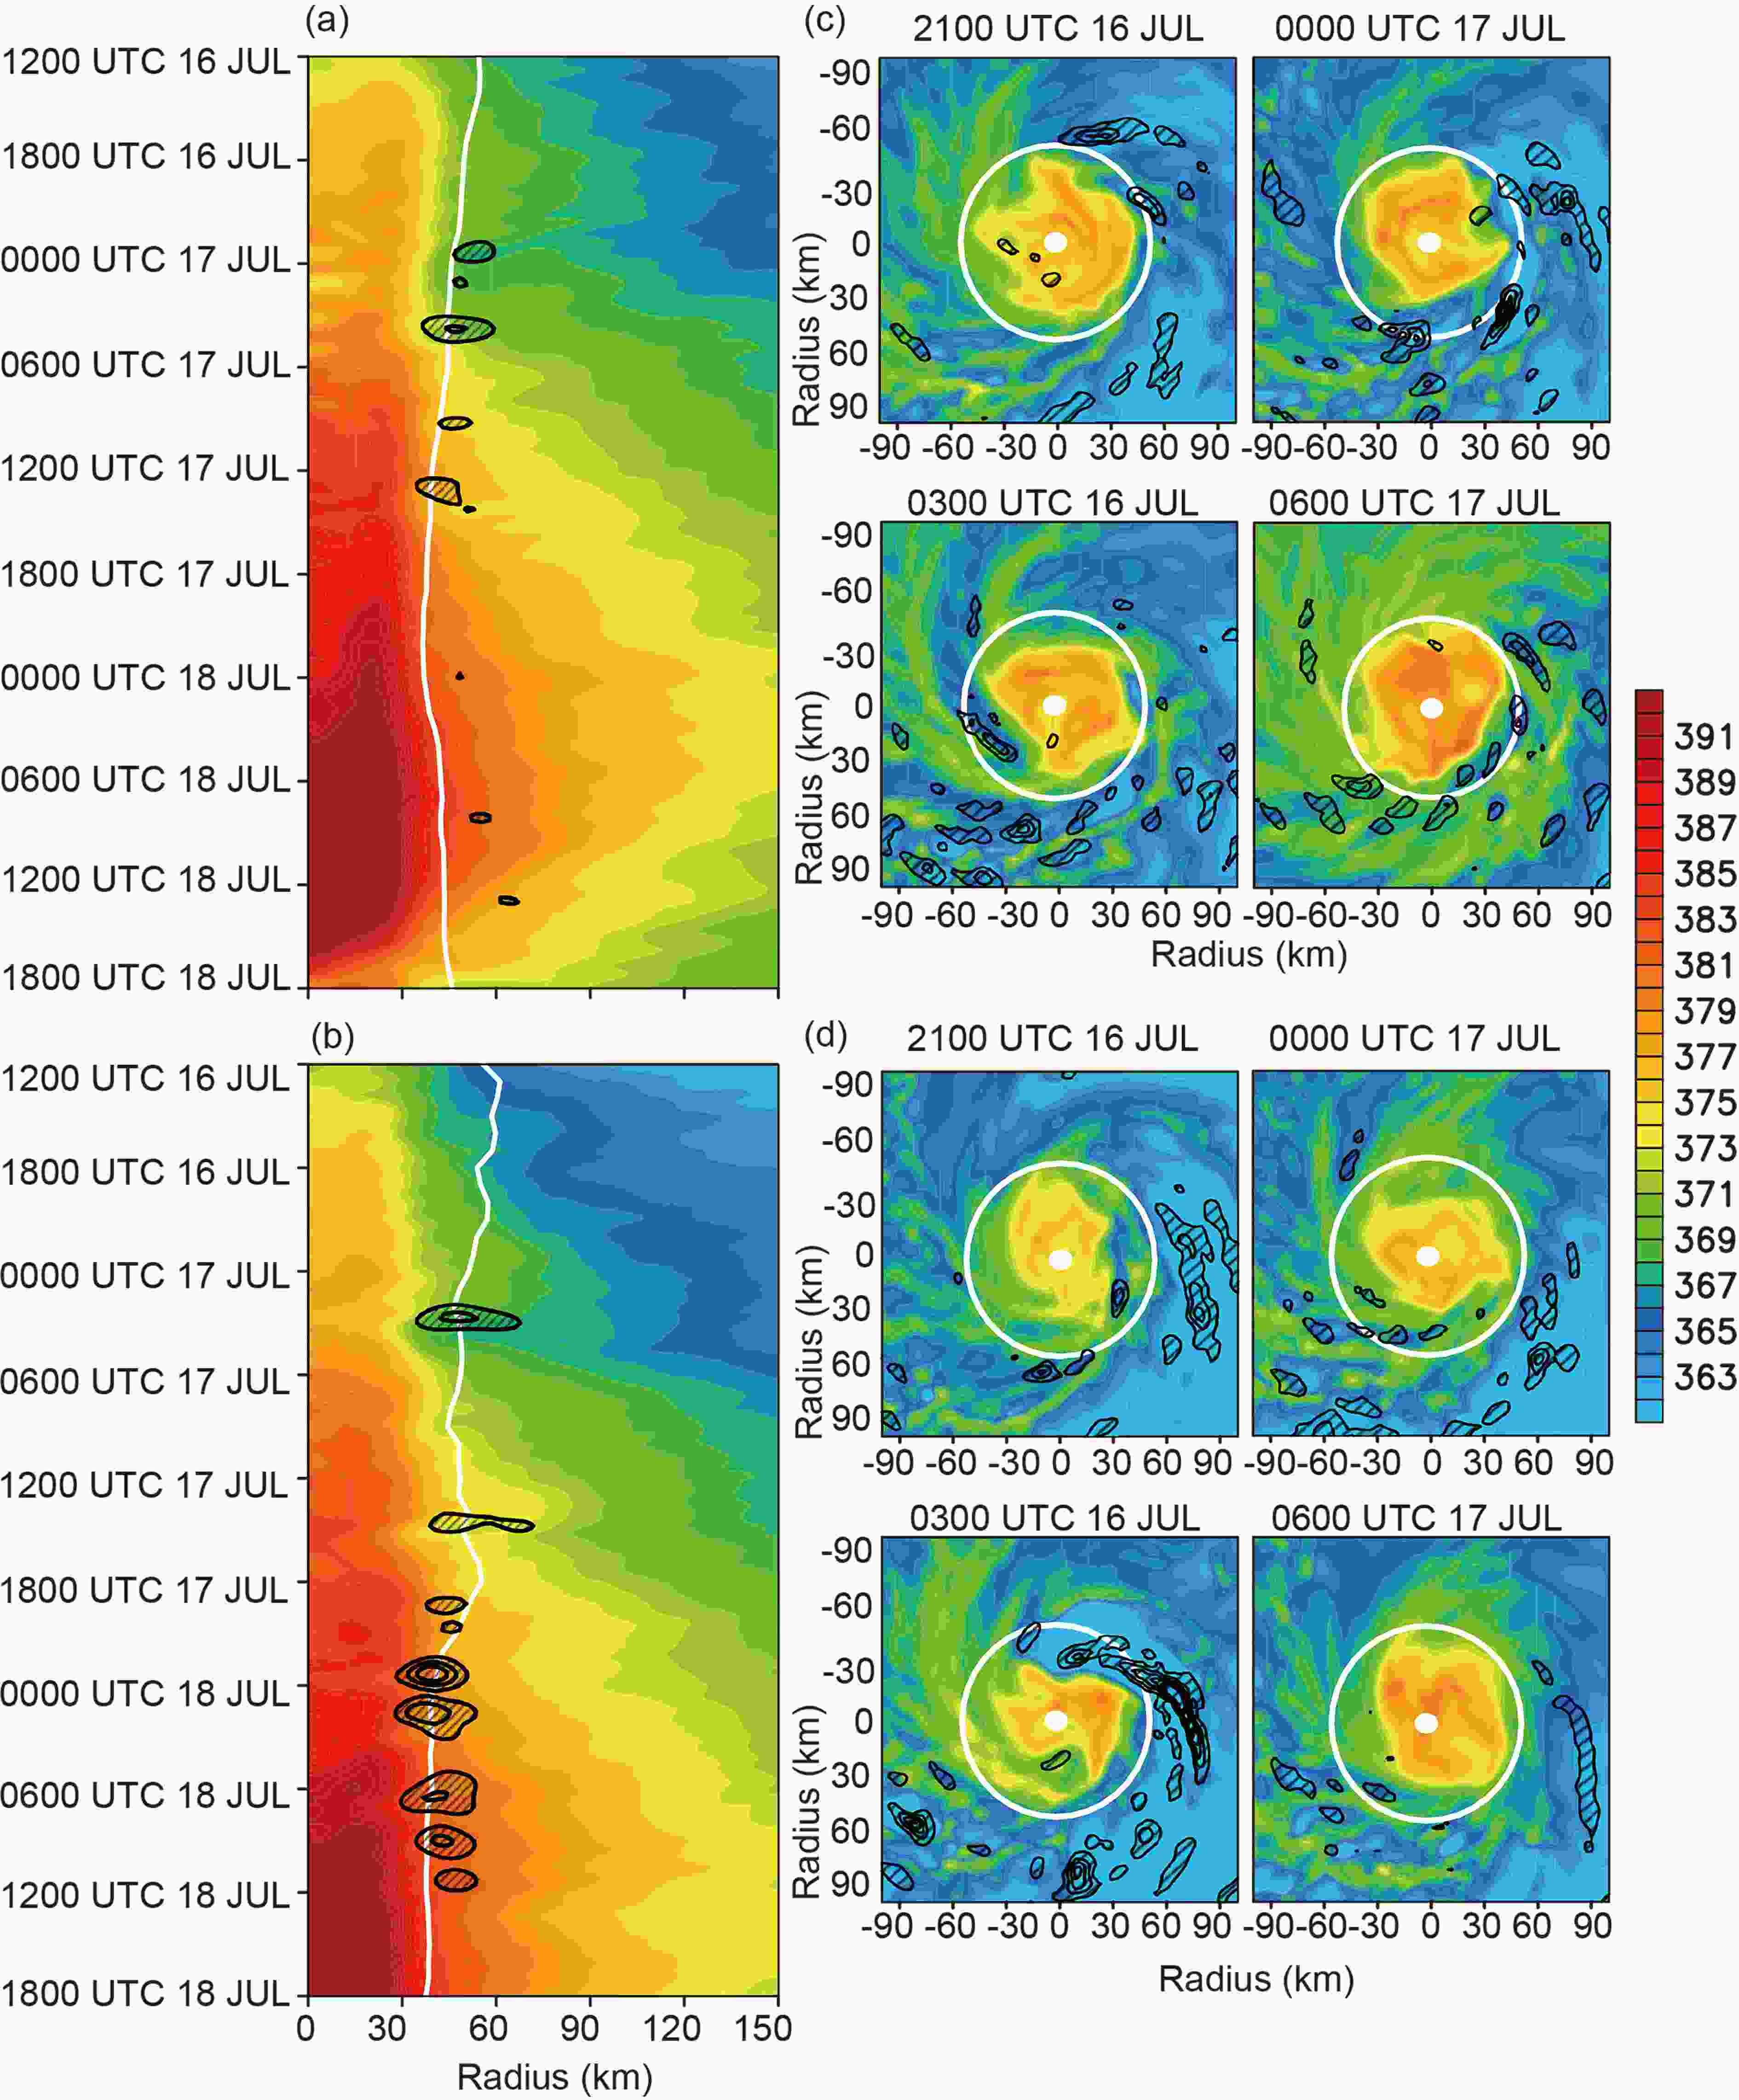 Figure11. Time?radius distribution of the symmetric components of boundary-layer equivalent potential temperature (shaded, averaged over the lowest 1 km, units: K), and downward equivalent potential temperature flux at the height of 1.5 km (black hatching and contours starting at 3 m s?1 K in intervals of every 5 m s?1 K) from (a) EarlyRI and (b) LateRI. White lines depict the 1.5-km level RMW. (c, d) Storm-centered composite horizontal distributions of (c) EarlyRI and (d) LateRI for boundary-layer equivalent potential temperature (shaded, averaged over the lowest 1 km), and downward equivalent potential temperature flux at the height of 1.5 km (black hatching and contours starting at 2 m s?1 K). White circles show the 1.5-km RMW.
2
4.4. Impact of wind shear on the kinematic storm structure in EarlyRI and LateRI
Besides the negative impact of VWS on TC intensification, VWS can play a potentially positive role by organizing deep convection and vorticity production in the downshear region of the pre-existing vortex during TC development stages (e.g., Molinari et al., 2004; Callaghan and Tory, 2014; Montgomery et al., 2014; Chen et al., 2018). In addition, we demonstrate here that the shear can influence the vertical synchronization of the RMWs, which can assist in the development of the eyewall cloud. We distinguish here between the commonly used tilt of the vortex, which is the separation between the centers of the circulation at vertical levels, and the synchronization of the circulation, which is a measure of the amount of overlapping or phase-locking of the RMWs among vertical levels.Evidence suggests that some shear may be beneficial to the intensification. Figures 12 and 13 illustrate the response of the simulated storm circulations to the VWS. Figure 12 shows forecast reflectivity distributions and Fig. 13 shows the evolution of convective bands over a radius of 30?60 km. In Fig. 12, circles are drawn to illustrate the mid- and upper-level RMWs. The horizontal patterns of reflectivity following the storm’s 2-km-altitude center show that the upper-tropospheric circulation at an altitude of 8 km tilted toward the downshear side, consistent with the diagnosed VWS. In agreement with many previous studies (e.g., Wu et al., 2006; Kanada and Wada, 2015; Nguyen et al., 2015), the wavenumber-one asymmetries indicated by upward motion and large values of reflectivity were nearly aligned with the downshear or downshear-left side of the VWS, and the direction of vortex tilt. We do not illustrate it here, but this convective asymmetry can also be interpreted in terms of the forcing of large-scale ascent in association with (1) initially, differential vorticity advection, as the vortex tilts, and (2) warm-air advection or moist isentropic ascent, associated with the thermal structure of the tilted vortex, which can be diagnosed from the local shear of the circulation winds (e.g., Holton, 2004; Tory, 2014). Then, the clouds and moisture from the downshear-left sector are transported, or wrapped inwards to the upshear-left quadrant; but because of the tilt of the vortex, the RMWs become coincident over this sector. In this way, an inward-spiraling ICB, evident in the actual and model-based cloud imagery, is formed. The larger tilt of the vortex in LateRI compared to that of EarlyRI inhibits this synchronization, defined as an overlapping of the RMWs at mid to upper levels, from occurring (Fig. 12). This is related to the stronger VWS and different circulation sizes in LateRI, which is again consistent with previous studies (e.g., Wu et al., 2006; Kanada and Wada, 2015). In LateRI, there is clearly no vertical synchronization of the circulation during the time of the observed RI. In the initially stronger shear in LateRI, the circulation is poorly organized in the vertical (Fig. 12). Very strong inhibition of convection is expected over the upshear sectors due to the dynamics of the vortex tilt. This in turn prevents the formation of the eyewall cloud as the inward-spiraling cloud is rapidly weakened over the highly unfavorable upshear sector, in a region of mean isentropic descent in the tilted vortex. However, as can be seen in the bottom-right panel, the synchronization does eventually begin, and from this late time the RI commences in LateRI.
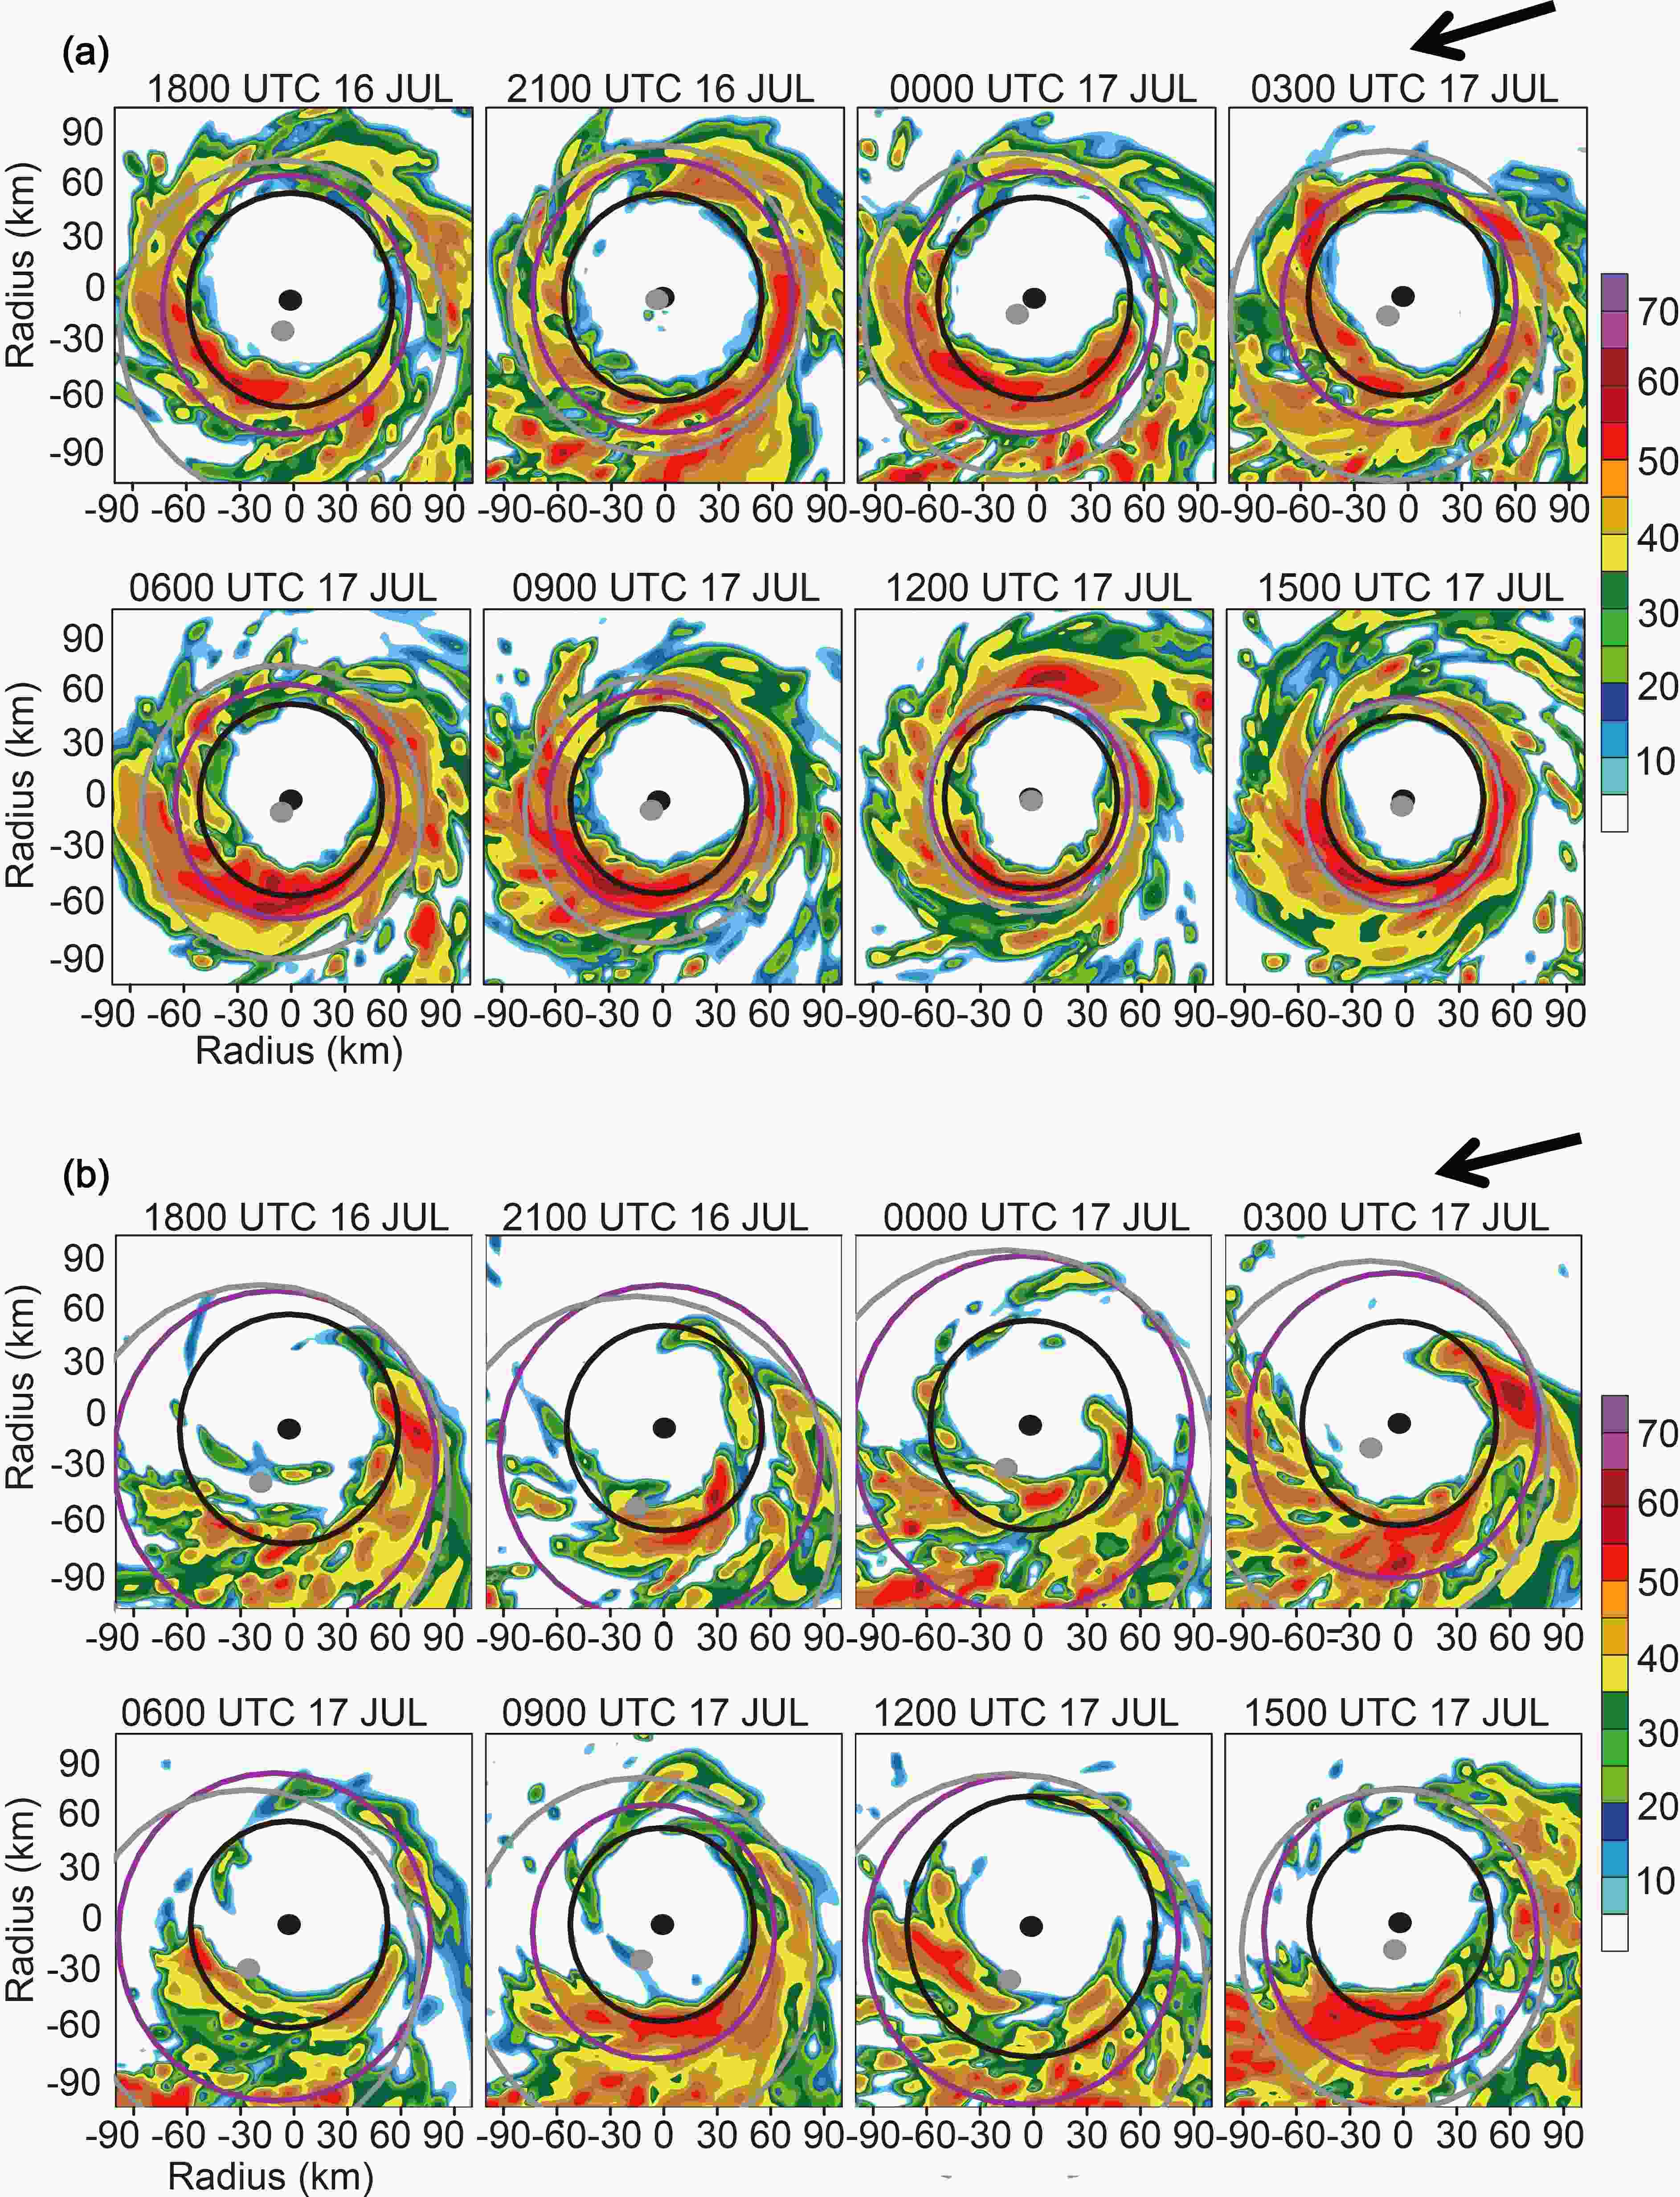 Figure12. Storm-centered horizontal distributions of 2-km to 8-km simulated radar reflectivity (shading, dBZ) for (a) EarlyRI and (b) LateRI at times given at the top of each panel. Black circles are the 2-km-level RMWs, with the 2-km-level center indicated by the black dot. Purple circles are the 5-km-level RMWs. Gray circles are the 8-km-level RMWs, with the 8-km-level center indicated by the gray dot. Axis labels are in km. The black arrow denotes the direction of environmental vertical wind shear.
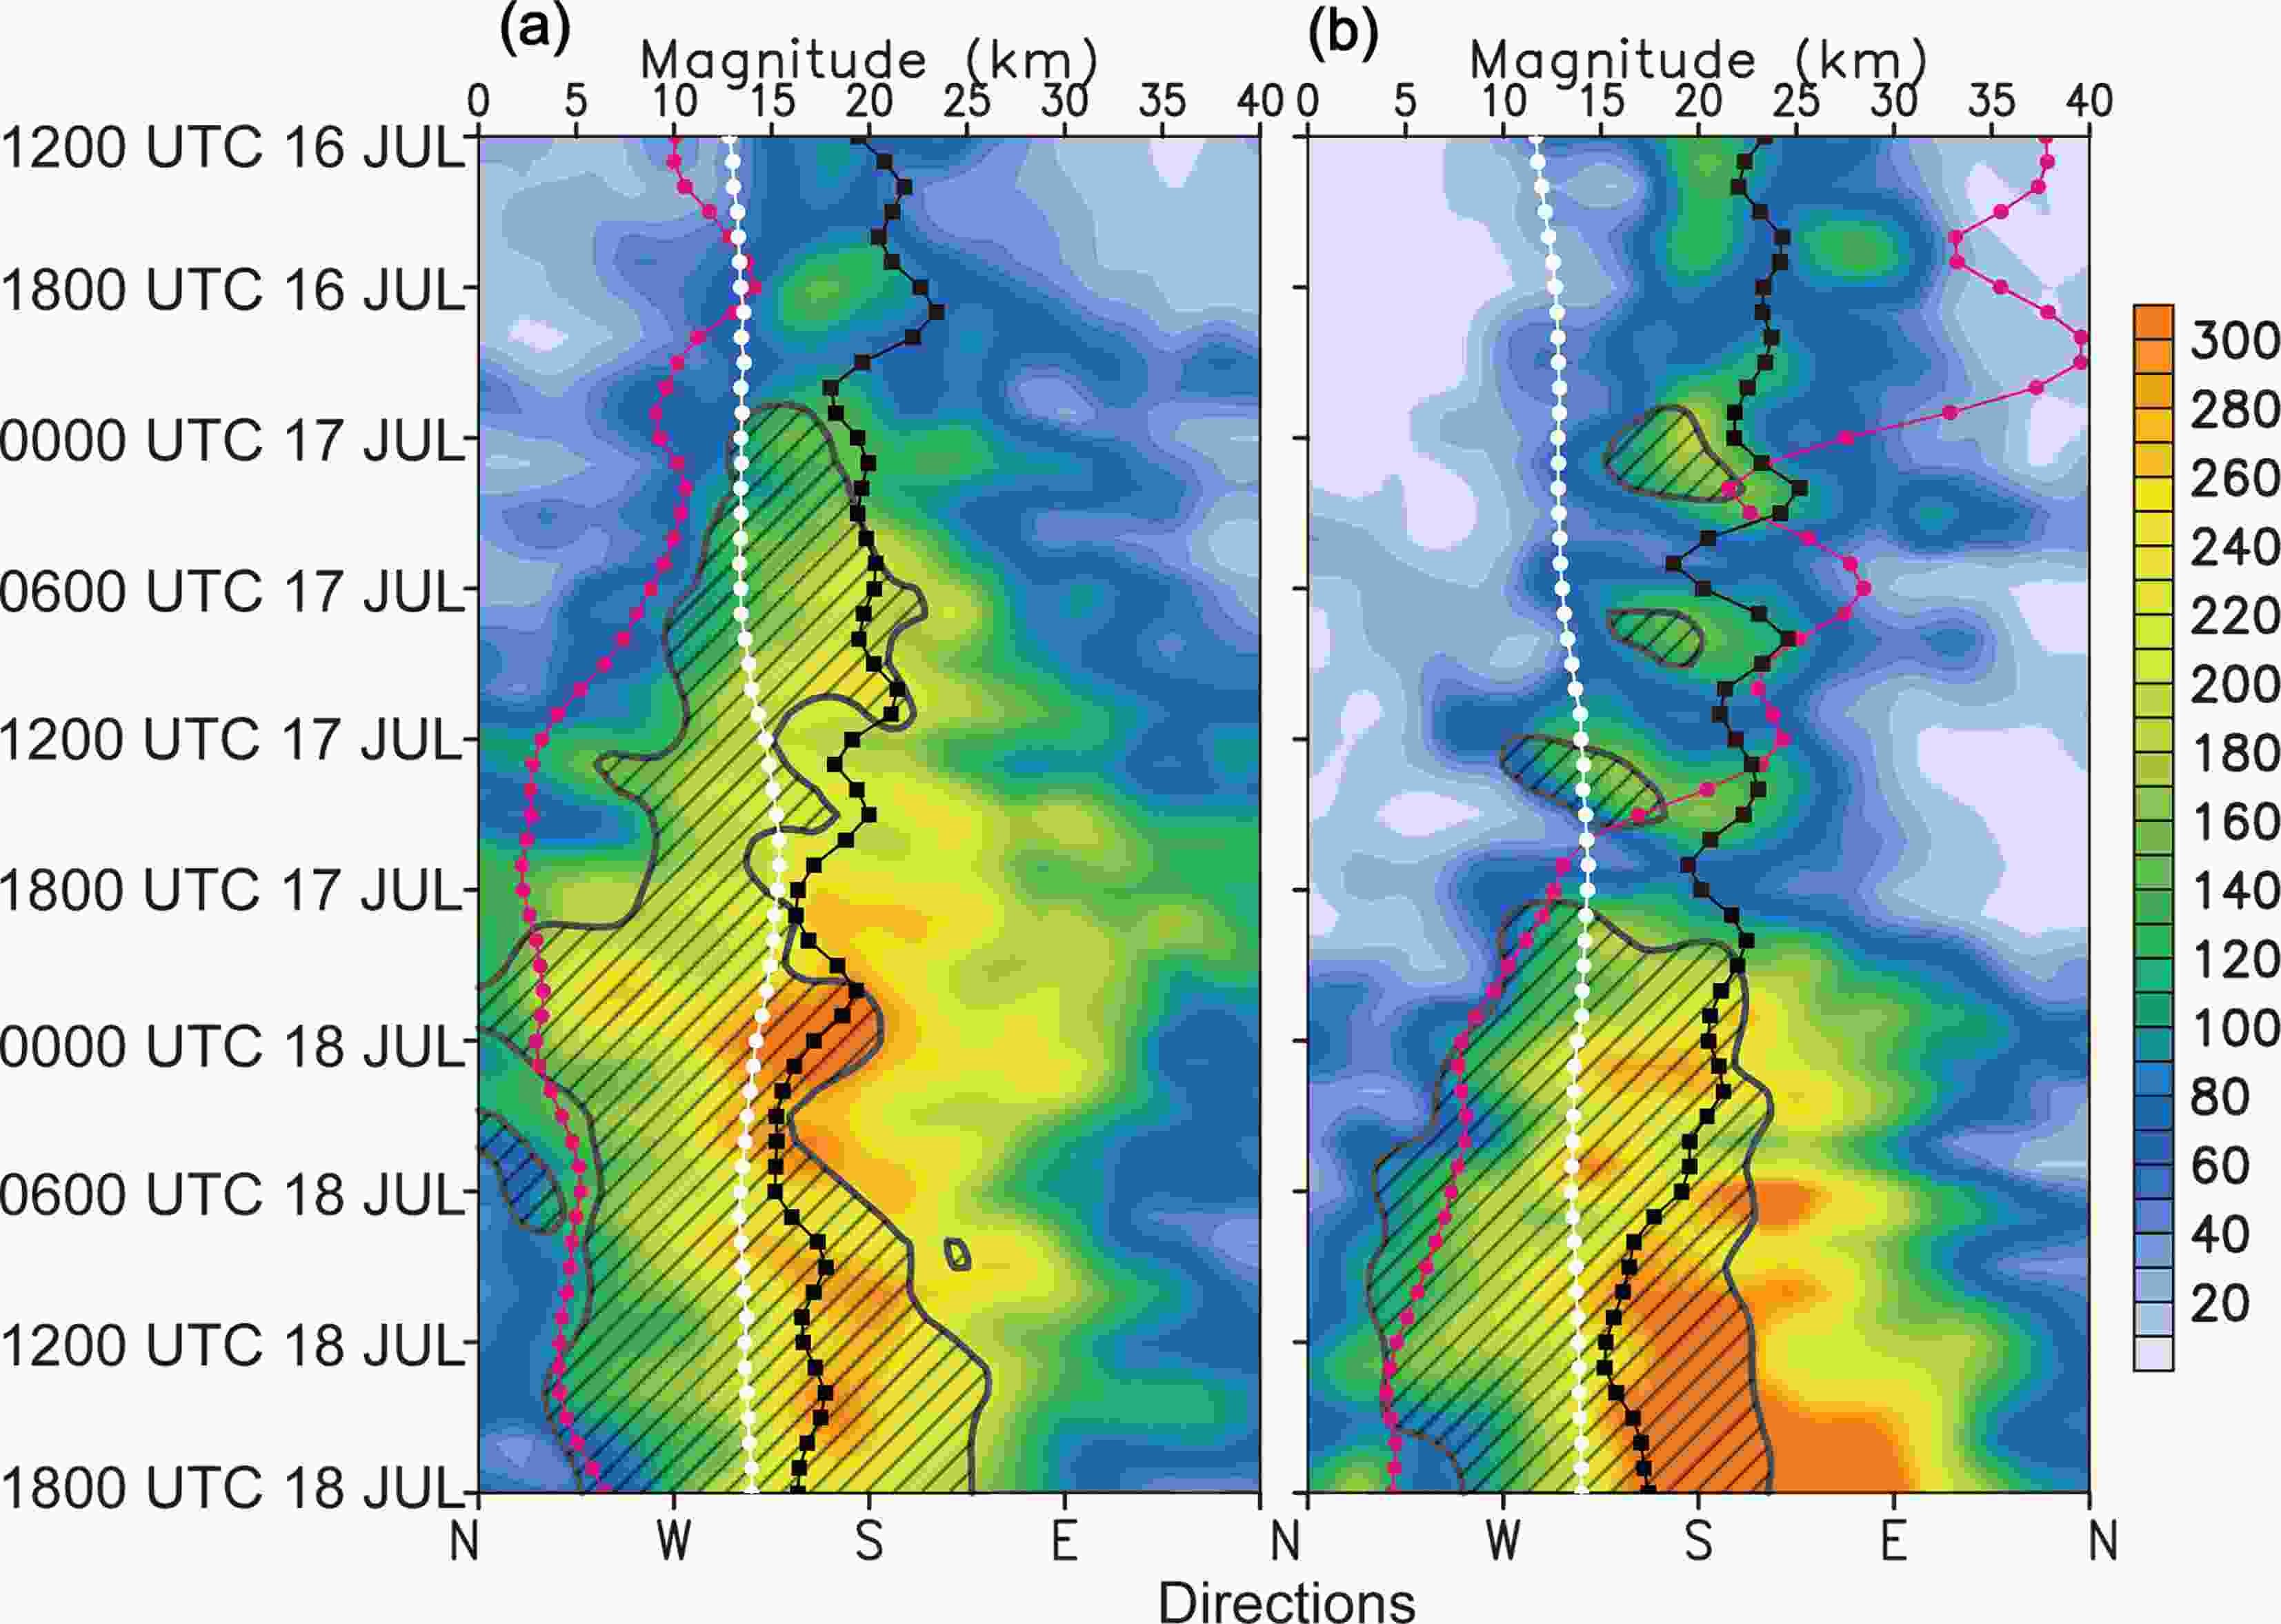 Figure13. Time?azimuth (Hovm?ller) diagrams of 1-km to 5-km water vapor mixing ratio (shading, g kg?1) and 3-km updrafts (contours and hatching starting at 1.0 m s?1) along the RMW (roughly over a radius of 30?60 km) for (a) EarlyRI and (b) LateRI. The white, black and magenta solid curves indicate the direction of 200?850-hPa shear, the vortex tilt as indicated by the location of the 8-km center relative to the surface center, and the vortex tilt magnitude (km), respectively.
In addition, the RMWs in EarlyRI at heights from 2 km to 8 km, depicted in Fig. 12, show that the axis of the circulation starts to become upright (the vortex tilt decreases) and RI continues, as presented by Kanada and Wada (2015) and Chen et al. (2018). Moreover, they hypothesized that shallow-to-moderate convection developed around the downshear side of the storm, which moistened the inner-core area and warmed the midlevels through latent heat release. As the inner-core area moistened and warmed, the storm vortex and tilt axis decreased and the circulation became upright. An alternative interpretation is that with the vortex in shear, enhanced downshear-left convection drove a secondary circulation that spun up the low-level circulation, creating the moist warm core. Figure 13 shows time?azimuth sections from EarlyRI and LateRI of water vapor mixing ratio, 3-km updrafts, the shear direction, vortex tilt direction, and vortex tilt magnitude. The water vapor is more axisymmetric in EarlyRI. We have illustrated in Fig. 11 that this might be related to the downward flux of low θe air in LateRI, with the circulation experiencing much stronger ventilation. The direction of the shear is very similar in EarlyRI and LateRI but, as shown in Fig. 13, the magnitude is larger in LateRI (Fig. 4). One large difference between EarlyRI and LateRI in Fig. 13 is the magnitude of the vortex tilt, particularly during the time of the observed RI. The tilt of the vortex in LateRI only becomes comparable with that of EarlyRI 24 hours after the observed RI. It is at this time that the onset of RI occurs in LateRI. For EarlyRI, the RI commences when the tilt of the vortex (magenta curve) is approximately 10 km, and after this time the vortex becomes much more upright, even though the magnitude of the shear (Fig. 4) remains relatively constant. It is during the period (0000?1200 UTC 17 July) that the synchronization of the low- and midlevel RMWs and the formation of the eyewall cloud occurs. These timings are also evident in the water vapor displayed in Fig. 13. In EarlyRI, water vapor mixing ratios increase as RI develops. For LateRI, large values only occur 24 hours after the observed RI. Inhibition to convective development around the inner circulation prevents moistening over this region.
The positive impact of VWS on TC intensity is demonstrated in Nguyen et al. (2015) and Chen et al. (2018). It was suggested that the development of mesovortices within the downshear convection acts to enhance the TC vortex, which then reduces the vortex tilt. Following Braun et al. (2006), we show the evolution of the relative vorticity at low levels and upward motion at low and high levels in Fig. 14 as time?azimuth sections. There are clearly large differences between the two ensemble members. Similar to Tropical Storm Gabrielle (2001) and Typhoon Vicente (2012) documented by Nguyen et al. (2015) and Chen et al. (2018), respectively, there were some cyclonic and anticyclonic vorticity anomalies on the southwestern side of EarlyRI during the period 1200 UTC to 2300 UTC 16 July when Rammasun entered the SCS (Fig. 14a) and became much more prevalent after the onset of RI. It has been shown in previous studies that these couplets are generated through a mechanism of tilting of horizontal vorticity into the vertical by convective updrafts (e.g., Montgomery et al., 2006; Nguyen et al., 2015). Moreover, the simulated vorticity anomalies appear to have their origin over the southwest sector and are transported and axisymmetrized over the southeast sector by the parent circulation. They are associated with cyclonic relative vorticity reaching 60 × 10?5 s?1 and were adjacent to updrafts with magnitudes over 2.0 m s?1 at about 2200 UTC 16 July. Over the next 120 min, the cyclonic relative vorticity nearly doubled to 120 × 10?5 s?1, as the adjacent updraft intensified to over 4 m s?1 at 0000 UTC 17 July. The mesovortices are of course similar to the vortical hot towers (VHTs) described in Montgomery et al. (2006). As suggested in Nguyen et al. (2015), the cyclonic flow of the parent circulation may then advect and axisymmetrize the vorticity anomalies after 0600 UTC 17 July (Fig. 14a). The cyclonic anomalies wrap in towards the center via the processes associated with the vortex tilt and synchronization of the RMWs in the vertical and appear to be axisymmetrized during their journey inwards. Via the axisymmetrization, they may provide a source of vorticity for the developing inner core. Similar processes were described in Montgomery and Enagonio (1998). However, we note from the divergence theorem that the integrated effect of the vorticity axisymmetrization does not increase the mean circulation of the broader storm (e.g., Holton, 2004; Tory et al., 2013; Montgomery and Smith, 2017). Instead, it is the mass evacuation from the lower troposphere within the VHTs that enables the circulation to increase, provided it converges mass on the broader storm scale (e.g., Montgomery and Smith, 2017). The VHTs contain strong updrafts, which appear to be favored in regions of isentropic ascent within the circulation. Following Rogers et al. (2013) and Kanada and Wada (2015), the CBs were defined as the updrafts at an altitude of 8 km with a magnitude over 10.3 m s?1.
 Figure14. Time?azimuth (Hovm?ller) diagrams of 2.0-km vorticity (shaded, 1 × 10?5 s?1) and 3-km updrafts (black contours starting at 2.0 m s?1 every 2.0 m s?1) around the RMW, and radial grid point summations of 8-km updrafts greater than 10.3 m s?1 over a radius from the storm center to the RMW (magenta contours and hatching starting at five grid points): (a) EarlyRI; (b) LateRI.
The CBs were represented as the ascent became progressively stronger at upper levels near the RMW around 1000 UTC 17 July, after the axisymmetrization of vorticity anomalies. This was coincident with the rapid decrease of vortex tilt (Fig. 6), as suggested by previous studies (e.g., Nguyen et al., 2015; Chen et al., 2018).
LateRI had a similar pattern of weak vorticity-anomaly couplets and shallow-to-moderate convection but primarily in the downshear side of the storm (Fig. 14b). However, convective clouds in LateRI were more abundant in the downshear and downshear-left sectors but never developed to the upshear sector while Rammasun had relatively symmetric convection during the observed RI episodes. Deep active convection with associated vorticity maxima only developed in the downshear-left southwest sector when RI onset was imminent in LateRI at about 0000 UTC 18 July, nearly 24 hours later than observed. We suggest that the inhibition to the formation of the eyewall cloud is associated with the poor vertical synchronization of the circulation, described previously.
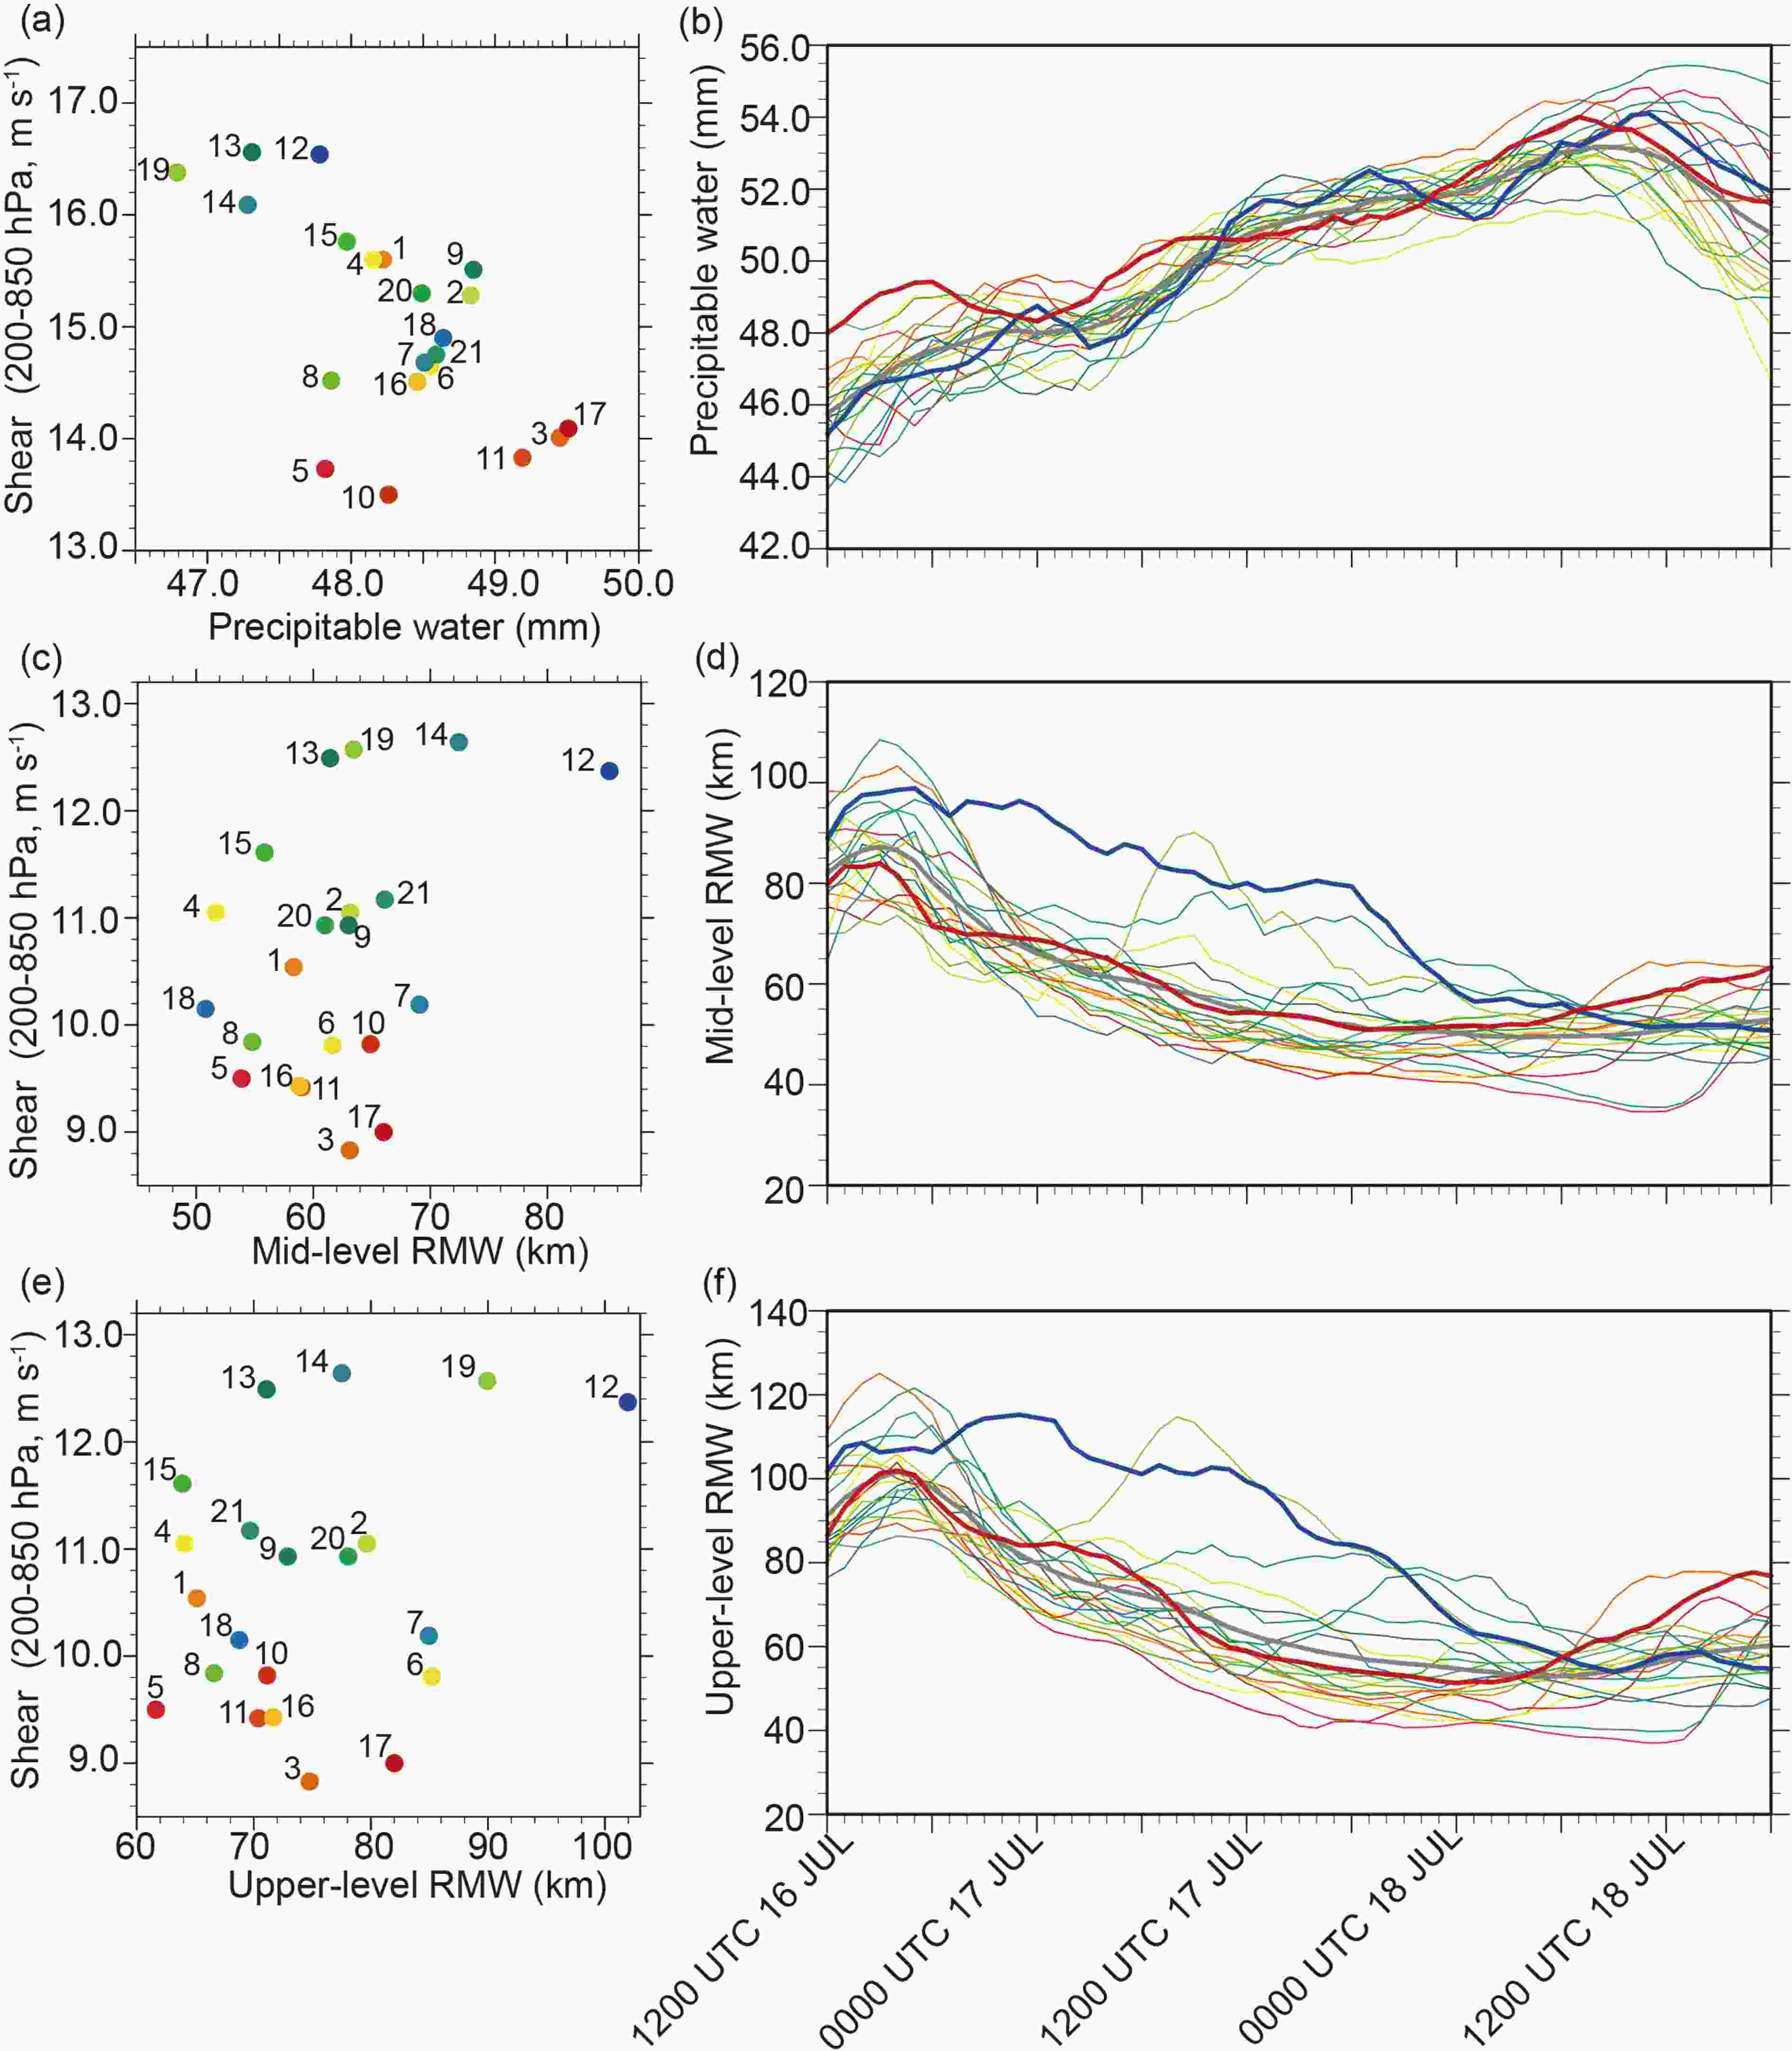 Figure15. (a) Scatterplot of VWS (y-axis, m s?1) versus precipitable water (PW, x-axis, mm) for early RI onset near 0400 UTC 17 July over circles of 500-km radius and 150-km radius centered on Rammasun’s circulation. Digits denote member numbers. (b) Time series of PW (mm) from 1200 UTC 16 July to 1818 UTC 18 July for all ensemble members. (c) As in (a) but for VWS (y-axis, m s?1) over a circle of 500-km radius centered on Rammasun’s circulation versus midlevel RMW (5 km, x-axis, km). (d) As in (b) but for midlevel RMW. (e) As in (c) but for VWS versus upper-level RMW (8 km, x-axis, km). (f) As in (d) but for upper-level RMW. Color coding is as in Fig. 2.
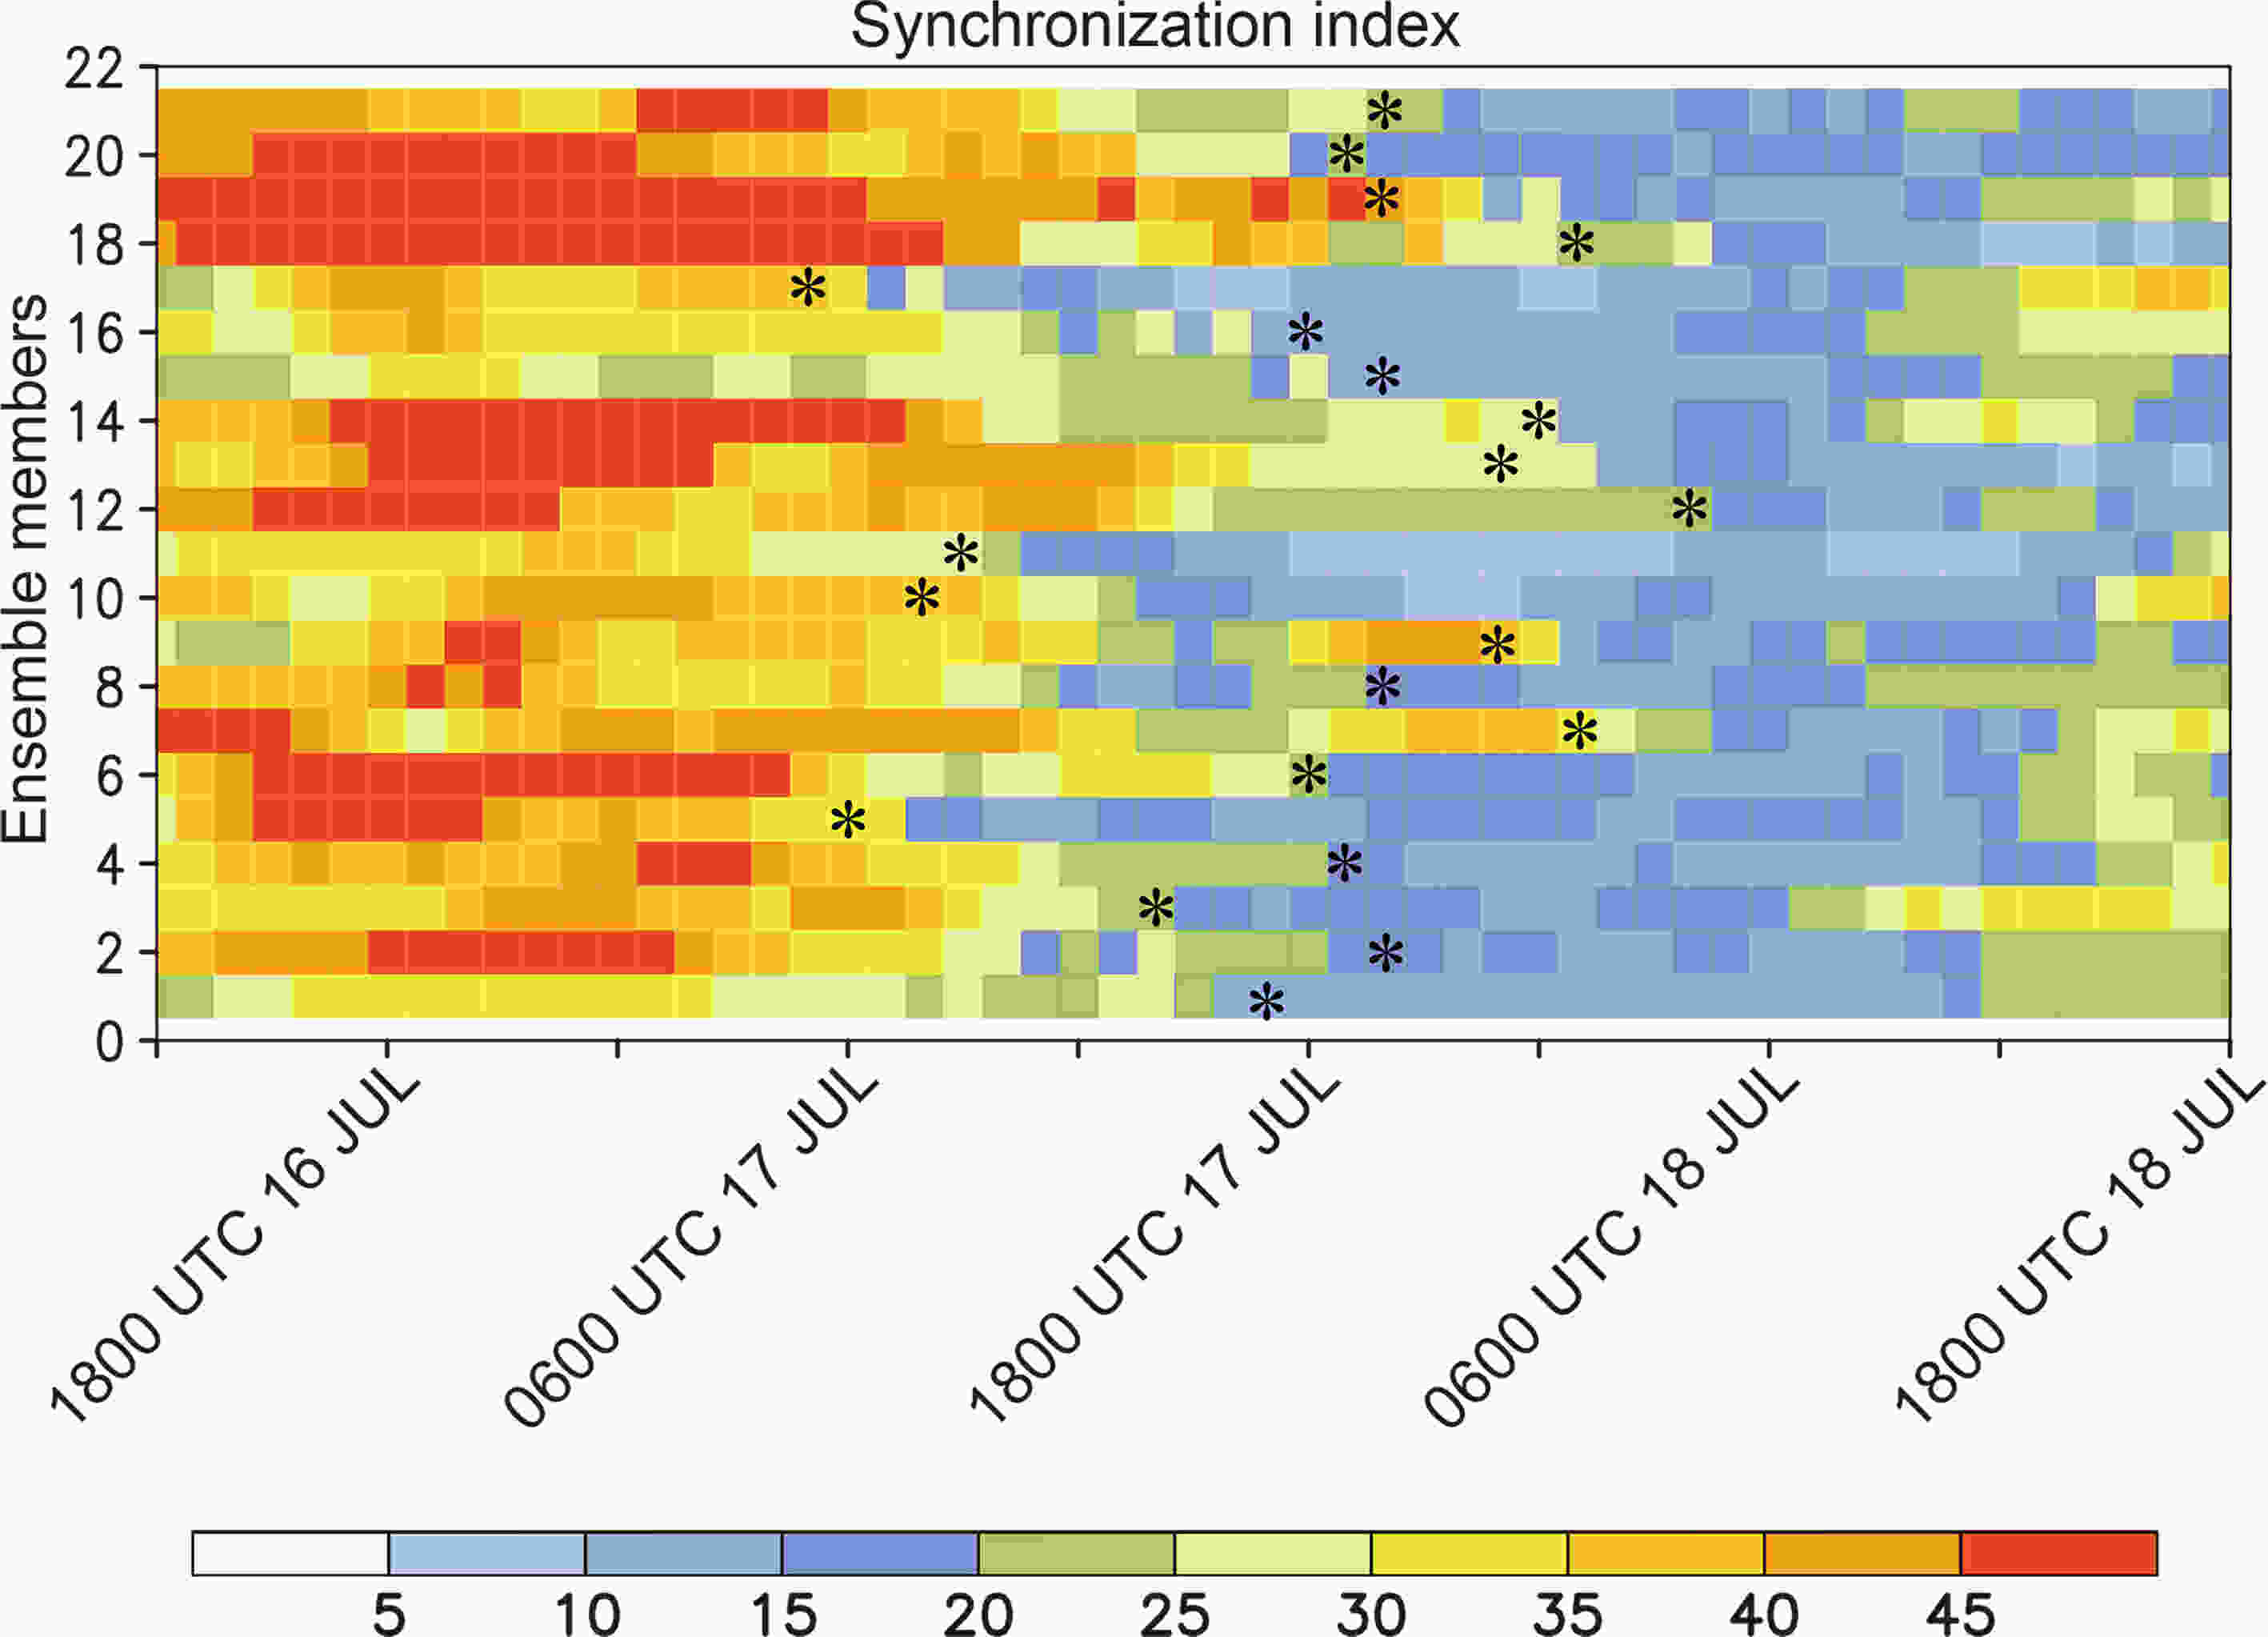 Figure16. Time series of the Synchronization Index (%, see text for definitions) for each ensemble member. Intensity change for each member can be seen in Fig. 2. The * symbol denotes RI onset for each member.
where A is the upshear semicircle with the upper-level RMW and B is the upshear semicircle with the midlevel RMW. The vortex becomes upright with the decreasing vortex tilt magnitude and the size of the circulations at mid and upper levels when the deep convections develop over the downshear sector and wrap inward to the mid RMW to form the ICB in the upshear flank. So, for vertical coherence of the circulation, we require SI to be small. The SI presented here is based upon our analysis of an ensemble of RI forecasts for one case study, and no doubt requires refinements and assessment in many more simulations of RI. However, we believe it is a useful way of monitoring vortex structure.
In all these plots, where appropriate, we have color-coded each ensemble member by the intensity changes within a 24-h period commencing 0400 UTC 17 July, as shown in Fig. 2. Throughout these figures, strong intensity is depicted by red (warm) colors, moderate intensity by green?pale-blue (cool) colors, and weak intensity by blue (cold) colors.
Figures 15a and b illustrate the shear versus moisture relationship for all ensemble members and shows a moderate tendency for strong (weak) intensity to be associated with weak (strong) shear and a moist (dry) environment. There are clearly ensemble members (e.g., members 6, 7, 18) with high moisture and moderate shear that do not intensify as rapidly as EarlyRI. So, what additional features are influencing their intensification? We suggest that vortex structure and size may also affect the timing and rapidity of RI. The time series of PW show similar values and patterns of moisture changes over the radii we have chosen for all members. EarlyRI (red curve) is amongst the moister in the lead up to RI, while LateRI (blue curve) is amongst the driest, but eventually moistens in the time leading up to its late RI.
Figure 15c shows the variation of midlevel inner-core size, as indicated by the RMW, versus VWS, again color-coded by intensity change. RMWs vary between about 50 and 90 km. Circulations in strong shear have systematically larger inner cores and are slower to intensify, while circulations in weak shear generally have a smaller inner core. Interestingly, however, circulations in strong VWS generally have a larger upper-level inner-core, possibly associated with larger vortex tilt (Fig. 15e). The values are of course larger than at low levels, varying between 60 and 100 km. The smaller low-level circulations find it easier to intensify since the inertial stability at the RMW might be larger than that for large circulations of similar intensity (Hack and Schubert, 1986). As noted above, however, that does not guarantee RI. That is, RI seems dependent not only on VWS and moisture but also on horizontal and vertical vortex structure. The time series of mid- and upper-level RMWs indicates that LateRI initially has one of the largest mid- and upper-level circulations. As the RI develops, the circulations contract. LateRI is amongst the smallest circulations at both levels and they actually increase in size before the inward contraction commences late into the forecast. The results from the ensemble members are somewhat consistent with the results from Stern et al. (2015), who suggested that the secondary circulation induced by eyewall heating leads to RMW contraction and TC intensification.
To assess the importance of vortex structure on RI, Fig. 16 shows time series of the SI parameter for each ensemble member. Note first that RI occurs for each member very close to the time that the SI is transitioning to low values (blue colors). This indicates the vertical alignment of the RMWs and the development of an ICB that wraps around the inner core to form the eyewall cloud over the upshear-left flank. Members with large SI values (and strong shear) generally intensified the least. See also the SI curves from the EarlyRI and LateRI members. The diagram sheds some light on the ensemble members that show similar values of shear and moisture to EarlyRI, but do not intensify so rapidly. Examination of the time series of SI indicates that throughout the forecast these ensemble members always had small values of SI, while EarlyRI commenced with large values of SI, which rapidly reduced as RI developed. Physically, SI is a measure of the vertical organization of the circulation. EarlyRI was initially highly tilted in moderate shear with large convective asymmetries. The less rapidly intensifying members were much less tilted in weak shear and had a lesser tendency for strong convective asymmetry to the southwest—the downshear quadrant. This region is the source region for the inward-propagating ICB, which wrapped into the center to form the eyewall cloud. In weak shear or with large ventilation, the circulation was unable to develop the large convective asymmetry to the southwest of the center, and the important ICB. It suggests that some moderate shear (around 7.5 m s?1) is needed to establish optimum conditions for RI. A similar result of moderate shear was also obtained in the numerical study by Wong and Chan (2004) and the observational study by Molinari et al. (2013). Our results offer a possible physical mechanism for this observational result. However, from the ensemble it seems that an additional uncertainty in diagnosing influences on RI is vortex structure size. It seems reasonable to suggest that different structures in the same shear will respond in different ways. So, there appears to be a requirement for consistency between the shear and vortex structure size to achieve RI. Precisely what defines the differing vortex structure is unclear.
We hypothesize that: (1) some moderate VWS provides (i) favorable conditions for strong ascent over the downshear sector of the circulation, and (ii) earlier synchronization between the mid- and low-level circulations; (2) such structures are favorable for the development of an inward-penetrating ICB that eventually forms the eyewall cloud; and (3) high environmental moisture minimizes ventilation to allow uninhibited deep convection over the downshear sector and the developing eyewall.
Finally, there appears to be a reasonably well-defined phase space of environmental shear, moisture (ventilation), and vortex inner-structure that are optimal for the RI. We can only speculate on if and how these circulation features are linked. We plan to study this aspect as part of our follow-up work.
We show that the basic difference stems from quite subtle differences in initial conditions with regard to (1) environmental winds and shear, and (2) midlevel moisture and ventilation. We then describe how these differences impacted on the evolving storm structure, including the kinematics and cloud asymmetries.
We show that for the ensemble member that forecast an early RI:
(1) Initially in strong easterly shear, inhibition of ascent in the upshear sector allowed moistening of the boundary-layer air in that region, which was transported to the downshear sector to feed a developing convective asymmetry.
(2) With high environmental moisture and weak ventilation, undiluted clouds and moisture at outer radii from the downshear-left quadrant, wrapped inwards to the upshear-left quadrant as an inner cloud band, and to inside the RMW at low levels, to initiate the eyewall cloud. In contrast, the late RI member showed larger ventilation, smaller environmental moisture and lower values of low-level θe over the downshear-left sector.
(3) The development of the eyewall cloud occurred as a convective band wrapped inward from the downshear-left sector. This seemed related to the vertical alignment of the sheared circulation, in particular the alignment of the RMWs vertically over upshear quadrants. The relative sizes of the inner core at low and mid levels may also provide another source of uncertainty for RI, since the vertical synchronization of the RMWs will be dependent on these size factors.
(4) The eyewall cloud continued to develop episodically via this process as it wrapped around the low-level circulation.
We have illustrated that the forecast evolution in vortex cloudiness was similar to the actual cloud imagery. For the member that forecast a much-delayed RI, larger shear and ventilation inhibited the developments described above. We have demonstrated that relatively low-θe air in the boundary layer was correlated with the downward flux of low-θe air, which we attribute to convective downdrafts associated with intrusion of relatively low environmental moisture, relatively large shear and ventilation. This low-θe air wrapped into the inner circulation to delay the onset of RI. Once these inhibiting factors decreased, the RI was able to proceed in a similar fashion, but at a much later time, to that in EarlyRI.
Based on the analysis of the ensemble of forecasts we propose the following tentative hypothesis of the RI: (1) The vortex should extend in the vertical to midlevels (i.e., a quite strong vortex) to allow the following scenario to occur. (2) An environmental wind profile that is nearly constant up to midlevels and then starts to shear above this level provides (i) favorable conditions for strong ascent over the downshear-left sector at radii beyond the RMW, and (ii) vertical synchronization of the circulation, and particularly the RMWs over the upshear sector, to build an inward-penetrating inner cloud band that becomes the eyewall cloud. (3) Large environmental moisture (and some shear) minimizes ventilation to allow convection to be active over the downshear-left sector and within the developing eyewall.
We suggest that a relatively narrow range of environmental wind shear, moisture and vortex structure characteristics seem necessary to create conditions of (1) preconditioning, (2) downshear convective asymmetries, and (3) favorable vertical alignment of the circulation, to allow the processes described above to develop. As in earlier work, the study also highlights the need for ensemble prediction for improved forecast guidance of RI. The differences in environmental shear, moisture and vortex structure are relatively small and within the analysis errors of the initialization. At this point in time, ensemble initialization and prediction seem the most practical way of dealing with the uncertainties.
We plan to extend the study by making further analysis and budgets from the members, to better understand the processes that influence RI.
Acknowledgements. We thank the Bureau of Meteorology (BoM) for providing the OceanMaps 2.0 dataset. The OHC data were derived from this dataset with the help of the first author’s colleagues Wei YANG, Yumei LI and Xiao FENG. We also thank Drs. Charmaine FRANKLIN, Jeffrey KEPERT and Hongyan ZHU of the BoM R&D Branch for their valuable comments. The anonymous reviewers provided very insightful comments, which were challenging, but very much improved the manuscript. The research was partially supported by the National Natural Science Foundation of China (Grant Nos. 41365005, 41765007 and 41705038), the Hainan Key Cooperation Program (Grant No. ZDYF2019213), and the Natural Science Foundation of Hainan Province of China (Grant No. 417298). The manuscript was prepared while the first author was a visiting scientist at the BoM.
