HTML
--> --> -->Heavy snow is frequent in regions of China during wintertime, such as the Tibetan Plateau, Xinjiang, Northeast China, Shandong Peninsula, and even low-latitude South China. Research on heavy snow events in China began in the 1970s, and early work mainly involved synoptic-scale studies. For example, Zhu and Shou (1994) studied the formation of a secondary circulation along the fronts of winter heavy snow events. Tao and Wei (2008) researched the continuous occurrence of freezing rain and snow in southern China from mid-January to early February 2008 and discovered that this persistent precipitation resulted from the activity of a cut-off low from Europe and the transport of abundant warm and moist air from South China Sea, forming a melting layer in Southern China. Since the late 20th century, increasing attention has been paid to the mesoscale features of snowfall with the development of numerical models and observation techniques. Asuma et al. (1997) focused on the properties of winter monsoon clouds using dual-polarization Doppler radar data, and Wang and Cheng (2000, 2001) indicated that the snowstorm of January 1996 developed under symmetric instability (SI) conditions based on mesoscale model simulations.
Nevertheless, previous studies focused mainly on snowfall events with long durations and significant accumulation. In recent years, snow squalls or snow bursts that are characterized by short durations but heavy snow received more attention. The concern of such events stems from the fact that they usually do not meet the warning criteria but frequently create hazardous weather. As one type of a linear convection event, snow squalls share some common characteristics with warm season squall lines and may lead to extremely low visibility as well as hazardous driving conditions (Pettegrew et al., 2009). Market et al. (2002) presented a climatological analysis of thundersnow and showed that most thundersnow events in U.S. are associated with a transient mid-latitude cyclone, whereas the remaining events correspond to orographic forcing, lake effect snow, or, on rare occasions, fronts. Liu and Moore (2004) studied the climatic characteristics of lake effect snowstorms in southern Ontario, Canada, during 1992?99, and noted that lake effect snow occurred in the presence of steep lapse rates and subsequent CI. Pettegrew et al. (2009) researched a winter convection case in the Midwestern United States that produced 4 cm of snow in a short time and created near-whiteout conditions; the shallow forced convection was related to frontogenesis and convective instability in a sheared environment. Milrad et al. (2014) compared two snow bursts that were not associated with lake effect or mid-latitude cyclones, thus providing a good comparison of different types of instabilities which exist in unsaturated and saturated environments.
The above studies greatly enhance our understanding of both the short duration and the persistent heavy snow events, which are beneficial for improving predictive skill. Nevertheless, to the best of our knowledge, within the literature published in China, research involving frontal snowsqualls or snow-burst events in the cold season is still limited despite the fact that hazards induced by them are comparably great, such as the case we will study in this paper. A snow burst event occurred in Northeast China on 26–27 January 2017. During this event, more than 12-mm snow fell in a very short period of time without an adequate forecast or advance warning. As a result, 12 multicar collisions were reported on several highways around Harbin (news from
Observations shown in Fig. 1 show a snow burst that was associated with a cold-frontal snowband, which formed along the foothills of the Dahingganling Mountains and then moved eastward, before encountering the high and complex terrain of the Changbai Mountains. Heavy snow was produced on the windward side and over the Changbai Mountains, shown by the distributions of the three snowfall centers during the event in Fig. 1: Jilin center in Jilin Province (10 mm, red dot, 43.8°N, 126.5°E); Benxi center in Liaoning Province (12.3 mm, purple dot, 41.3°N, 123.7°E; and centered on the border of Liaoning and Jilin Province (denoted as “BLJ”, 6.2 mm, yellow dot). The question then arises: How was the snow burst produced in those snowfall centers under the influence of complex terrain?
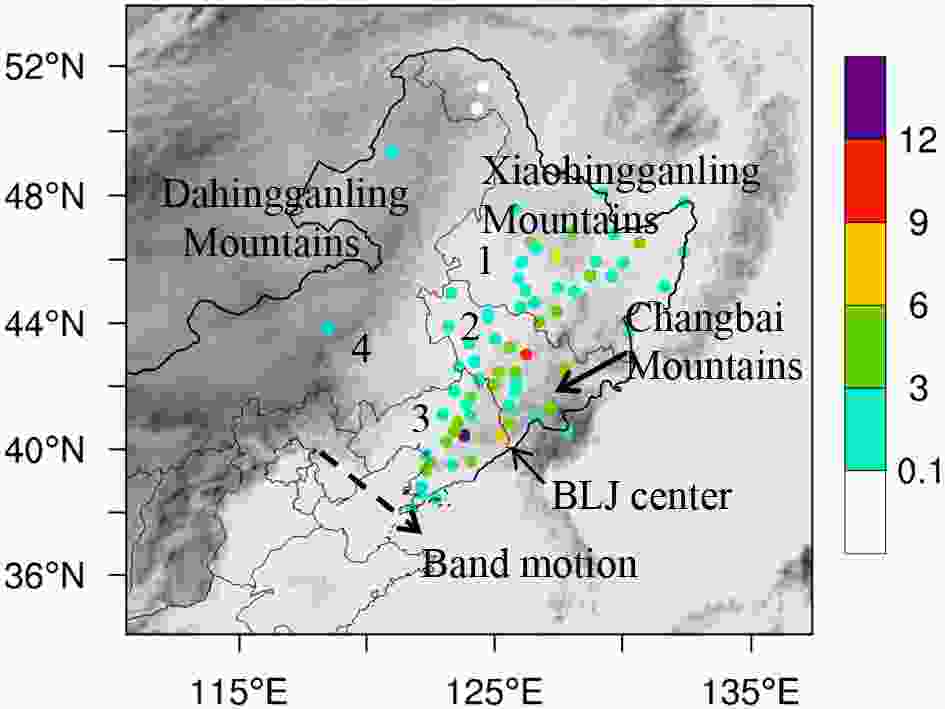 Figure1. Observed cumulative liquid-equivalent precipitation (color dots, units: mm) over 24 hours ending at 0000 UTC on 27 January and the terrain height (shaded, units: m) in Northeast China. The numbers “1”, “2”, “3” and “4” respectively indicate Heilongjiang Province, Jilin Province, Liaoning Province and Inner Mongolia. Dotted arrow indicates the direction of the band motion. Red dot in Jilin province, purple dot in Liaoning province and yellow dot on the border of Jilin and Liaoning province (BLJ) respectively indicate the three snowfall centers of the snow burst.
The importance of orography upon the distribution of snowfall has long been recognized and explored. Adhikari and Liu (2019) analyzed the global geographical distribution of thundersnow events using four years of observations from the Global Precipitation Measuring Mission Ku-band radar. It was found that mountainous regions such as the Himalayas, Tibet, the Andes, and the Zagros have highest-frequency of thundersnow events, but they also occur in continental and coastal regions.
Extensive studies have been conducted concerning the orographic enhancement of summer rainfall, however investigations regarding the orographic enhancement of snowfall during cold seasons are much less, especially ones that focus upon the explicit mechanism by which—the orography increases the snowfall. However, the orographic enhancement of both summer rainfall and cold season snowfall share many similar physical processes such as the orographic lifting, orographic frontogenesis and convergence, and the “seeder-feeder” mechanism. Schumacher et al. (2010) analyzed two different kinds of snowbands downstream of elevated terrain initiated by both surface and elevated frontogenesis; notably, the major bands were maintained by moist conditional symmetric instability (CSI) or dry SI and IIs on the right exit region of a jet. Schumacher et al. (2015), a follow up to Schumacher et al. (2010), studied the effect of upstream terrain as it relates to the occurrence and intensity of the bands. Nevertheless, most of the studies have emphasized the passive effects of orography to weather systems while the possible interactive influence of passing weather systems upon orographic processes, which may also play a role to enhance the precipitation, is mostly ignored.
In this paper, the mechanism that induces the snow burst on 26?27 January 2017 in Northeast China is investigated using the output of a high-resolution numerical experiment and a parallel sensitivity experiment that removes the downstream Changbai Mountains. The purpose of the sensitivity experiment is to separate the processes associated with the cold front and those associated with the orography in order to ascertain: (1) to what extent that the orography enhances the snowfall to produce the snow burst; (2) the process that supports the snowband development without terrain; and (3) the net orographic effects and their role on the enhancement of snowfall over complex terrain. In particular, the interactions between the cold-frontal snowband and orography is emphasized.
In this paper, section 2 describes the large-scale environmental settings of the snow burst which occurred on 26?27 January 2017 in Northeast China that is central to this study. Section 3 introduces the details and configurations of the high-resolution numerical simulation and the nature of the parallel sensitivity experiment of the snow burst, and, furthermore validates the control experiment and analyzes the extent to which that the orography enhances the snowfall. Section 4 analyzes the output data which sheds light upon the physical mechanisms responsible for the snow burst associated with the interaction of the cold-frontal snowband and orography. Finally, section 5 provides a summary of the work.
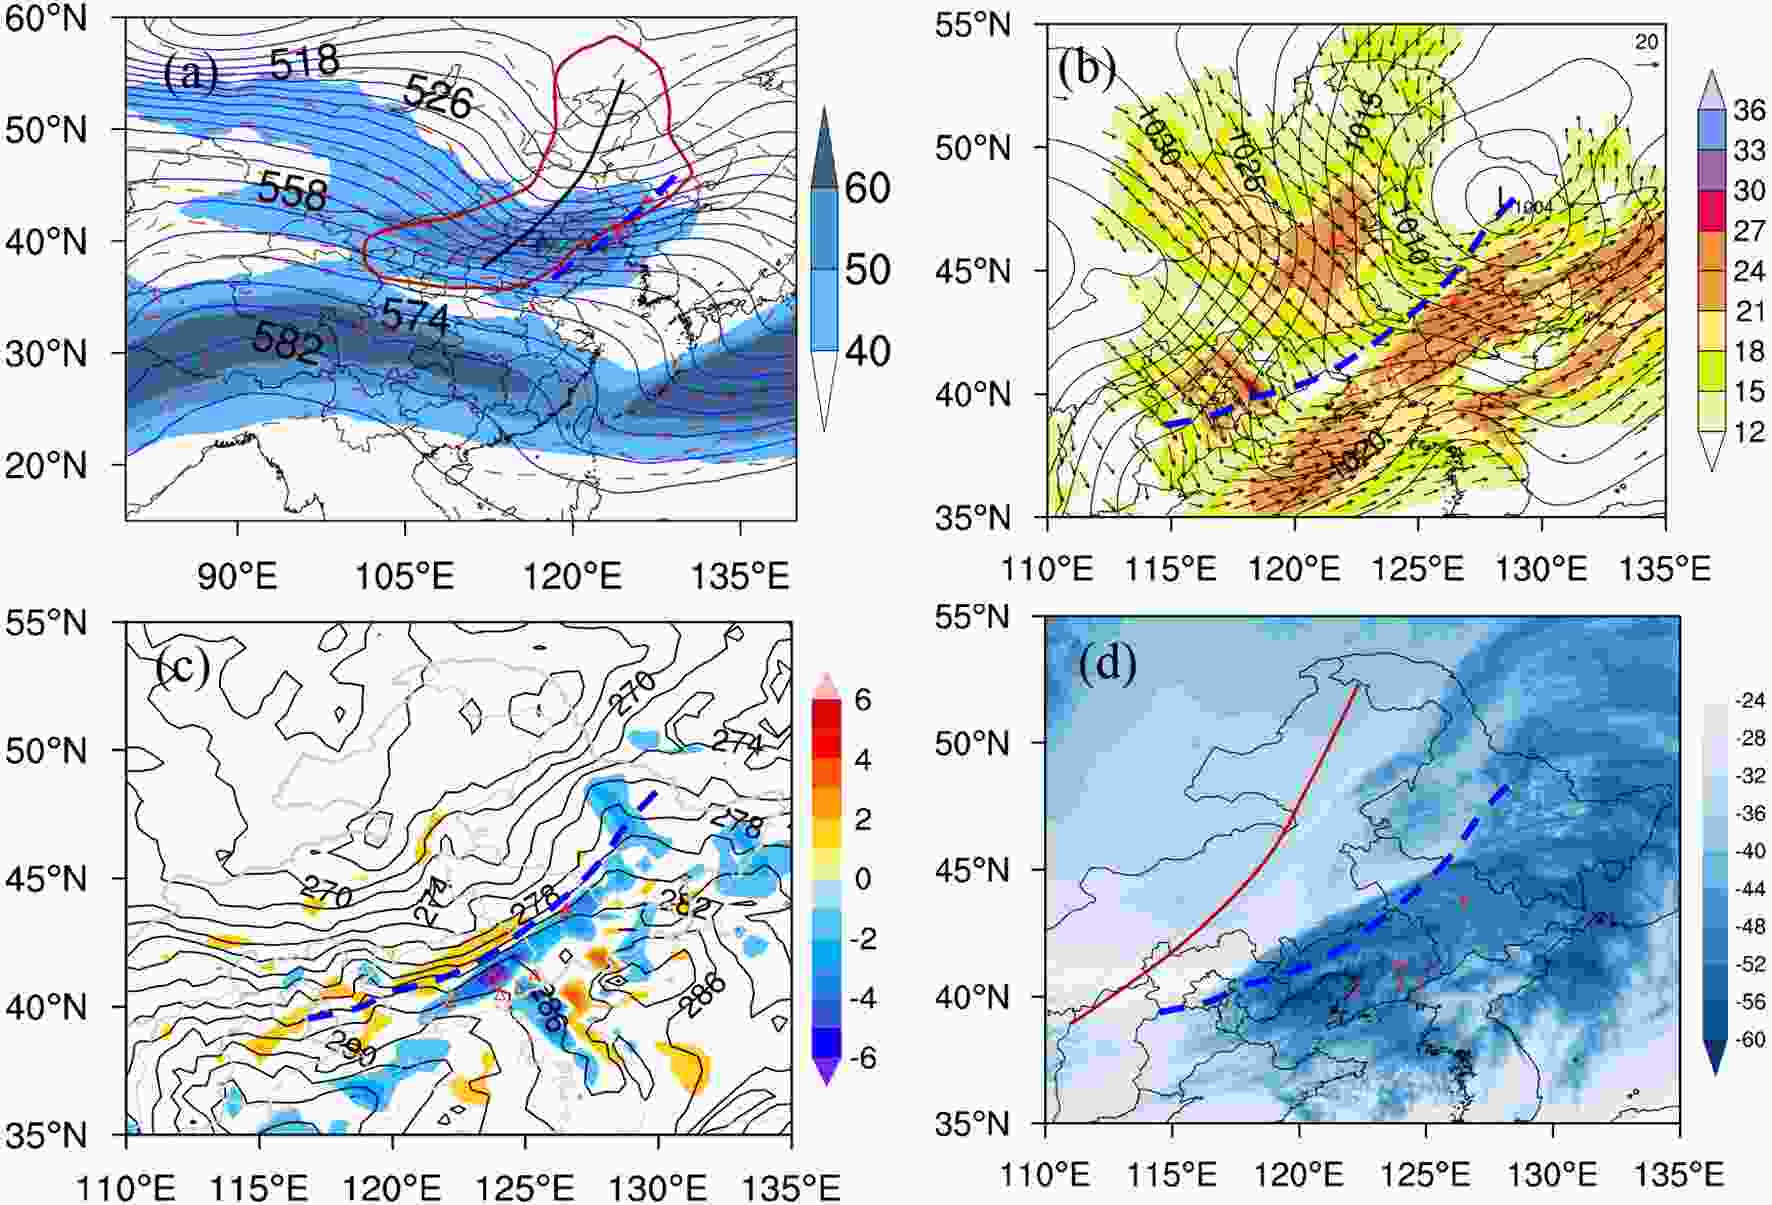 Figure2. (a) Geopotential height (solid blue lines, units: 10 gpm) and temperature (dashed red lines, units: °C) at 500 hPa and wind speeds greater than 40 m s–1 at 200 hPa; (b) sea level pressure (solid lines, units: hPa, interval: 2.5 hPa) and wind vectors with wind speeds (colored shading) greater than 12 m s–1 at 850 hPa; (c) equivalent potential temperature (solid lines, units: K, interval: 2 K) and water vapor flux divergence [shaded areas, units: 10–5 g (hPa m2 s) –1] at 850 hPa analyzed from GFS at 0600 UTC on 26 January 2017; (d) TBB observed by Himawari satellite at 0600 UTC 27 January 2017. The thick black line in (a) is the 500-hPa trough; the dotted blue lines in (a)–(d) are the cold front; the area enclosed by the red solid line in (a) is the cold advection area. The red triangles indicate the ten stations with the largest snowfall totals from 0600 to 1200 UTC on 26 January 2017 to denote the snowband regions.
Figure 2 presents the large-scale environment of the snowband, where the gridded surface and mandatory level analyses were taken from the Global Forecasting System of the National Centers for Environmental Prediction (NCEP/GFS), which has a horizontal grid spacing of

At the surface, Northeast China was under the influence of an extratropical cyclone, whose center was located over Heilongjiang Province (Fig. 2b, see number “1” in Fig. 1), and the cold front extended equatorward from the low-pressure center. A comparison between Fig. 1 and Fig. 2 indicates that the snowfall over the Xiaohingganling Mountains in northeastern Heilongjiang Province was caused by the above-mentioned cyclone, whereas the snowfall in Jilin and Liaoning Provinces (respectively number “2” and “3” in Fig. 1) was due to the cold front. In this paper, we focus predominantly on the snowband along the cold front.
The low level, 850 hPa, analysis reveals that the cold front exhibited strong cyclonic wind shear over Northeast China (Fig. 2b). The low-level jet (LLJ) formed by the southwesterly wind in the warm sector of the cold front stretched over the eastern part of Northeast China with a maximum wind speed reaching 27 m s?1. This LLJ transported adequate heat and water vapor to Northeast China and provided for strong convergence upon collision with the cold, dry northwesterly flow from high latitudes behind the front. As shown in Fig. 2c, water vapor strongly converged along the cold front in the warm sector, with the largest water vapor flux convergence associated with the largest amount of snowfall (indicated by red triangles which denote stations with the largest snowfall totals observed during 0600?1200 UTC on 26 January 2017).
The satellite imagery (Fig. 2d) at 0600 UTC 27 January 2017 also indicated a convective banded structure. One can find two relatively isolated convective bands, which are moving toward the Northeast China and corresponded with the dual snow-bands mentioned next in Fig. 3a.
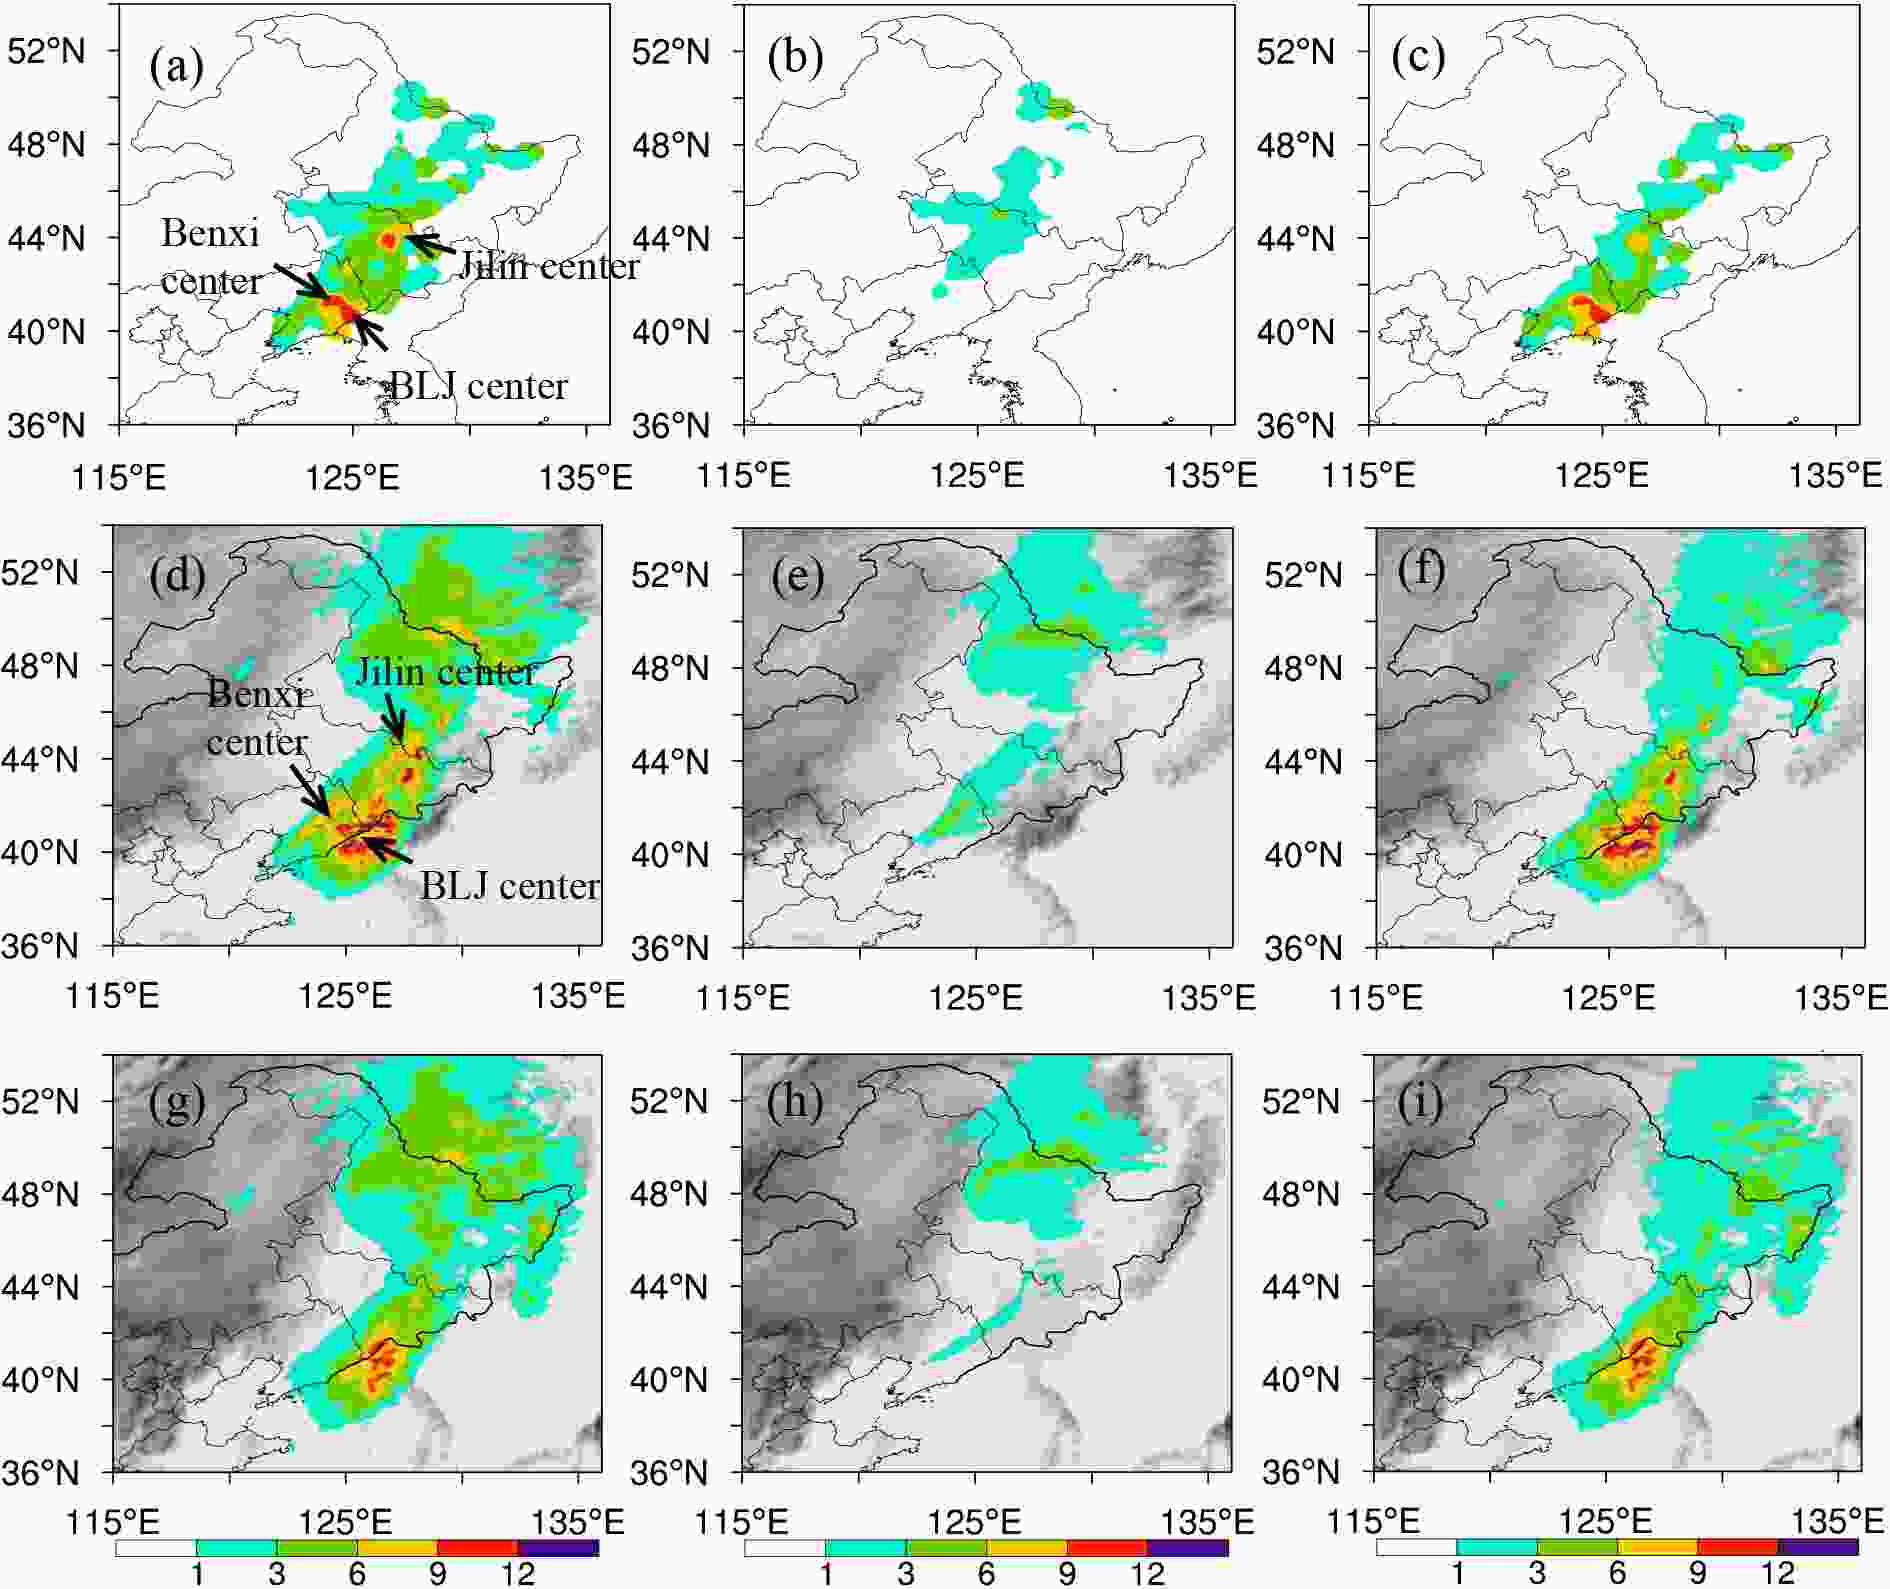 Figure3. Cumulative liquid-equivalent precipitation (units: mm) from observations (first line), the CTL experiment (second line) and TRNP experiment (third line): (a, d, g) 0000?1200 UTC, (b, e, h) 0000?0600 UTC, and (c, f, i) 0600?1200 UTC on 26 January 2017. The gray shaded areas in the simulation are terrain heights. The observations were obtained by interpolating the station data to the set of 0.1°×0.1° grids.
From the above synoptic scale analysis, the snow burst in Northeast China on 26 January 2017 (UTC) was mainly caused by an eastward-moving cold front. The along-front snowband occurred primarily in the warm sector of the cold front, where there was a strong LLJ and considerable moisture convergence. The snowfall centers (red, purple and yellow dots in Fig. 1, see introduction) tended to occur on the windward side of the Changbai Mountains. To explore the details of the combined effects of the front and complex terrain to produce the snow burst and thus reveal the occurrence mechanisms of the snow burst, high-resolution numerical experiments (including control and sensitivity experiments) of this case are conducted in the next section.
3.1. Model configurations
Version 3.8.1 of the Advanced Research Weather Research and Forecasting Model (WRF-ARW; Skamarock et al., 2008) was used to simulate the 26?27 January 2017 snowburst event at convection-appropriate resolutions. The model contained only one domain, which included all of Northeast China and the surrounding regions (34°?54°N, 110°?138°E). The model center was located at 45°N, 124°E, and the horizontal grid spacing was 4 km. The number of horizontal grid points was 641×561, and the terrain-following vertical coordinate, sigma, had 51 vertical levels from the surface to 50 hPa, with more vertical levels near the surface and fewer levels aloft (Laprise, 1992). The Community Atmospheric Model (CAM) scheme (Collins et al., 2004, NCAR Tech Note) was employed for longwave and shortwave radiation; in addition, the Pleim-Xiu Land Surface Model (PX LSM) (Pleim and Xiu, 1995; Xiu and Pleim, 2001) and the Asymmetrical Convective Model, version 2 (ACM2) planetary boundary layer (PBL) (Pleim, 2007) were used. The precipitation process in the model was represented by the Morrison double-moment scheme (Morrison et al., 2009). The hourly fifth global climate reanalysis produced by European Centre for Medium-Range Weather Forecasts (ERA5/ECMWF) with a horizontal grid spacing of 0.25°×0.25° and a vertical resolution of 37 levels was used to initialize the model and produce lateral boundary conditions at 3-h intervals. The experiment was initialized at 1200 UTC on 25 January 2017 and integrated for 24 h. History files were generated once an hour.On the basis of the above control simulation with full terrain (denoted as "CTL"), one idealized experiment is further conducted (denoted as "TRNP"). All configurations in the TRNP experiment are the same as the CTL experiment except that all the terrain height greater than 200 m in the Changbai Mountains are set to be 200 m to remove the effects of Changbai Mountains in TRNP (200 m is the mean elevation of the plains in Northeast China). Through this simple sensitivity experiment, one can basically separate the component of snowfall that was attributed solely to the cold-front and thus ascertain to what extent the orography enhanced the snowfall. Additionally, the physical processes associated with the cold front and the orography can be distinguished and roughly separated.
2
3.2. Validation of the control simulation
Figure 3 illustrates the simulated output of cumulative liquid-equivalent precipitation for both the CTL and TRNP experiments for comparative purposes. Since little precipitation fell after 1200 UTC on 26 January within Northeast China, only the precipitation from 0000 to 1200 UTC is shown. Figures 3a-c were obtained by interpolating the station observations into a set of 0.1°×0.1° grids. Due to the interpolation, the location of BLJ center in Fig. 3a is a little different from that in Fig. 1. Figures 3a-f can be used to validate the performance of the simulation while Figs. 3d-i can be used to analyze the enhancement of the snowfall due to the complex terrain.Through a comparison of Figs. 3a and 3d, the CTL simulation reproduced the observed snowfall very well, including the detailed banded structure of the precipitation and the three snowfall centers within the snowband. As shown in Fig. 3d, both the Jilin center and the Benxi center were encompassed by narrow small-scale bands (approximately 300 km long and 30 km wide) within the overall snowband; the Jilin center even exhibited a double-banded structure. Notably, the BLJ center was quite evident in the simulation results, as it exhibited a cellular precipitation structure that extended beyond China. The much larger extent of BLJ in the simulation compared to that in the observation was likely due to the sparseness of observation stations in the mountains and the lack of observations outside of China (Fig. 1).
In addition to the spatial distribution of the snowband, its temporal evolution was also effectively simulated, as shown in Figs. 3b-c and Figs. 3e-f. During the observational period, snowfall was most abundant during 0600?1200 UTC; the circumstances were the same in the simulation, although the simulated precipitation in the Benxi center appeared earlier than the observed precipitation. Nevertheless, Fig. 3 still validates the accuracy of the model in simulating the snowband. The solid performance of the model implies that the physical processes associated with the snow band were simulated reliably, especially regarding both the mesoscale and small-scale processes that cannot be resolved by reanalysis data.
2
3.3. Enhancement of snowfall by orography
To evaluate the role of orography in producing the snow burst, snowfall amounts and distributions from the CTL and TRNP experiments are compared. From Figs. 3d-f and 3g-i, the snowfall area produced by the cold-frontal snowband does not change much after removing the downstream terrain of the Changbai Mountains. However, the snowfall intensity is significantly influenced. In Fig. 3g, all three snowfall centers in Jilin and Liaoning provinces are greatly reduced, especially the Benxi Center in Liaoning Province. Comparison between Figs. 3e-f and 3h-i indicates that the 0600?1200 UTC snowfall contributes to the difference between Figs. 3d and 3g, a time when the snowband was just becoming active over Changbai Mountains. This indicates that the orography of the Changbai Mountains plays an important role in inducing the snow burst or creating heavy snowfall centers.To quantitatively evaluate to what extent orography effects enhance the snowfall, Table 1 calculates the numbers of grids within the snowband region for different snowfall intensities. The results of Table 1 are consistent with Fig. 3d-i in that the snowfall area greater than 3 mm (12 h)?1 does not appreciably change in the CTL and TRNP experiments. However, when comes to the > 6 mm and > 9 mm snowfall areas, the orographic effects are quite evident. They contribute 49.7% to the 12-h snowfall greater than 6 mm compared to 26.8% of the cold front, and contributes 66.1% to the 12-h snowfall greater than 9 mm compared to 7.4% of the cold front.
| 0000?1200 UTC snowfall | CTL | TRNP | Orographic effects (CTL?TRNP) |
| > 3 mm | 51301 | 48452 | 2849 |
| > 6 mm | 13599 | 6845 | 6754 |
| > 9 mm | 3382 | 1147 | 2235 |
Table1. Number of grids within the snowband region (36°?46°N, 120°?130°E) for different snowfall intensities
In the following section, we will use the TRNP experiment to analyze the mechanism that supports the snowband development associated with the cold front. Then, by comparing CTL and TRNP experiments, the orographic effects or the interaction between the cold-frontal snowband and orography that intensifies the snowband can be more clearly observed.
4.1. Overview of the snowband
As radar observations were not available to view the snowband development for this case, the simulated composite radar reflectivities are analyzed instead to observe the development process of the snowband. Figure 4 presents the simulated composite radar reflectivity from both CTL and TRNP experiments during the entire snowfall process superimposed upon the terrain around Northeast China. Two types of snowfall structures are found in both experiments: an arc-shaped cellular snow region along the northeastern border of Heilongjiang Province related to the surface cyclone there (Fig. 2b), and a linear, northeast-southwest-oriented snowband that formed along the front that was later influenced by the downstream complex terrain of the Changbai Mountains. The linear snowband, which resulted in considerable snowfall in Jilin and Liaoning Provinces (as shown in Figs. 3d and 3f), is our focus.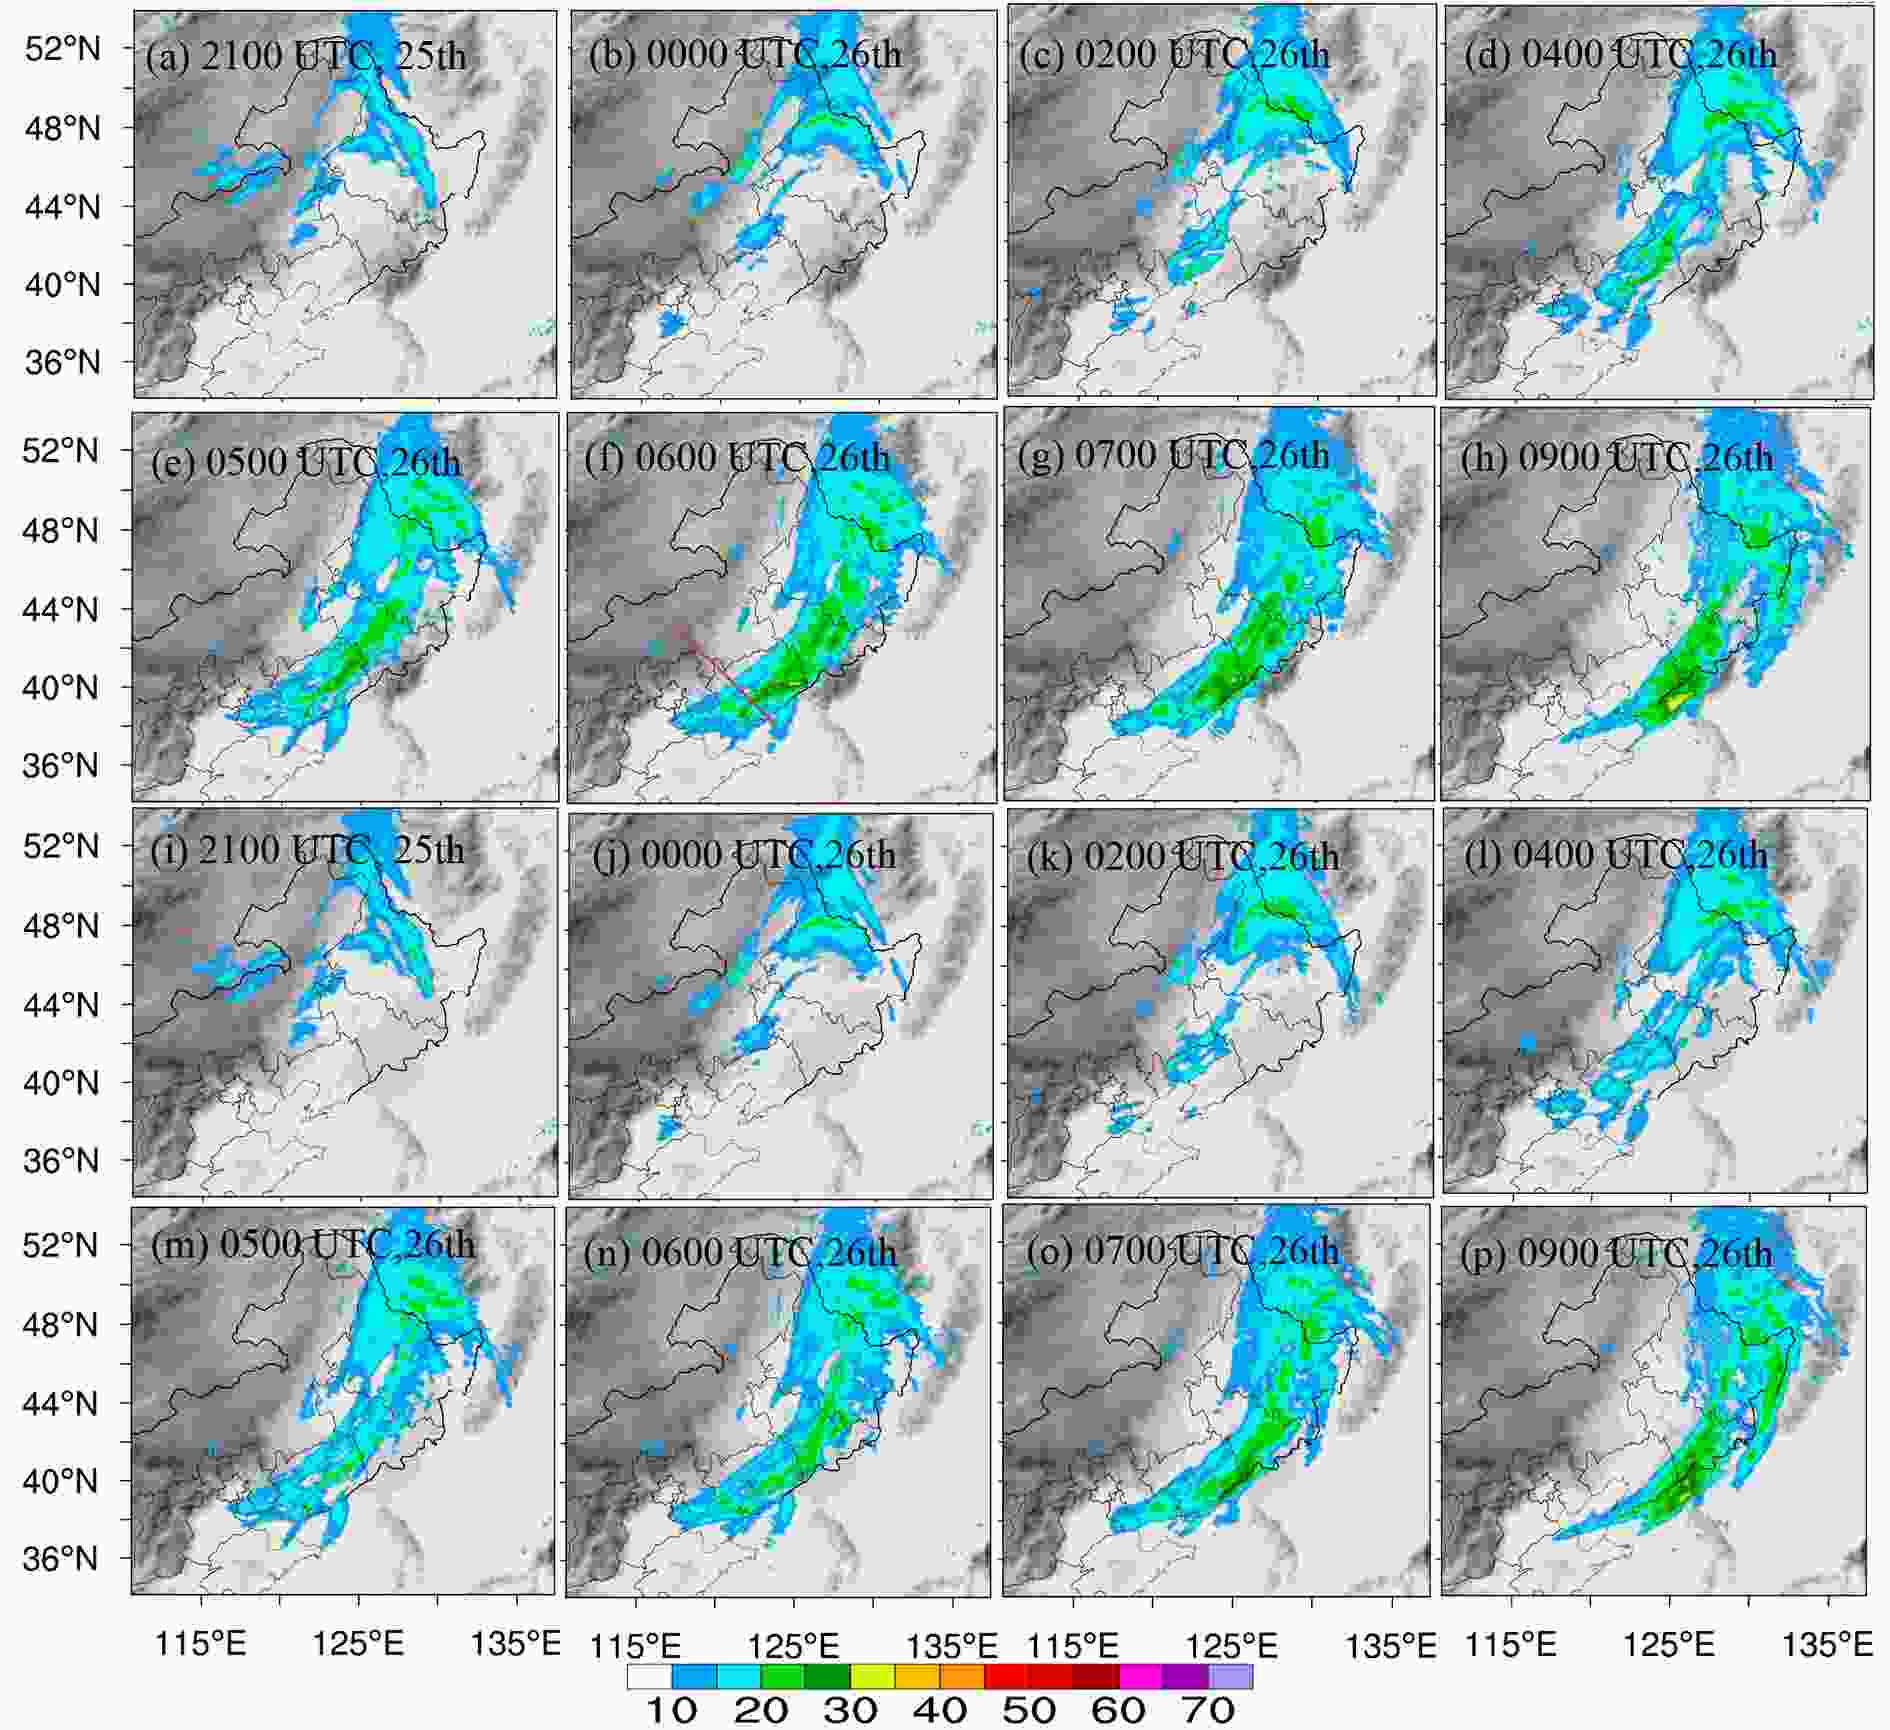 Figure4. Simulated composite radar reflectivity (colored shading, units: dBZ) and terrain height (gray shading, units: m) on 26 January 2017: (a?h) the CTL experiment; (i?p) the TRNP experiment. The red line in Fig. 4f indicates the line for the following vertical cross sections.
Figures 4a-h clearly display how the snowband was initialized and organized as well as how it developed while moving eastward and climbing over the mountains. The snowband was initiated from a narrow convection line along the foothills of the upstream terrain of the Dahingganling Mountains at approximately 2100 UTC on 25 January. In the first few hours (Figs. 4a-c), these convective lines moved southeastward slowly and produced weak snowfall. This process was observed to be the initial stage of snowband development, when the upstream terrain influenced the band evolution. At 0400 UTC (Fig. 4d), the snowband experienced major development as it approached the Changbai Mountains. Both spatial dimensions, along and normal to the band, grew perceptibly. Since 0400 UTC (Figs. 4d-h), the snowband evidently became organized along the cold front and gradually passed the Changbai Mountains. As shown in Fig. 4f, at 0600 UTC, two double-banded structures existed within the snowband and were distributed in Jilin and Liaoning Provinces respectively; these smaller-scale lines contributed to the large total amount of snowfall during this snow burst.
Compared to CTL, the snowband in TRNP presents a similar development process. Figures 4i-k reflect that the downstream Changbai Mountains do not show evident influence on the initial development of the snowband, which is consistent with the snowfall distributions in Figs. 3e and 3h. After 0400 UTC, it is observed that the effects of the modified terrain to the snowband distribution is small (Figs. 4l-p and Figs. 4d-h). This indicated that orographic effects do not significantly influence the development of the snowband; the mechanism of the initial development mainly comes from the cold-frontal system. However, the area with radar reflectivities greater than 20 dBZ within the snowband is largely reduced when the Changbai Mountains are removed, indicating a constructive role of the complex terrain in enhancing the snowfall intensities (Figs. 4e-f and 4m-n).
2
4.2. Snowband dynamic structure
Before addressing the mechanisms that support the development and intensification of the snowband, Fig. 5 first presents the dynamic structures of the band in both the CTL and TRNP experiments at 0600 UTC, which could help us to more clearly understand its development. As in Fig. 4f, the line, which the vertical-sections go through, crosses the Benxi and BLJ snowfall centers.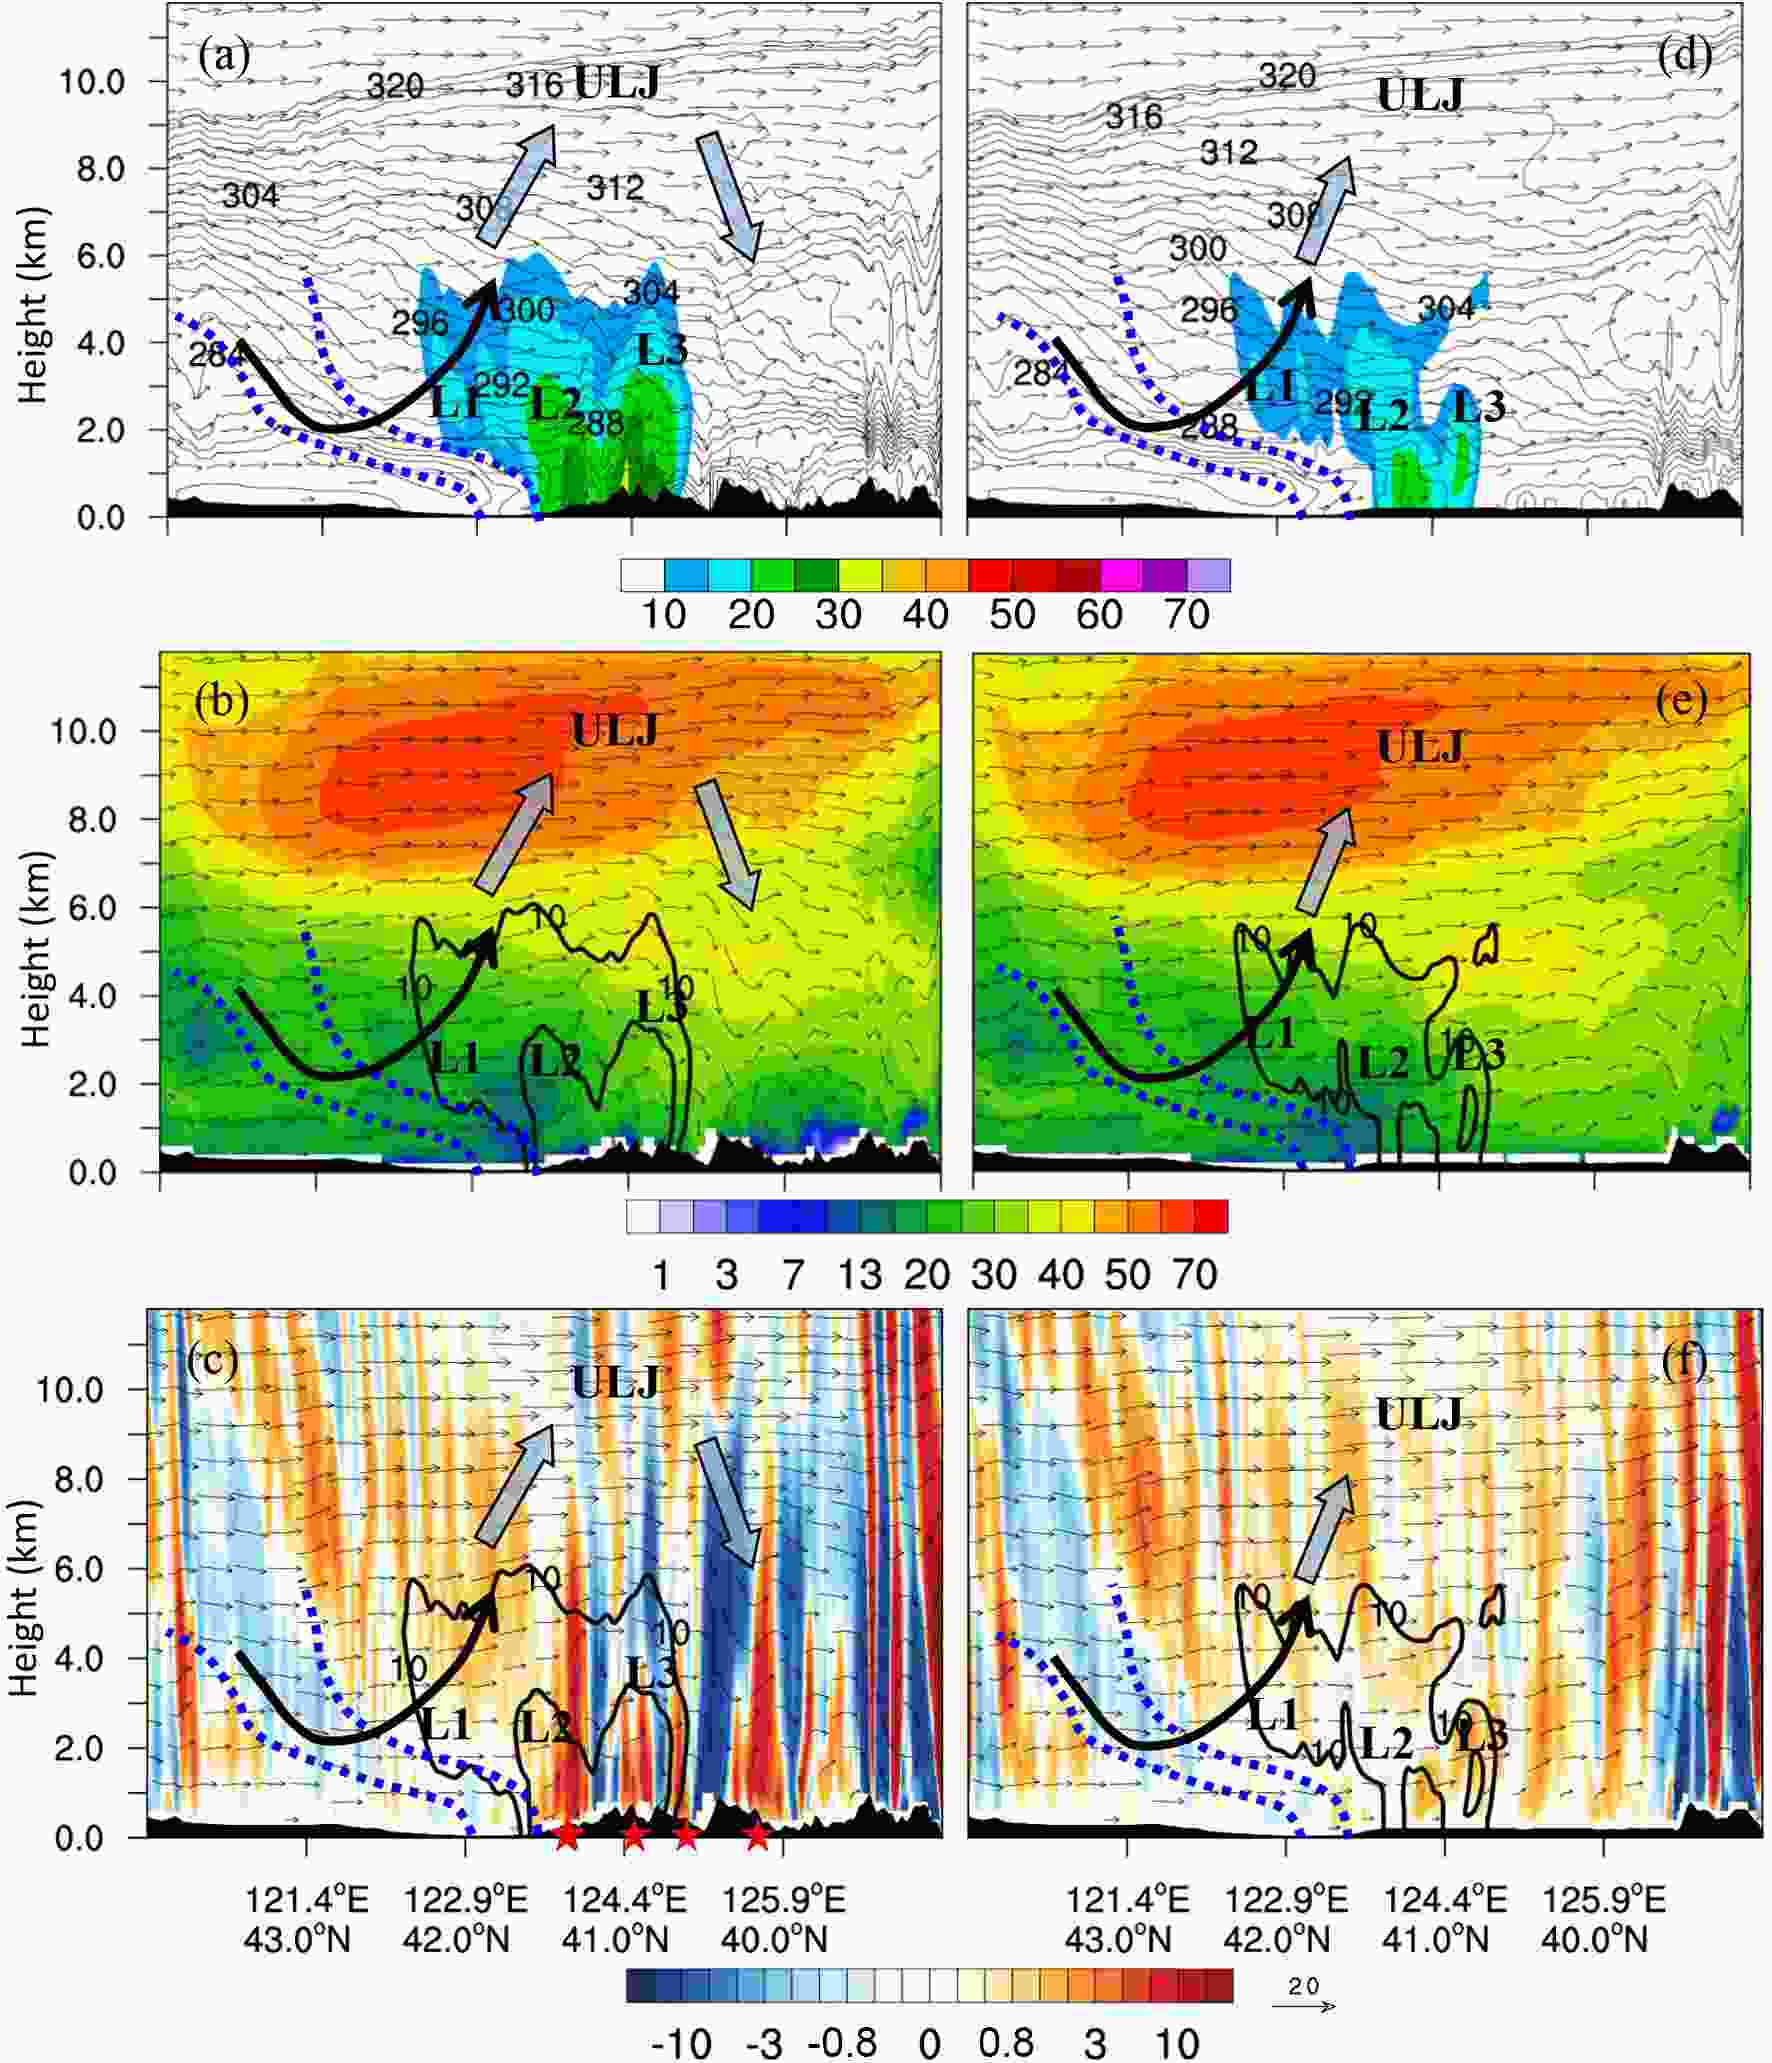 Figure5. Vertical cross-sections of (a, d) the saturated equivalent potential temperature (black solid line, units: K) and simulated radar reflectivity (shaded areas, units: dBZ); (b, e) the total wind speed (shaded areas, units: m s–1); and (c, e) the vertical velocity (shaded areas, units: 10–2 m s–1) along the line shown in Fig. 4f at 0600 UTC on 26 January 2017. The left column comes from CTL experiment, while the right column comes from TRNP experiment. The thick solid lines with 10-dBZ and 20-dBZ radar reflectivities depict the location of the snowband. The symbols “L1”, “L2”, “L3” indicate convective cells. "ULJ" is the upper-level jet. The blue dotted lines indicate the frontal zone. The black curved arrows are the frontal circulation, and the shaded arrows are the ULJ transverse vertical circulation. The red stars indicate locations of ascentassociated with the orographic waves.
In the CTL experiment, as in Figs. 5a-c, an evident transverse vertical circulation associated with the ULJ can be found in the upper levels (shaded arrows). The low-level frontal circulation (thick black curved arrow) was largely influenced by the ULJ transverse circulation. The downward motions (Figs. 5a-b) of the frontal circulation occurred mostly along the saturated equivalent potential temperature surfaces and were confined to the frontal zone (blue dotted lines). The widespread upward motion in the prefrontal areas was combined with the ascending branch of the ULJ (Figs. 5b-c), thus providing a large-scale ascent mechanism for the snowband. In addition to this primary circulation related to the jet-front system, another prevalent flow pattern was present in the form of alternatively distributed rising and sinking motions (Fig. 5c) over the terrain, in the warm sector of the cold front. These motions were generated by the orographic gravity waves when air flows over the mountains. The orographic gravity waves are mixed with the upper-level gravity waves produced by ULJ, forming deep ascending and descending motion over the terrain.
The snowband (CTL experiment), indicated by its high reflectivity values, was located at the leading edge of the front corresponding to a wind shift at low levels. At 0600 UTC, three distinct convective cells can be seen. Each cell, according to its location relative to the front and the topography, had a different dynamic structure. The cell (denoted as “L1”) at the back of the snowband was above the low-level front and featured a slanted ascent embedded within the frontal circulation. Figure 4f shows stratiform precipitation at the back of the snowband corresponding to L1. The cell in the area where the surface front is confronted with topography (denoted as “L2”) includes two different types of ascent: the western part of the cell near the frontier of the cold front displayed a slanted ascent, while the eastern part over the terrain exhibited a nearly-upright ascent (note that the term "upright" here is a relative concept since the vertical velocity increased by a factor of 10). The cell (denoted as “L3”) in front of the snowband was entirely over the terrain with alternatively distributed upward and downward motions.
It is noted that the cells L2 and L3 in Figs. 5a, c, e actually correspond to the smaller-scale convective lines within the snowband in Fig. 4f and they respectively induce the large snowfall of the Benxi and BLJ centers. These cells also appear in the TRNP experiment but with weaker intensities. Upon comparing Figs. 5a, c, e and 5b, d, f the difference of the snowband dynamic structure between CTL and TRNP is mainly attributed to differential vertical velocities. Without the influence of Changbai Mountains, only the frontal circulation is present around the snowband, characterized by slantwise ascent. The alternatively distributed upward and downward motions, due to the orographic gravity waves, are not present in the TRNP snowband.
2
4.3. Snowband maintenance and intensification mechanism over terrain
For banded precipitation related to frontal zones, the CSI associated with frontogenesis-based lifting may be the predominant mechanism for explaining the initiation, organization, and development of the band (Bennetts and Hoskins, 1979). The conditions for CSI require the moist potential vorticity (MPV) to be negative when the atmosphere is inertially and conditionally stable (reviewed by Schultz and Schumacher, 1999). In some cases, when the saturation condition is not satisfied, dry SI and inertial instability (II) can also appear, thereby generating a sloped ascent and initiating a banding structure, as in the cases discussed by Schultz and Knox (2007) and Schumacher et al. (2010). The conditions for II require the absolute vorticity to be negative, while the conditions for dry SI require the atmosphere to be both inertially and gravitationally stable and for the potential vorticity (PV) to be negative.In addition, Schultz and Knox (2007) revealed the simultaneous presence of CI, II and SI in real cases, a phenomenon also discussed by Schumacher et al. (2010). Following Emanuel (1980), Jascourt et al. (1988) defined the coexistence of CI and CSI as convective-symmetric instability, although the mesoscale circulation related to this situation remains unclear. Xu (1986) discussed the interaction between CI and SI in a prefrontal environment and proposed two mechanisms for the development of rainbands based on the sequence of CI and SI: "upscaling" and "downscaling". More recently, Morcrette and Browning (2006) proposed a release of SI caused by ΔM-adjustment, which could also lead to slanted circulation and precipitation bands near fronts.
In this subsection, these mechanisms associated with instabilities and corresponding liftings for banded convection are examined for the current snowband. The criteria used to evaluate the instabilities are as follows:
where


3
4.3.1. Maintenance mechanism of the snowband
Figure 6 presents horizontal maps of the different types of instabilities and frontogenesis at 0600 UTC in both the CTL and TRNP experiments. The right panel of Fig. 6 comes from TRNP experiment for the purpose of examining the mechanism responsible for the maintenance of the snowband. The TRNP experiment is analyzed first, because the main process in maintaining snowband development can be deduced in the absence of orographic effects. Conversely, the orographic effects that enhance the snowfall can also be ascertained by extracting the maintenance mechanism from the CTL experiment.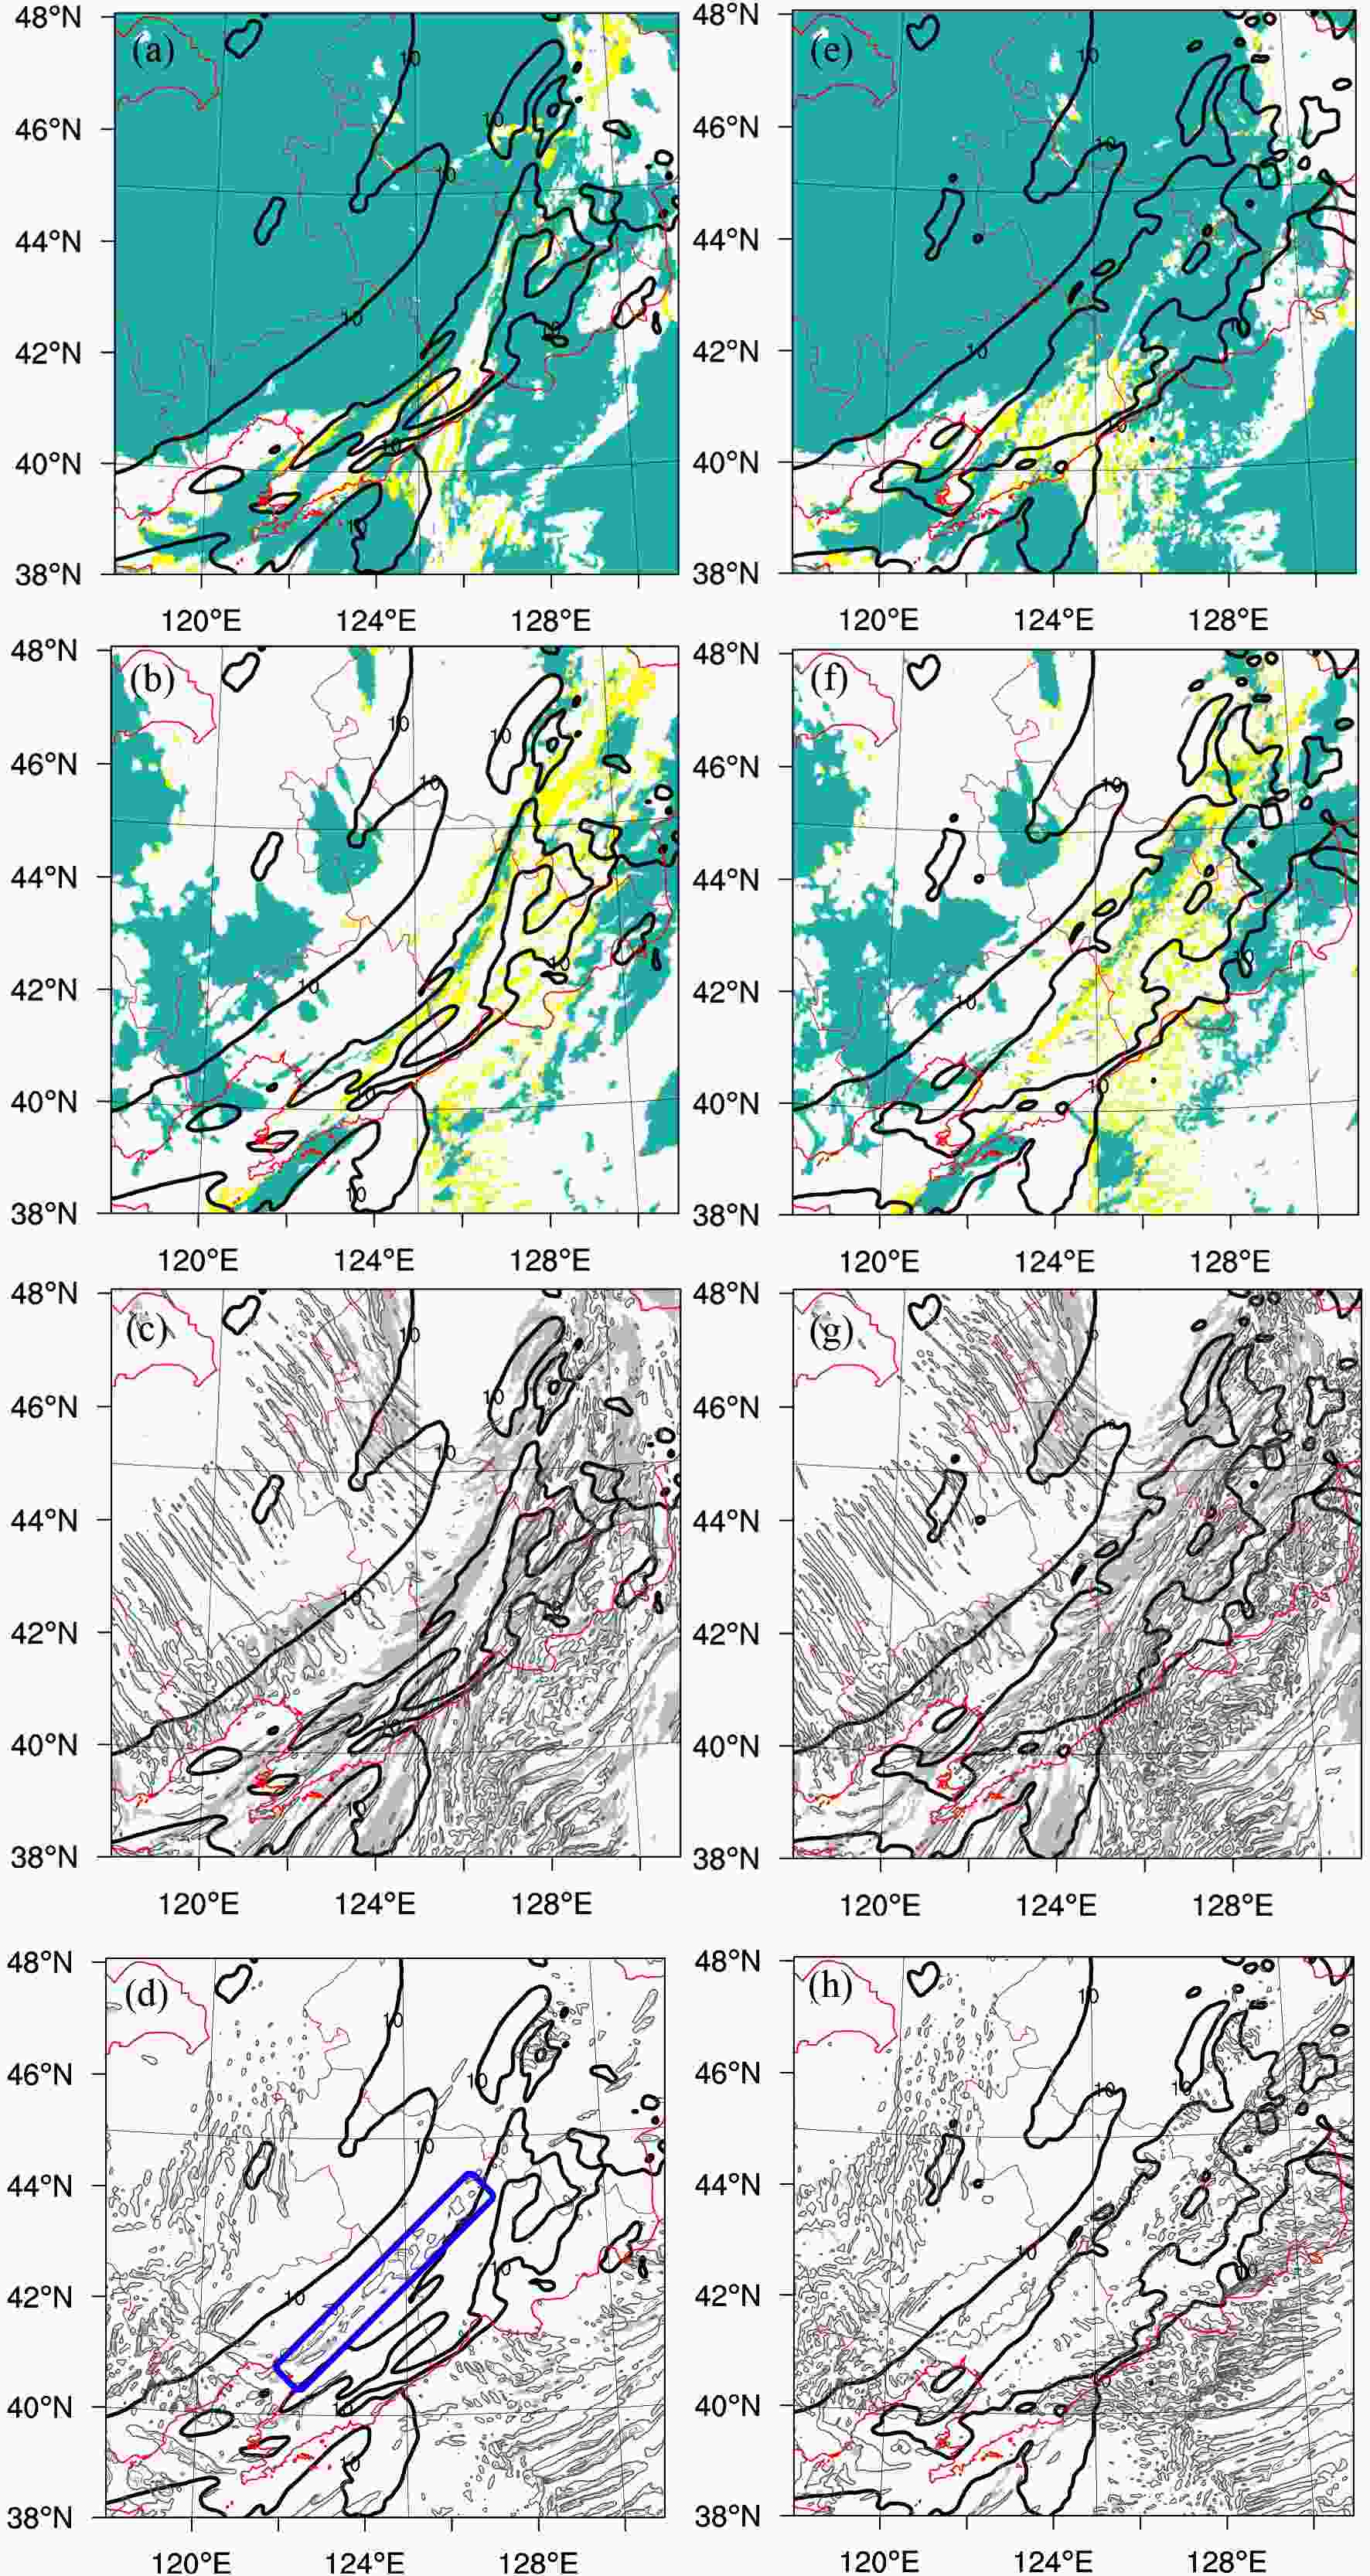 Figure6. (a, e) CI (green shading) and CSI (yellow shading) areas at a model level of


In Figs. 6a-d, all types of instabilities listed in Eq. (1) appeared within and around the TRNP snowband region (denoted by the 10-dBZ radar reflectivity contour). As shown in Fig. 6a, CI (green shaded areas) was the most widely distributed but only in the near-surface layer, with a small corresponding convective available potential energy (CAPE; not shown). CSI (yellow shaded areas), which is usually considered to be the mechanism responsible for banded convection, also appear, are distributed along the snowband. Dry SI with negative PV and positive absolute vorticity (gray shaded areas) was only present at the near-surface level within and in front of the band (Fig. 6c). Compared to the SI, as shown in Figs. 6c-d, II was quite evident in this case; in the near-surface layer, II was distributed predominantly at the southeast part and in front of the convective region (Fig. 6c), while in the low troposphere, one of the II belts (blue box in Fig. 6d) appeared within the band. All these instabilities revealed by Fig. 6 are possible candidates for the development of the snowband and they are embedded in a weak frontogenetical environment (Fig. 7a) which provides a basic lifting mechanism.
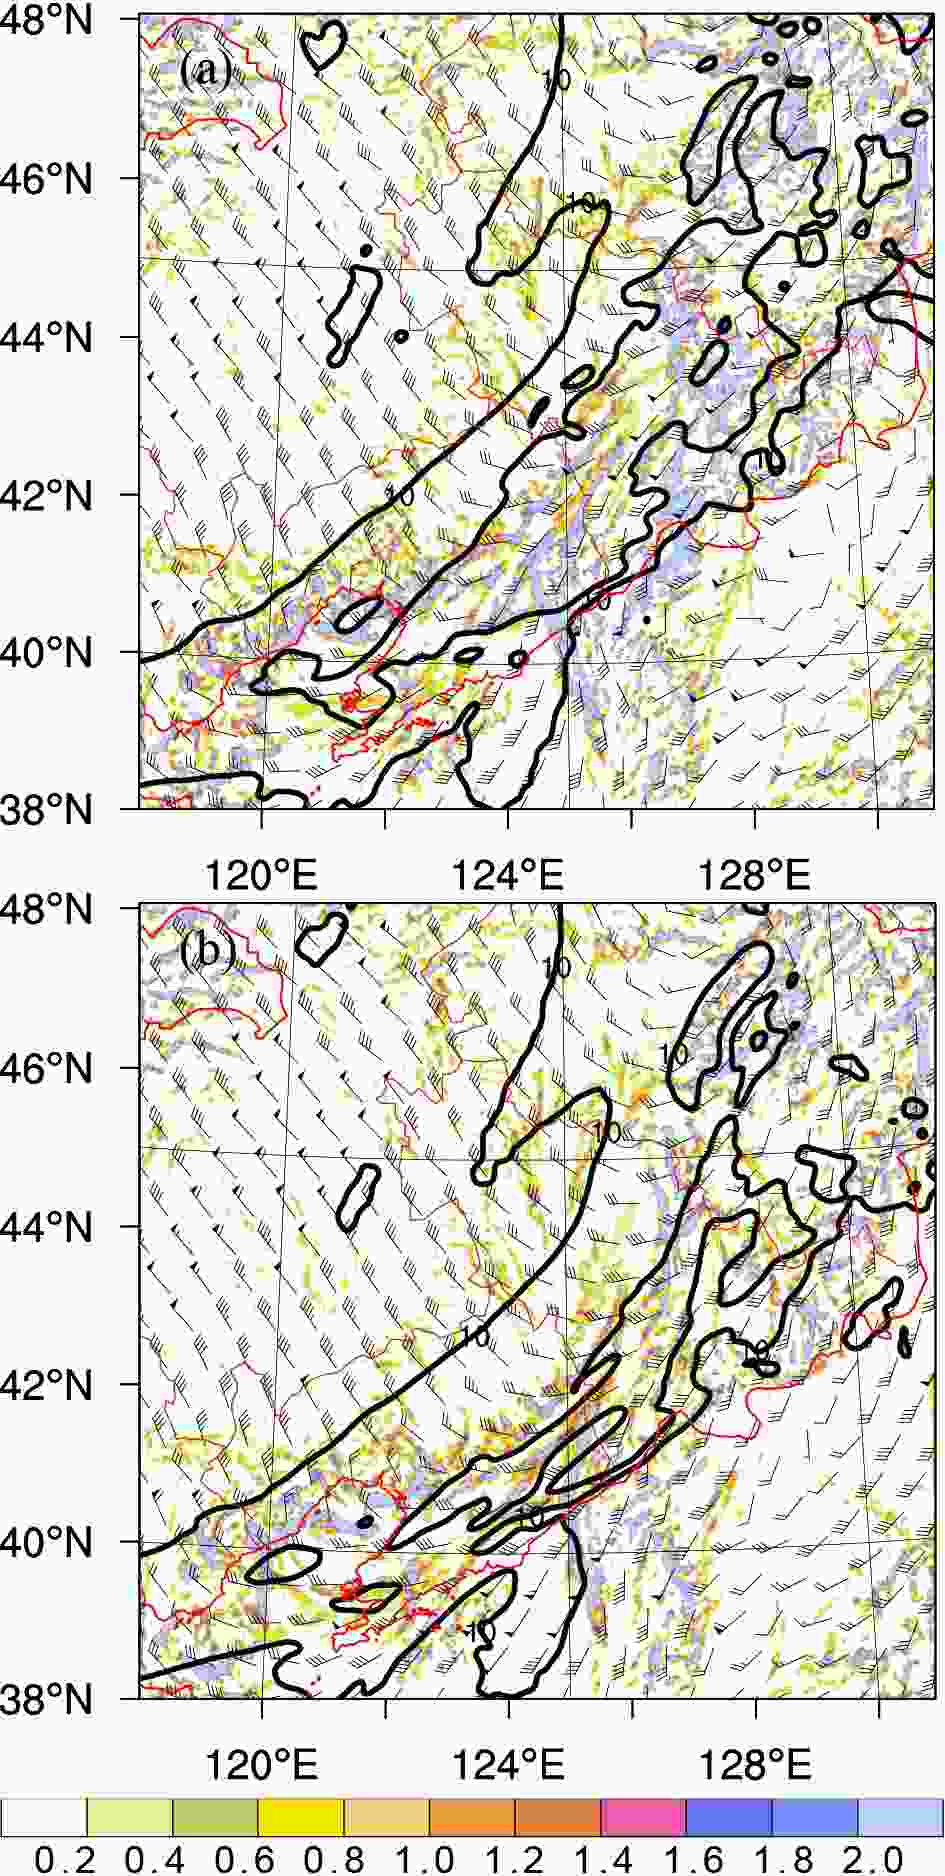 Figure7. Frontogenesis in the near-surface level at
The presence of all the instabilities does not mean that they all play significant roles to support the development of the snowband, although they are all embedded in a frontogenetical environment. Figure 8 and Figs. 9a-b illustrate the vertical structure of the instabilities and associated frontogenesis around the TRNP snowband corresponding to the dynamic structures of the snowband in Figs. 5d-f. In Fig. 8, corresponding to the convective cells L2 and L3, CI, CSI, and dry SI all appear under the 2-km height, with CI (blue box) the most evident. In Fig. 9c, L2 has a frontogenesis region in the near-surface layer to release CI while L3 has an elevated frontogenesis region at about 1?2 km above ground level. The two frontogenesis regions contribute to release CI to support the development of L2 and L3 and thus support the development of the snowband. In the higher levels, the circumstance is simpler because only II (orange box) appear in those levels. Distributed at the base of L1, the elevated II and corresponding frontogenesis (Fig. 9a) contribute to the slanted circulations in L1 which aligns along the cold frontal boundary (Figs. 5d-f).
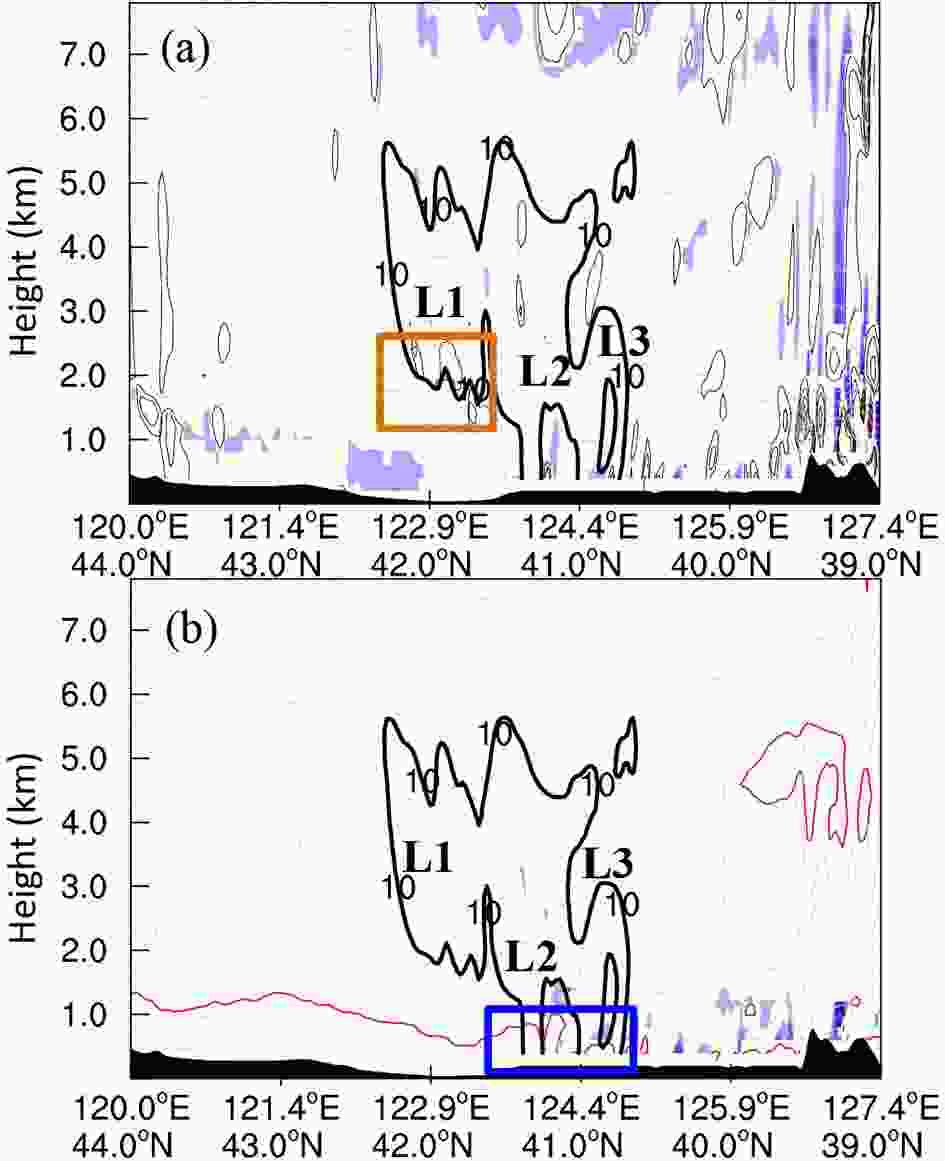 Figure8. Vertical cross-sections of (a) the negative absolute vorticity (thin solid lines), negative PV (blue shaded areas) and (b) the CI areas with


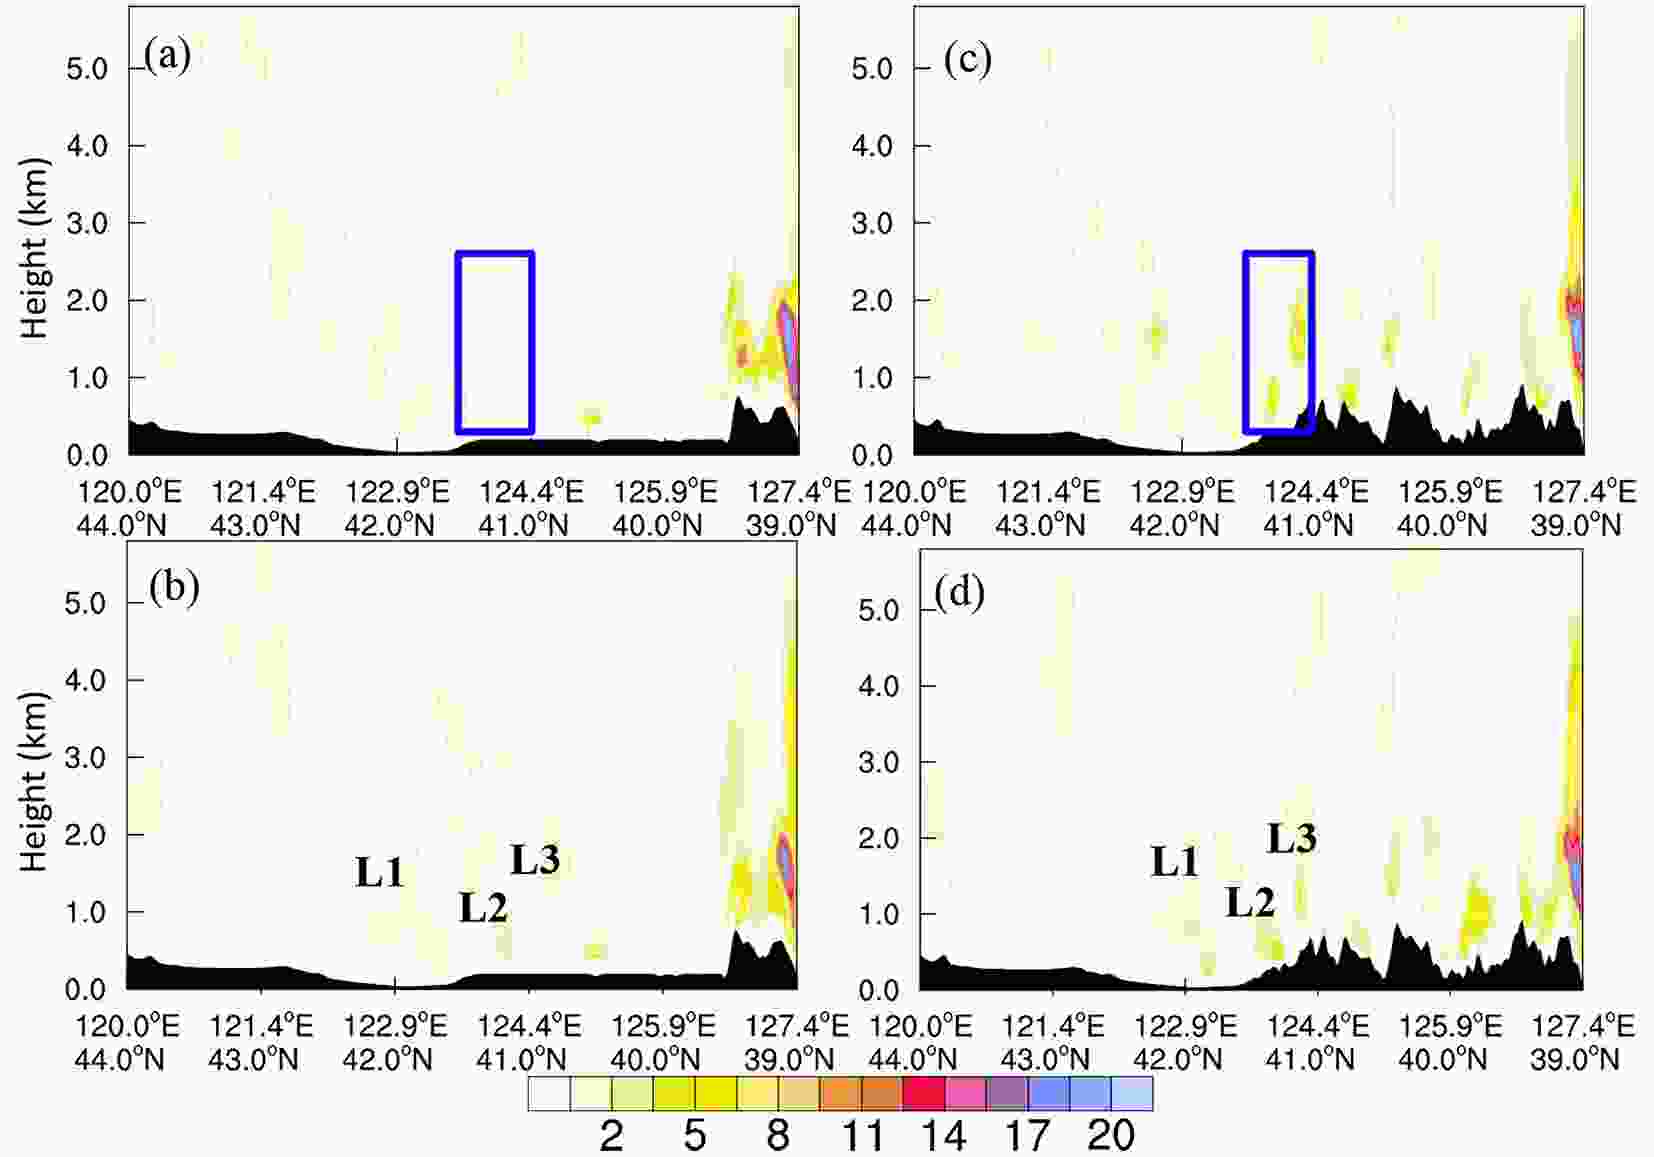 Figure9. Vertical cross-sections of frontogenesis at (a, c) 0400 UTC and (b, d) 0600 UTC on 26 January 2017. The left column comes from TRNP experiment while the right column comes from CTL experiment. The blue boxes indicate the orographic frontogenesis area before the snowband encounters the downstream terrain. The cross-sections are along the same lines as those in Fig. 8.
The above analysis indicates that the main mechanism that supports the development of the snowband without the influence of terrain, is the release of CI and II in a weak frontogenetical environment. Next, we analyze the processes that enhance the snowband or snowfall in the presence of complex terrain.
3
4.3.2. Mechanism of snowband intensification by terrain
By comparing the dynamic structures (Figs. 5c and 5f) and distributions of instabilities (Figs. 8a-b and Figs. 10c-d) around the snowband, three aspects become evident with regard to how orographic effects can intensify the snowfall. The first comes from the instabilities as seen in Figs. 6a-d and 6f-i in which regions of CSI, II and even dry SI are all enlarged especially over Changbai Mountains. The second comes from the frontogenesis as in Figs. 7 and 9, while the third comes from the intensification of lifting due to orographic upslope flow and also orographic gravity waves as indicated in section 4.2.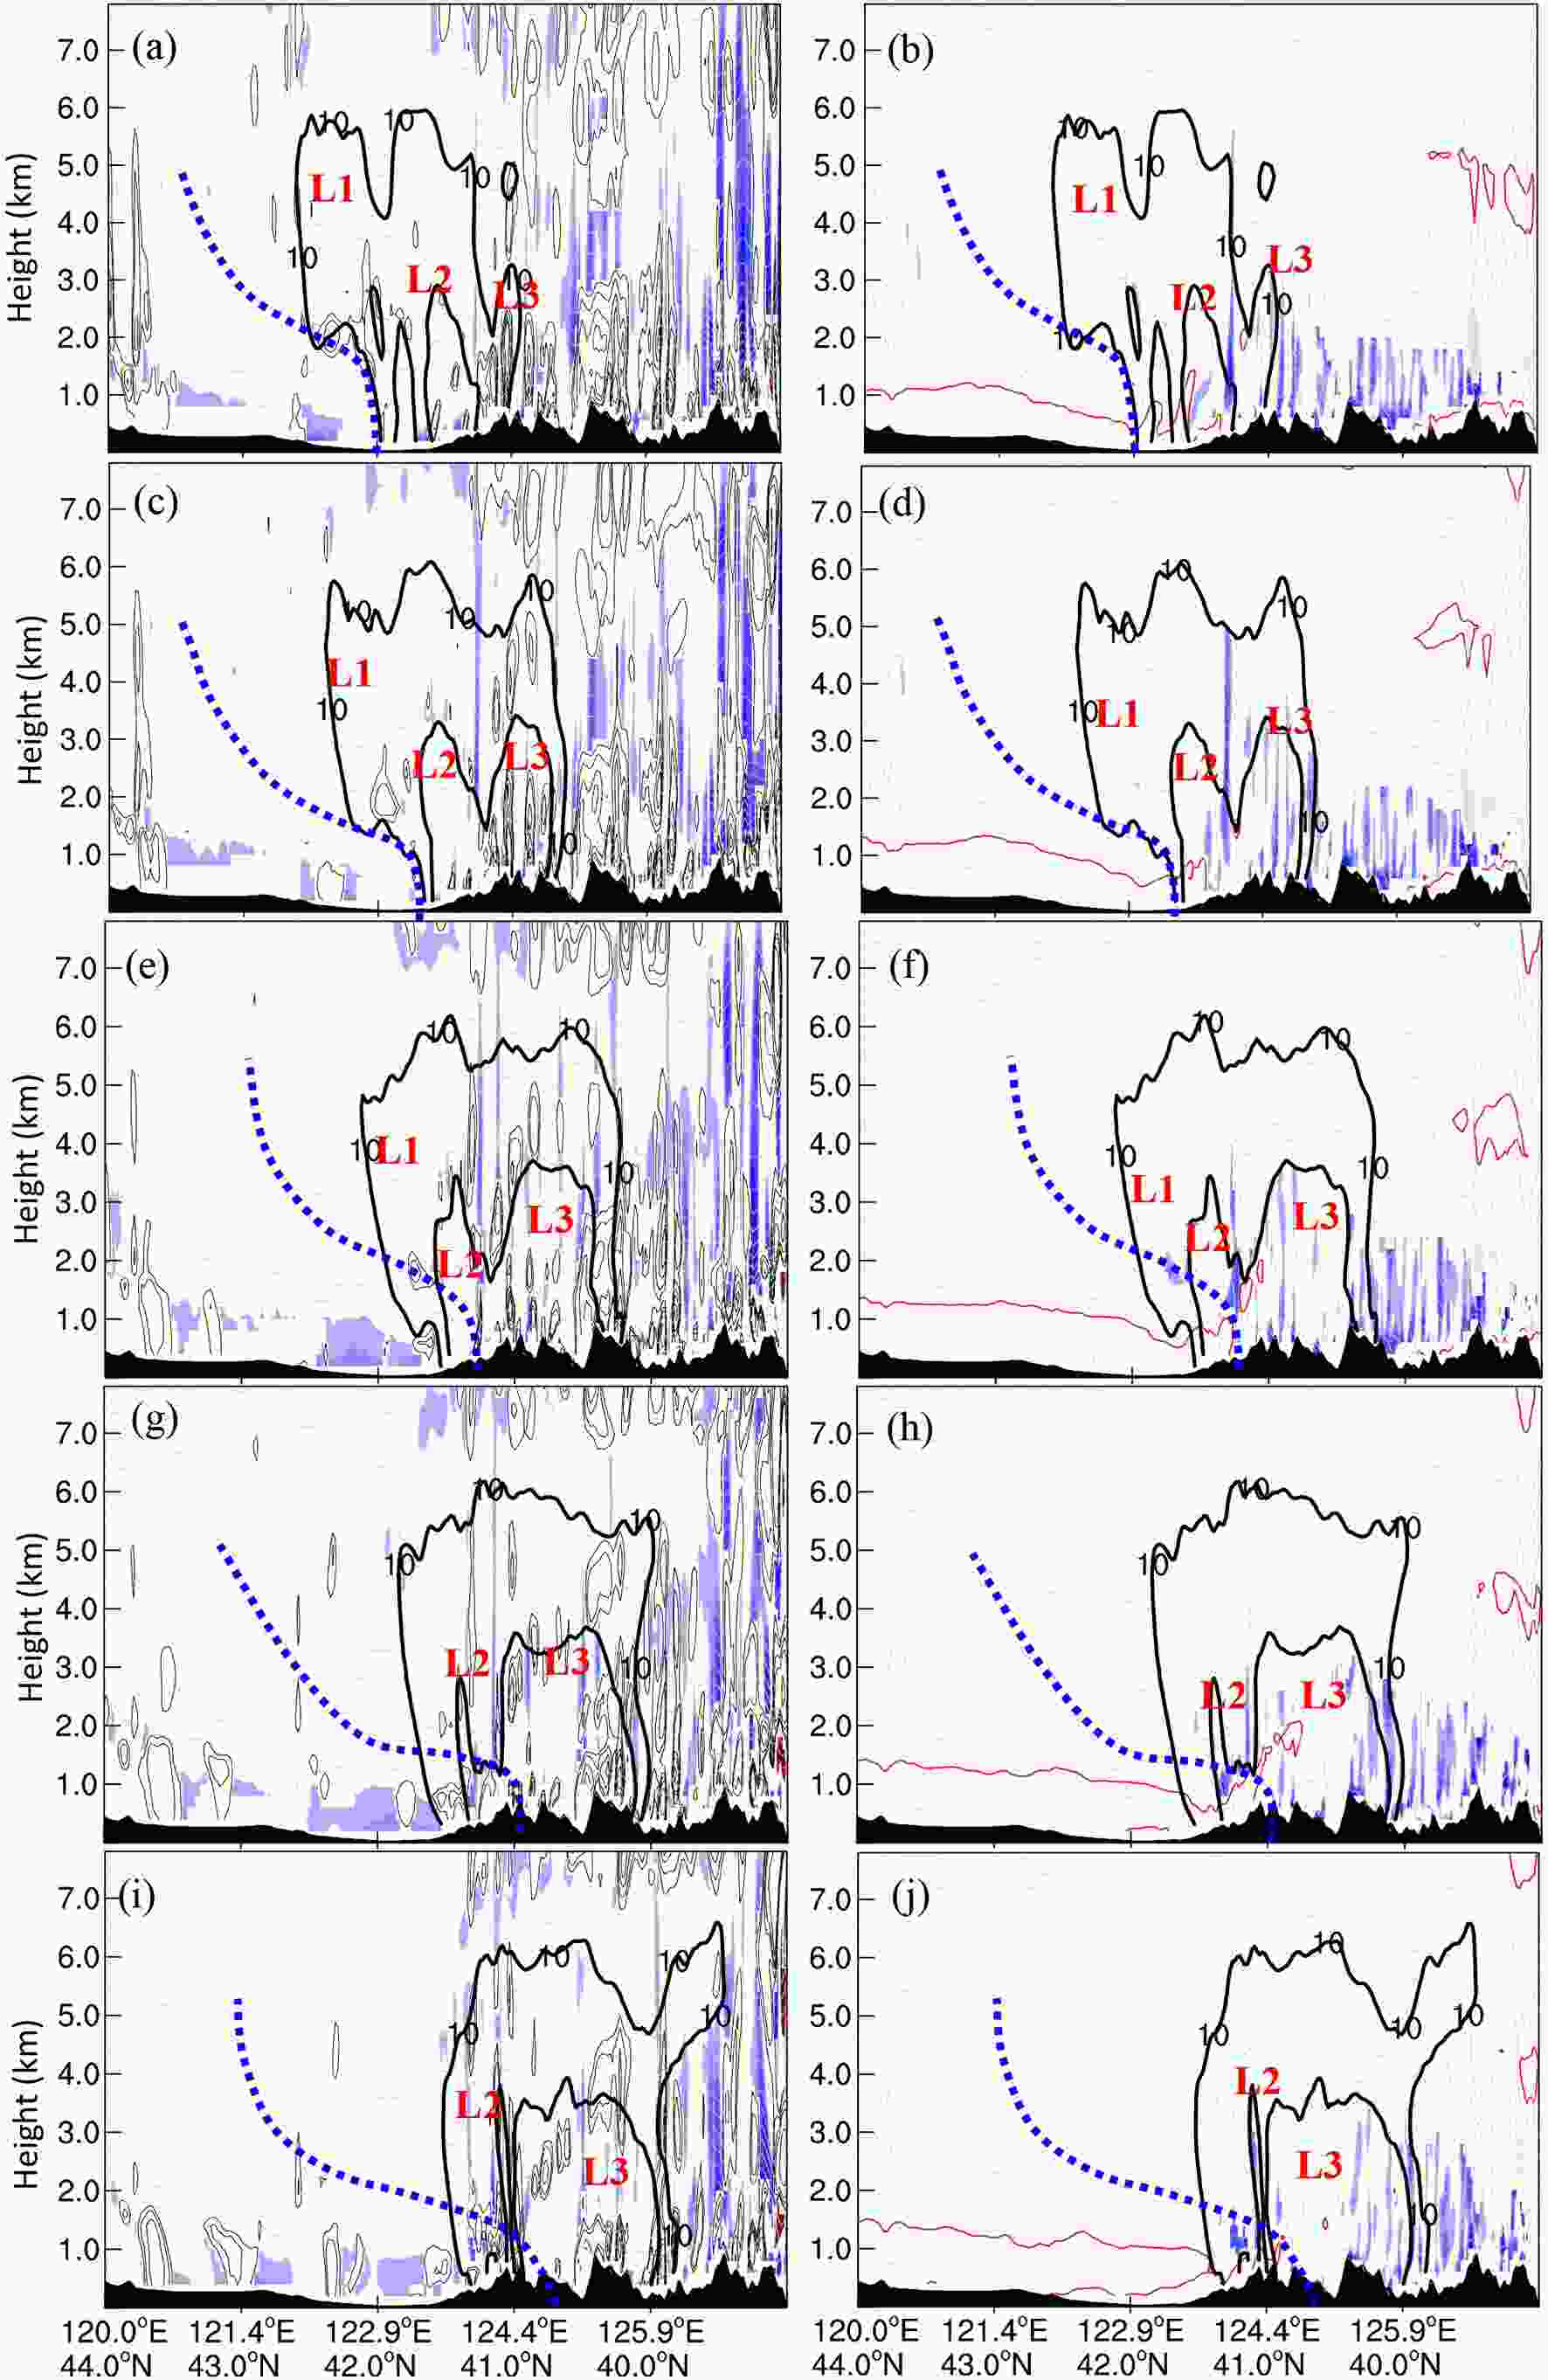 Figure10. Vertical cross-sections (left column) of the negative absolute vorticity (thin solid line), negative PV (blue shaded areas) and (right column) of the CI areas with


Figure 10 shows the vertical distributions of the instabilities from 0500 UTC to 0900 UTC along the same line as that in Fig. 5. In this process, the dissipating L1 disappeared at 0800 UTC, accompanied by the release of an II region at a height of approximately 2 km. This process is similar to the TRNP snowband in Fig. 8.
L2, which produces the large snowfall in Benxi center (Figs. 3d and 4f), first experienced intensification between 0500 UTC and 0600 UTC and then gradually weakened on the windward side of the mountains. Similar to L2 in TRNP experiment, the intensification of L2 was induced mainly by the CI at the low levels, as there was no evidence of either II or CSI appearing within the L2 region (Figs. 10a-d). However, a comparison of Figs. 10d and 8b or Figs. 6a and 6e fails to show intensification of CI in the presence of terrain. Therefore, it is quite likely that the intensification of a lifting mechanism promotes the release of CI and thus makes L2 intensify, inducing the large snowfall in Benxi Center.
The increase of frontogenetical lifting can be seen in Figs. 7a-b and Figs. 9a-d. This process is easily understood since the blocking of terrain to the windward flow increases the flow convergence and deformation which are two basic driving conditions forfrontogenesis. It is noted that before the snowband encounters the downstream terrain, relatively strong orographic frontogenesis already existed on its windward side (Figs. 9c). It is when the cold-frontal snowband approaches this region of orographic frontogenesis that it begins to trigger the release of CI around the cold front to support the development of L2 and L3 (Fig. 9d). Apart from the frontogenetical lifting, the orographic lifting also plays an important role to release CI.
As indicated in section 4.2, the atmosphere over the terrain was characterized by alternatively upward and downward motions, revealing four evident localized regions of ascent (indicated by the four red stars in Fig. 5c) distributed in the upslope, downslope and valley areas of the local terrain. These ascending motions did not exhibit a propagating characteristic and remained in the same place even before the snowband encounters the Changbai Mountains, which can be seen in Fig. 11. When the snowband passed through these areas, the lifting was considerably intensified, such as for L2. This gravity-wave lifting is much stronger than the lifting induced by orographic windward slope or the frontogenesis. Moreover, when the snowband passed through the descending area beneath the ascending area, the lifting was greatly inhibited, which is why L2 began to weaken after 0700 UTC, even though it was still on the windward of the mountains. The decrease of L2 over the windward region implies that the gravity-wave lifting was likely the main dynamic mechanism that influenced the intensification of L2, compared to the frontogenesis and orographic physical lifting.
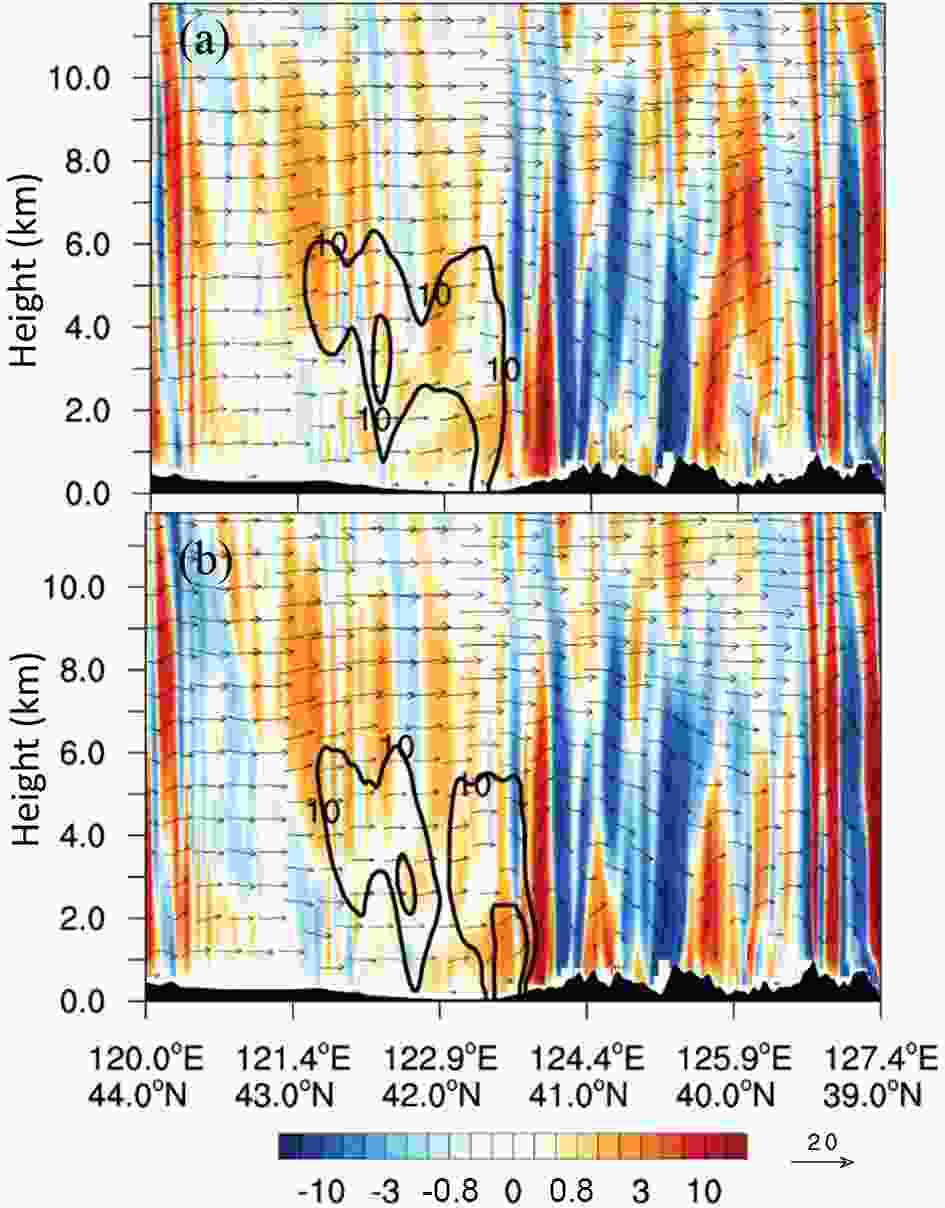 Figure11. Vertical cross-sections of the vertical velocity (shaded areas, units: 10?1 m s?1) at (a) 0300 UTC and (b) 0400 UTC on 26 January 2017. The cross-sections are along the same lines as those in Figs. 4c and 4h The arrows are vertical circulation along the section The thick solid lines with 10-dBZ and 20-dBZ radar reflectivities depict the location of the snowband.
The development process of L3, which produced larger snowfall in BLJ center over the elevated terrain provides evidence for another mechanism by which the terrain influenced the snowband. As shown in Figs. 10a-b, at 0500 UTC, when L3 was triggered before L2, several small-scale IIs and CSIs were distributed in the area. In the horizontal maps, there is also a thin layer of CI that is not reflected in the vertical structure (Fig. 9a). At 0700 UTC, L3 developed into a mature convective cell, and the unstable areas within it were considerably reduced, implying the release of these instabilities. A notable contrast can be seen from a comparison of Figs. 10a-b and Figs. 10i-j, which delineate the instability areas before and after the snowband passed, respectively. At 0900 UTC, considerable II and CSI were reduced compared to the levels at 0500 UTC in the path of the snowband between 124.2°E and126.4°E.
It is difficult to clarify how these instabilities released because much of the cold frontal circulation, slanted or upright convection of the snowband, and orographic circulation were mixed. However, it can be inferred that the ascending area associated with the cold front and the accompanying frontogenesis played important roles when the band passed over the terrain. Before the snowband and the cold front reached the terrain, orographic frontogenesis (Fig. 9b) and ascent (Fig. 11) had already occurred over the terrain. These processes did not release the instabilities; however, after the snowband and the cold front passed, these instabilities were generally not observed. A possible justification of the above process is from Schumache et al. (2010). They noted that the absolute vorticity and potential vorticity may be altered by the convection which causes a neutralization of negative absolute vorticity and release of inertial instability. This process was quite similar to the scenario described above.
From the above analysis, we can identify two processes that were important to the intensification of the snowband over terrain: the release of CI due to the orographic frontogenesis and gravity-wave lifting and the release of orographic instabilities (including CI, II, and CSI over the terrain) due to the passing of the cold front and snowband over the terrain. The two processes associated with the interaction of a cold-frontal snowband and complex terrain contributed to the snow burst in Benxi and BLJ regions. Finally, it is noted that the above analyses are basically from the vertical sections along the Benxi and BLJ centers in Liaoning provinces. In fact, another set of cross sections are also analyzed and most of the main processes that are associated with the snowband maintenance and intensification over terrain are similar.
Initially triggered along the foothills of the high-elevation Dahingganling Mountains, the snowband that produced the snow burst moved eastward with the cold front and encountered another region of high terrain, the Changbai Mountains. Heavy snow was produced within the snowband over the complex terrain, which motivates the investigation into the effects of orography to the snow burst.
The WRF-ARW model was used to reproduce this event, with simulations largely consistent with the observations. Based on the control simulation, a sensitivity experiment that removed the downstream topography of the Changbai Mountains was conducted to separate the contributions of the cold-frontal system and the topography upon the heavy snowfall. A quantitative analysis suggests that the downstream topography plays a significant role on the local enhancement in the snowfall.
Simulations with high temporal and spatial resolutions were then applied to reveal maintenance mechanisms of the snowband and also its enhancement under the influence of terrain. The corresponding results are summarized into the conceptual models in Fig. 12.
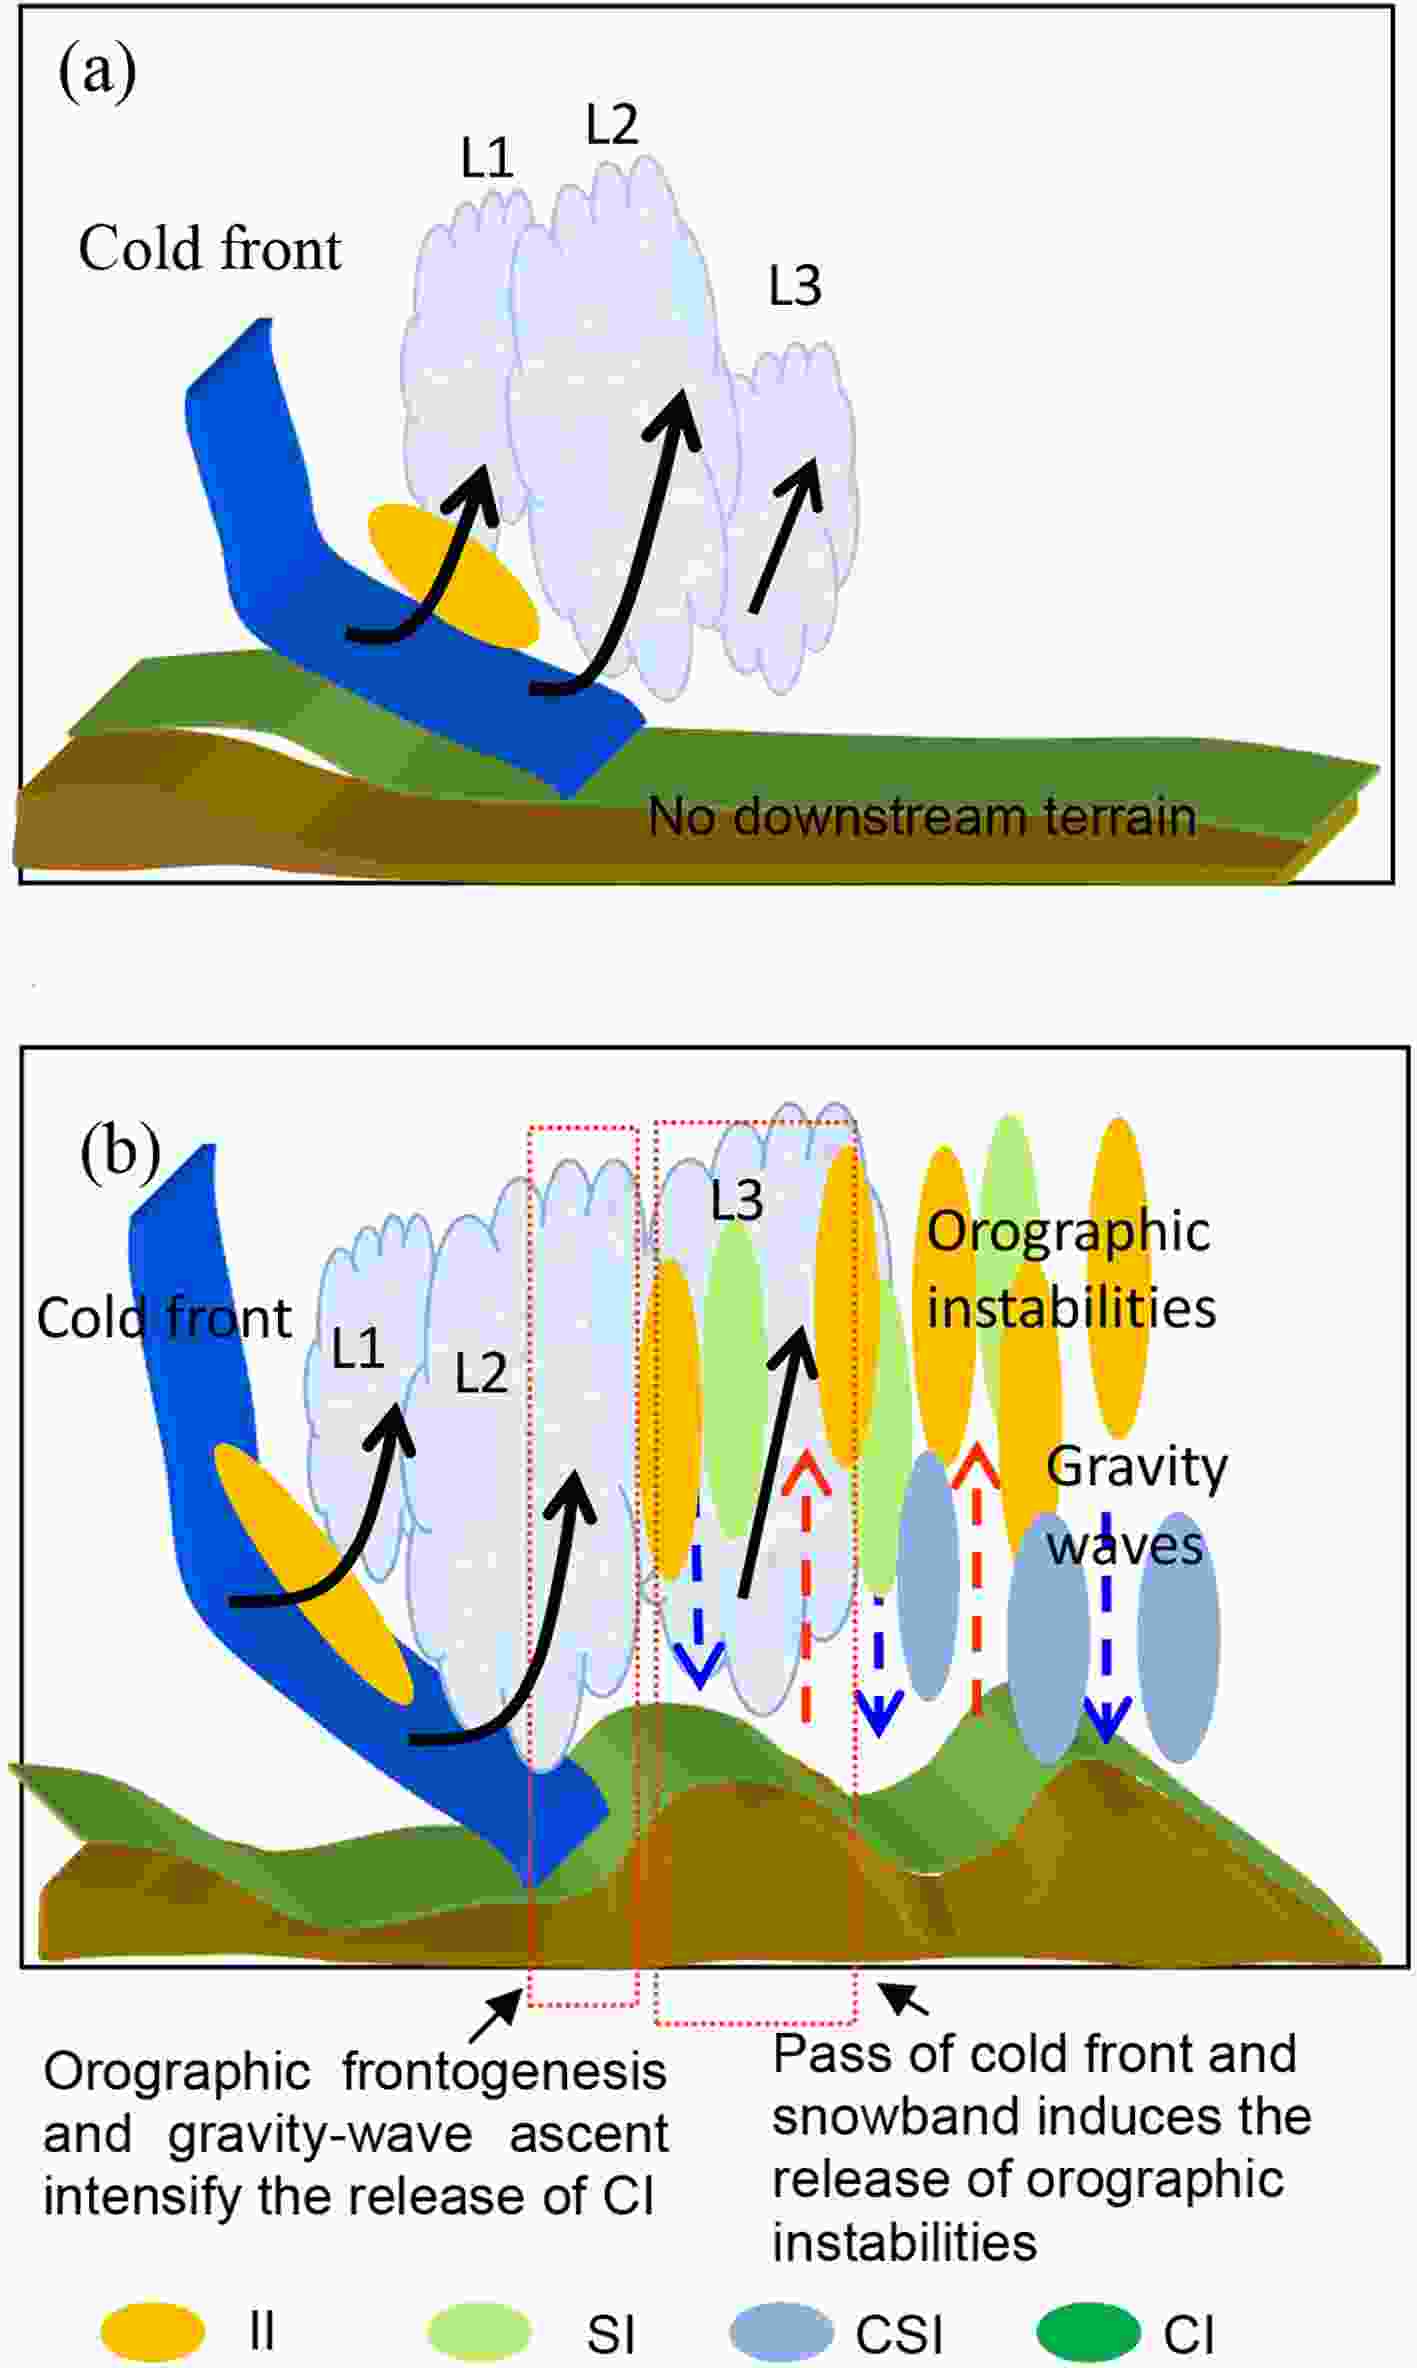 Figure12. Sketch maps of the mechanisms for the occurrence of the snow burst over the Changbai Mountains: (a) maintenance of snowband without influence of mountains; (b) snowband enhancement associated with the interaction of cold front and topography to produce the heavy snow
As in Fig. 12, the instabilities (including CI, SI, CSI and II), which are considered to be possible mechanisms for banded convection, coexisted around the snowband. Without the influence of downstream terrain, it was discovered that the release of II and CI may have contributed to snowband maintenance. The release of II in a weak frontogenesis environment was responsible for the banded convection over the cold front and caused a slanted ascent. Meanwhile, the release of CI with frontogenesis as the lifting mechanism, triggered and supported the convective line that ran ahead of the cold front.
When the downstream terrain was present, two processes are found to be responsible for the intensification of snowfall. On the one hand, the release of CI associated with the cold front due to mesoscale frontogenesis still occurred. This process was greatly enhanced by orographic frontogenesis and gravity waves over terrain which appeared to intensify the orographic lifting. On the other hand, several instabilities (including CI, II, and CSI) simultaneously coexisted over the terrain. When the cold front and the snowband passed over the terrain, these instabilities were mostly released, which was considered to be another mechanism by which the terrain influenced the development of the snowband.
As a single-event study, this paper provides a new insight that the terrain influences the precipitating band passing over it and thus produces heavy snowfall. It helps us to understand the occurrence of a snow burst event in Northeast China, to understand the importance of the Changbai Mountains during a snow burst, and to provide scientific evidence and insight with the intent of issuing early weather warnings to avoid the accidents induced by such snow burst events.
Finally, several problems remain that are worth further investigation: (1) What effect did the upstream terrain have on the snowband development? (2) How did the various instabilities form over the terrain? (3) What are the microphysical processes associated with the interaction of the cold-frontal snowband and topography? These questions will be studied in future papers.
Acknowledgements. This study was supported by the Strategic Pilot Science and Technology Special Program of the Chinese Academy of Sciences (Grant No. XDA17010105), the National Key Research and Development Project (Grant No. 2018YFC1507104), The Key Scientific and Technology Research and Development Program of Jilin Province (Grant No. 20180201035SF), and the National Natural Science Foundation of China (Grant Nos. 41875056, 41575065 and 41790471, 42075013), and Chongqing Technology Innovation and Application Development Special Key Project (Grant No. cstc2019jscx-tjsbX0007).
