HTML
--> --> -->Located in the center of the Eurasian continent, the surface ecological environment of NWC is so fragile that a precipitation event such as moderate or heavy rainfall is likely to cause severe geological hazards (Wang et al., 2012b; Li et al., 2013). In addition, owing to the unsustainability of water conservation facilities and the lack of awareness of disaster relief, the increasing intensity and frequency of extreme precipitation have resulted in more serious losses from disasters in NWC than in other regions. Hence, it is very urgent and important to study the occurrence and evolution of extreme precipitation (EP) events and their possible causes in order to better understand climate transformation in NWC.
According to the study of Shi and Shen (2003), under the background of global warming, the climate shifts to a warm-dry condition when precipitation increases less than evaporation, and the climate tends toward a warm-wet condition when precipitation increases more than evaporation. Previous studies have shown that the climate in the western and central regions of NWC is undergoing a climate shift from warm-dry to warm-wet conditions, while some places in the eastern and central regions show persistent arid conditions and have not yet exhibited the trend of increased moisture (Shi and Shen, 2003; Shi et al., 2007; Wang et al., 2012b; Li et al., 2013; Peng and Zhou, 2017; Chen et al., 2017). A precipitation maximum is more likely to appear in the western part of the more arid NWC, and moderate or greater intensity precipitation will increase significantly (Chen and Dai, 2009b; Wang et al., 2012a). However, due to the uncertainty around precipitation types, it is difficult to judge the contributions of convective precipitation and systematic precipitation toward the total increase in annual precipitation.
Several studies have explored the characteristics of meteorological variables related to precipitation in NWC. Cai et al. (2015) noted that the main origin of summer water vapor in inland arid areas is off the southeastern China coast, brought inland by the influence of two types of weather systems: typhoons and the West Pacific subtropical high moving westward. The water vapor pressure of the arid region of NWC has exhibited an abrupt increasing trend in recent decades, and northwestern Xinjiang and the northwestern Hexi Corridor are sensitive to water vapor changes (Yao et al., 2016). The weakening of the East Asian summer monsoon may play an important role in the decrease in precipitation in the eastern part of NWC and North China (Ding et al., 2008, 2009). Zhou and Huang (2008) found that spring surface sensible heat flux in NWC also has a significant impact on summer rainfall in China. The leading modes of July precipitation variations in NWC are affected by the Silk Road pattern and the Europe-China pattern, and the associated heating anomalies are located over the North Indian Ocean and equatorial central Pacific, Indonesia, and tropical Atlantic (Chen and Huang, 2012; Leung and Zhou, 2018). However, some of these studies focus on analyzing the causes of annual precipitation with less focus on extreme precipitation, while others are mainly concerned about a specific area and pay little attention to the differences in the causes of precipitation in different regions.
Therefore, the aim of this study is to investigate the annual and seasonal trends in total and extreme precipitation in NWC. The features of extreme precipitation and its contribution to total precipitation are mainly discussed in terms of various climate zones. On this basis, the environmental conditions associated with the occurrence of extreme precipitation in summer, such as circulation patterns, water vapor transport, and atmospheric instability, are analyzed and are found to be important to improving disaster reduction and obtaining helpful information for rational countermeasures. The remainder of this paper is organized as follows: the materials and methods employed in this study are described in section 2. The change in extreme precipitation is presented in section 3. The associated mechanisms, such as circulation patterns, water vapor transport, and atmospheric instability, are analyzed in section 4. The summary and discussion are provided in section 5.
2.1. Study area
NWC, which is defined as 73ЁуЈC112ЁуE, 31ЁуЈC50ЁуN in the Eurasian hinterland, has a total area of approximately 3.11ЁС106 km2. This area mainly includes Xinjiang, Qinghai, Gansu, Ningxia, and Shaanxi provinces or autonomous regions. Located at the northwest border of China, Xinjiang is the largest provincial administrative region. Qinghai lies in the northeast of the Qinghai-Tibet Plateau. Gansu has a long narrow strip, and Shaanxi lies in the east of NWC. Ningxia is adjacent to Shaanxi in the east and Gansu in the south. The altitude of the area is between ?192 and 8000 m (Chen et al.,2017). The terrain is dominated by plateaus, mountains, and basins, forming a typical temperate continental climate in the western part and a temperate monsoon climate in the eastern part. According to the results of Song and Zhang (2003), we divide NWC into three climate zones (Fig. 1): Westerly zone (WZ: Xinjiang, central and western section of Hexi Corridor in Gansu Province, 69 stations), Plateau zone (PZ: Qinghai, Qilian Mountains and south of Gansu Province, 29 stations), and Monsoon zone (MZ: Shaanxi Province, Ningxia Hui Autonomous Region, eastern section of Hexi Corridor in Gansu Province, 45 stations). Figure1. Distribution of the meteorological stations in different climate zones of NWC.
2
2.2. Data and methods
The precipitation data used in this study are the daily gauge-based precipitation data of 825 stations in China from 1951 to 2016. The homogeneity and reliability of the daily meteorological data were checked and controlled by the National Meteorological Information Center, China Meteorological Administration (CMA) before the data were released. This data accounts for station relocation, instrument replacement, and changes of the surrounding environment of the stations, which could help reflect natural climate change more realistically. To keep a consistent time range for this study, we chose 1961 and 2016 as the beginning year and ending year, respectively. To further guarantee the quality of the data, several stations with missing observations for periods of more than one month are eliminated, and the ratio method is applied to adjust the individual missing data (Yang and Li, 2014). Finally, 143 stations are chosen for the investigation of NWC. Different parameters, including zonal wind (u), meridional wind (v), surface pressure (Ps), and specific humidity (q), from the National Centers for Environmental Precipitation-National Center for Atmospheric Research (NCEP-NCAR) reanalysis (Kalnay et al., 1996) are applied in this study. The horizontal resolution of these parameters is 2.5Ёу ЁС 2.5Ёу. By comparing the monthly reanalysis of NCEP-NCAR and the ECMWF((European Centre for Medium-Range Weather Forecasts), similar variations of atmospheric circulation are found in NWC. Moreover, The NCEP-NCAR reanalysis is used in our analysis because many studies have previously demonstrated that this dataset has a good description of the atmospheric circulation over East Asia (Zhu et al., 2012; Zuo et al., 2012).To discuss the annual variation and seasonal differences in EP in NWC, we calculate the total annual and seasonal EP. The four seasons are spring, March-April-May (MAM); summer, June-July-August (JJA); autumn, September-October-November (SON); and winter, December-January-February (DJF). When the daily precipitation of a station exceeds 0.1 mm, it is defined as a precipitation event. Considering the scarcity of precipitation in NWC, we use the 90th percentiles individually to determine the thresholds of EP to obtain more sample data. We arrange the annual non-zero daily precipitation of a station in an ascending order from 1961 to 2016 and define the 56-year average of the 90th percentile as the threshold of EP of the station. When the daily precipitation of a station exceeds the threshold, it is defined as an EP event. The annual (seasonal) time series for precipitation days and extreme precipitation days(EPD) are created using the numbers of precipitation days and EPD per year (season) for each station, respectively. The annual (seasonal) time series for precipitation amounts are the cumulative precipitation amounts per year (season). The SDEP and EDEP are the first and last day in each year that daily precipitation exceedes the threshold, respectively.
The possible abrupt changes in the trends are examined using the Mann-Kendall method. The nonparametric Mann-Kendall test is used to detect monotonic trends in time evolutions. The statistical significance of the trends is evaluated at the 0.05 level of significance against the null hypothesis.
The total water vapor flux is separated into two parts: stationary and transient components (Trenberth, 1991). The stationary component is the monthly mean of the water vapor flux, and the transient component is the departure from the monthly mean. It is generally true that the latter is approximately one order of magnitude weaker than the former and contributes little to the total flux (Bothe et al., 2010; Feng and Zhou, 2012). Therefore, we mainly focus on the stationary component, which is calculated using the monthly mean data as is the usual method (Zhou and Yu, 2005). The vertically integrated water vapor flux over and around NWC is calculated as follows:
where


where


3.1. Changes in EP and total precipitation
To explore the contribution of EP to total precipitation, we analyze the interannual variability in EP and total precipitation averaged for the chosen stations in NWC. Figure 2a shows the annual total and extreme precipitation amounts (EPA) in NWC. In addition to interannual fluctuations, the EPA show a significant increasing trend of 3.6 mm (10 yr)?1, while the total precipitation increases at a rate of 3.2 mm (10 yr)?1, which is relatively slower. In addition to EPA, the extreme precipitation days (EPD) also exhibit a significant increasing trend over nearly 56 years, especially against the background of decreasing total precipitation days (Fig. 2b). This result means that almost all of the increase in total precipitation occurs due to EP, and the precipitation in NWC is more likely to appear in the form of EP in recent years. This result is confirmed by the interannual variability in the contribution rate of EP to total precipitation (Figs. 2c, 2d), with an increase rate of 0.7% (10 yr)?1 for EPA and a rate of 0.4% (10 yr)?1 for EPD, with both values passing the significance test. Figure2. Time series of annual precipitation amounts (a, units: mm) and days (b, units: d) in NWC, the contribution rate (units: %) of EPA to total precipitation amounts (c), and the contribution rate of EPD to total precipitation days (d). The blue, red, and black dotted lines represent the linear trends in the total precipitation, EP and contribution rate of EP, respectively. The asterisk indicates that the trend is significant at the 0.05 level. The blue and red shading denotes the 95% confidence intervals for total precipitation and EP, respectively.
Furthermore, the variability in EP among the four seasons demonstrates upward trends in both EPA and EPD, passing the significance test in summer and winter (Table 1). The EP in summer grows fastest at rates of 2.64 mm (10yr)?1 in terms of amount and 0.13 d (10 yr)?1 in terms of days. Although the average EPA and EPD in winter are only 1.4 mm and 0.2 d, their increasing trend magnitudes reach 0.38 mm (10 yr)?1 and 0.04 d (10 yr)?1, respectively, which indicates that winter has the most obvious upward trend, passing the significance test at the 0.01 level.
| season | EPA | EPD | |||
| Average (mm) | Trend [mm (10 yr?1)] | Average (d) | Trend [d (10 yr?1)] | ||
| Spring | 23.1 | 0.61 | 1.5 | 0.05 | |
| Summer | 90.5 | 2.64* | 4.9 | 0.13* | |
| Autumn | 31.5 | 0.01 | 1.8 | 0.03 | |
| Winter | 1.4 | 0.38** | 0.2 | 0.04** | |
| Annual | 146.5 | 3.64* | 8.4 | 0.26** | |
Table1. Average EPA and EPD and their trends in each season in NWC during 1961ЈC2016. Double asterisk and single asterisk represents significance at the 0.01 level and 0.05 levels, respectively.
To analyze the details of the distribution of precipitation changes in NWC, the variation trends in annual and seasonal precipitation are tested with the nonparametric Mann-Kendall method at each site. As presented in Figs. 3a and 3b, the total precipitation amounts and days all show similar distribution characteristics in NWC, rising in the central and western regions and falling in the eastern region. Notably, most of the decline in total precipitation days occurs in the eastern region. The EPA show a rising trend at 80% of the stations (Fig. 3c), concentrated in Xinjiang, Qinghai, western Gansu, and northern and southern Shaanxi Province or autonomous regions, with the largest trend of 26.5 mm (10 yr)?1 in Urumqi. Conversely, the decreasing trends generally range from


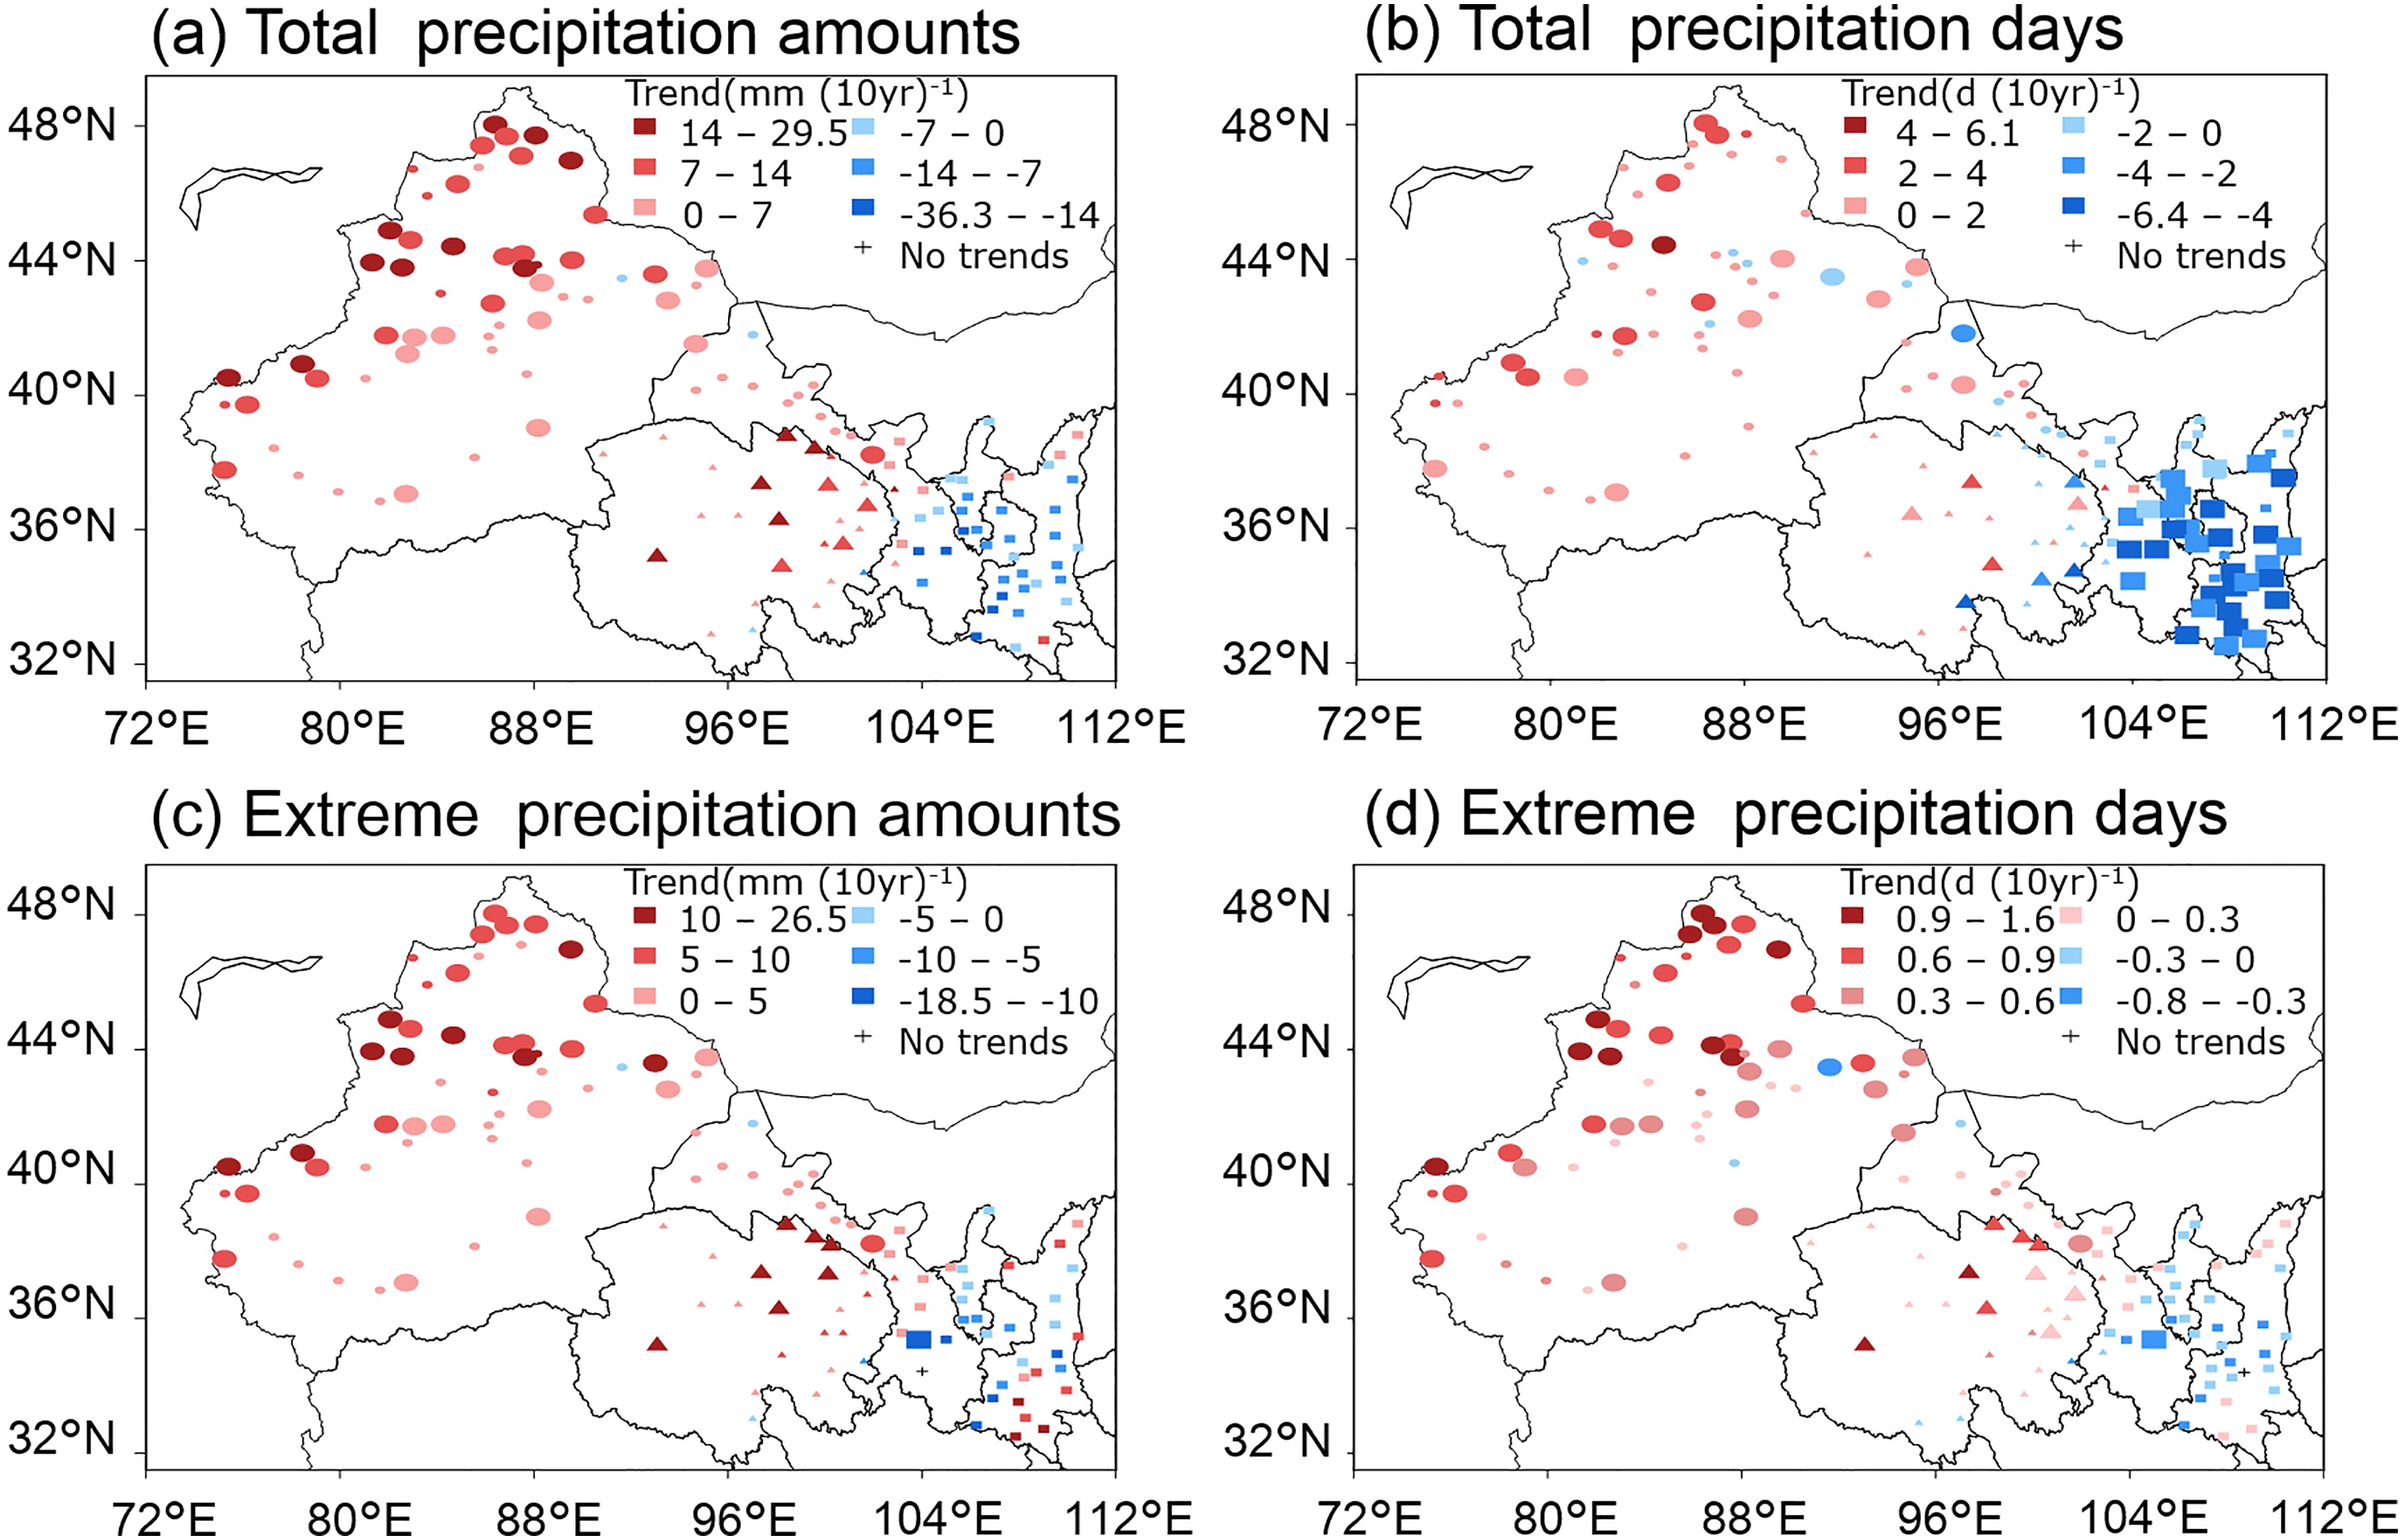 Figure3. Spatial distribution of the trends for total precipitation (a, b) and EP (c, d) in NWC. Dots, triangles, and squares represent the stations in the WZ, PZ, and MZ, respectively. A larger colored symbol represents significance at the 0.05 level. The black plus symbol indicates no trend.
As suggested above, total precipitation and EP have similar distributions for the most part, with increases in the central and western regions and decreases in the eastern region. The variability in EP plays a vital role in changes in total precipitation, and its effect reflects obvious regional differences. Undoubtedly, Xinjiang is the region with the most obvious increase in rates of change regardless of total precipitation or EP, whereas the variability in EP essentially determines the variation characteristics of total precipitation.
2
3.2. Regional difference in EP variation
The results presented in the previous section show an increase of EP in most of NWC, but there are still great differences in variability among the sites. To understand the specific differences between the climate zones, we analyze the average EPA during the first 20 years and the last 20 years of the study period over different regions. For comparative convenience, the same EP threshold is used in comparing EP statistics for different 20-year periods. As shown in Fig. 4, comparing average EPA during1961ЈC80 and during 1997ЈC2016, EP significantly increases in NWC, the WZ, and the PZ, but there is a nonsignificant decrease in the MZ, which also confirms the previous results. The largest increase in EP occurs in the WZ, with the increases in EPA and EPD both exceeding 30%.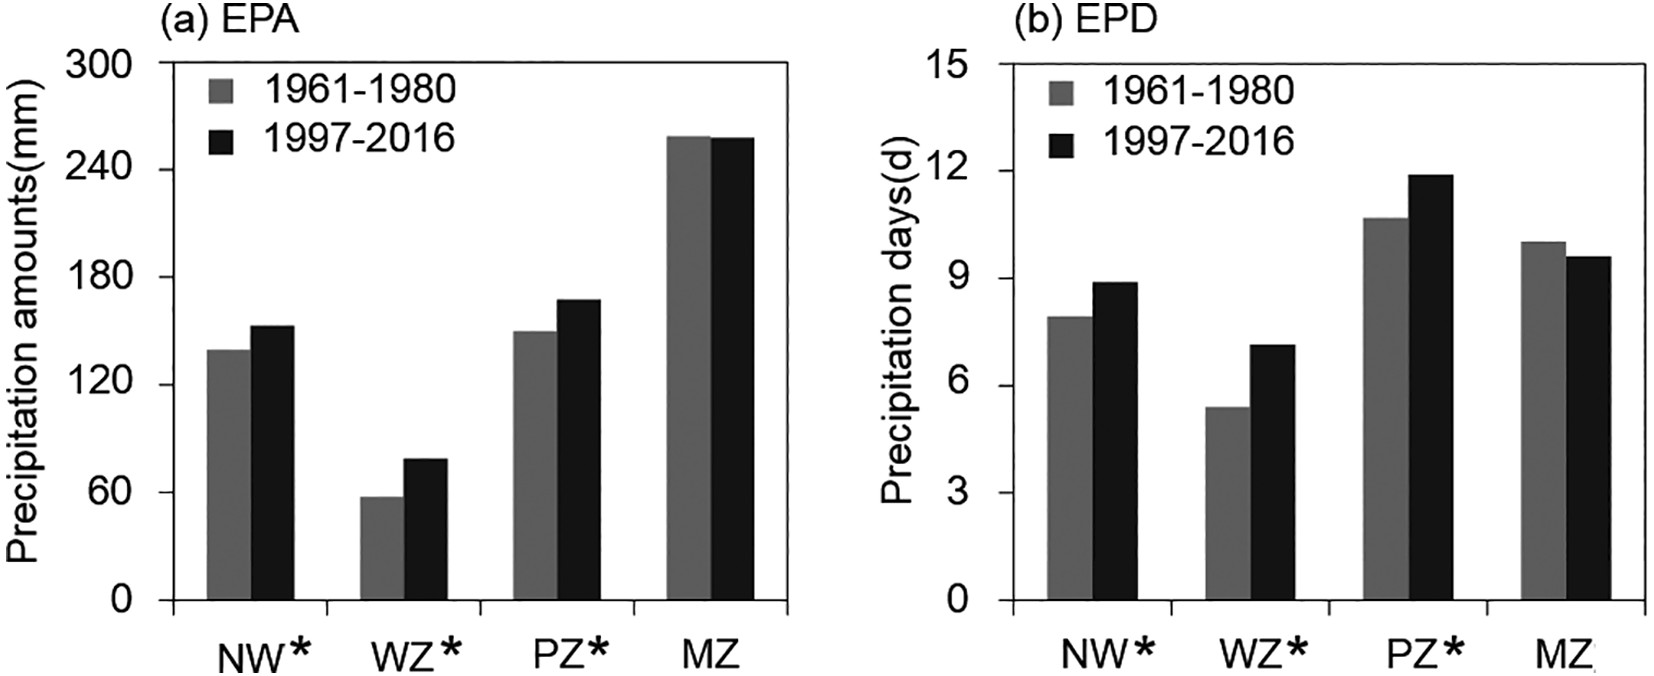 Figure4. EPA (a, units: mm) and EPD (b, units: d) averaged for NWC and different climate zones during different periods. The asterisk indicates significance at the 0.05 level.
The variation trends in EP over the WZ, PZ, and MZ are discussed in this section. As shown in Figs. 3c and 3d, the overwhelming majority of stations have increasing trends in the WZ, with 49.3% and 53.6% of the stations showing statistical significance in EPA and EPD, respectively (Table omitted). Thus, the regional average trends in EPA and EPD in the WZ demonstrate significant positive trends with slopes of 6.2 mm (10 yr)?1 and 0.5 d (10 yr)?1, respectively (Figs. 5a, 5b). For the PZ, approximately 85% of the stations have positive trends. The regional positive trend in the PZ is slightly weaker than that in the WZ, but it also passes the significance test. For the MZ, a nonsignificant downward trend occurs for a large percentage of the stations, with 48.9% and 60.0% of stations showing nonsignificant trends in EPA and EPD, respectively. Regionally, the trends in EPA and EPD in the MZ are decreasing and fail the significance test (Figs. 5a, 5b).
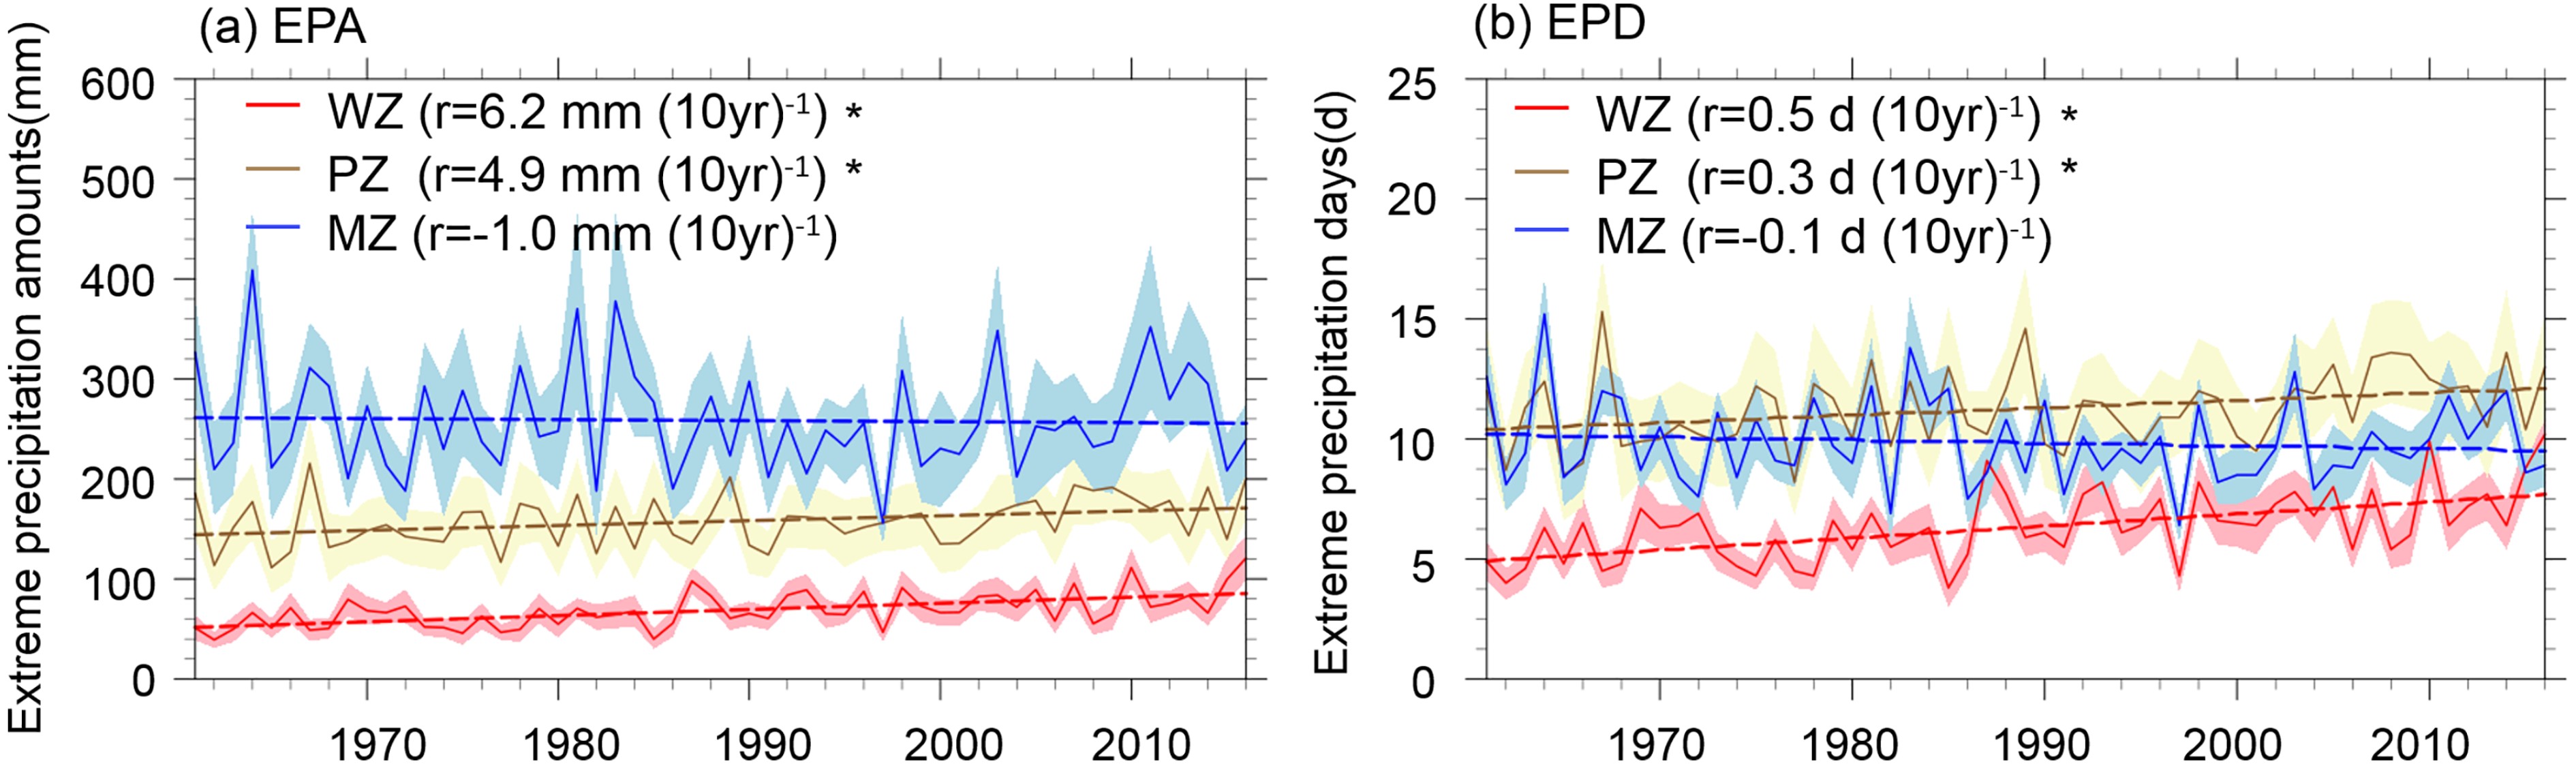 Figure5. Time series of EPA (a, units: mm) and EPD (b, units: d) in different climate zones. The red, yellow, and blue dotted lines represent the extreme precipitation linear trends in the WZ, PZ, and MZ, respectively. The red, yellow, and blue shading denotes the 95% confidence intervals for different climate zones. The asterisk indicates that the trend is significant at the 0.05 level.
The trends in different zones vary throughout the seasons, underlining the need to examine each season and region. Increasing trends are observed in all seasons in the WZ. Over 20% of the stations with significant positive trends in extreme summer and autumn precipitation are in the WZ (Table 2). The largest increase in EP occurs in summer, with rates reaching 3.1 mm (10 yr)?1 and 0.2 d (10 yr)?1 for EPA and EPD, respectively (Table omitted). For the PZ, the seasonal trend in summer is also larger than that in other seasons, with more than 20% of the stations exhibiting obvious increasing tendencies. On the other hand, the seasonal trends in EP in the MZ are very weak, with few sites showing significant increasing trends.
| Index | Season | NWC | WZ | PZ | MZ |
| EPA | Spring | 9.1 | 13.0 | 13.8 | 0.0 |
| Summer | 21.0 | 29.0 | 27.6 | 4.4 | |
| Autumn | 11.2 | 20.3 | 6.9 | 0.0 | |
| Winter | 8.4 | 17.4 | 0.0 | 0.0 | |
| Annual | 28.7 | 49.3 | 24.1 | 0.0 | |
| EPD | Spring | 7.0 | 8.7 | 13.8 | 0.0 |
| Summer | 18.2 | 27.5 | 20.7 | 2.2 | |
| Autumn | 11.2 | 20.3 | 6.9 | 0.0 | |
| Winter | 9.1 | 18.8 | 0.0 | 0.0 | |
| Annual | 32.2 | 53.6 | 31.0 | 0.0 |
Table2. Percentages of stations with significant increasing seasonal trends in EP in different climate zones.
2
3.3. Changes of SDEP and EDEP
The SDEP, the EDEP, and their changes have a great impact on the region. Advancements or delays in the SDEP and the EDEP affect regional climates and human life both directly and indirectly. Hence, on the basis of calculating the annual SDEP and EDEP and durations of extreme precipitation (DEP) at every site, we analyze the spatial distribution characteristics of their trends in NWC (Fig. 6). Based on Fig. 6a, the stations with early trends in SDEP are mainly distributed in most parts of Xinjiang, Qinghai, Ningxia, the northwestern Hexi Corridor, and northern Shaanxi, and the stations with delayed trends are concentrated in southern Gansu and central Shaanxi. The stations in northern Xinjiang show the largest advance with more than 10 d (10 yr)?1. In addition, a delay in EDEP is found at most sites in NWC (Fig. 6b), which is essentially the opposite to the spatial distribution of SDEP, with the largest delay of more than 9.0 d (10 yr)?1 found in Xinjiang. Due to advances in the SDEP and delays in the EDEP at most of the stations, the DEP exhibits more obvious extended trends in NWC, especially in Xinjiang and southern Qinghai, where the trends exceed 10 d (10 yr)?1 by a great percentage (Fig. 6c). At the same time, the DEPs in southern Gansu and Central Shaanxi decrease at a rate of more than 5 d (10 yr)?1. Figure6. Spatial distribution of the trends [units: d (10 yr)?1] in the SDEP (a), EDEP (b), and DEP (c). Dots, triangles, and squares represent the stations in the WZ, PZ, and MZ, respectively. A larger colored symbol represents significance at the 0.05 level. The black plus symbol indicates no trend.
Based on a comparison of the multiyear average SDEP in the three climate zones, EP usually occurs first in the WZ on 30 April, followed by the MZ and PZ (Table 3). The average end dates of EP for the WZ and PZ occur at almost the same time in middle September, and the latest EDEP occurs in late September in the MZ. However, in recent years, the SDEP, EDEP, and DEP for each climate zone have changed and differ considerably from their average values. For the largest advance in the SDEP [?3.6 d (10 yr)?1] and the largest postponement of the EDEP [5.9 d (10 yr)?1], the DEP in the WZ has the fastest increasing trend of 9.5 d (10 yr)?1. As a result, the average DEP in the WZ extends from 114.6 d in the 1960s to 150.4 d in recent years (2011ЈC16). The regional SDEP and EDEP in the PZ also exhibit advancing and delayed trends, respectively. Hence, the DEP in the PZ increases by approximately 16.5 d from 1961 to 2016. On the other hand, due to the mixed pattern and heterogeneity in spatial distributions of the SDEP and EDEP, the variation in the DEP is not obvious in the MZ. Recently, the DEP values in the WZ and MZ are almost equal.
| Average | Trend | ||||||
| SDEP (date) | EDEP (date) | DEP (d) | SDEP [d (10 yr?1)] | EDEP [d (10 yr?1)] | DEP [d (10 yr?1)] | ||
| WZ | 30 Apr | 12 Sept | 134.7 | ?3.6** | 5.9** | 9.5** | |
| PZ | 16 May | 13 Sept | 119.6 | ?2.9** | 0.9 | 3.9** | |
| MZ | 10 May | 27 Sept | 140.5 | ?0.7 | 0.1 | 0.9 | |
Table3. Average values of the SDEP, EDEP, and DEP and their trends in different climate zones. Double asterisk represents significance at the 0.01 level.
4.1. Interdecadal shift of EP in summer
Considering the maximum proportion (60%) and largest increase in EP, we mainly focus on the variation in EP and its possible causes in summer. The summer EP amount anomaly averaged over NWC is displayed in Fig. 7a. In addition to the drastic interannual fluctuations, the summer EP shows a significant increase in the overall trend, changing from negative to positive in the mid-1980s. To identify the abrupt changing point, the Mann-Kendall test is performed. From Fig. 7b, the two statistical rank series cross 1986 at the 0.05 significance level. Thus, the summer EP in NWC experiences an interdecadal shift in approximately 1986, which is consistent with the conclusion of Chen et al. (Chen et al., 2017). Consequently, the summer EP during 1986ЈC2016 is greater than that during 1961ЈC85. This result is consistent with the conclusion of Wang et al. (Wang et al., 2012b), who noted that the regional annual and seasonal precipitation and EP in NWC exhibits a step jump in the mean in the late 1980s.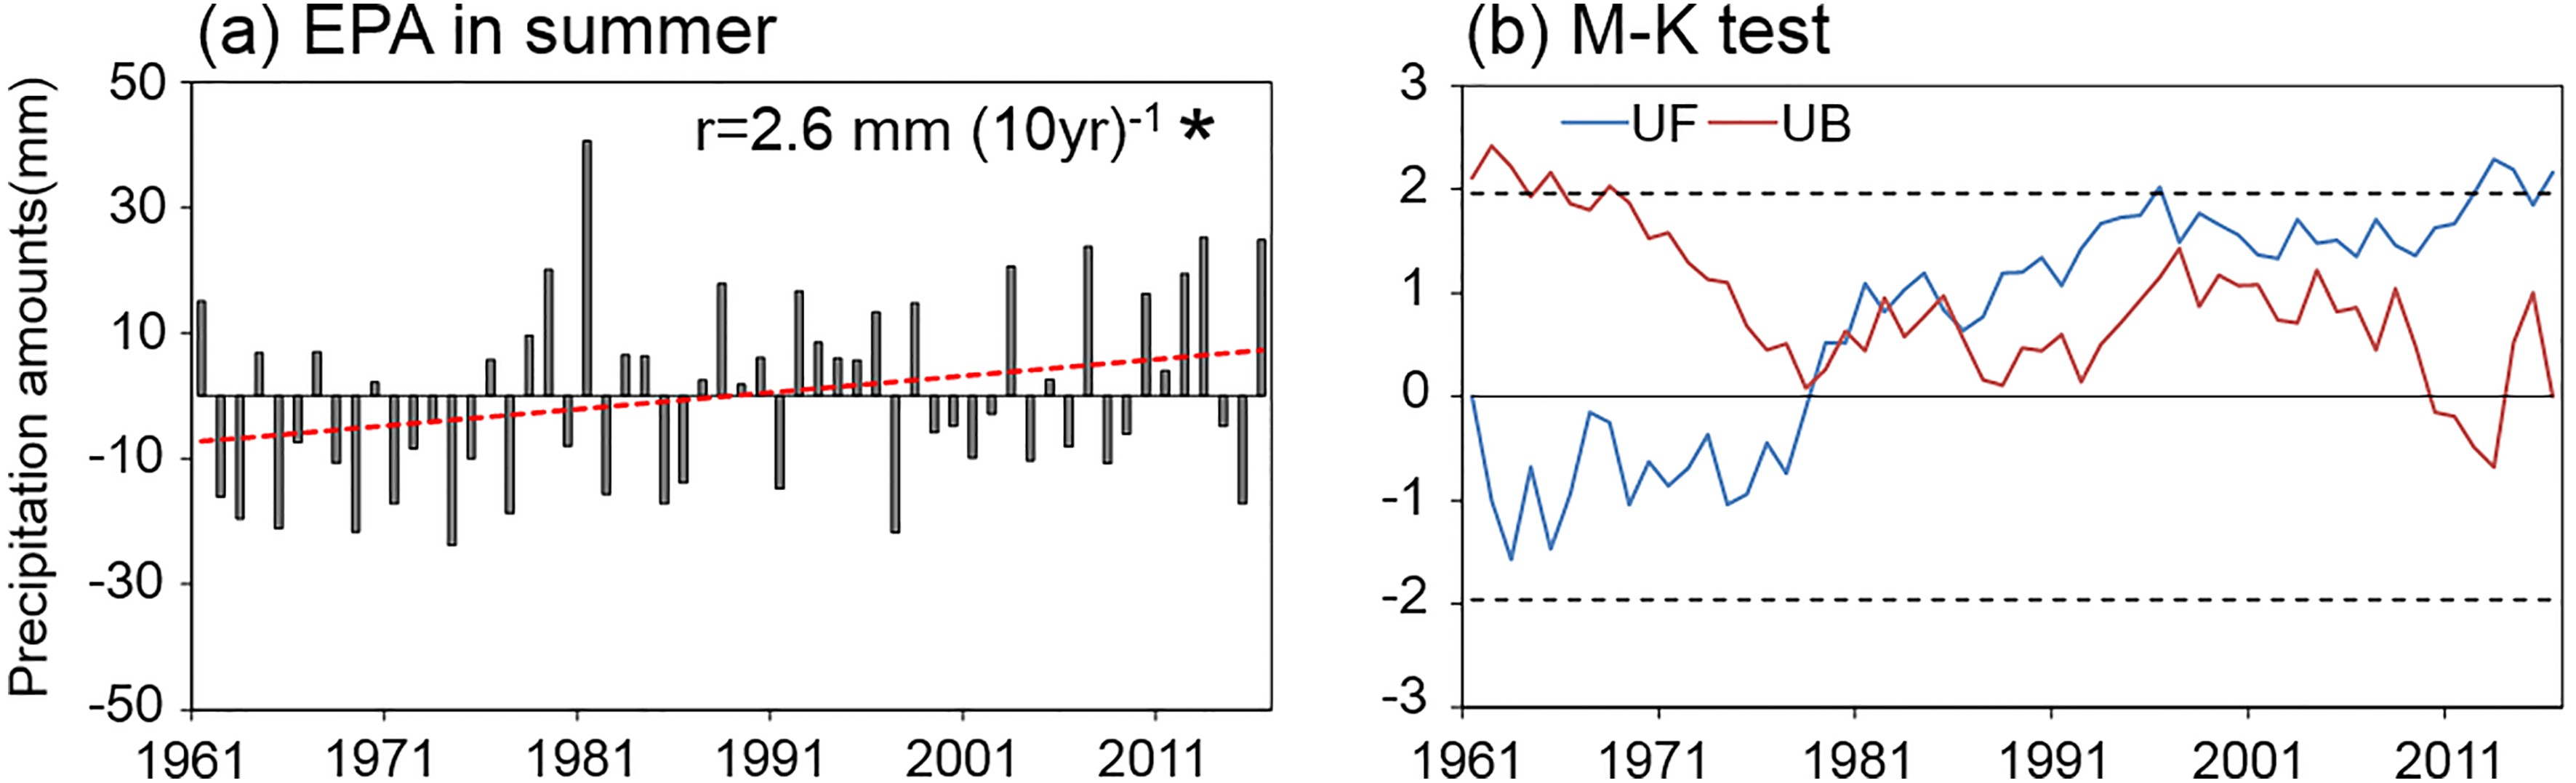 Figure7. (a) Time series of extreme precipitation amount anomalies in summer (black bars, units: mm) and their linear trend (red dashed line). The climatological mean is based on 1971ЈC2000. The asterisk indicates that the trend is significant at the 0.05 level. (b) The forward (blue solid curve) and backward (red solid curve) are statistical rank series in the Mann-Kendall test of the summer EPA in NWC. The dashed straight lines in (b) indicate significance at the 0.05 level.
2
4.2. Changes of atmospheric circulation in summer
The occurrence of EP is often closely related to atmospheric circulation; thus, atmospheric circulation has experienced corresponding changes in recent years. The calculation results show that the EPA account for 53.8%, 63.2%, and 63.7% of the total monthly precipitation amounts in June, July, and August, respectively. The correlation coefficients between EPA and total monthly precipitation amounts in June, July, and August all exceed 0.9770. Therefore, the atmospheric circulation of EP can be regarded as consistent with the monthly average circulation. According to the interdecadal shift in summer EP, the circulation differences between the period of 1986ЈC2016 and the period of 1961ЈC85 are analyzed. The composite difference in height at 200 hPa is displayed in Fig. 8a. There is a noticeable atmospheric transformation between the two periods, with two large cyclonic circulations located to the west and east of NWC. An anticyclonic circulation dominates the western and central regions of NWC, which contributes to divergence at upper levels and rising motion over the WZ and PZ. Convergence at upper levels and sinking motion occur over the MZ, which is not conducive to EP in the MZ. The composite differences at 500 hPa and 850 hPa are illustrated in Figs. 8b and 8c. In the middle and lower levels, a large anticyclonic circulation occupies most of China and Mongolia and a northeastern airflow dominates the central and east parts of China. The eastern region of NWC sits in the eastern and central parts of the anticyclonic circulation, which may lead to strengthening of descending motion and a decrease in precipitation in the MZ in 1986ЈC2016. In contrast, the western and central regions of NWC sit in the western part of the anticyclonic circulation. This circulation pattern strengthens ascending flow and increases precipitation in the WZ and PZ during 1986ЈC2016. Similar circulation features can be seen in the height-longitude cross-sections of the difference in summer zonal circulation averaged over 34ЁуЈC40ЁуN between the periods of 1986ЈC2016 and 1961ЈC85 (Fig. 8d). Meanwhile, there is a vertical circulation pattern over NWC, with the ascending branch located at approximately 70ЁуEЈC85ЁуE and the descending branch located at approximately 100ЁуЈC120ЁуE. Significant ascending flow is dominant near 75ЁуЈC85ЁуE (over the WZ). The strong upward motion over the WZ contributes to the increase in summer EP and is consistent with the most significant increase in summer EP over the WZ occurring during 1986ЈC2016. A weaker updraft is situated over 90ЁуЈC95ЁуE (over the PZ), which could be why the EP increase in the PZ is smaller than that in the WZ. In contrast, east of 100ЁуE there is uniform subsidence throughout low and high levels. The sinking motion contributes to the decrease in summer EP in the MZ during 1986ЈC2016.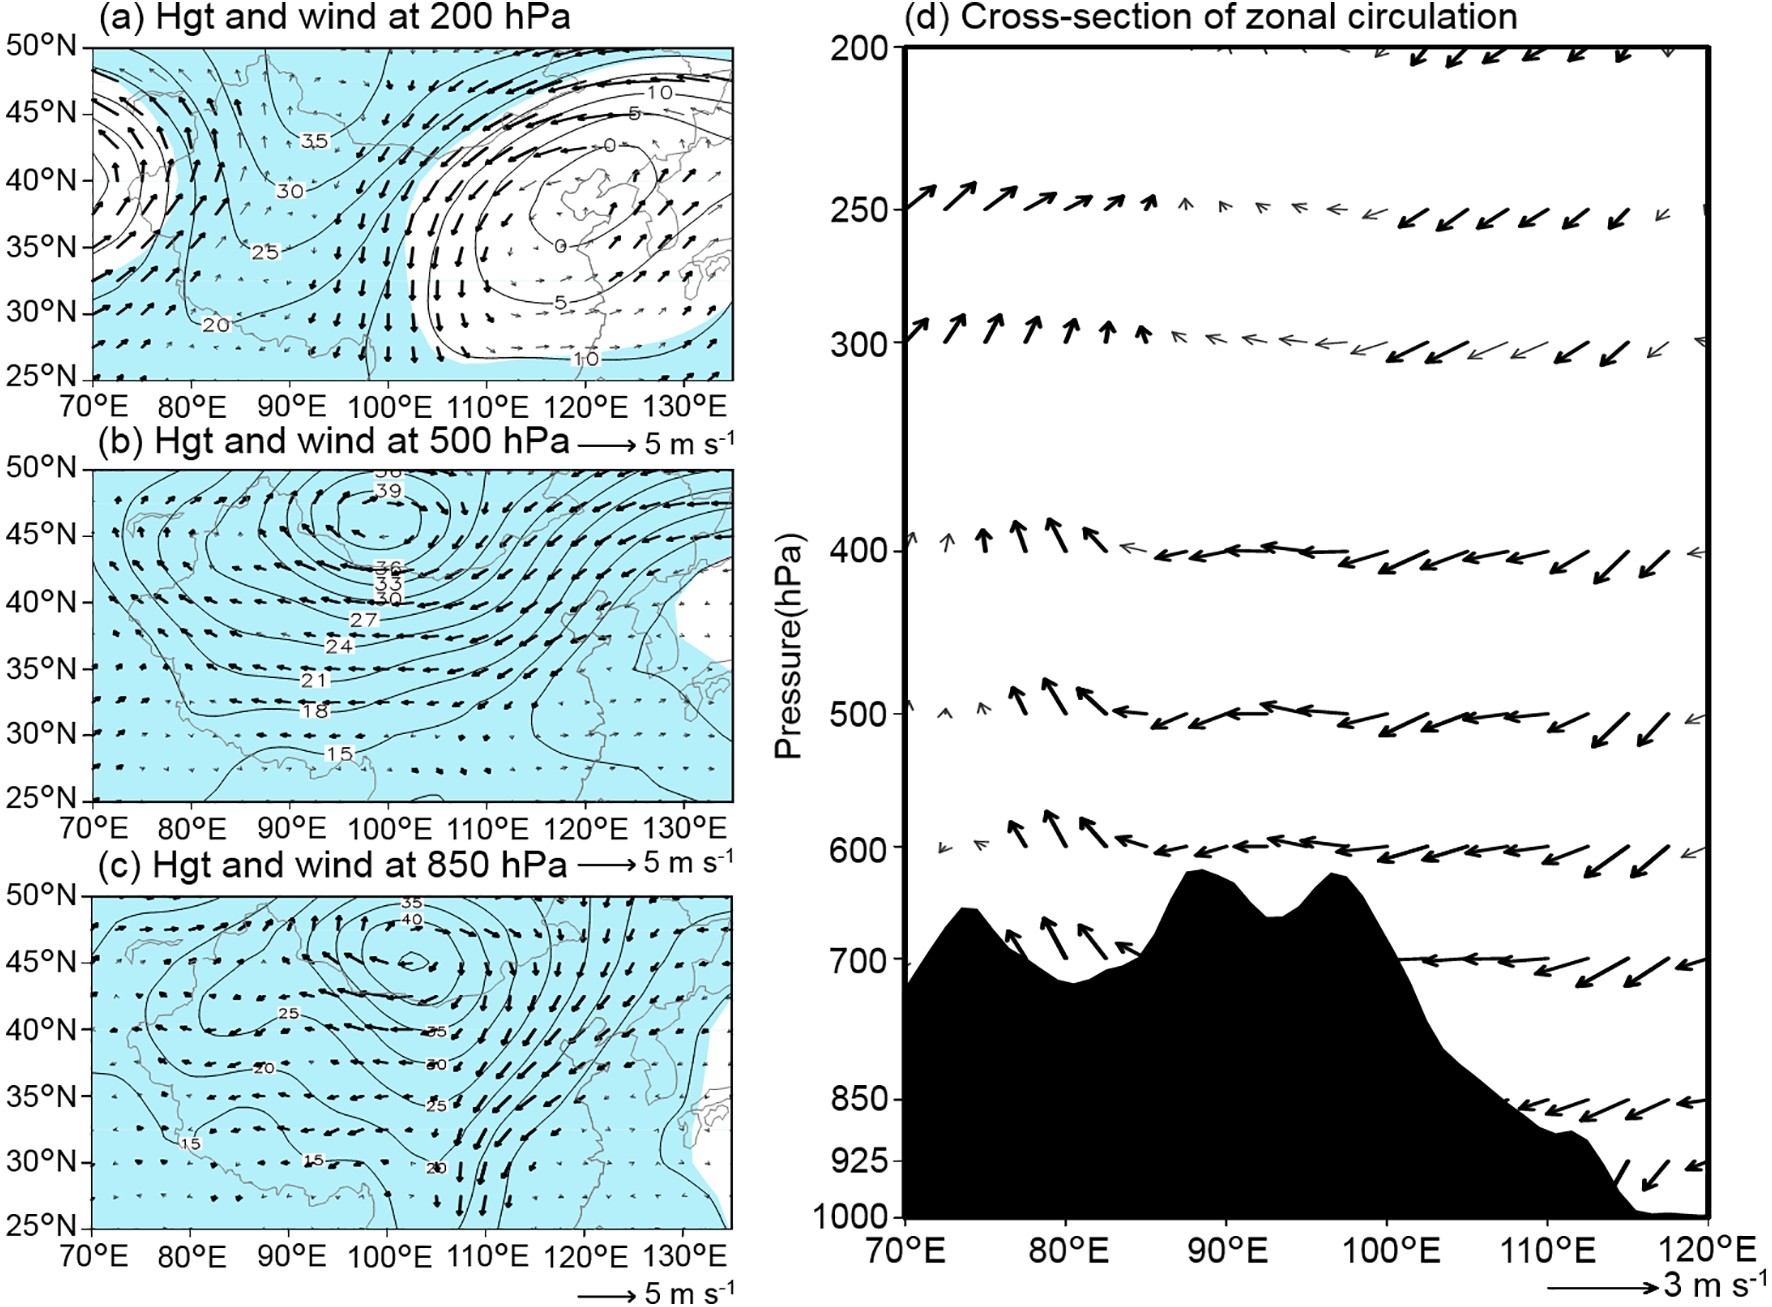 Figure8. Height (contour, units: m) and horizontal wind (vector, units: m s?1) at 200 hPa (a), 500 hPa (b), and 850 hPa (c) and height longitude cross-section of JJA zonal circulation averaged over 34ЁуЈC40ЁуN for the differences between the periods 1986ЈC2016 and 1961ЈC85. The blue shading and bold vectors indicate that the difference between the two periods is significant at the 0.05 level. Black shading represents terrain average over 34ЁуЈC40ЁуN.
To further clarify the vertical circulation differences between the three climate zones, we analyze the summer divergence and omega at levels from 700 hPa to 100 hPa (Fig. 9). In 1986ЈC2016, a stronger ascending flow at all levels occurs over the WZ (Fig. 9b). The stronger ascending flow is concurrent with convergence at lower levels and divergence at upper levels over the WZ (Fig. 9a), and this flow is a circulation field conducive to the increase in EP in the WZ. At the same time, opposite vertical features are observed between the MZ and WZ. Lower-level divergence and upper-level convergence occur in the MZ and contribute to the uniform subsidence at almost all levels and the precipitation decrease in summer. In addition, rising motion weaker than that in the WZ is detected at levels below 500 hPa in the PZ, accompanied by a small difference in divergence, which contributes to a weaker EP increase in the PZ.
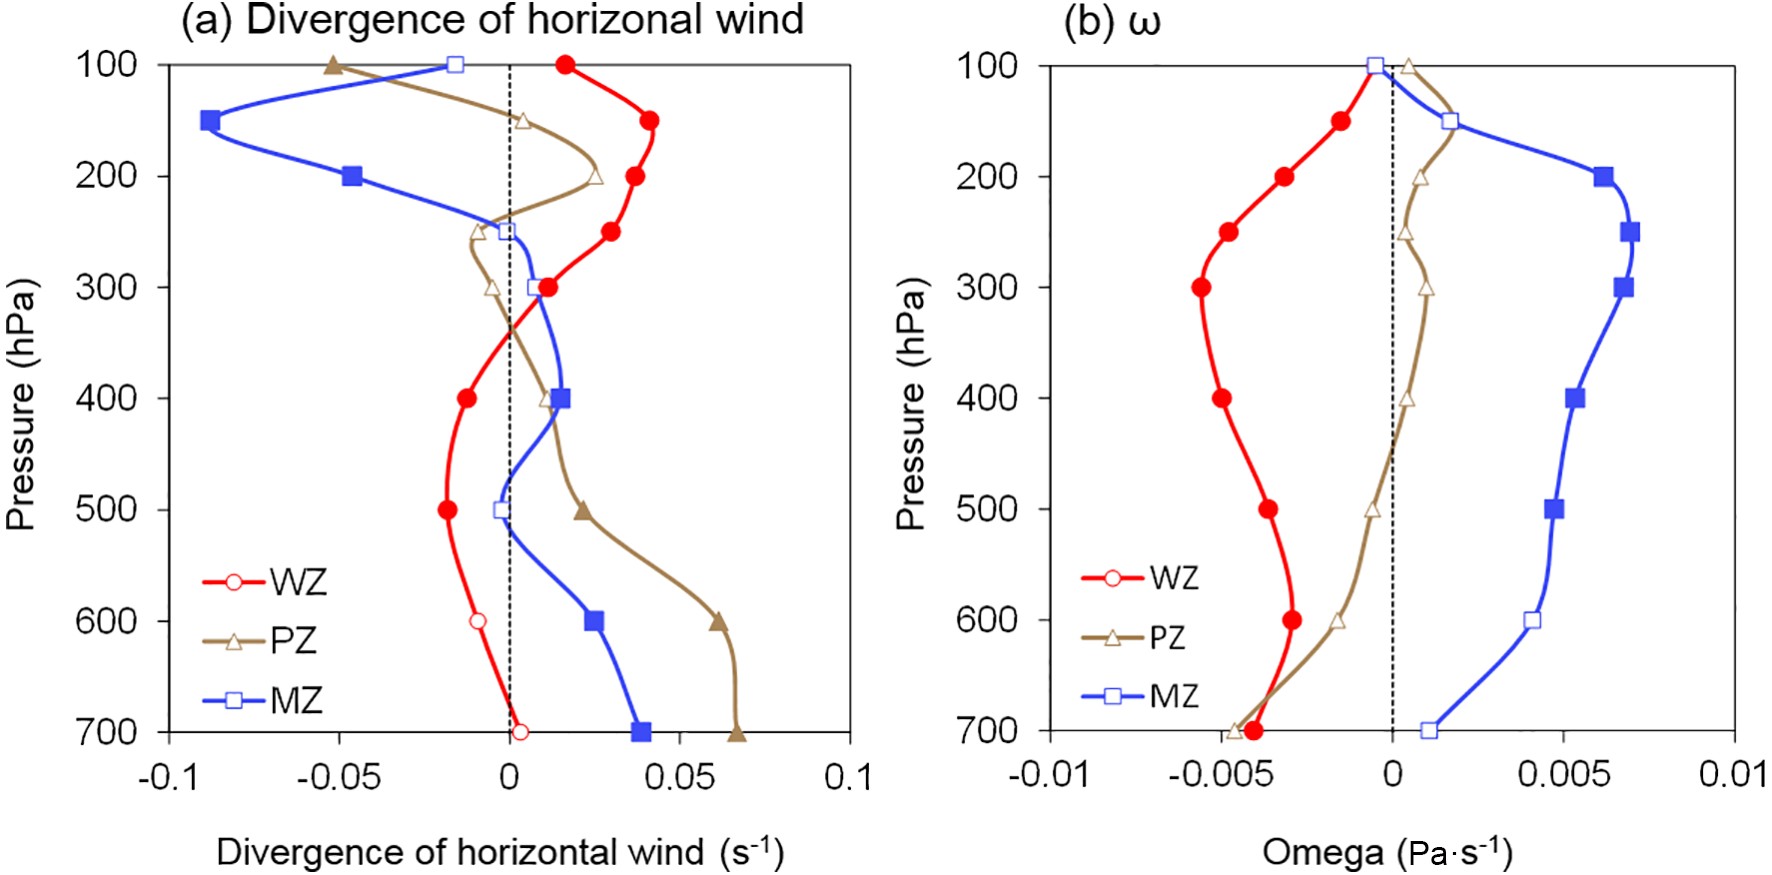 Figure9. Vertical profile of the summer divergence of horizontal wind (a, units: s?1) and omega (b, units: Pa s?1) averaged over different climate zones to determine the differences between the periods 1986ЈC2016 and 1961ЈC85. The WZ (72.5ЁуЈC95ЁуE and 36ЁуЈC47.5ЁуN), the PZ (90ЁуЈC102.5ЁуE and 35ЁуЈC38ЁуN), and the MZ (102.5ЁуЈC112.5ЁуE and 32.5ЁуЈC40ЁуN). The same approach is used below.
2
4.3. Changes of water vapor flux in summer
Abundant water vapor transport is a necessary condition for heavy precipitation; hence, the changes in water vapor transport related to EP are analyzed. The differences in integrated moisture flux and convergence in summer between the two periods are shown in Fig. 10a. Based on Fig. 10a, an anticyclonic circulation occurs over most of China and Mongolia, with a northeastern water vapor flux dominating the eastern region of NWC and a westward water vapor flux dominating the central and western regions. The major areas of convergence are detected in eastern Qinghai, the Hexi Corridor, and northern and western Xinjiang, corresponding to where the most significant increase in summer EP is observed for 1986ЈC2016. For the eastern part of NWC, convergence of water vapor flux is not detected, which corresponds to the decrease in EP at most sites in the MZ. The composite difference in the moisture budget is illustrated in Fig. 10b. Compared with in 1961ЈC85, in 1986ЈC2016, the water vapor in the WZ increases by 1.86ЁС105 kg km?3 s?1. Notably, although the increase in water vapor per unit area in the WZ is small, the increases in EPA and EPD are remarkable, with rates of 9.3 mm yr?1 and 0.7 d yr?1, respectively. Because of the perennial drought and active airflows in the WZ, a small increase in water vapor may have led to the significant increase in precipitation. In addition, except for the northern boundary, the water vapor of the WZ at the other boundaries serves as the input, and the largest input is from the east. The summer net water vapor in the PZ in 1986ЈC2016 is also larger than that in 1961ЈC85, while the increases in EPA and EPD reach 7.5 mm yr?1 and 0.5 d yr?1, respectively. The positive contribution to water vapor mainly originates from the eastern boundary, while the other boundaries provide the output. For the MZ, an obvious decrease in net water vapor is detected between the two periods, which is mainly due to the decreases in water vapor at the western and southern boundaries. This scenario is consistent with those found in previous studies on the weakening of the East Asian monsoon (Wang, 2001; Zhu et al., 2012; Zuo et al., 2012). However, the summer EPA and EPD increase by only 3.7 mm yr?1 and 0.1 d yr?1, respectively, which is almost negligible compared with the average precipitation in the MZ. However, this result also suggests that the decrease in water vapor between the periods 1986ЈC2016 and 1961ЈC85 in the MZ is not the decisive factor causing the EP shift. Figure10. (a) Summer vertical integrated moisture fluxes (vector, units: kg m?1 s?1) and their convergence (shading, units: kg m?2 s?1) for differences between the periods 1961ЈC85 and 1986ЈC2016. The bold vectors indicate that the difference between the two periods is significant at the 0.05 level. (b) Composite differences in the moisture budget in summer between the periods 1986ЈC2016 and 1961ЈC85. Red, yellow, and blue arrows indicate water vapor flux differences (units: kg m?1 s?1) across four boundaries in the WZ, PZ, and MZ, respectively. Larger black numbers represent differences in net water vapor (105 kg m?3 s?1). Purple and green numbers represent differences in EPA [units: mm (10 yr)?1] and EPD [units: d (10 yr)?1], respectively. The same approach is used below.
2
4.4. Changes of atmospheric instability in summer
From the previous analysis, we can see that the summer atmospheric circulation and water vapor transport associated with EP shows a regime shift in NWC. Do these changes affect variability in atmospheric instability and lead to changes in EP in different regions? To answer this question, the changes in moisture potential vorticity and convective instability are analyzed and discussed in this section. Moisture potential vorticity is a synthetically physical term reflecting the dynamic and thermal state of a wet atmosphere. The distribution of moisture potential vorticity can represent convective instability and baroclinic instability well. The moisture potential vorticity component is defined as:where


Pseudo-equivalent potential temperature is defined as:
where


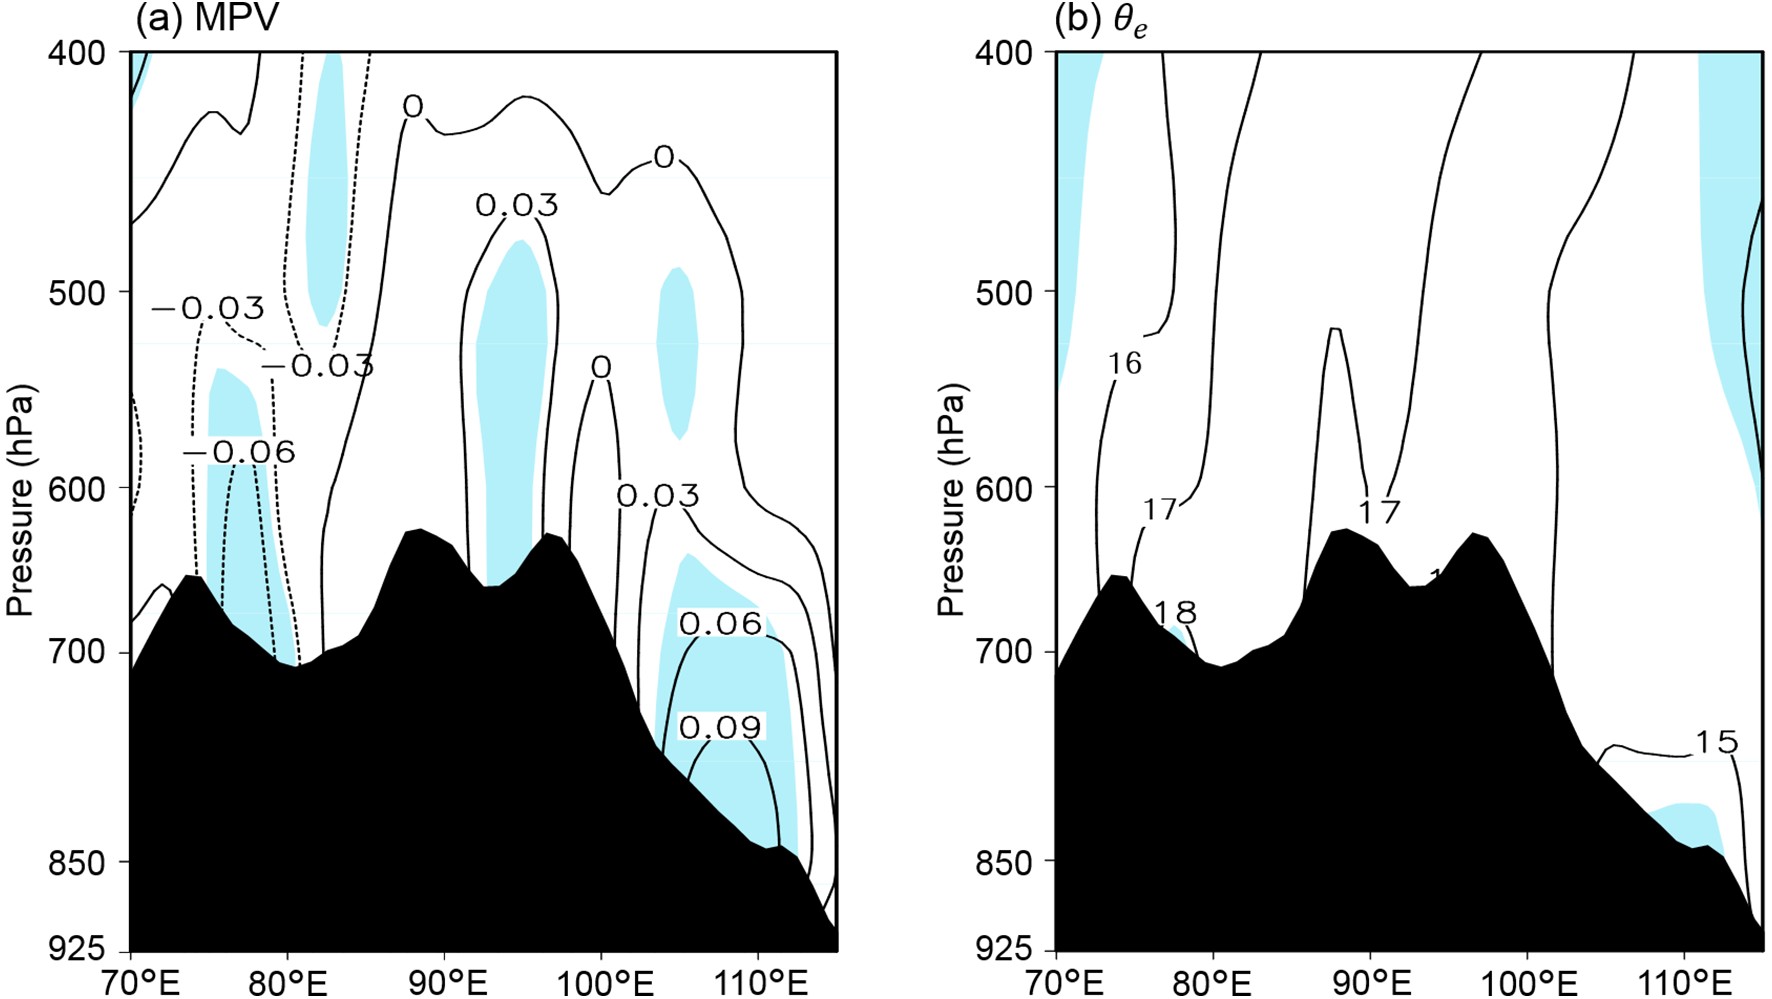 Figure11. Height longitude cross-section of summer moist potential vorticity (MPV) and pseudo-equivalent potential temperature (
Figure 11a shows the composite differences in summer moisture potential vorticity averaged over 34ЁуЈC40ЁуN between the periods 1986ЈC2016 and 1961ЈC85. A significant area of negative values dominates in the vicinity of 75ЁуЈC85ЁуE, while a significant area of positive values occupies most of the area east of 100ЁуE. The above results indicate that the moisture potential vorticity over the WZ and MZ experiences obvious changes between the periods 1986ЈC2016 and 1961ЈC85. The atmosphere over the WZ becomes more unstable after 1986, which assists the increase of summer EP in the WZ. By contrast, the atmosphere over the MZ becomes more stable, which obviously inhibits increased EP in summer. In addition, the changes in moisture potential vorticity over the PZ are much smaller than those over the WZ or MZ. This result is confirmed by the composite differences in


2
4.5. Variations in strong EP summers
In this study, we define strong EP summers as those with values of standardized summer EP Ён 1.0. Therefore, 12 strong EP summers are selected: 1961, 1979, 1981, 1988, 1992, 1998, 2003, 2007, 2010, 2012, 2013, and 2016. There are three strong EP summers and nine strong EP summers during the periods 1961ЈC85 and 1986ЈC2016, respectively.In order to further examine the interdecadal shift in atmospheric circulation associated with summer EP, we analyze the composite differences in strong EP summers between the two periods. The summer EPA differences between the periods 1986ЈC2016 and 1961ЈC1985 are displayed in Fig. 12. Increases in summer EPA are found in the WZ, northern regions of the PZ, and northern regions of the MZ during the strong EP summers of the period 1986ЈC2016. The decrease in summer EPA occurs in most parts of the PZ and MZ. This reflects that a distribution of more summer EPA in the west and less summer EPA in the east is more likely to appear during the strong EP summers in the later period 1986ЈC2016.
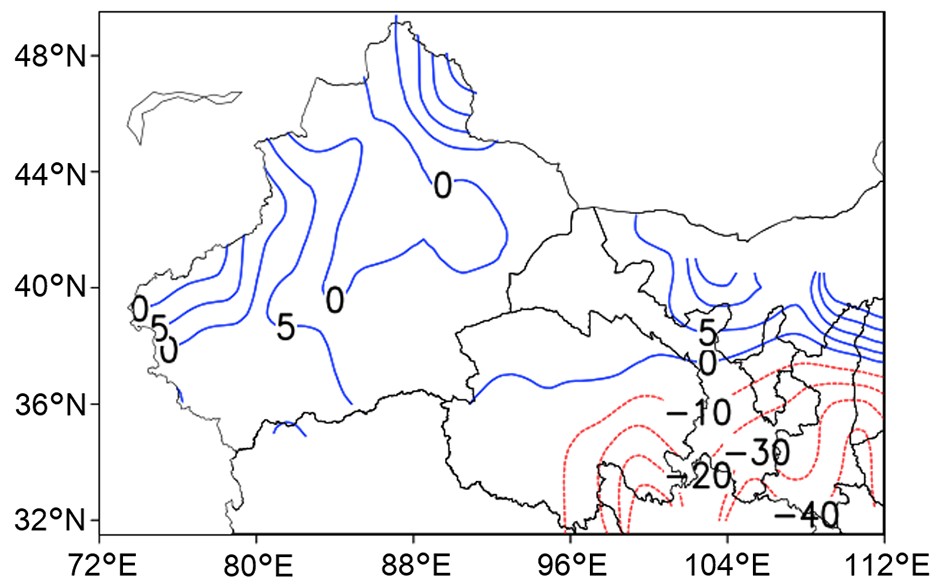 Figure12. Distribution of difference of EPA (units: mm) in summer between the periods 1986ЈC2016 and 1961ЈC85.
The composite difference of atmospheric circulation during strong EP summers between the periods 1986ЈC2016 and 1961ЈC85 is illustrated in Fig. 13. The distributions of height and horizontal wind at upper and lower levels are similar to the changes in circulation patterns with the summer EP shift as presented in Fig. 8. An anticyclonic circulation is noted in the upper troposphere over the WZ, while a huge cyclonic circulation occupies most of Mongolia and Northern China in the mid and lower troposphere to the east of the anticyclonic circulation (Figs. 13a, 13b, and 13c). This circulation pattern strengthens upper-level divergence and lower-level convergence in the WZ (Fig. 14a), which leads to a stronger ascending flow at all levels and increases the EPA in the WZ during strong EP summers in the period 1986ЈC2016 (Fig. 13d, Fig. 14b). At the same time, sinking motion is concurrent with convergence at upper levels and divergence at lower levels in the MZ, which is not conducive to the occurrences of summer EP in the MZ. Consequently, the change in atmospheric circulation plays a similar role in modulating the interdecadal shift of summer EP and the variation in strong EP summers.
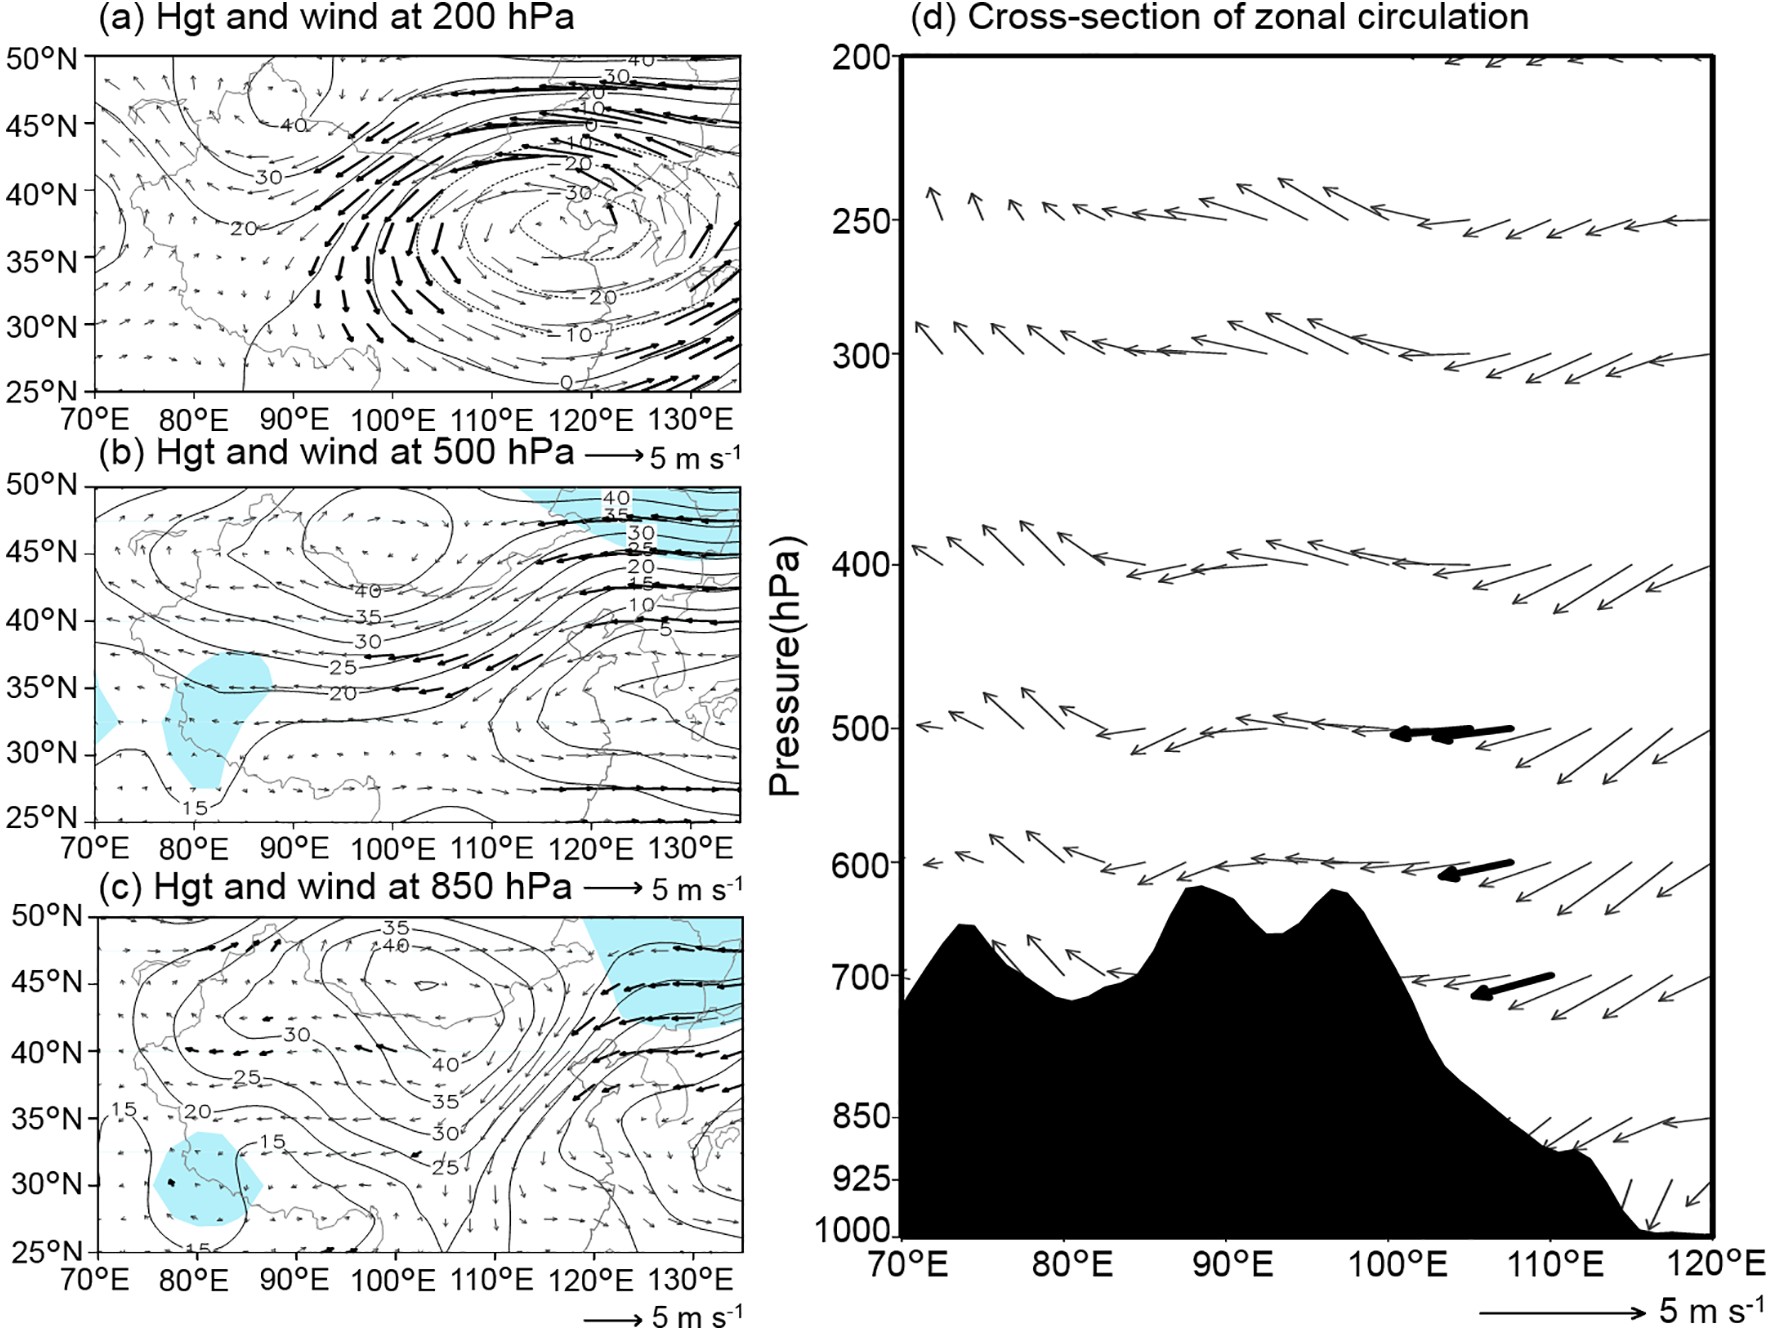 Figure13. Similar to Fig. 8, but for the difference in strong EP summers between the periods 1986ЈC2016 and 1961ЈC85.
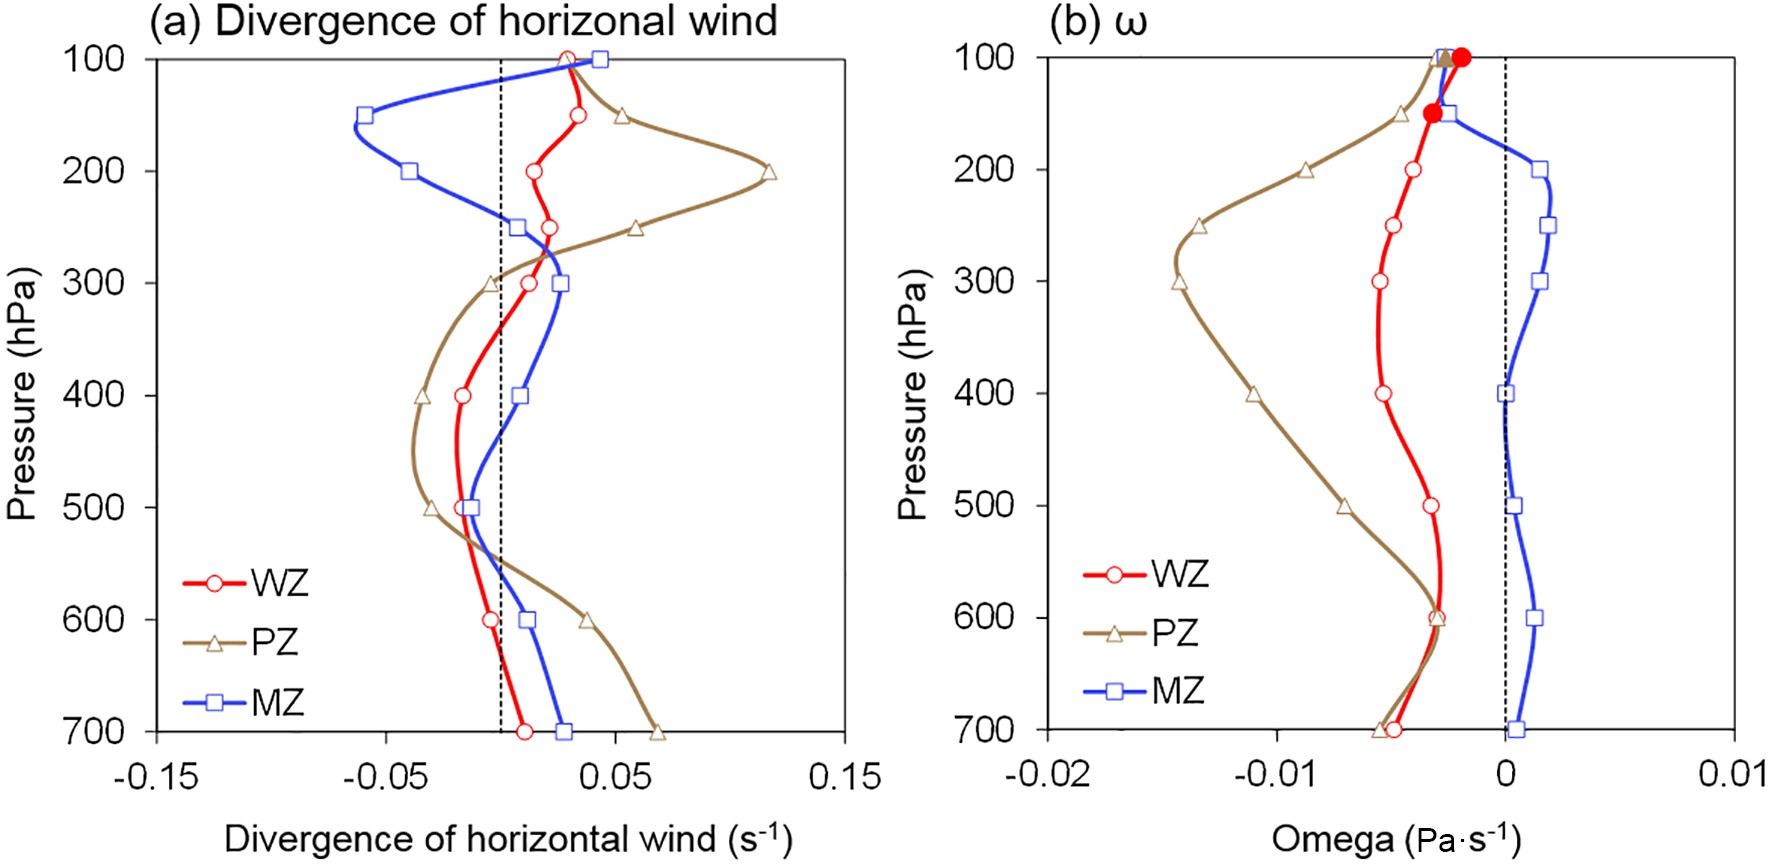 Figure14. Similar to Fig. 9, but for the difference in strong EP summers between the periods 1986ЈC2016 and 1961ЈC85.
The differences in water vapor flux and moisture budget are shown in Fig. 15. Most of NWC is dominated by the westward water vapor flux during strong EP summers in the period 1986ЈC2016. The major areas of convergence are detected in northern and western Xinjiang, the Hexi corridor, and Qinghai and are similar to the locations identified in Fig. 10a, but with stronger intensity. The areas of convergence in Xinjiang and the Hexi corridor are consistent with the increase of summer EP, but not in the relevant areas of Qinghai (Fig. 15a). During strong EP summers in the period 1986ЈC2016, summer EPA and EPD in the WZ increase by 12.6 mm yr?1 and 0.8 d yr?1, respectively. There is a slight decrease of the water vapor per unit area in the WZ, possibly due to the decrease at the western boundary (Fig. 15b). The largest input for the WZ is from the east, and this seems to indicate that the water vapor at the eastern boundary has a great contribution to the increase of EP during strong EP summers after 1986. Along with a large reduction in water vapor, decreases of EPA and EPD are detected in the MZ during strong EP summers in the period 1986ЈC2016, which is roughly similar to the characteristics in the MZ shown in Fig. 10b. However, the change in EP is inconsistent with the variation in water vapor budget in the PZ, which might be related to the complex topography of the PZ and the inhomogeneous change of precipitation.
 Figure15. Similar to Fig. 10, but for the difference in strong EP summers between the periods 1986ЈC2016 and 1961ЈC85.
Apart from circulation and water vapor flux, the composite difference of atmospheric instability during strong EP summers between the two periods is also examined in this section and illustrated in Fig. 16. A negative center of moisture potential vorticity dominates the atmosphere in the vicinity west of 85ЁуE (Fig. 16a), and


 Figure16. Similar to Fig. 11, but for the difference in strong EP summers between the periods 1986ЈC2016 and 1961ЈC85.
The results show that stations with increasing trends of extreme precipitation are distributed over the majority of the WZ and PZ in the last 56 years, while a large percentage of sites in the MZ have decreasing trends. The most obvious increase in EP occurs in the WZ, with more than half of the increasing trends passing the significance test. The SDEP advances at most sites of the WZ and PZ, whereas the EDEP is delayed. Because of the largest advance in the SDEP and largest delay in the EDEP, the DEP in the WZ has the fastest increasing trend of 9.5 d (10 yr)?1.
In this study, an interdecadal shift in summer extreme precipitation in NWC is detected in approximately 1986. Therefore, the climate change in summer between the periods 1986ЈC2016 and 1961ЈC85 was analyzed. In addition, we also investigated the differences in atmospheric conditions in strong EP summers between the two periods. A schematic diagram illustrating how the changes in atmospheric conditions affect EP in summer in the WZ is shown in Fig. 17. In the period 1986ЈC2016, an anticyclonic circulation dominates the upper troposphere over the WZ, which contributes to the upper-level divergence and stronger rising motion over the WZ. An anticyclonic circulation occupies most of Mongolia and Northern China in the middle and lower troposphere, which leads to a stronger easterly airflow and moisture convergence in the WZ. Moreover, the variation in moisture potential vorticity and

 Figure17. A schematic diagram illustrating how the changes of atmospheric circulation, water vapor, and instability affect the summer EP in the WZ.
Previous studies of NWC have often focused on the change in annual precipitation, noting the climate shift from warm-dry to warm-wet (Shi and Shen, 2003). In this study, we paid more attention to the change of EP and its related causes. We found that EP in NWC experiences an abrupt increase in the mid-1980s. There are great differences in variability among three climate zones. It is especially worth noting that there are obviously opposite variation characteristics between the WZ and MZ, which seem to be closely related to the climate shift of the atmospheric conditions of East Asia. Circulation anomalies over East Asia are often closely related to various teleconnections (Chen and Huang, 2012; Duzenli et al., 2018). These large-scale anomalous wave trains can induce circulation anomalies and changes in the intensity and displacement of weather systems (Orsolini et al., 2015; Wei et al., 2017), which will affect precipitation in nearby areas. Hence, the modulation of teleconnections in extreme precipitation in NWC cannot be ignored in future studies. Previous studies have shown that the vertical zonality and longitude zonality of water vapor pressure vary significantly with altitude (Yao et al., 2016), and there is a direct and clear link between particular orographic objects and a local increase in the spatial variability in extreme rainfall (Furcolo et al., 2016; Gao and Wang, 2017), which may explain the most obvious increases in EP over complex terrain regions such as northwestern Xinjiang and the northwestern Hexi Corridor. In addition, the large-scale Asian summer monsoon circulation has experienced a weakening trend in recent decades (Wang, 2001; Zhu et al., 2012), which may play an important role in the decline of summer EP over the MZ of NWC. A relatively small amount of warming in Asia compared to the surrounding regions may be a plausible reason for this change in the monsoon (Zuo et al., 2012). In fact, related research has also found colder vertically integrated tropospheric temperatures (Zhou and Huang, 2010) and tropical lower stratospheric cooling in recent years (Kodera et al., 2019), which may lead to a reduction in static stability in the tropical tropopause layer and an increase in extreme deep convection in NWC.
There are many factors and complex mechanisms affecting climate change in NWC, and the causes of EP are likely very different from those of general precipitation. A collaborative influence of these factors on the variability in EP over NWC should be investigated in the future.
Acknowledgments. The authors would like to extend sincere gratitude for the support from the Second Tibetan Plateau Scientific Expedition and Research Program (2019QZKK0103), the Strategic Priority Research Program of the Chinese Academy of Sciences (Grant No. XDA2006010101), the National Natural Science Foundation of China (91837208), and the National Key Research and Development Program of China (2018YFC1505701). This work was jointly supported by the National Natural Science Foundation of China (42075043) and the Youth Innovation Promotion Association CAS.
