HTML
--> --> -->Previous studies (e.g. Honda et al., 2009; Liu et al., 2012; Mori et al., 2014, 2019; Li et al., 2014) have suggested a significant link between the autumn Arctic sea ice losses (especially in the Barents?Kara Seas) and extreme cold winters in the Northern Hemisphere. However, some studies have argued that the cold Eurasian winter extremes were not caused by the Arctic sea ice losses, but by internal climate variability (e.g. Moore and Renfrew, 2012; Fischer and Knutti, 2014; McCusker et al., 2016). Other studies further indicated that the Northern Hemisphere spring or summer climate was also influenced by the large Arctic sea ice losses (e.g. Wang and He, 2015; Wu et al., 2016, Ji and Fan, 2019).
In addition to the linkage between Arctic sea ice and global or hemisphere climate, a linkage between Arctic sea ice in spring and regional climate in East Asia has been explored. Wu et al. (2009) illustrated that the spring sea ice concentration in the Greenland Sea and the Arctic Ocean significantly impacted the summer precipitation over China during the years 1968–2005. Guo et al. (2014) revealed that, during the years 1979–2009, the spring (February?March?April) total Arctic sea ice area positively correlated with summer precipitation in the Yangtze River Valley, and negatively correlated with summer precipitation in northeastern China, the Indochinese Peninsula, and the South China Sea. Li et al. (2018a) found that the Barents Sea ice loss in March led to decreases in precipitation over northeastern China during the years 1960–2016.
The Bering Sea is a marginal sea connected to the Arctic and the Pacific. It is an important component in the Arctic climate system. During the last four decades, the Bering sea ice does not show a significant decreasing trend, though total Arctic sea ice is declining (Comiso et al., 2008). Recently, winter Bering Sea ice cover frequently continues to break its lowest record since 2015/2016 (Iida et al., 2020). Changes in autumn?winter Bering sea ice can affect the large-scale winter atmospheric circulation in the Northern Hemisphere (e.g. Liu et al., 2007; Li and Wang, 2013; Lee et al., 2015; Zhuo and Jiang, 2020).
In the Bering Sea, sea ice starts appearing in late October or early November (Overland and Pease, 1982; Cornwall, 2019; Stabeno and Bell, 2019). The maximum sea ice extent may occur as early as January or as late as April, but more typically in March. Sea ice melts throughout spring and disappears in June (Stabeno et al., 2012). Some reanalysis-based studies also claim that melt season (spring/pre-spring) Bering sea ice changes may influence East Asian summer precipitation, though the mechanism and certain covariance regions remain unclear. Niu et al. (2003) found that during the years 1968–1998, changes in spring sea ice extent in the Bering Sea and the Sea of Okhotsk (BOS) were highly related to the summer precipitation in southeastern China. When spring BOS sea ice is lower, summer climate is wetter in southern China, but hotter and drier in northern China. Zhao et al. (2004) showed a similar relationship for the period of 1971–1999. The land surface process over Western Europe plays a crucial role to link the spring BOS variation and East Asian summer rainfall. Zhou and Wang (2014) pointed out that the amount of Bering Sea ice in February?March?April significantly impacts crop productions in northeastern China. The responsible mechanism is the sea ice anomaly, which induces a North Pacific Oscillation pattern anomaly (NPO) and further impacts the summer SST changes over the Sea of Japan. The warmer SST over the Sea of Japan transports more moisture to northeastern China and leads to more crop productions in summer.
Despite previous studies reporting the potential linkage between the melt season Bering Sea ice and East Asian summer precipitation, their findings on co-variation regions between them and the responsible mechanism were inconsistent. In this study, we use four sea ice and two precipitation datasets to further explore the linkage between the Bering Sea ice cover (BSIC) during the melt season (March?April?May?June, MAMJ) and East Asian precipitation in summer. Section 2 presents the data and methods used in this study. Section 3 illustrates the linkage between the MAMJ BSIC and the East Asian summer precipitation. Section 4 shows our simulated run with Community Atmospheric Model version 5 (CAM5). Section 5 highlights our main conclusions.
Two gridded precipitation datasets are used. They are the Climatic Research Unit Time Series version 4.01 with a resolution of 0.5° × 0.5° (CRU; Harris and Jones, 2017) and the Global Precipitation Climatology Project V2.3 (GPCP) released by the Global Precipitation Climatology Centre (Adler et al., 2018) with a resolution of 2.5° × 2.5°.
Atmospheric parameters used in this study come from the ERA-Interim reanalysis dataset (Dee et al., 2011) with a horizontal resolution of 1.5° × 1.5°. They include monthly 3-dimension wind (u, v, w), sea level pressure (SLP), the temperature at 2 meters (T2m), geopotential height (Z), and specific humidity (q). Monthly SST comes from the HADI1 dataset (Rayner et al., 2003). Based on these parameters, we also calculated the vertically integrated water vapour transport (VQ) from 1000 to 100 hPa pressure levels. Wave activity flux (WAF) is calculated based on the method proposed by Takaya and Nakamura (2001). We also use the wind stress derived from the National Centre for Environmental Prediction/National Centre for Atmospheric Research (NCEP/NCAR) reanalysis data with a horizontal resolution of 2.5° × 2.5° (Kalnay et al., 1996).
We use composite analysis, linear regression, and Pearson correlation coefficient analysis to investigate the relationship between the MAMJ BSIC and atmospheric circulation and precipitation. The significance level is computed by Student’s t-test with n-2 degrees of freedom, where n is the number of rows of variables. We use the Monte Carlo test to examine the significance for the linear regression results (Wu et al., 2013).
Due to the relatively high reliability of satellite observations, the study period is confined to the years 1980–2016. In this study, the annual ENSO signal and long-term trend are removed before each analysis.
3.1. MAMJ BSIC and JJA East Asian precipitation
Figure 1a shows the climatology of sea ice cover edge line in the Bering Sea during the melt season. Bering Sea ice significantly melts from March to June. We present our results only using NOAA/NSIDC, as all datasets yielded similar results (Fig. 1a). The mean MAMJ BSIC time series show an increase and a decrease of up to 400 × 103 km2 in the four sea ice datasets. The MAMJ BSIC decreases from the mid-1980s to the early 1990s. From 1990 to the early-2000s, it remains normal and then increases from the late-2000s reaching the maximum in 2012 (Fig. 1b). Figure 1c shows a significant high-frequency variation in MAMJ BSIC with 2–4 years from 1980–2016, and a long-term period of 10–15 years (Fig. 1c). During 1980–2016, the MAMJ BSIC reaches a maximum at 7 years (1984, 1992, 1994, 2008, 2010, 2012, 2013; hereafter referred to as high BSIC years), and reaches a minimum at 7 years (1989, 1996, 2001, 2002, 2003, 2004, 2016; hereafter referred to as low BSIC years).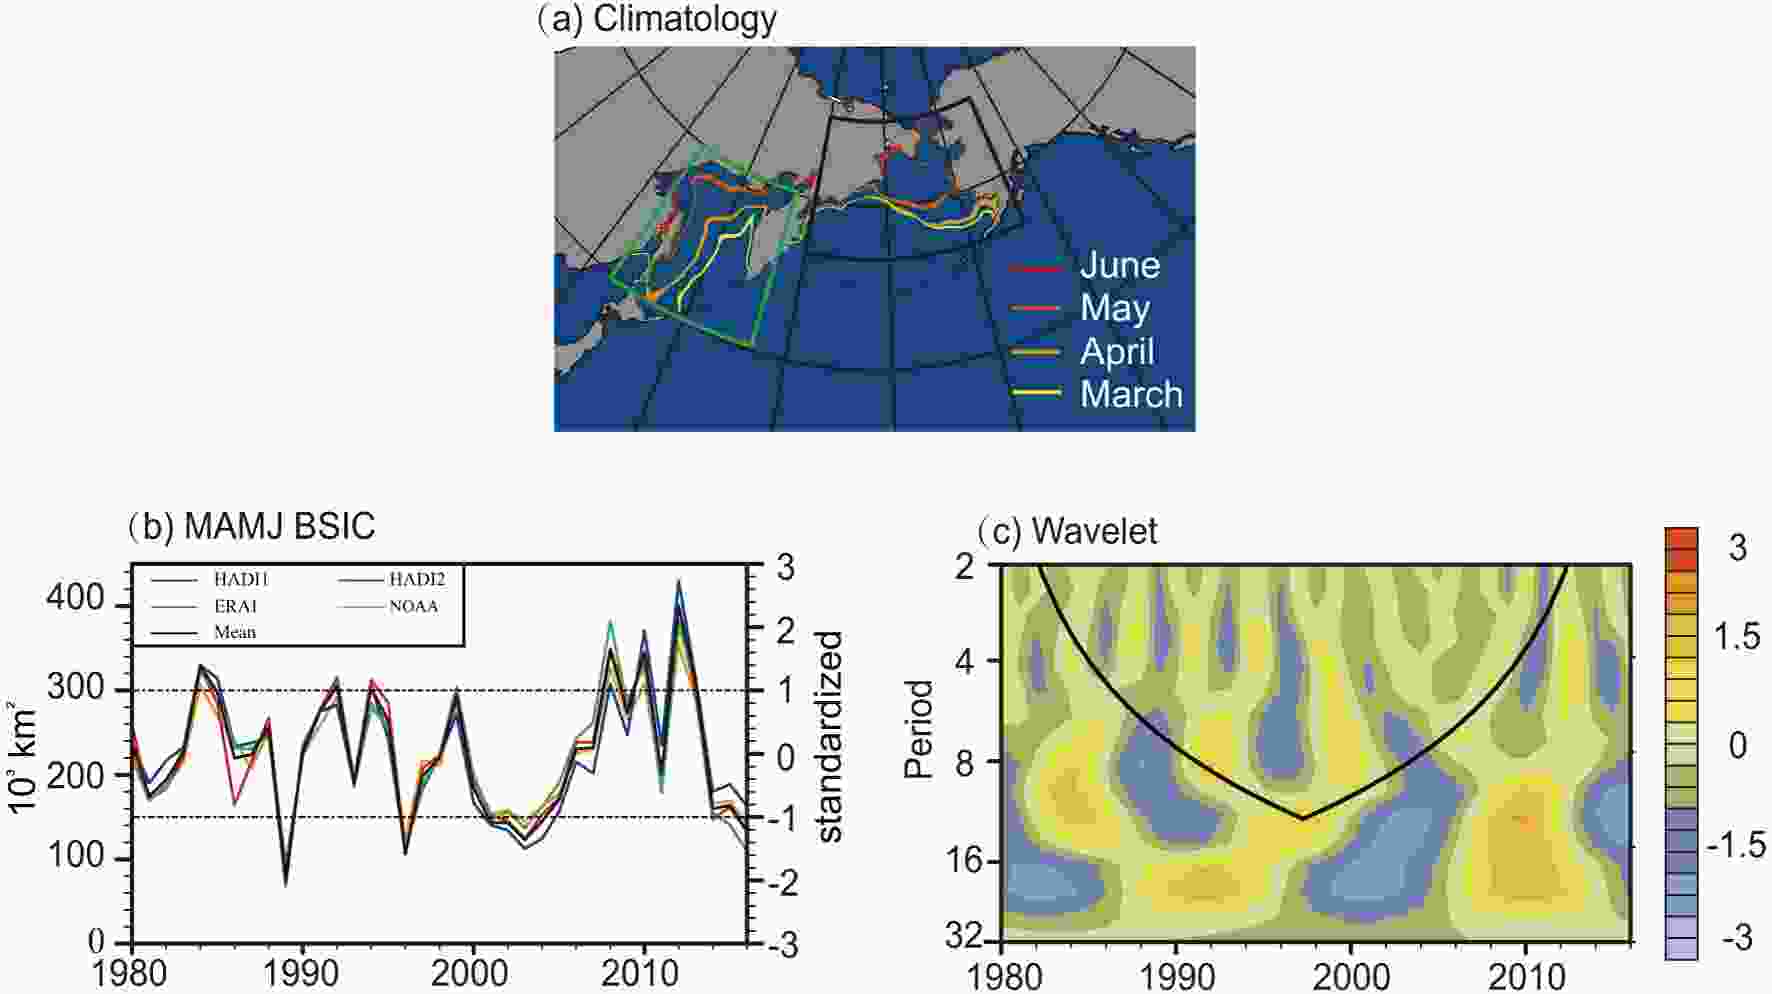 Figure1. (a) NOAA/NSIDC Climatology of sea ice, edge line in March (yellow), April (orange-yellow), May (orange-red), and June (red). The polyline represents the Bering Sea region (55°?70°N, 165°E?155°W). (b) De-trended time series of MAMJ Bering Sea ice cover (BSIC); the high/low BSIC years defines as SIC above-normal (standard deviation > 1:1984, 1992, 1993, 2008, 2010, 2012, 2013)/below-normal MAMJ BSIC (standard deviation < 1:1989, 1996, 2001, 2002, 2003, 2004, 2016). (c) Morlet wavelet transform coefficient for the mean MAMJ BSIC time series (black line in 1b). Shading indicates the amplitude of the real part of the wavelet coefficient.
When we calculate the regression between East Asian JJA precipitation and the meantime series of MAMJ BSIC, the regression maps show a triple pattern over mainland China (Figs. 2a and b), no matter which precipitation datasets (CRU or GPCP) are used. The significant positive correlations appear in the region of Lake Baikal and northeastern China (Baikal?NEC). In other regions, the correlations are insignificant. We calculate the time series of mean JJA precipitation in the Baikal?NEC region (area averaged, Fig. 2c), as well as the correlation coefficient between the summer Baikal?NEC precipitation (Fig. 2c) and the mean MAMJ BSIC (Fig. 1b). The correlation coefficient is 0.3 and exceeds the 95% significance level during the years 1980–2016. While after the year 2000, the correlation coefficient rises to 0.64 and remains significant. We also show a composite of the 7 high BSIC years and the 7 low BSIC years. The difference (Fig. 2d) shows that more moisture is transported from the tropical Pacific to the Sea of Japan, and an area of cyclonic convergence appears over the Baikal?NEC region in JJA, when BSIC is high (relative to the low BSIC years).
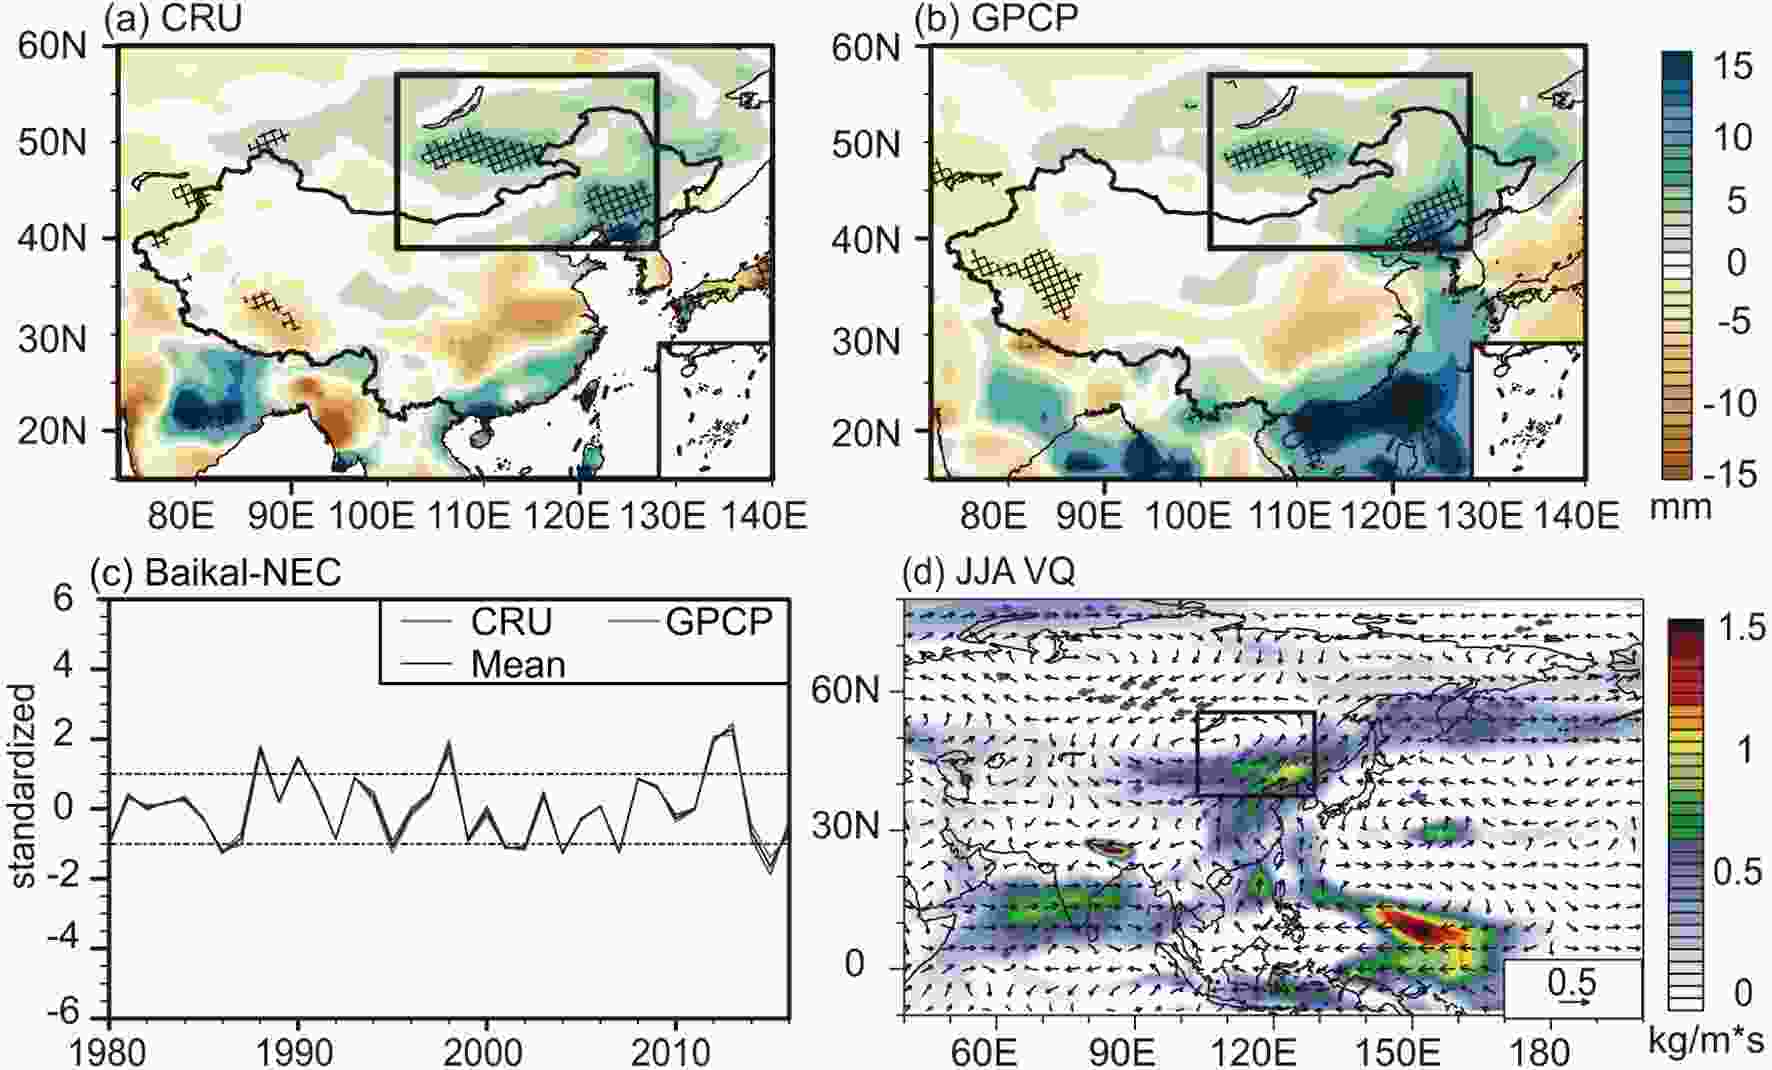 Figure2. (a) CRU; (b) GPCP JJA precipitation regressed to MAMJ BSIC (dots denote significance exceeding 95% confidence level based on the Monte Carlo test). (c) Time series of precipitation over Baikal?NEC in JJA during 1980–2016. (d) Composite differences of VQ (kg m?1 s?1) between high and low BSIC years in JJA (purple vectors denote the 95% confidence level based on Student’s t-test).
2
3.2. The possible mechanism in linkage between MAMJ BSIC and JJA East Asian precipitation
The difference between high and low BSIC years further illustrates that a positive SLP anomaly in MAMJ appears over Greenland and the mid-high latitude North Atlantic (black box in Fig. 3a), when the BSIC is high (relative to the low BSIC years). This positive anomaly reorganizes wind circulations (Fig. 3b). As a result, changes in SST in a dipole-pattern in the North Atlantic between 15°–55°N (Fig. 3c) can be maintained in summer (JJA). In this dipole SST pattern, a cooling centre appears along the coast of Europe-Africa, while a warming centre appears along the east coast of North America. Such a dipole SST pattern was reported by Zorita et al (1992), where they suggested that the positive SLP anomaly causes the SST dipole pattern in the North Atlantic in the adjacent season.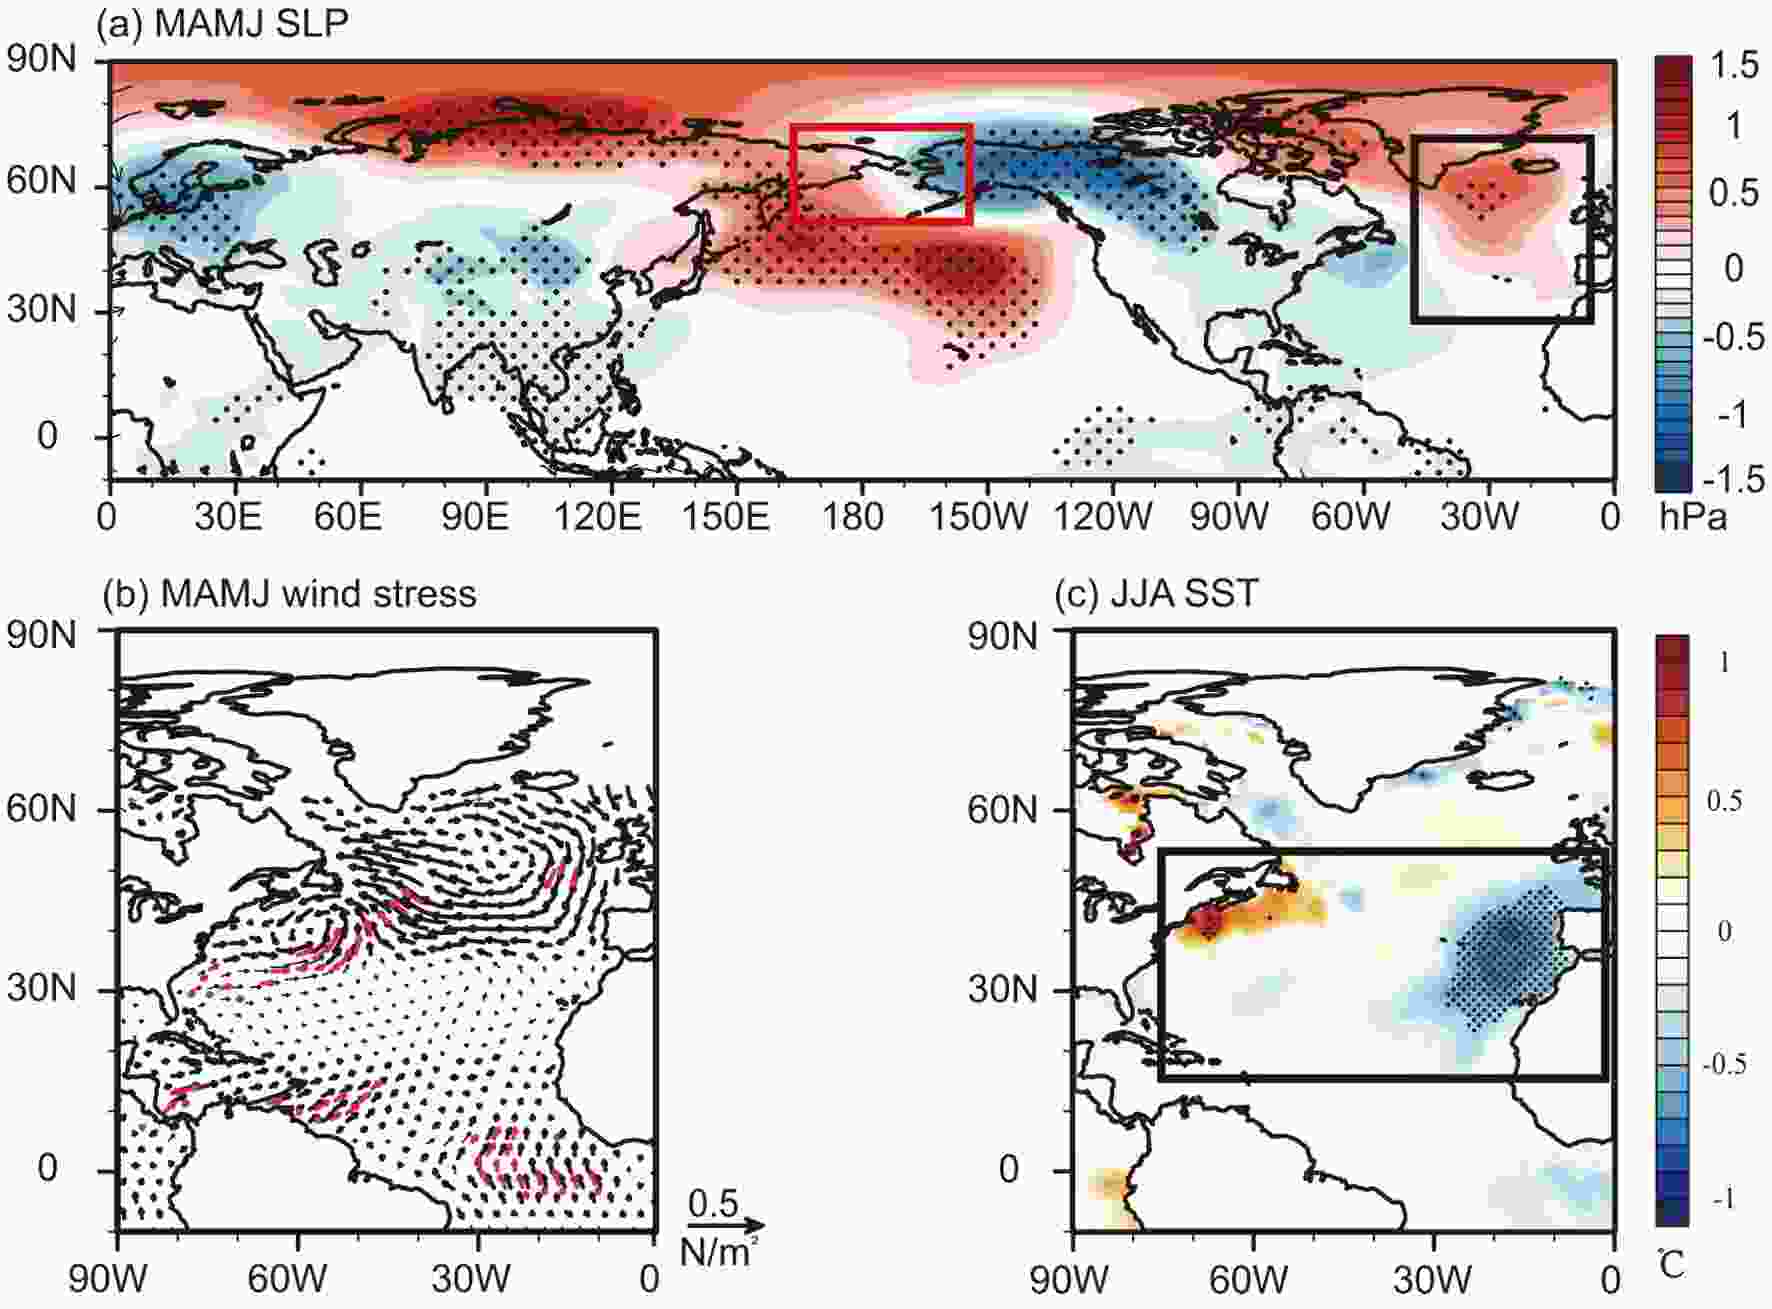 Figure3. Composite differences between high and low BSIC years. (a) SLP (shadings, hPa) in MAMJ; (b) wind stress over the North Atlantic in MAMJ; (c) SST (°C) in JJA (dots denote changes with significance higher than 95% confidence level based on Student’s t-test).
Figure 4a shows the difference in T2m in MAMJ between the composited high and low BSIC years. To the north of 60° N, there are four zonally orientated T2m anomaly centres. Two cooling centres appear over North Europe and the Sea of Japan, while two warming centres occur over East Siberia and North America. Corresponding to the temperature anomalies, a wave train can be observed at 500 hPa (in a "? + ? +" pattern) from Western Europe to North America (Fig. 4b). However, in JJA, the T2m cooling centre turns to a warming centre over the Sea of Japan (Fig. 4c). At the same time, the 500 hPa geopotential height field shows a positive anomaly over the Sea of Japan, and a negative anomaly over the Baikal?NEC region (Fig. 4d). This change indicates that the mean East Asian trough is weakened, whereas the Lake Baikal trough is intensified when BSIC is high (relative to the low BSIC years).
 Figure4. Composite differences between high and low BSIC years. (a) T2m in MAMJ (°C); (b) Z500 in MAMJ (gpm); (c) T2m in JJA (°C); (d) Z500 in JJA (gpm) (dots denote changes with significance higher than 95% confidence level based on Student’s t-test).
These two wave trains can be found in the anomaly field of composited WAF at 200 hPa in MAMJ (Fig. 5a). From the Bering Sea, a wave train propagates southeastward, crossing the North American continent, to the North Atlantic around 40°N. Then, the wave train turns northward and continues propagating eastward between 40°–60°N over the North Atlantic. The meridional profile averaged along 40°–60°N (the green polygon in Fig. 5b) shows that WAF moves upward from the lower layer on the west side of the Bering Sea (near 180°) and downwards over North America and the North Atlantic (Fig. 5c). The results for geopotential height and WAF regressed to the MAMJ BSIC time series (Fig. 1b) also show similar features (Figs. 5b and d) as the difference in composite analyses (Fig. 5a and c).
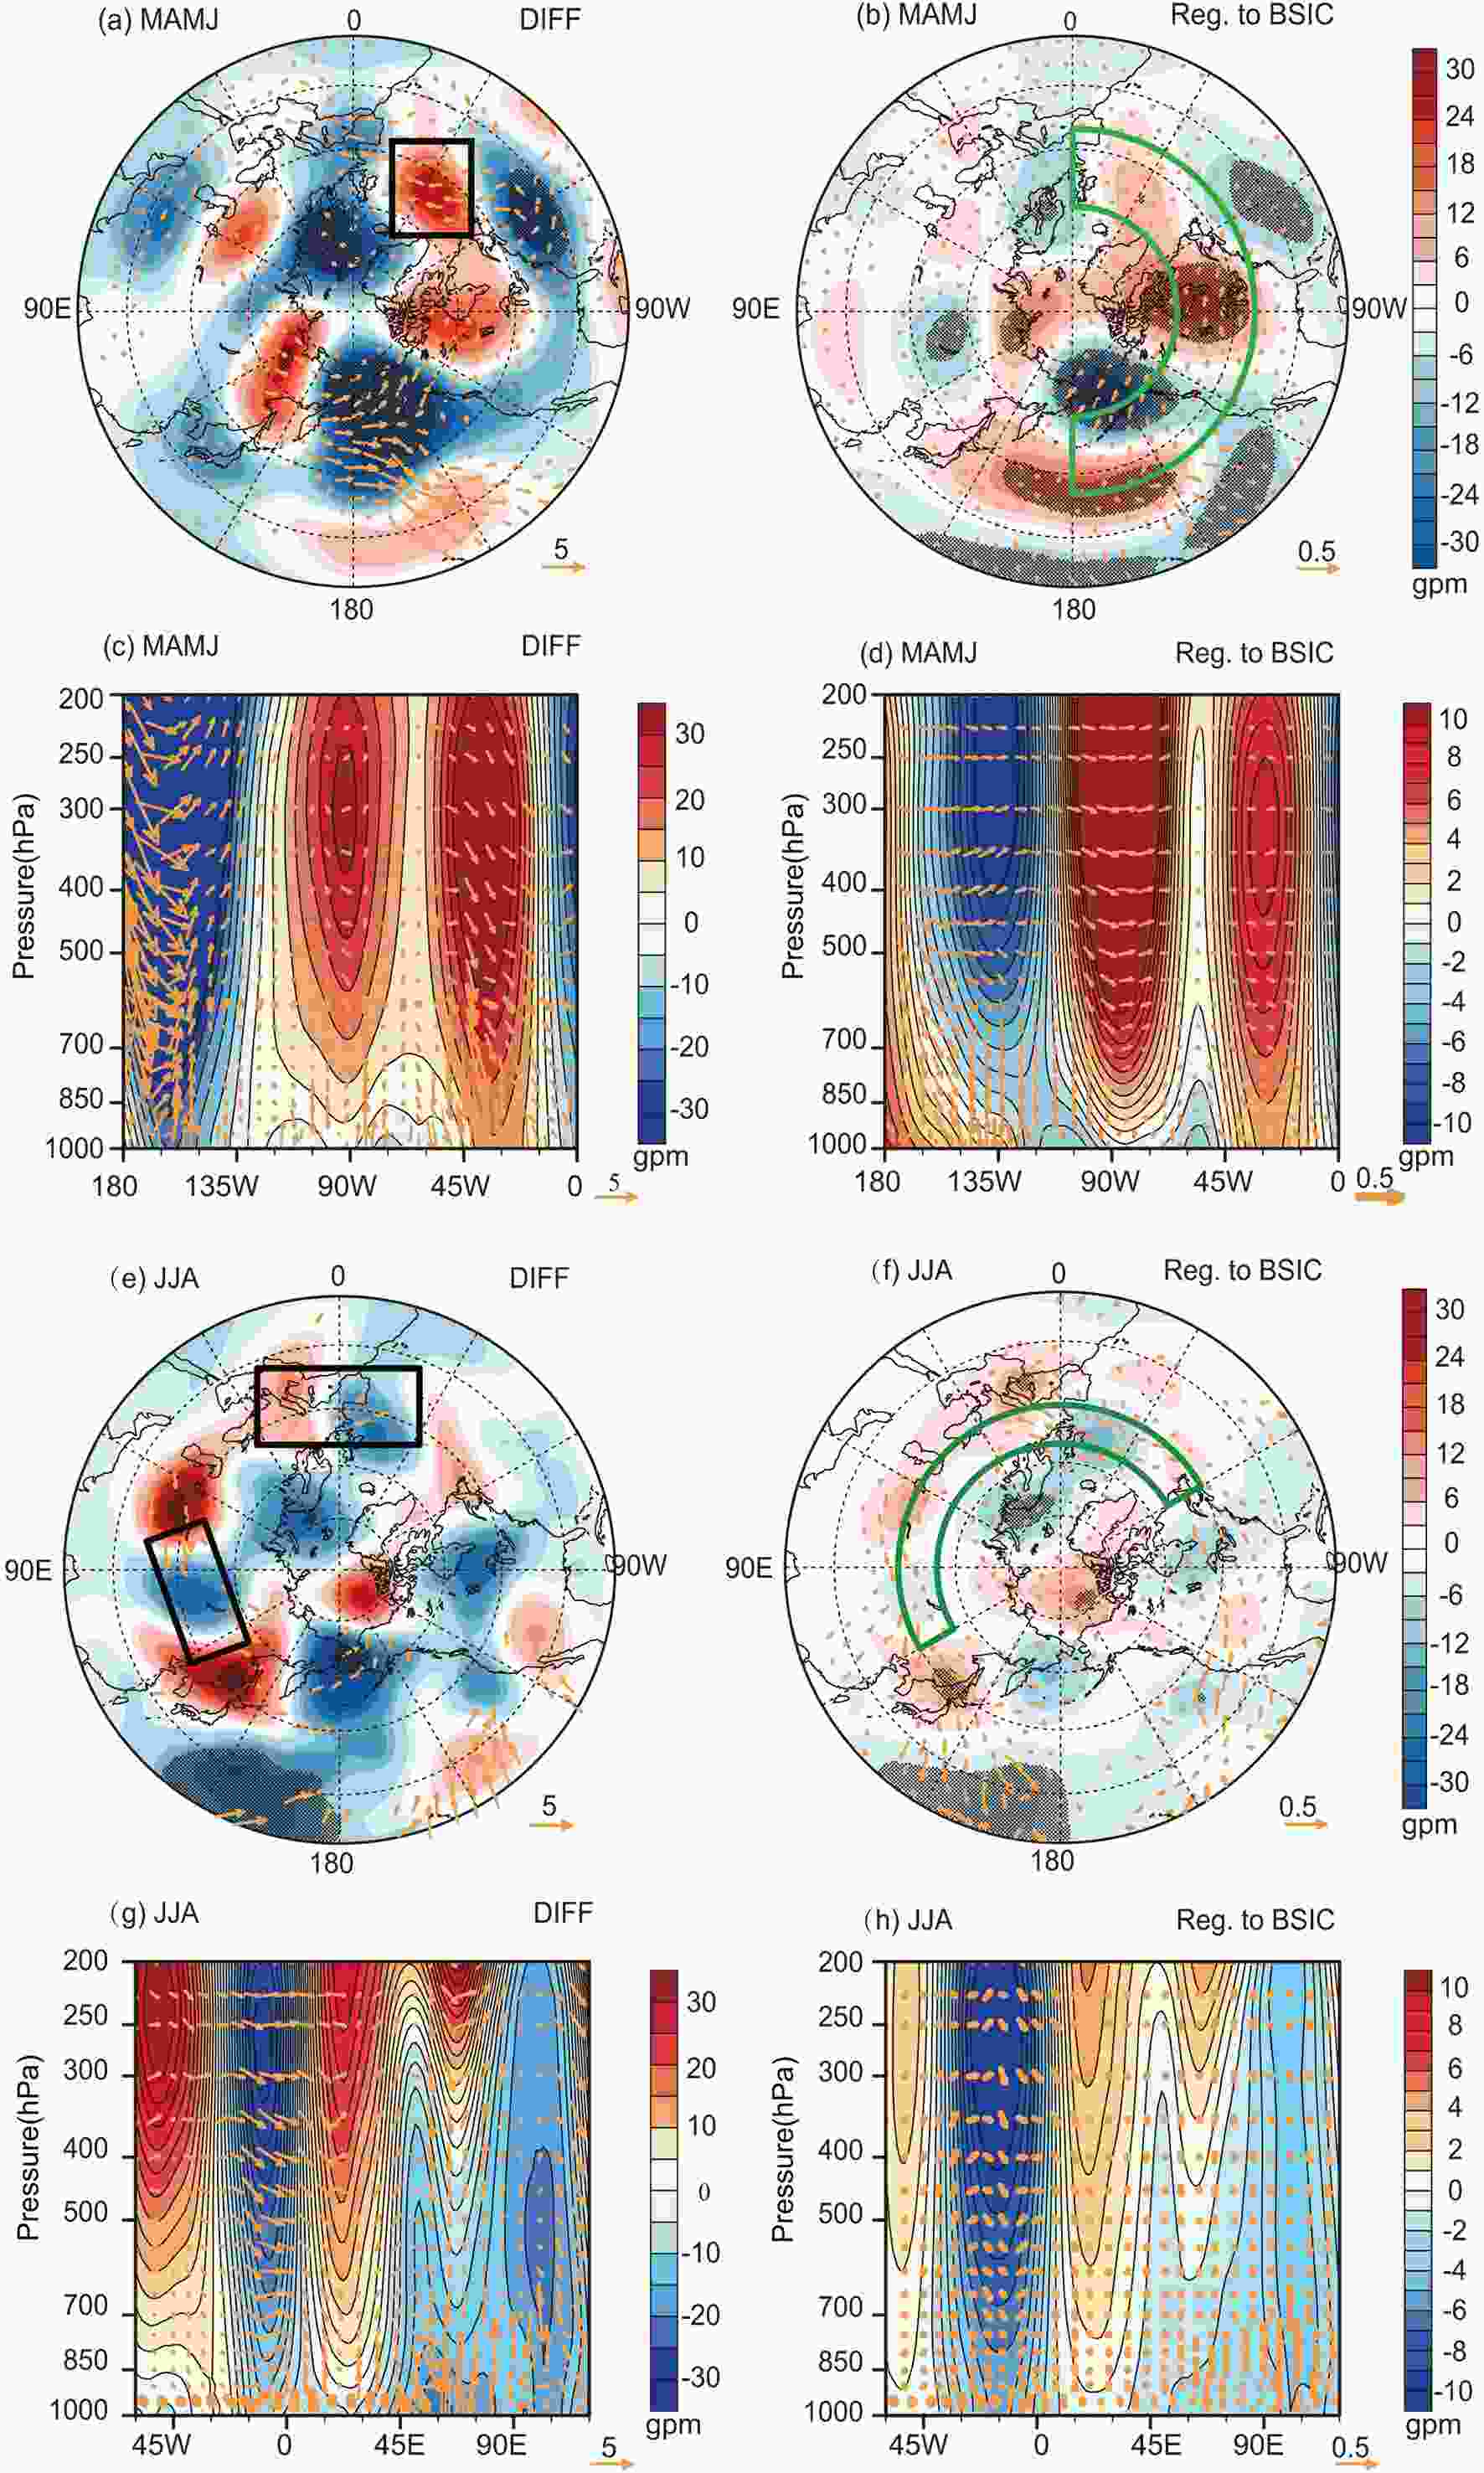 Figure5. Composite differences in geopotential height (shadings, gpm) and WAF (vectors, m2 s–2) in MAMJ and JJA. (a) Composite differences in 200 hPa geopotential height in MAMJ. Vectors smaller than 1 m2 s?2 are not shown. (b) same as (a) but the results regressed to the BSIC time series. Vectors smaller than 0.1 m2 s?2 are not shown. (c) Composite differences in vertical-horizontal cross section averaged along 40°–60°N in MAMJ. (d) same as (c) but for the results regressed to BSIC time series. (e) and (f) are the same as (a) and (b) but in JJA; (g) Composite differences in vertical-horizontal cross section averaged along 45°–55°N in JJA. (h) same as (g) but for the results regressed to BSIC time series.
In JJA, a clear, zonally orientated wave train propagates from the mid-latitude North Atlantic to the Baikal?NEC region (Fig. 5e). At 200 hPa, the wave energy propagates from the Atlantic to Lake Balkhash, Lake Baikal, and the Sea of Japan (Fig. 5f). The meridional profile averaged along 45°–55°N shows that the wave energy is transported upward from the western Atlantic and downward to the Baikal?NEC region. Over Baikal?NEC, there is a deep low-pressure anomaly in the whole troposphere (Figs. 5g and h). The low-pressure anomaly favors summer rainfall in the region.
Therefore, based on the above diagnoses, we hypothesize that in MAMJ changes in BSIC can cause an anomalous wave train and thus atmospheric circulation reorganization over the North Atlantic. The reorganization of atmospheric circulation maintains SST anomalies in a dipole pattern in the North Atlantic in summer, which leads to an anomalous wave train propagated to East Asia, thus favouring precipitation increasing over Baikal?NEC in summer.
4.1. Experimental Design
Here, we perform sensitivity experiments with the Community Atmospheric Model, version 5 (CAM5) to validate our hypothesis. A detailed introduction of CAM5 can be found in Neale et al (2010). The resolution used here is 0.937° × 1.25° in the horizontal directions, with 30 hybrid sigma-pressure levels in the vertical direction.We design four experiments, including one control run (CTRL) and three sensitivity experiments (Table 1). In CTRL, the boundary conditions of SST and SIC are prescribed as the climatological monthly mean during 1980–2016. In the sensitivity experiment of BSIC (Exp. BSIC), we first calculate the anomalous composite SIC over the Bering Sea (55°–70°N, 165°–195°E) based on the high and low years of BSIC, and then these composite BSIC anomalies in MAMJ are added to the CTRL sea ice boundary condition. In Exp. BOK, we consider the composite BSIC anomalies in MAMJ in the Bering Sea, as well as in the Okhotsk Sea (45°–60°N, 140°–160°E). We design Exp. BOK in order to improve the simulated responses in the North Pacific region. Finally, we conduct a SST sensitivity experiment (Exp. ASST). In Exp. ASST, we first calculate the monthly SST differences in JJA over the North Atlantic (15°–55°N) between high and low BSIC years, and then add these differences in the CTRL SST boundary condition. Exp. ASST is designed to investigate the impact of the dipole SST pattern in the central North Atlantic on summer atmospheric circulation over Eurasia. In all experiments, other boundary conditions are identical and fixed in the year 2000. CTRL runs for 40 years. All the sensitivity experiments are initialized from the 10th year in CTRL and run for 30 years. We analyze the last 30-year model outputs.
| SST | SIC | |
| CTRL | Global monthly climatology during 1980–2016 | Monthly climatology during 1980–2016 in Northern Hemisphere |
| Exp BSIC | Same as CTRL | Composite monthly SIC anomalies over the Bering Sea [55°–70°N, 165°E–155°W] during MAMJ added to CTRL |
| Exp BOK | Same as CTRL | Composite monthly SIC anomalies over the Bering Sea [55°–70°N, 165°E–155°W] and the Sea of Okhotsk [45°–60°N,140°–150°E] during MAMJ added to CTRL |
| Exp ASST | Composite monthly SST anomalies over the North Atlantic [15°–55°N, 80°W–0°] during JJA added to CTRL | Same as CTRL |
Table1. Experimental designs and boundary conditions.
From these experimental designs, the differences between the Exp. BSIC and the CTRL reveal the effect on the atmosphere of high MAMJ BSIC; the differences between the Exp. BOK and the CTRL show the atmospheric changes in response to the MAMJ sea ice anomalies over North Pacific (Bering sea and the Okhotsk sea) between the high and low BSIC years; the differences between the Exp. ASST and the CTRL indicate how the atmosphere over the Eurasian continent responds to the North Atlantic dipole SST pattern in summer.
2
4.2. The responses of atmospheric circulation anomalies to sea ice changes
Figure 6 shows the simulated SLP anomalies from two sea ice anomaly forcing experiments, Exp. BSIC and Exp. BOK. In Exp. BSIC, the simulation for the North Atlantic part is quite similar to the results obtained from ERAI (Fig. 3a). In MAMJ, there is a high-pressure anomaly over the east coast of 60°N in the North Atlantic with a low-pressure anomaly centre over the west coast of the North Atlantic (black box in Fig. 6a). The simulated result is quite well matched with the result in ERAI over the North Atlantic region, but the Exp. BSIC shows a limited similarity with ERAI over the North Pacific. The features of the intensified Aleutian low and Okhotsk high, as seen in Fig. 3a, are not able to be reproduced in the Exp. BSIC. Therefore, another experiment (Exp. BOK) is performed to try to improve simulation responses for the North Pacific region. The MAMJ SLP anomaly in the Exp. BOK produces the intensified Aleutian low and Okhotsk high (Fig. 6b), resembling the pattern in ERAI (Fig. 3a). It is worth noting, that the SLP anomaly over the North Atlantic in Exp. BOK is qualitatively consistent with Exp. BSIC. We see that the positive SLP anomaly centre over 60°N in the North Atlantic is also produced in Exp. BOK (Fig. 6b). This indicates that the MAMJ SLP anomaly can also persist into June in Exp. BOK. This indicates that the MAMJ SLP anomaly over the North Atlantic is mainly driven by the MAMJ Bering SIC changes, not the Okhotsk SIC.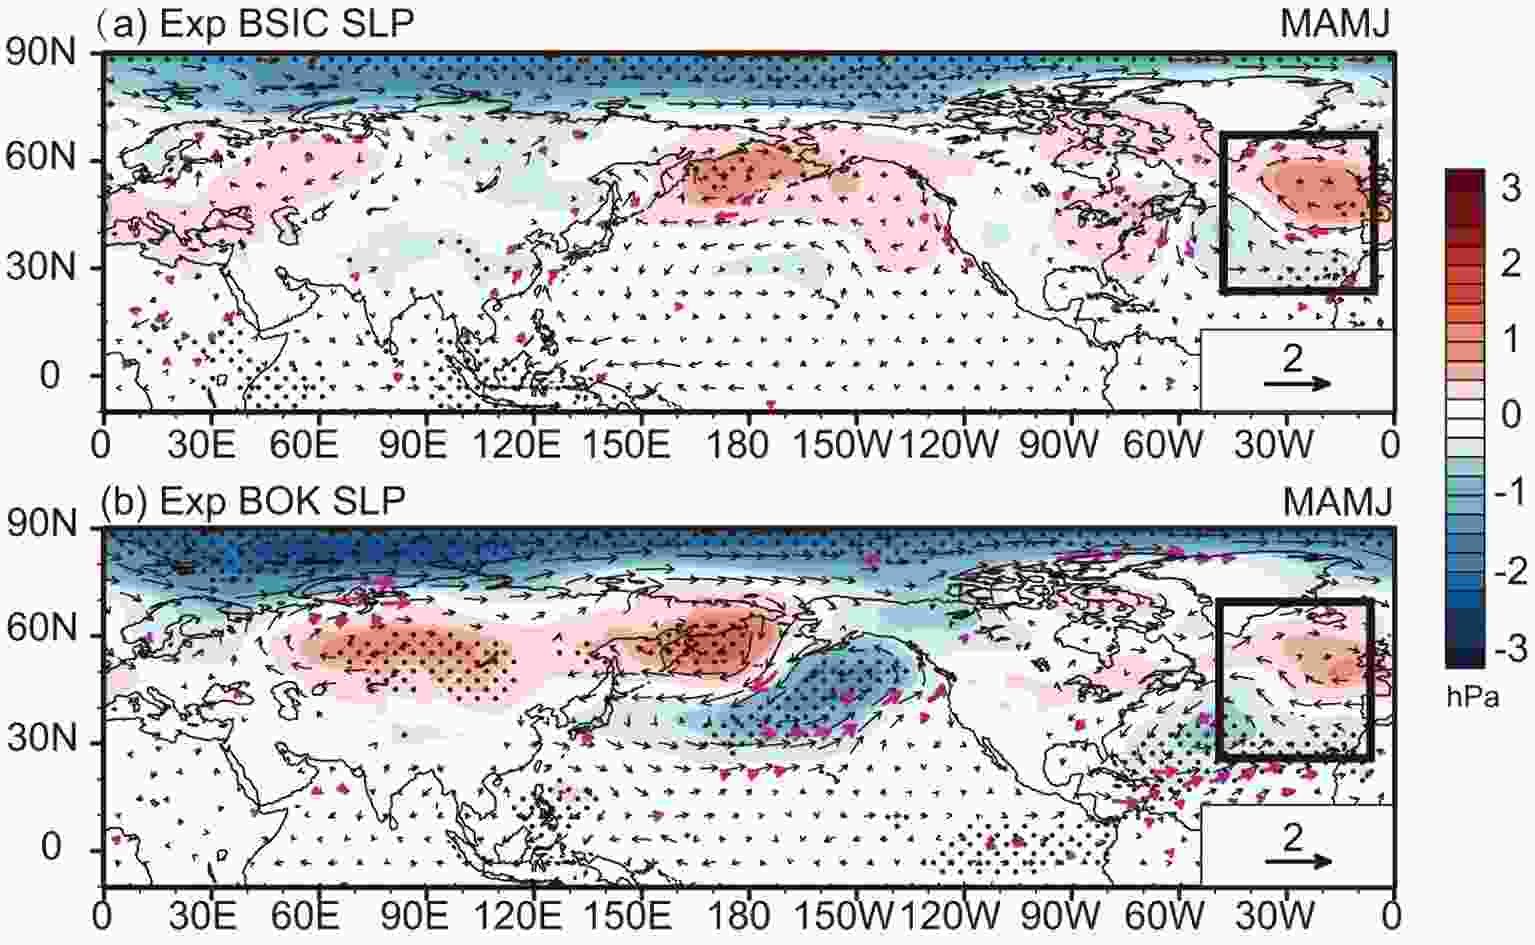 Figure6. Anomalies of SLP (shadings, hPa) and horizontal wind at 925 hPa (vectors, m s?1). (a) Exp. BSIC in MAMJ, relative to CTRL, and (b) Exp. BOK in MAMJ, relative to CTRL, both where dots and purple vectors denote changes with significance higher than 95% confidence level based on Student’s t-test.
In Exp. BSIC, the WAF at 200 hPa shows a wave train that originates from the mid-high latitude North Pacific. This wave train propagates to the central North Atlantic (about 40°N) and then towards the east coast of the North Atlantic (60°N). The wave train contains the stationary wave energy and leads to a positive geopotential height anomaly over the North Atlantic (60°N, Fig. 7a). This wave train is also shown in Exp. BOK (Fig. 7b), which is more similar to the results found in ERAI (Figs. 5a and b). Compared to the result obtained from ERAI (Figs. 5a and b), the negative geopotential anomaly centre over the North Pacific is weaker and moves further southward in the Exp. BSIC (Fig. 7a). Therefore, unlike the result in ERAI (Fig. 5c), the deep, wide low geopotential anomaly system over 180°–135°W is not shown in the meridional profile averaged along 40°–60°N in Exp. BSIC, and neither is the upward WAF from 180° (Fig. 7d). In Exp. BOK, the simulated position of the negative geopotential anomaly over the North Pacific is much more similar to the ERAI than in Exp. BSIC. We also see the WAF in Exp. BOK through a similar pathway (Fig. 7e) to the ERAI (Figs. 5c and d).
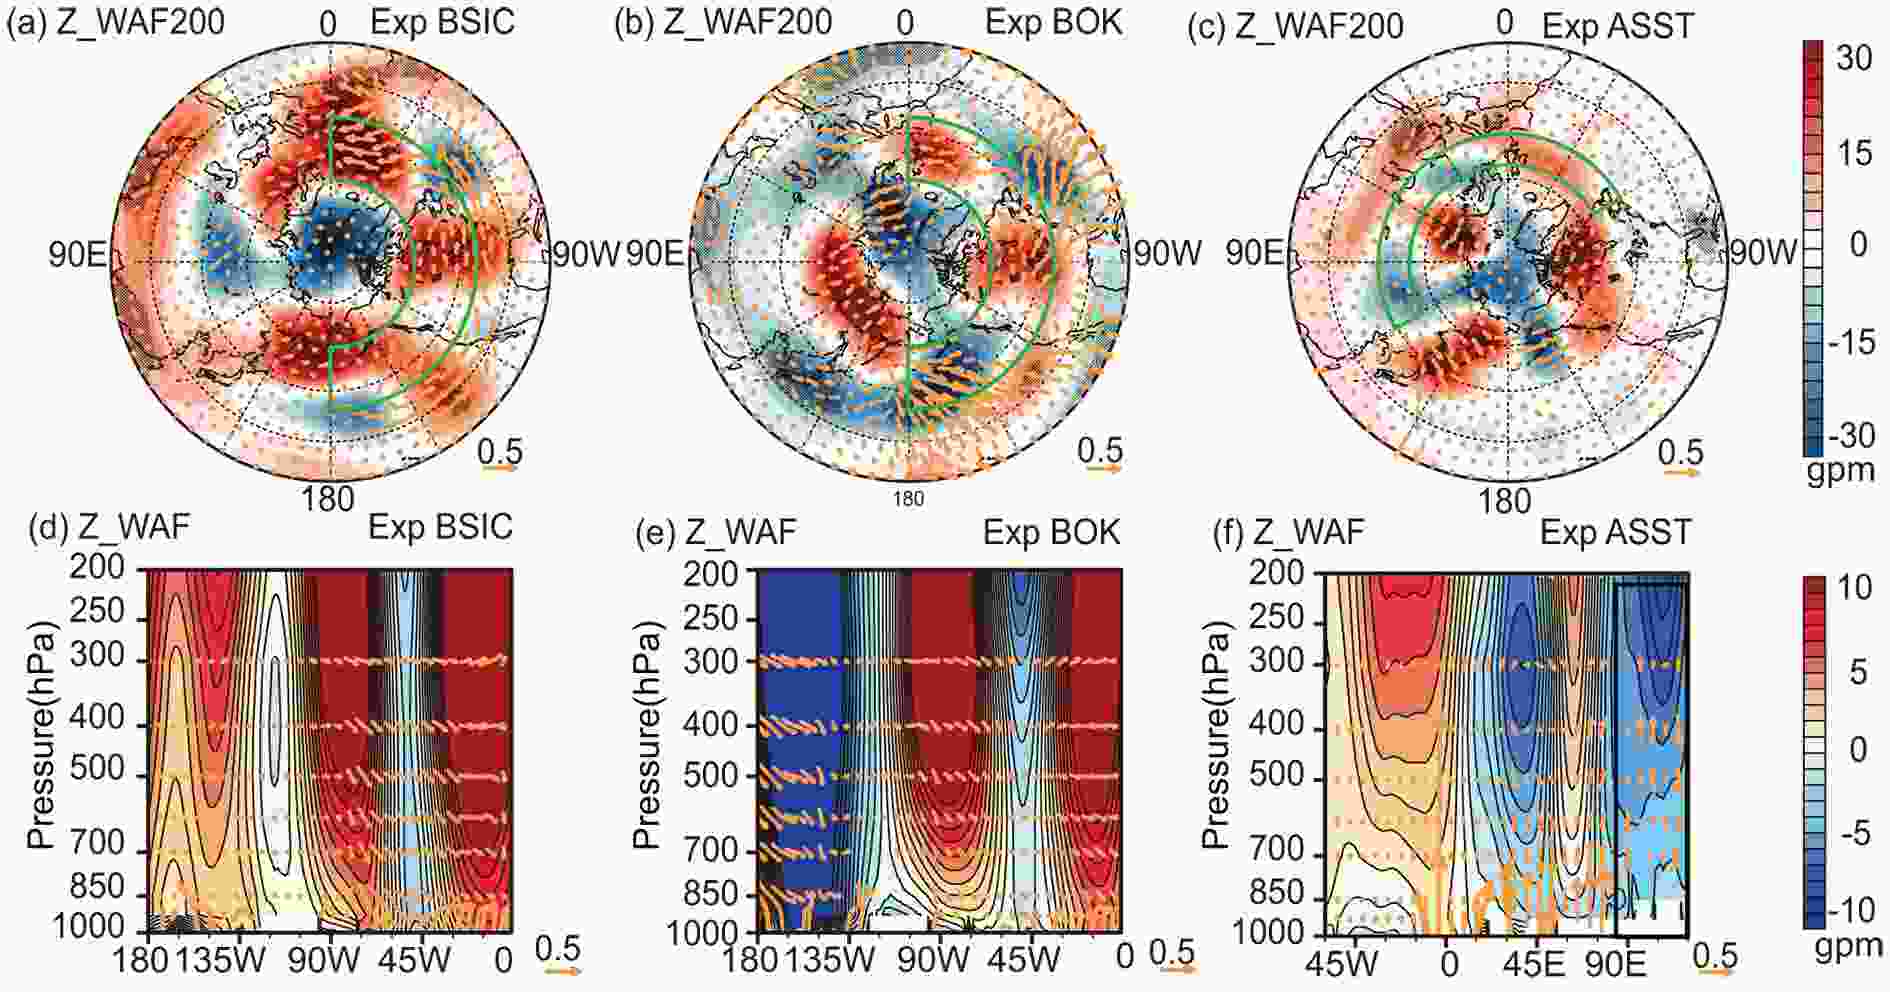 Figure7. Simulated anomalies in geopotential height (shading, gpm) and WAF (vectors, m2 s–2). (a) Anomalies in geopotential height at 200 hPa in MAMJ for Exp. BSIC, relative to CTRL. (b) same as (a), but for Exp. BOK, (c) anomalies in geopotential height at 200 hPa in JJA for Exp. ASST, relative to CTRL. (d) Anomalies in vertical-horizontal cross section averaged along 40°–60°N in MAMJ for Exp. BSIC, relative to CTRL. (e) same as (d), but for Exp. BOK, (f) anomalies in vertical-horizontal cross section averaged along 45°–55°N in JJA for Exp. ASST, relative to CTRL.
From the above analysis, we find that the atmospheric circulation anomalies pattern over the North Atlantic in ERAI is mainly caused by changes in MAMJ BSIC rather than sea ice changes in the Sea of Okhotsk. The high MAMJ BSIC anomaly causes the positive SLP anomaly centre over 60° N in the North Atlantic during MAMJ. The high SLP anomaly in the North Atlantic corresponding with the anti-cyclonic circulation favors the formation of the SST dipole-pattern in the central North Atlantic in JJA. Considering the MAMJ sea ice changes in both the Sea of Okhotsk and the Bering Sea can improve the simulation skill of the stationary wave pathway.
2
4.3. The anomalies of atmospheric circulation triggered by the summer SST dipole pattern in the central North Atlantic
The WAF at 200 hPa shows a zonally orientated wave train originating from the Atlantic Ocean and propagating to the west (Fig. 7c), which looks similar to the wave train shown in ERAI (Figs. 5e and f). On the meridional profile averaged along 45°–55°N, the WAF moves upwards from the lower layer over the eastern coast of the North Atlantic and is transmitted down to the Baikal?NEC, where a deep low-pressure anomaly system is formed (Fig. 7f). When the dipole SST pattern is forced in the Exp. ASST, the experiment basically reproduces the large-scale atmospheric circulation anomalies at mid-latitudes over the Eurasian continent in summer (Fig. 8). The simulated T2m field (Fig. 8a) shows a negative anomaly at Lake Baikal and a significant positive anomaly over the Sea of Japan. At 500 hPa, a robust negative geopotential height anomaly occurs over Baikal?NEC and a positive anomaly centre appears near the Sea of Japan (Fig. 8b), which is consistent with the result in ERAI (Figs. 4c and d). The Exp. ASST also closely reproduced the JJA water vapor transport originating from the tropical Pacific and the Sea of Japan and converging in Baikal?NEC (Fig. 8c compared to Fig. 2d).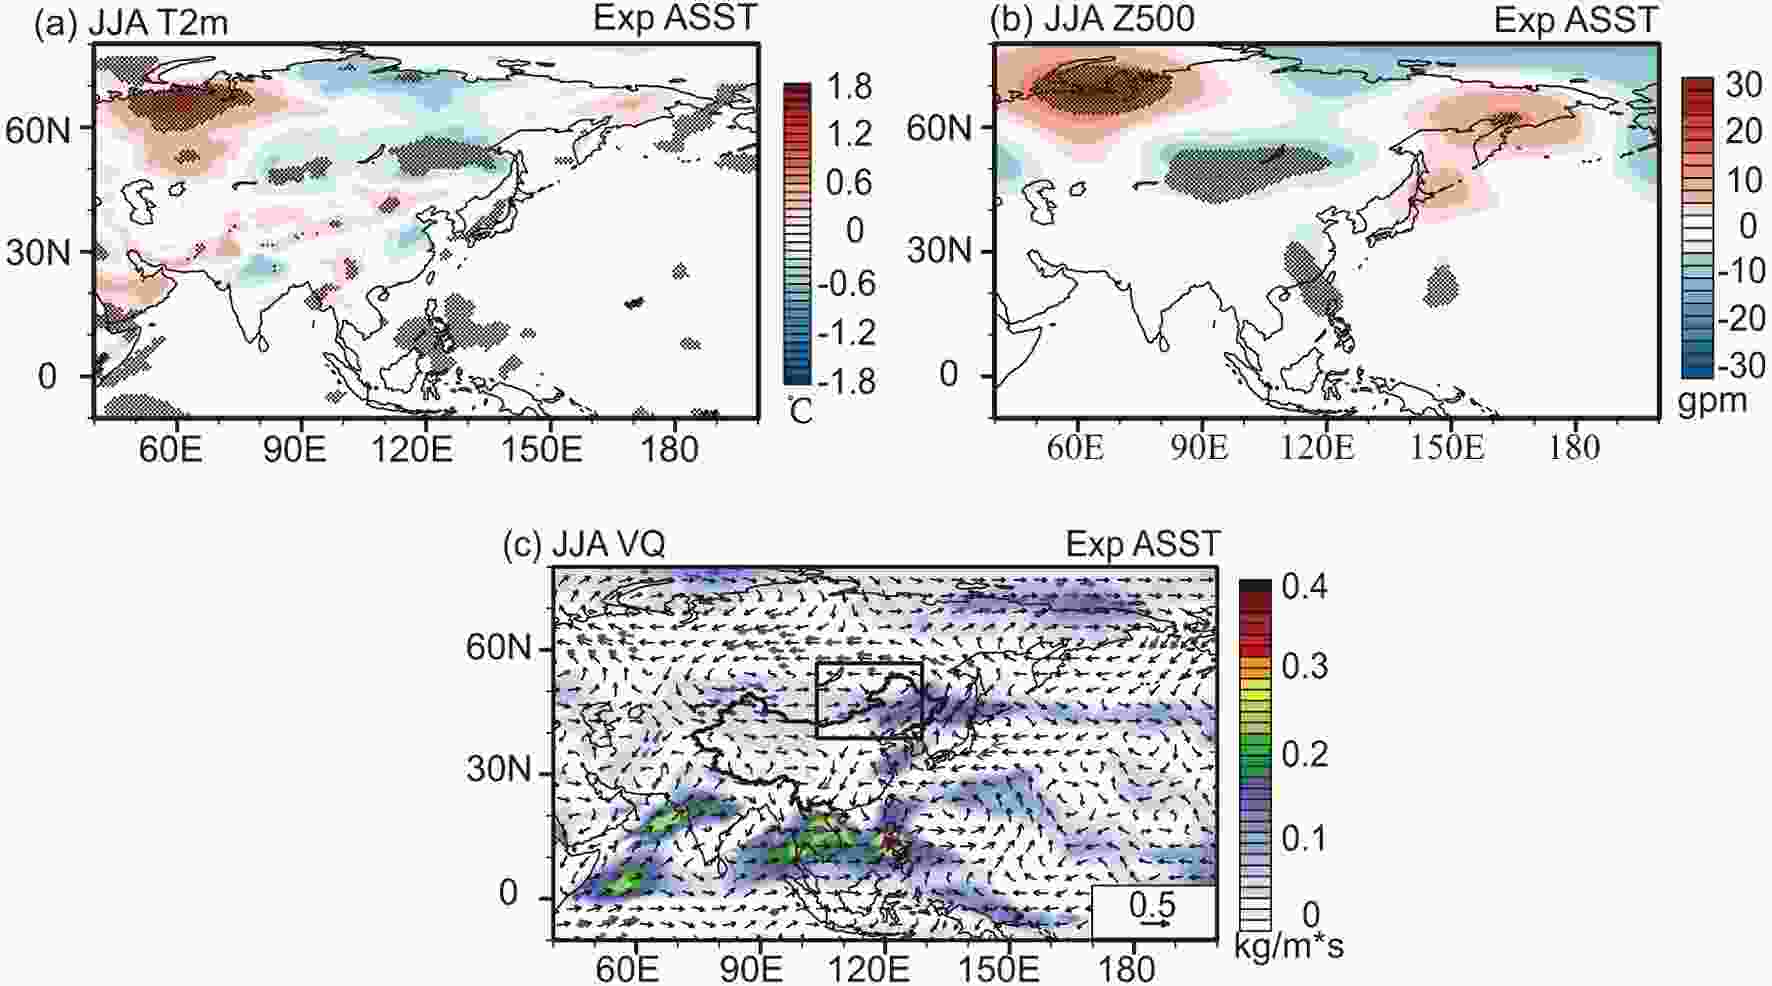 Figure8. Simulated atmospheric circulation changes in JJA for Exp. ASST, relative to CTRL. (a) Changes in JJA T2m (°C). (b) Changes in JJA geopotential height (gpm) at 500 hPa. (c) Changes in JJA VQ (kg m?1 s?1). Purple vectors denote changes with significance higher than 95% confidence level based on Student’s t-test.
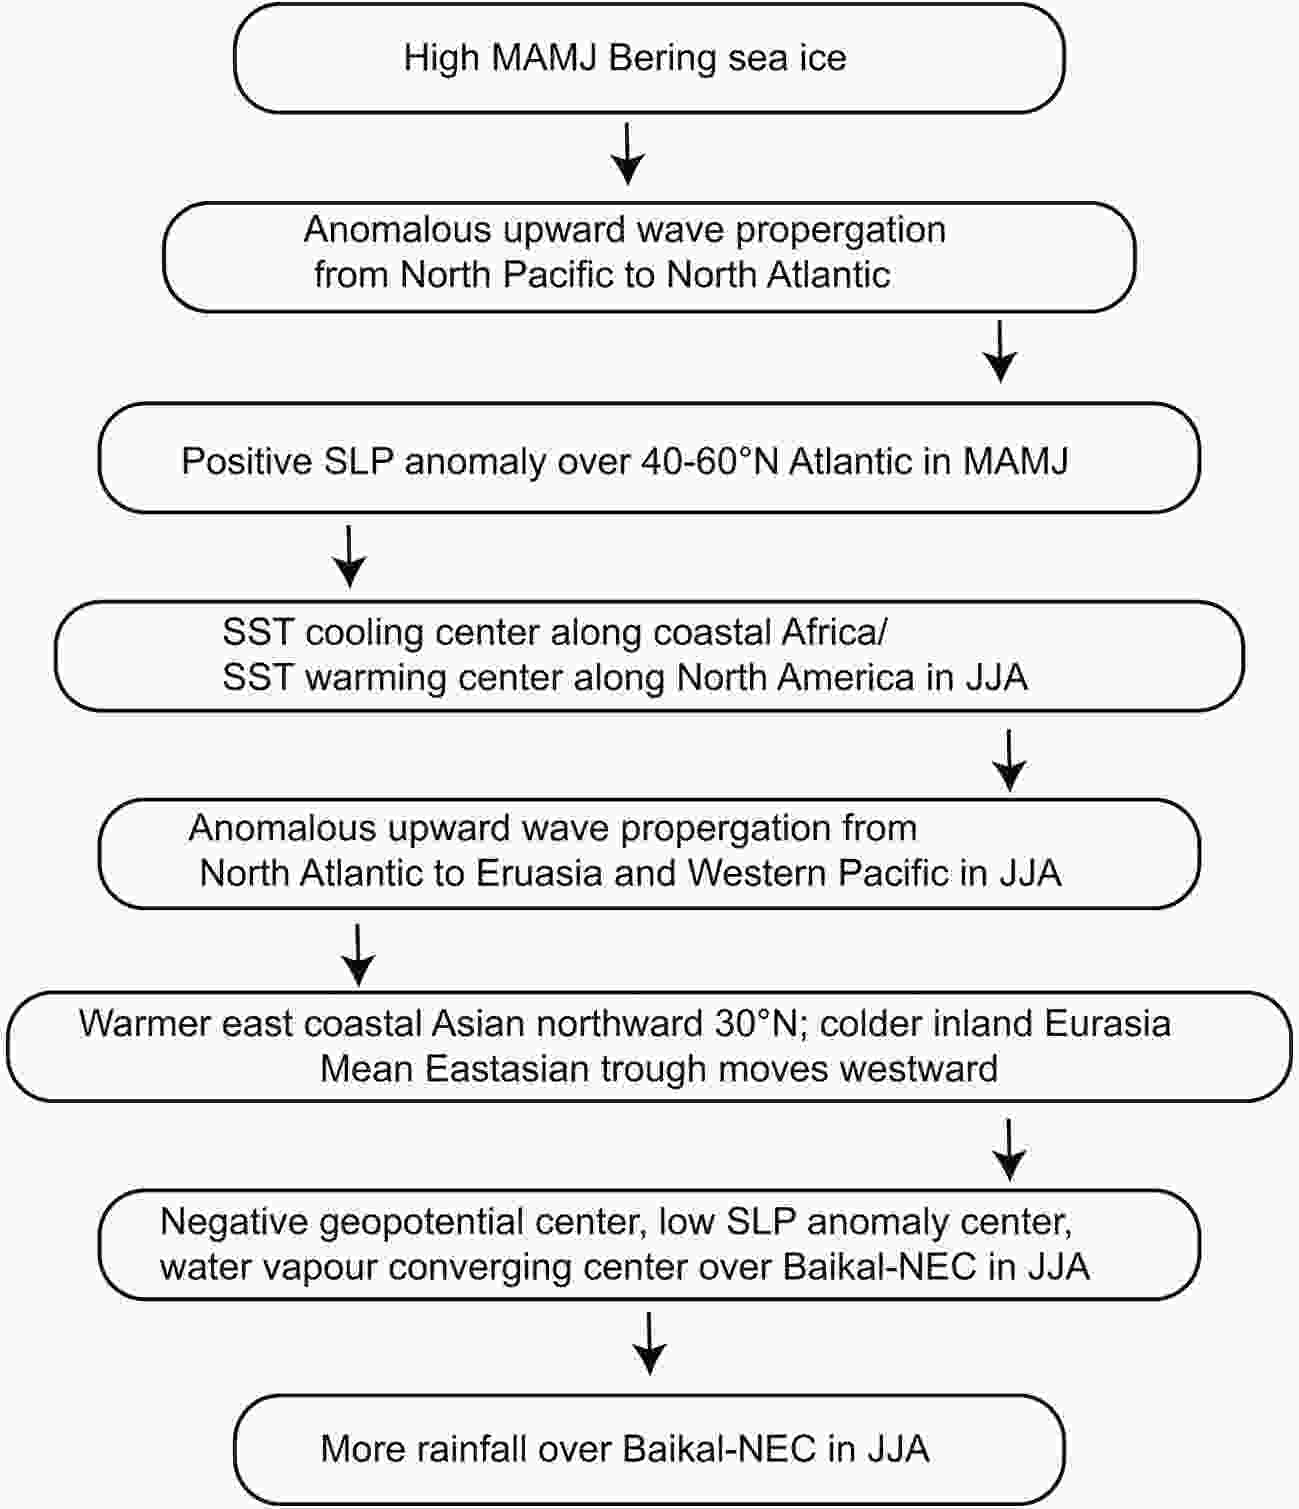 Figure9. Schematic of the possible mechanism behind the linkage between MAMJ BSIC and JJA Baikal?NEC rainfall.
The sensitivity experiments confirm the mechanism described above. In Exp. BSIC, the atmospheric circulation anomaly over the North Atlantic shows a similar pattern to the results in ERAI. The results in Exp. BOK indicate that considering the sea ice changes in both the Sea of Okhotsk and the Bering Sea can improve the simulation skill of the stationary wave pathway from the North Pacific. The Exp. ASST basically reproduced the large-scale summer circulation anomalies at mid-latitudes over the Eurasian continent in ERAI (Figs. 7c, 7f, 8a, and 8b). The source and route for water vapor transport are also well presented in Exp. ASST (Fig. 8c).
Overall, the present study suggests that the variation of melt season BSIC can influence the atmospheric circulation over the North Atlantic and further impact summer Baikal?NEC rainfall via the persisting dipole SST pattern in the North Atlantic. Although an early study (Zorita et al., 1992) suggested that the high SLP anomaly over the North Atlantic may cause the SST dipole pattern, in this study, we cannot provide robust causality evidence that the high SLP anomaly over the North Atlantic induces the summer SST dipole pattern due to the limitation of using an atmosphere-only circulation model. In addition, we noticed that in the simulations, the atmospheric responses to sea ice are weaker compared with the relations in reanalysis. In the reanalysis, many factors introduce signals, including internal and external forcing (Chen et al., 2016). This suggests that atmospheric circulation anomalies shown in reanalysis by composite analysis and regression are not necessarily the features only caused by the MAMJ BSIC changes. Early studies have suggested that multi-decadal variations in both the Pacific (Svendsen et al., 2018) and the Atlantic (Li et al., 2018b) can modulate the Arctic sea ice impact. We noticed that the correlation coefficient between the sea ice and precipitation time series displayed in Figs. 1b and 2c is significantly different for the periods before and after 2000. This result implies that the relationship between MAMJ BSIC and summer rainfall over Baikal?NEC might be modulated by decadal climate systems. Further research is necessary to investigate this possible relationship.
Acknowledgements. We are thankful to Devanil CHOUDHURY (Centre for Monsoon System Research, Institute of Atmospheric Physics) for sharing his thoughts with us. This work is supported by the National Key R&D Program of China (2017YFE0111800 and 2017YFA0603802) and the National Natural Science Foundation of China (Grant No. 41790472). The second author is also partly supported by the EU H2020 Blue-Action project (Grant No. 727852).
