HTML
--> --> -->The Tibetan Plateau has very few meteorological observation stations, leading to a limited knowledge of clouds and precipitation over this region. Reanalysis datasets over the Tibetan Plateau have high uncertainties (Feng and Zhou, 2012; Zhu et al., 2012; Su et al., 2013)—for example, Wang et al. (2017) found that four reanalysis datasets overestimated the precipitable water vapor over the southern Tibetan Plateau in the summer monsoon season. Existing numerical models also have serious flaws over the Tibetan Plateau as a result of their coarse resolution (Zhuo et al., 2016; Lin et al., 2018)—for example, at a resolution of 0.09°, the relative deviation of precipitation reaches 385%. Even at the highest resolution (0.03°) and with the introduction of the turbulent orographic form drag scheme, the relative deviation of precipitation still reaches 87% (Wang et al., 2020). The Third Tibetan Plateau Atmospheric Scientific Experiment has made significant progress since 2013 (Zhao et al., 2018), with comprehensive measurements from ground-based radar, LiDAR, microwave radiometer and raindrop disdrometer systems (Liu et al., 2015; Chang and Guo, 2016; Wang and Guo, 2019). Unfortunately, ground-based observations are not suitable for the entire Tibetan Plateau as a result of the complex terrain, although satellite measurements are an effective approach to monitoring precipitation over this vast region.
The macro and micro characteristics of clouds and precipitation over the Tibetan Plateau have been preliminarily analyzed using remote sensing data from satellites. The terrain has a compression effect on cloud thickness (Yan et al., 2016; Wang and Guo, 2019; Yan and Liu, 2019) and usually produces a more packed echo top in the precipitation system (Luo et al., 2011). Precipitation over the Tibetan Plateau mostly shows isolated convection with a tower mast shape as a result of strong heating in the afternoon (Fu et al., 2006). Convective clouds over the Tibetan Plateau have lower cloud droplet concentrations than the clouds on the surrounding plains, but larger particles, mainly in the ice phase (Yue et al., 2019), although precipitation is mostly contributed by mixed-phase processes (Xu, 2013).
From a macro perspective, precipitation has the characteristics of “precipitation areas” (or precipitation objects)—that is, a system composed of spatially continuous pixels (Nesbitt et al., 2006; Liu et al., 2008; Xu and Zipser, 2011; Liu and Zipser, 2013). Precipitation areas sometimes appear as organized forms, such as the spiral belts of tropical cyclones, but more often show chaotic forms that are difficult to describe. The exploration of the characteristics and mechanisms of cloud and precipitation from the point of view of precipitation areas is a fairly new technique. In previous studies of cloud and precipitation over the Tibetan Plateau, researchers have paid more attention to the size, depth and intensity of precipitation areas (Xu, 2013; Qie et al., 2014; Bhat and Kumar, 2015; Chen et al., 2017; Zhang et al., 2018). For example, Qie et al. (2014) found that deep convective precipitation areas over the Tibetan Plateau are smaller in size, but more frequent, than in the surrounding regions. Zhang et al. (2018) used 10-m winds to classify precipitation areas over the southern slopes of the Himalaya and found that precipitation areas with a downslope airflow have low near-surface droplet concentrations, small near-surface effective droplet radii, weak near-surface rain rates and low echo-top heights.
However, our knowledge of the precipitation-area morphology over the Tibetan Plateau is still very limited, which may refer to the organized structure and physical characteristics of the precipitation area. Case studies using ground-based radar in other regions have shown that the transportation of momentum, the convective precipitation fraction and the life stages of precipitation are different in precipitation areas with different shapes (LeMone et al., 1984; Houze et al., 1990; Loehrer and Johnson, 1995). Nesbitt et al. (2006) introduced the concept of precipitation morphology into observations from the precipitation radar onboard the Tropical Rainfall Measuring Mission (TRMM PR) satellite, including precipitation size and vertical extension. Using the ellipse-fitting method, Liu and Zipser (2013) later found that near-circular convective cells mostly appear over land, whereas linear convective cells are more common over the oceans.
Based on long-term observations from the TRMM PR, we used the recently developed fitting algorithm of the minimum bounding rectangle (MBR) (Fu et al., 2020a) to show the morphological characteristics of precipitation areas over the Tibetan Plateau and to quantitatively explore the relationship between these morphological characteristics and the intensity of precipitation.
The detection uncertainty of the PR reflectivity is mainly due to factors such as the observation method, wavelength, resolution, and its own systematic error. Feng et al. (2001) found that the position, shape and structure of the echoes observed by the TRMM PR are similar to X-band Doppler radar observations at Nagqu station with low-level systematic error of about 2–3 dBZ. Wang and Guo (2019) compared the reflectivity of the C-band Doppler radar at Nagqu station with TRMM PR and found that they are consistent at heights of 11–13 km, whereas the near-surface reflectivity of the TRMM PR is 7 dBZ greater. The rain rate of the 2A25 data is directly retrieved from the PR reflectivity according to the Z–R relationship. Bookhagen and Burbank (2006) calibrated TRMM rainfall data utilizing the half-hour rainfall measurements of the central Nepal gauge network for the years 2001–04, and found that the two agree well (R2 = 0.86). By comparing more than 10 years of TRMM PR observations with a dense network of rain gauges over the Tibetan Plateau, Yatagai and Kawamoto (2008) suggested that although TRMM PR underestimates precipitation by 28% to 38% in summer, the relationship between the two is significant. Theoretically, no instrument can provide absolutely accurate rain rate. At present, the credibility of the rain rate retrieved by TRMM 2A25 is acceptable.
Taking into consideration the complex topography of the Tibetan Plateau, we focus on the precipitation areas over the region (24°–36°N, 70°–105°E) with an altitude of at least 3000 m. Specifically, 70°–85°E is defined as the western Tibetan Plateau, 85°–95°E as the central Tibetan Plateau, and 95°–105°E as the eastern Tibetan Plateau.
As described by Fu et al. (2020a), contiguous precipitation pixels are grouped as a precipitation area and the MBR is used to capture each area. To minimize noise, precipitation areas that contain fewer than four pixels or are located at the edges of the PR swaths are ignored. Some primary parameters are defined, including the length of the MBR (L), the width of the MBR (W), the ratio of W to L (α), the average echo-top height above sea level (Hav), the ratio of Hav to (L + W) / 2 (γ), and the average near-surface rain rate of the precipitation area (RRav). The location of the precipitation area is defined as the mean position of all the pixels in a particular precipitation area. From the morphological perspective, L indicates the scale, α indicates the horizontal shape and γ indicates the 3D morphology of the precipitation area, which means that they can be considered as the 1D, 2D and 3D morphological characteristics of each precipitation area, respectively. When L is large, γ would be dominated by L, and then a low γ value does not necessarily correspond to a low echo top. The detailed relationship between γ and L (Hav) is explained in the supplementary material [Fig. A1 in Appendix].
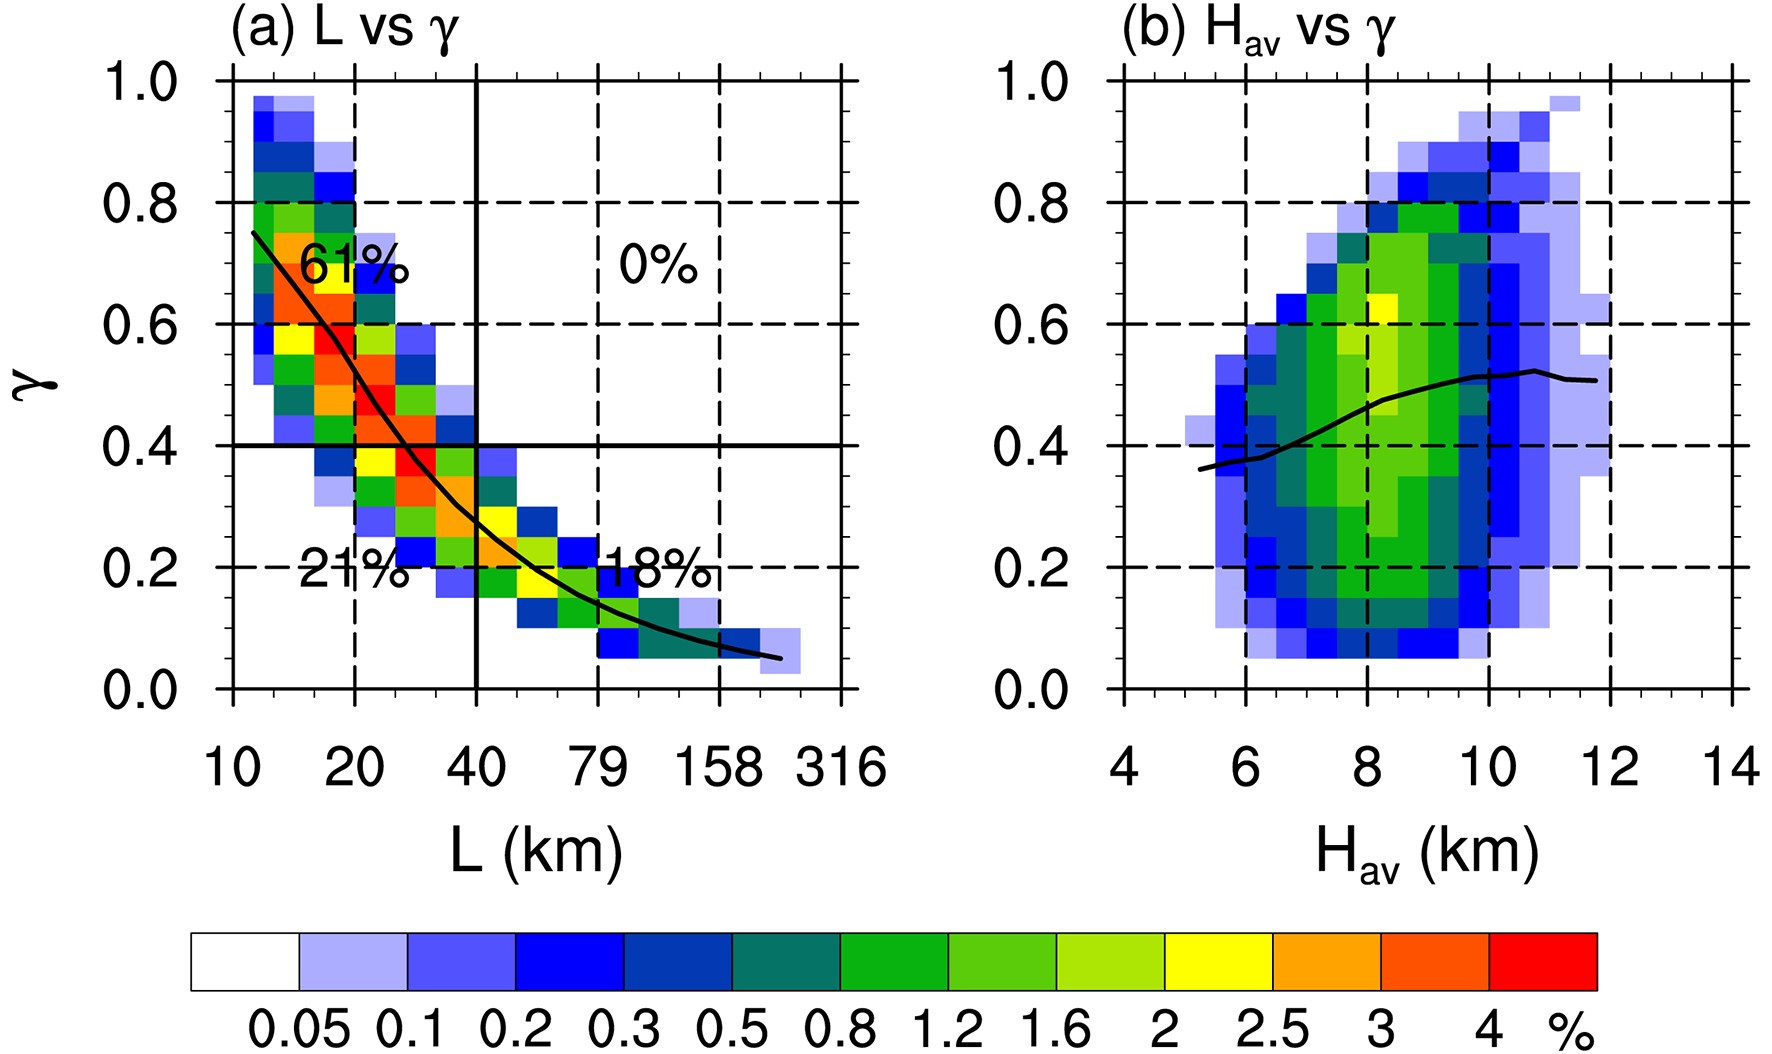 FigureA1. Frequency distribution of (a) L–γ and (b) Hav–γ over the Tibetan Plateau. The labels 61%, 0%, 21% and 18% in (a) indicate the percentages of intervals divided by the solid lines. The black solid lines represent the median value of γ in particular L and Hav intervals.
The contoured frequency by altitude diagram (CFAD; Yuter and Houze, 1995) of reflectivity is used to show the vertical structure of the precipitation areas. The average reflectivity profile is first calculated in terms of each precipitation area and the profiles of all the precipitation areas are interpolated to 0.25 km (vertical resolution) and 1 dBZ (horizontal resolution) intervals. The values are normalized using the overall maximum so that the value of each bin is distributed between 0 and 1. Compared with the normalization-by-level method used by McMurdie et al. (2018), normalizing by the overall maximum enables a comparison of values at different heights (Zagrodnik et al., 2019).
Before analyzing the characteristics of precipitation areas, it is necessary to understand the sample distribution of all the precipitation areas (Fig. 1a) and the altitude of the topography (Fig. 1b). The locations of the precipitation areas are interpolated into 0.5° × 0.5° grids. Because the observational frequency of the TRMM PR is greater at midlatitudes than at low latitudes, the number of precipitation areas peaks at 33°–35°N with a value >240. This number reaches a maximum on the southern slopes of the Tibetan Plateau as a result of strong upward motion and the blocked moisture content (Fu et al., 2018). A total of 140 968 precipitation areas are identified over the Tibetan Plateau (34 534 over the western Tibetan Plateau, 61 383 over the central Tibetan Plateau, and 45 051 over the eastern Tibetan Plateau), leading to reliable statistical data.
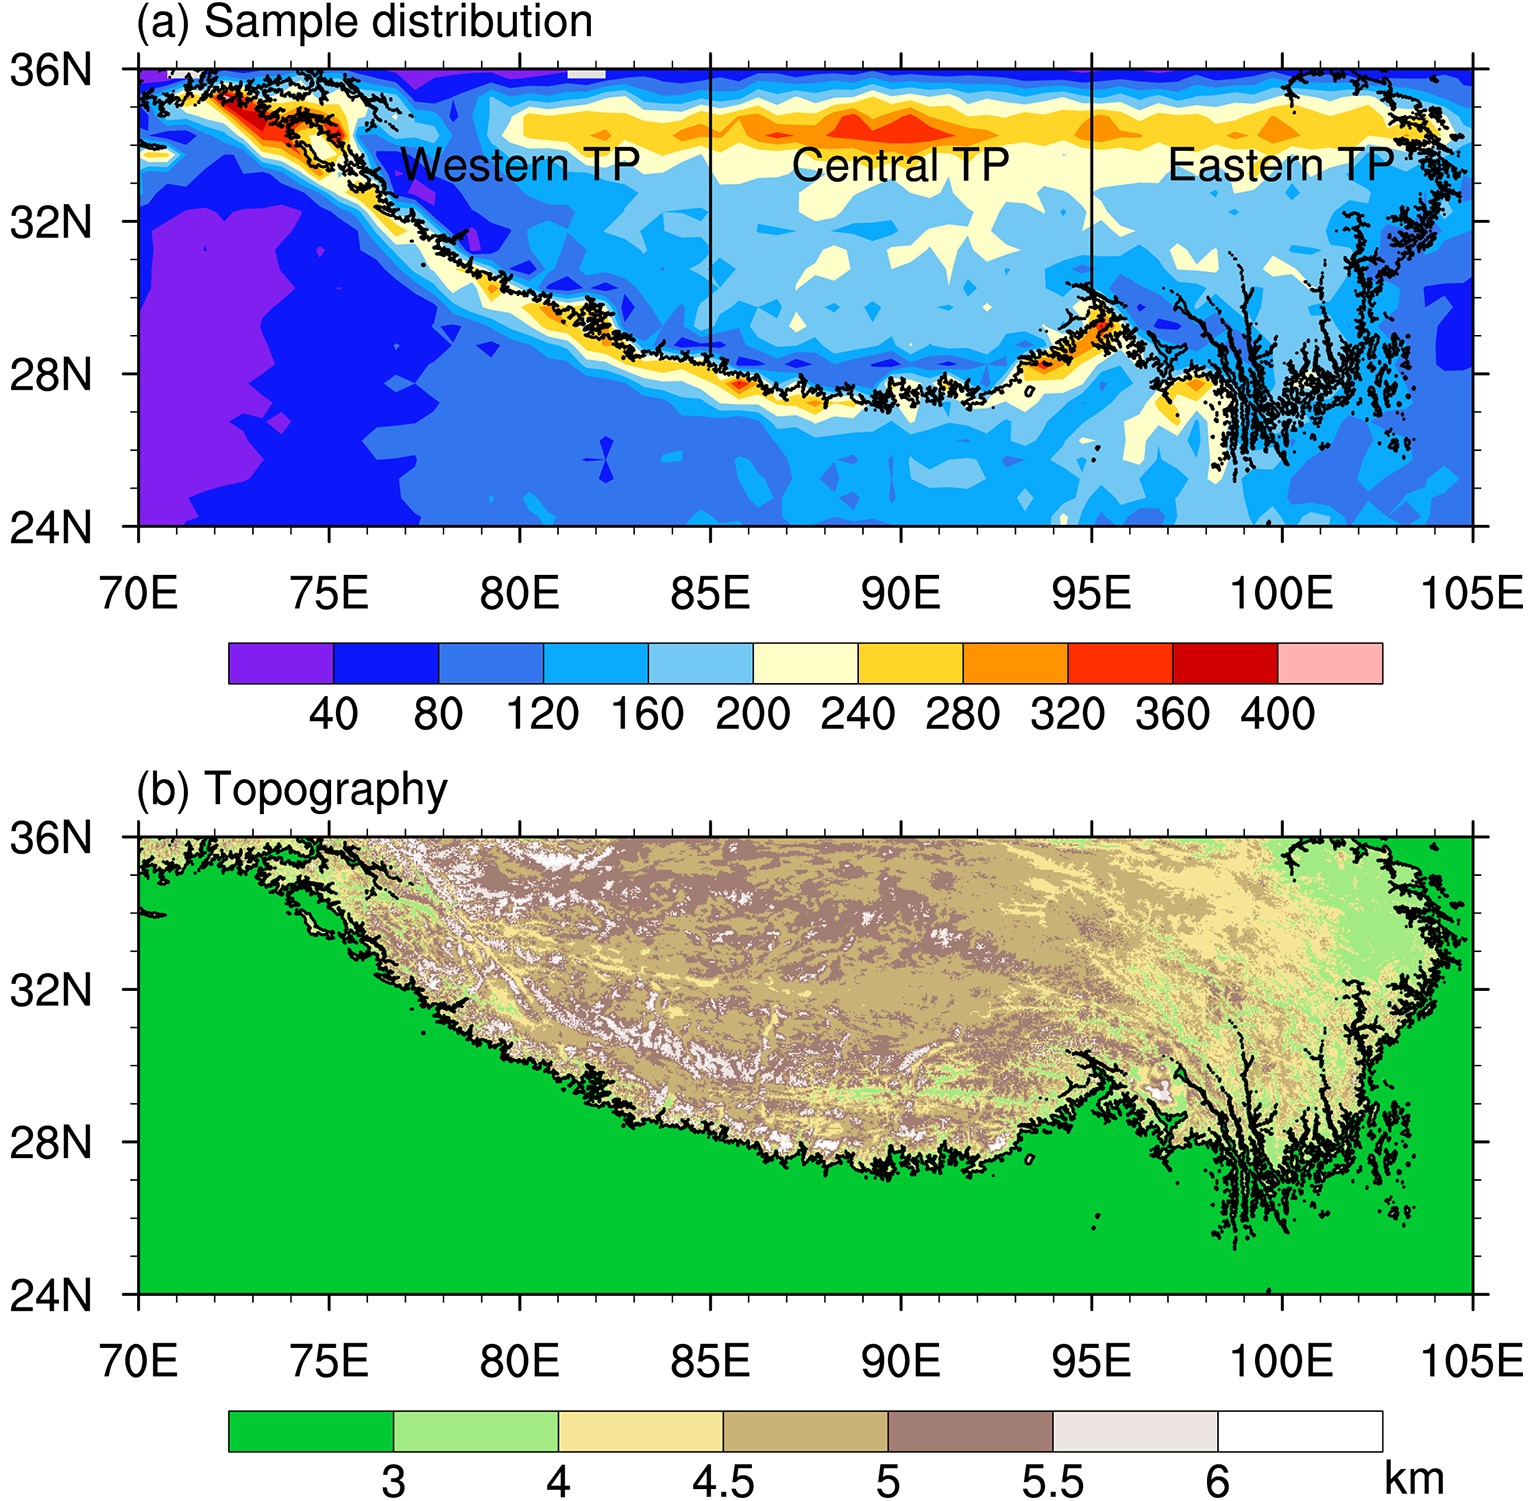 Figure1. (a) Sample distribution of precipitation areas in the summer months from 1998 to 2012. (b) Topography of the studying area. The Tibetan Plateau is abbreviated as TP in the figure.
The TRMM 2A25 dataset provides the freezing height for each pixel (variable name is freezH). Our statistics show that the freezing height over the Tibetan Plateau in summer is 5.6 ± 0.4 km
3.1. Case analysis
Figure 2 shows a case study of TRMM PR observations over the Tibetan Plateau on 16 June 1998 (Orbit 03166). The black rectangles show the MBRs of the precipitation areas and indicate that, subjectively, although the size and shape of these six precipitation areas are different, the MBR can describe the morphology of the precipitation areas and completely frame them. In addition to these six precipitation areas, there are a large number of precipitation pixels at (32.5°N, 99.5°E) and (32.5°N, 97.5°E). These pixels are not identified as precipitation areas and are not considered in the statistics because they are truncated by the PR swath or consist of fewer than four continuous pixels. Figure2. Example of precipitation areas and their corresponding MBR values on 16 June 1998. The dashed line indicates the PR swath.
Table 1 lists the morphological characteristics and precipitation of the six precipitation areas shown in Fig. 2. Area A is the largest precipitation area with a scale of 191.2 km, whereas area D has the smallest scale of 22.9 km. The shape of area F is slender with an α value of 0.327, whereas areas A and C are more square-like with α > 0.6, which is consistent with the subjective cognition in Fig. 2. Because the 3D morphology γ includes the average echo-top height, area A shows characteristics we describe as plump-and-short, whereas area E appears thinner and taller. Although areas D and E show similar scales (22.9 and 24.5 km, respectively), the difference in γ exceeds 0.15, showing a completely different spatial morphology. The five rain areas B–F show very similar values of RRav, all of which are < 0.9 mm h?1.
| L (km) | α | γ | RRav (mm h?1) | |
| A | 191.2 | 0.636 | 0.055 | 1.519 |
| B | 30.7 | 0.456 | 0.359 | 0.853 |
| C | 40.0 | 0.622 | 0.300 | 0.767 |
| D | 22.9 | 0.541 | 0.428 | 0.896 |
| E | 24.5 | 0.563 | 0.581 | 0.735 |
| F | 37.8 | 0.327 | 0.318 | 0.865 |
Table1. Morphological characteristics and precipitation of the six precipitation areas shown in Fig. 2.
2
3.2. Statistical analysis
33.2.1. Near-surface rain rate
The relationship between the morphological characteristics of precipitation areas and the near-surface rain rate is shown by 2D histograms, where the black solid line represents the median RRav within a certain morphological interval. Overall, the precipitation areas over the eastern Tibetan Plateau (Fig. 3c) have a wider distribution of RRav than those of the same scale over the western Tibetan Plateau (Fig. 3a), and there are more large-scale precipitation areas over the eastern Tibetan Plateau. The precipitation areas with RRav > 5 mm h?1 (~100.7) are not large in scale, which is consistent with the well-known isolated convection over the Tibetan Plateau. As the scale of the precipitation areas increases from 10 km (101) to 20 km (~101.3), the median RRav shows a downward trend. As the scale continues to increase, the median RRav increases from 1.12 mm h?1 (100.05) to 1.41 mm h?1 (100.15), although it stabilizes when the scale is ≥ 50 km (101.7) over the western and central Tibetan Plateau (Figs. 3a and b). The median RRav of precipitation areas over the eastern Tibetan Plateau (Fig. 3c) continues to increase to a maximum >2 mm h?1 (100.3), 78% greater than the RRav of small-scale precipitation areas. The most common precipitation areas over the whole of the Tibetan Plateau occur at a scale of 20 km (101.3) and an RRav of 1 mm h?1.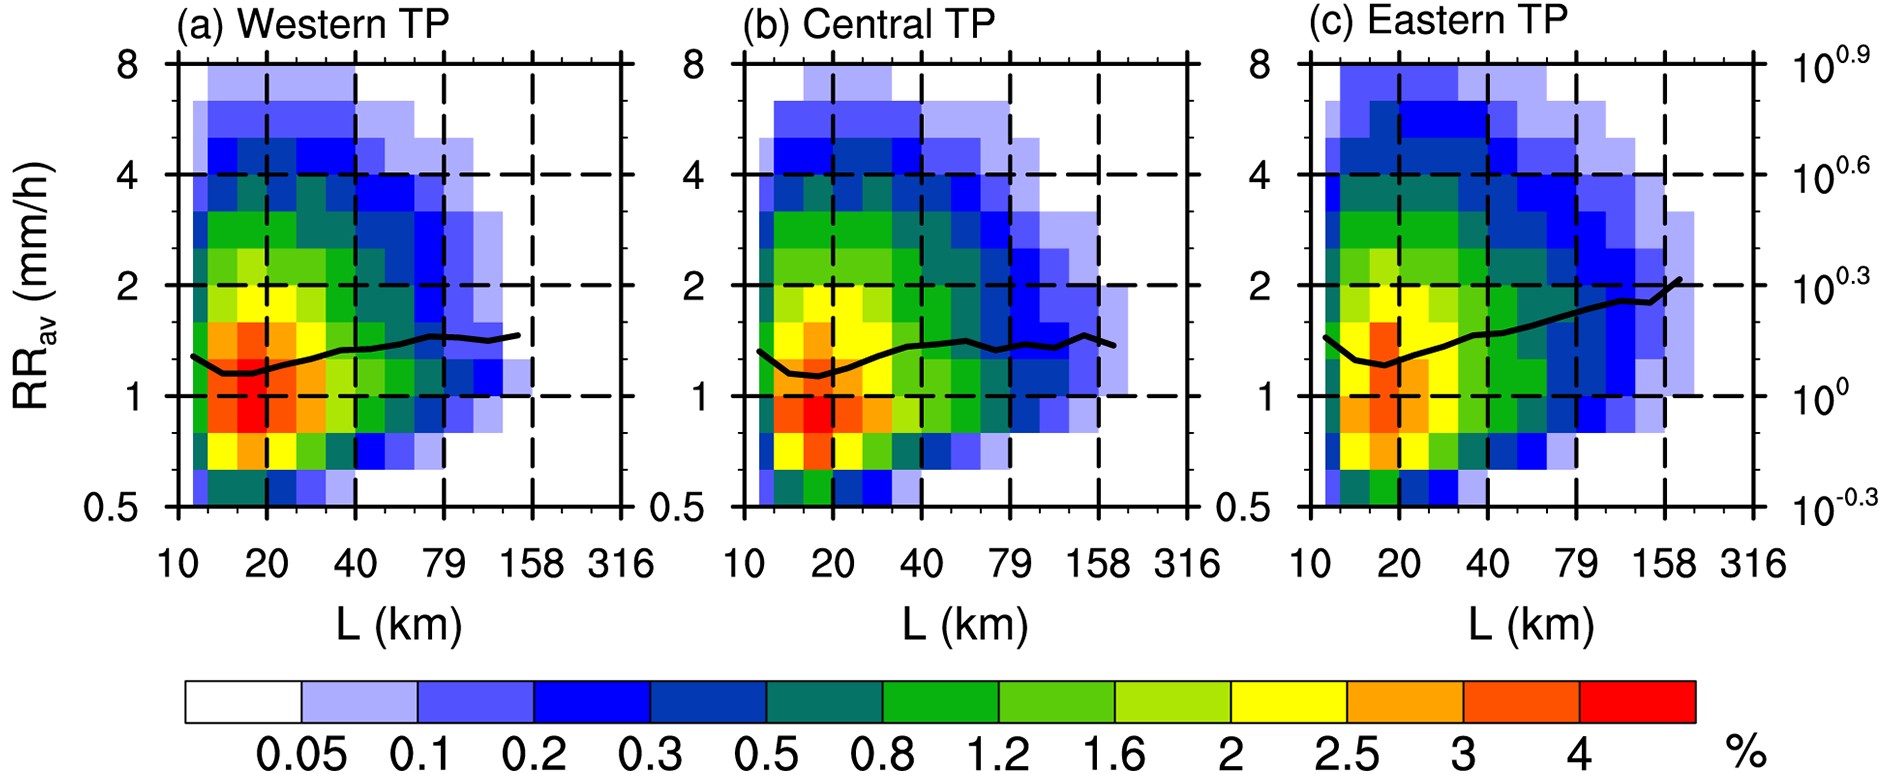 Figure3. 2D frequency histograms of L and RRav. The black solid line represents the median RRav in a particular L interval.
Overall, the difference in α is not large in the three regions and the distribution of α shows two clear peaks at about 0.6 and close to 1 (Fig. 4). The frequency peak at α close to 1 is consistent with previous studies, with more square-shaped precipitation areas over land and more linear precipitation areas over the oceans (Liu and Zipser, 2013). RRav also shows the widest distribution in these two α peak areas, whereas the most slender precipitation areas (α = 0.2) have the narrowest distribution and smallest value of RRav. Interestingly, the median value of RRav tends to increase with α in all three regions (Fig. 4) and the increased slope is the largest over the eastern Tibetan Plateau (Fig. 4c). When α increases from 0.2 to 0.4, the median value of RRav increases from 1 to 1.12 mm h?1 (100.05) over the western Tibetan Plateau and from 1 to 1.26 mm h?1 (100.1) over the eastern Tibetan Plateau. The median value of RRav increases to 1.58 mm h?1 (100.2) over the eastern Tibetan Plateau as α increases to 0.8, whereas it remains stable over the whole Tibetan Plateau with an increase in α from 0.8.
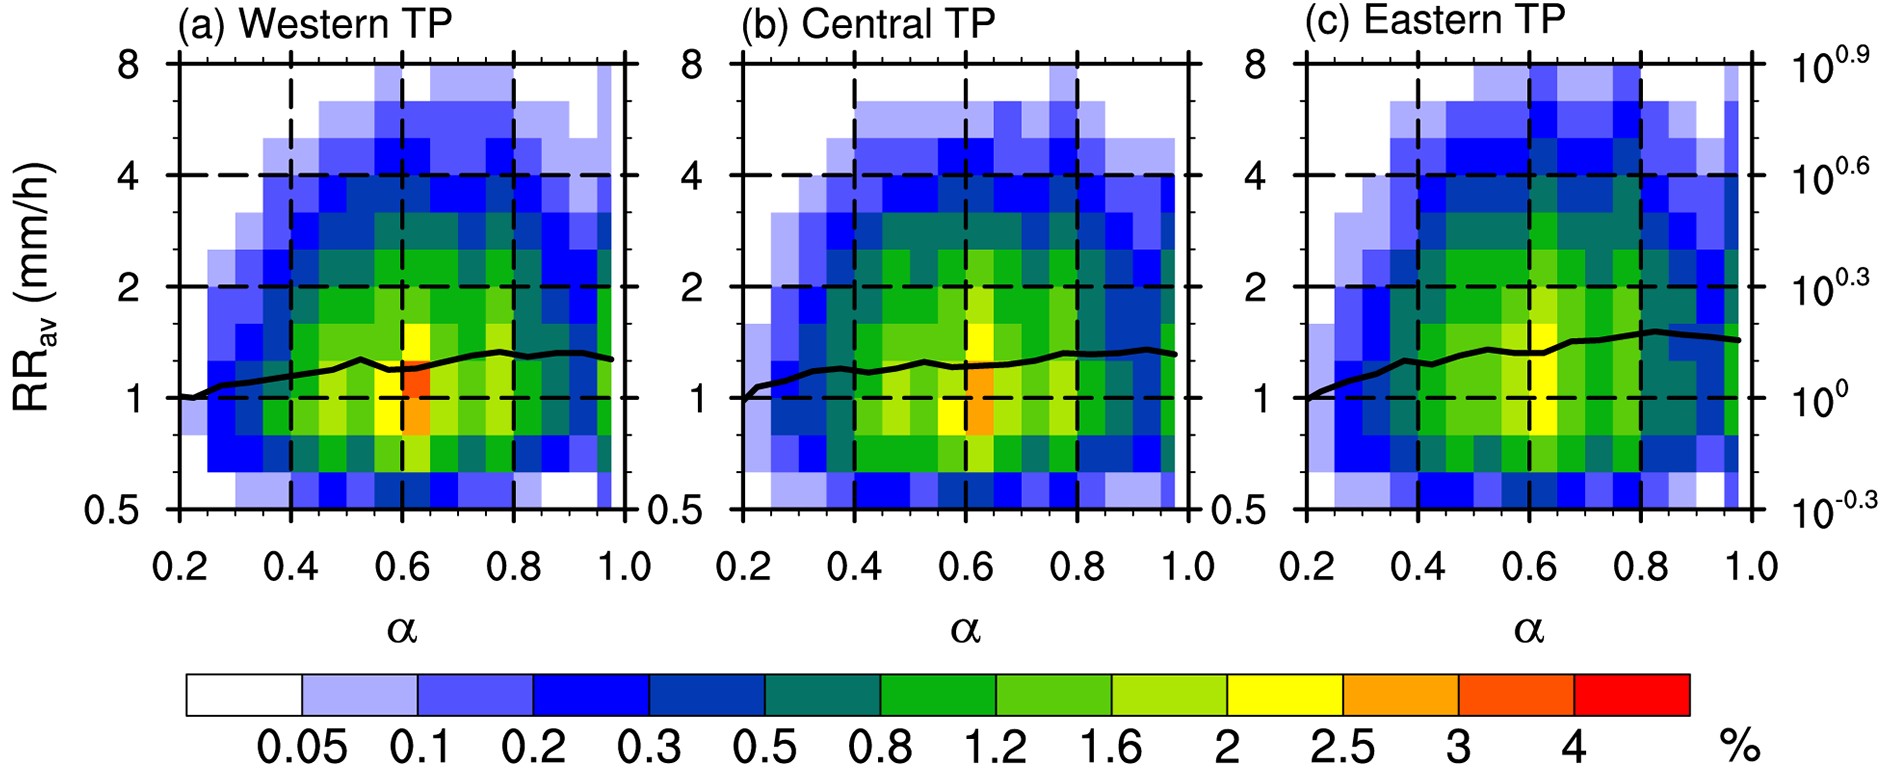 Figure4. 2D frequency histograms of α and RRav. The black solid line represents the median value of RRav in a particular α interval.
The echo-top height indicates the depth of the development of precipitation. A higher echo-top height will extend the growth path of precipitation particles and will usually produce stronger precipitation. A large number of studies have focused on the relationship between the echo top and the near-surface rain rate (Hamada et al., 2015; Fu et al., 2018). Our recent study found that the echo-top height is also closely related to the near-surface distribution of droplet size over the Tibetan Plateau (Chen et al., 2020). We can quantitatively analyze whether the precipitation area is thin-and-tall or plump-and-short by dividing the average echo-top height and the average size to obtain the 3D morphology of the precipitation areas. Figure 5 shows that the 2D histograms of γ and RRav have almost the same characteristics over the western and central Tibetan Plateau. The samples are mainly concentrated in the area where γ is 0.3–0.7 and RRav is 10?0.1 to 100.2 mm h?1 (Figs. 5a and b), whereas the distribution of RRav over the eastern Tibetan Plateau is wider, especially in the area where γ < 0.6 (Fig. 5c). At γ < 0.6, the median value of RRav decreases rapidly with the increase in γ and the rate of decrease is greatest over the eastern Tibetan Plateau. After γ exceeds 0.6, the median value of RRav increases with γ. According to the frequency distributions of L–γ and Hav–γ shown in Fig. A1 (in the Appendix), we speculate that when the precipitation areas are small, the vertical development promotes the increase of rain rate; after the precipitation areas reach a certain scale, the increase in the horizontal scale dominates the increase in rain rate. This key turning point occurs when γ is between 0.6 and 0.7. Specifically, the median value of RRav doubles from 1.12 mm h?1 (100.05) to 2.24 mm h?1 (100.35) over the central Tibetan Plateau as γ increases from 0.7 to 0.95 (Fig. 5b). These results indicate that the near-surface rain rate is more sensitive to a thin-and-tall 3D morphology over the central and western Tibetan Plateau, whereas it is more sensitive to a plump-and-short 3D morphology over the eastern Tibetan Plateau.
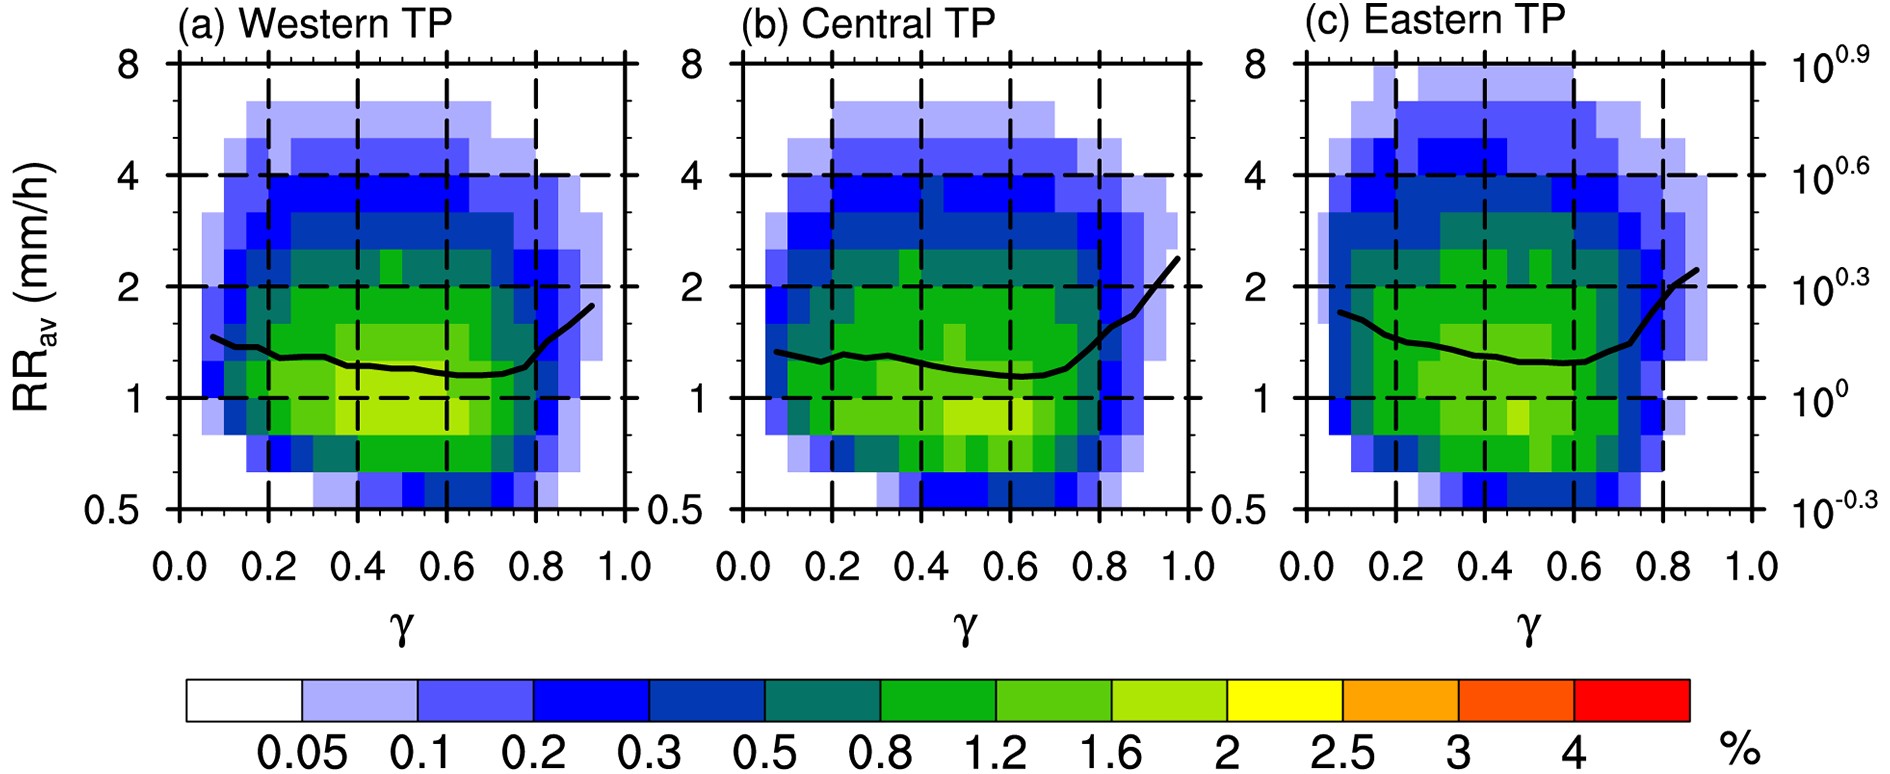 Figure5. 2D frequency histograms of γ and RRav. The black solid line represents the median value of RRav in a certain γ interval.
3
3.2.2. CFAD
By setting a threshold for L, the precipitation areas over the Tibetan Plateau can be divided into three categories: large, medium and small (Fig. 6). The CFADs show a similar vertical pattern over the three regions for precipitation areas in the same scale interval, except for slightly different heights overall. There are clear differences in the vertical structure for precipitation areas of different sizes. Taking the eastern Tibetan Plateau as an example, the outermost contour of the small precipitation areas is always below 12 km (Fig. 6c), whereas that of the large precipitation areas can reach 15 km (Fig. 6i). This indicates that although isolated convection is often triggered over the Tibetan Plateau (Fu et al., 2006), the deepest precipitation is embedded in large precipitation areas. From the perspective of the modal contour (> 0.5), the reflectivity of the large precipitation areas increases from 18 dBZ at 8 km to 21 dBZ at 6 km (Fig. 6i). Such a slow growth rate may correspond to the deposition process—that is, the ice particles grow by directly absorbing the surrounding water vapor. From 6 to 5 km, the modal contour increases rapidly from 21 to 27 dBZ and the outermost contour increases to 32 dBZ (Fig. 6i). Such a strong increase in reflectivity corresponds to aggregation and riming processes just above the freezing level (~5.6 km). Melting near the bright band is also important for the increase of reflectivity, because the partially melted ice particles exhibit the complex index of refraction of the water drops (roughly four times greater than that of ice particles) but maintain their sizes. In contrast with the large precipitation areas, the increase in the outermost contour with decreasing height mainly appears above 8 km for small precipitation areas (Fig. 6c) and the increase in the modal contour with decreasing height appears above 6 km. Figure6. CFAD of the precipitation-area reflectivity with different values of L. The left-hand, center and right-hand panels represent the western, central and eastern Tibetan Plateau (TP), respectively: (a–c) L < 20 km; (d–f) 20 < L <50 km; and (g–i) L > 50 km.
The response of the precipitation area CFAD to different thresholds of α is less clear (Fig. 7). The outermost contour is almost the same regardless of the reflectivity or height. The only difference is in the modal contour: the square-shaped precipitation areas have an overall modal reflectivity 1–2 dBZ greater than that of the linear precipitation areas and there is a slight bulge at 24 dBZ and 7 km height (Fig. 7g–7i), which is most obvious over the eastern Tibetan Plateau (Fig. 7i). This result indicates that the vertical structure of the extreme precipitation areas (outermost contour) is not sensitive to the shape of the precipitation area. The specific mechanism of the shape of the precipitation area to the increase in precipitation requires further study.
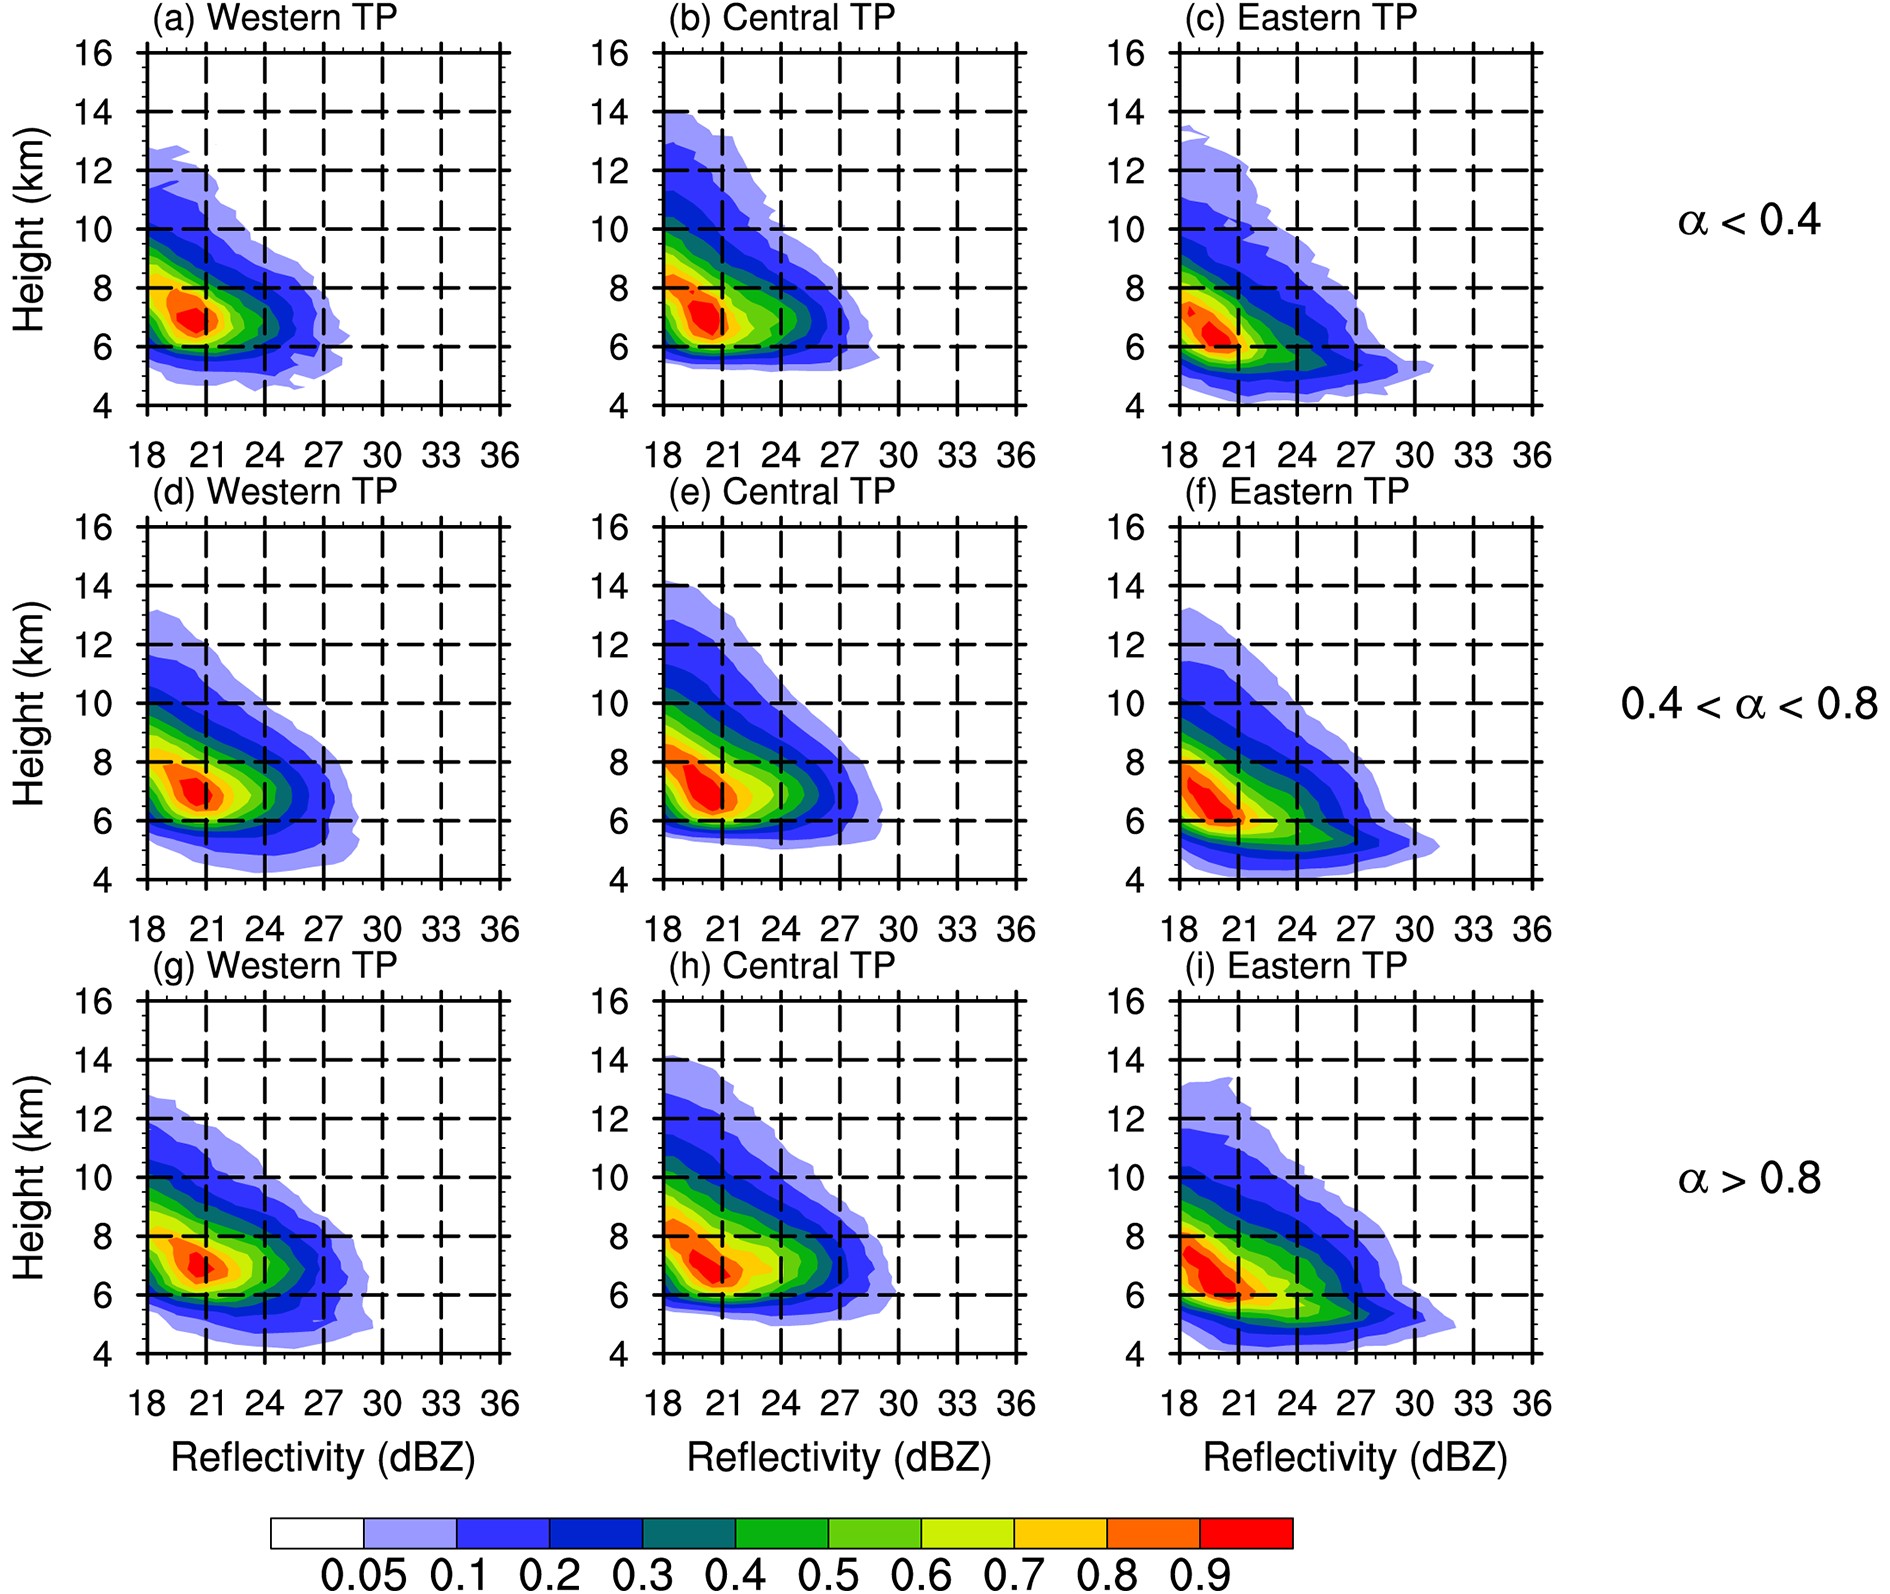 Figure7. CFAD of the precipitation-area reflectivity with different values of α. The left-hand, center and right-hand panels represent the western, central and eastern Tibetan Plateau (TP), respectively: (a–c) α < 0.4; (d–f) 0.4 < α <0.8; and (g–i) α > 0.8.
Figure 8 shows interesting results in that different 3D morphologies correspond to completely different vertical structures of reflectivity. A value of γ < 0.4 is defined as relatively plump-and-short—that is, the horizontal scale of the precipitation area is much greater than the vertical scale. A value of γ > 0.7 is regarded as a thin-and-tall morphology, where the horizontal and vertical scales are almost the same.
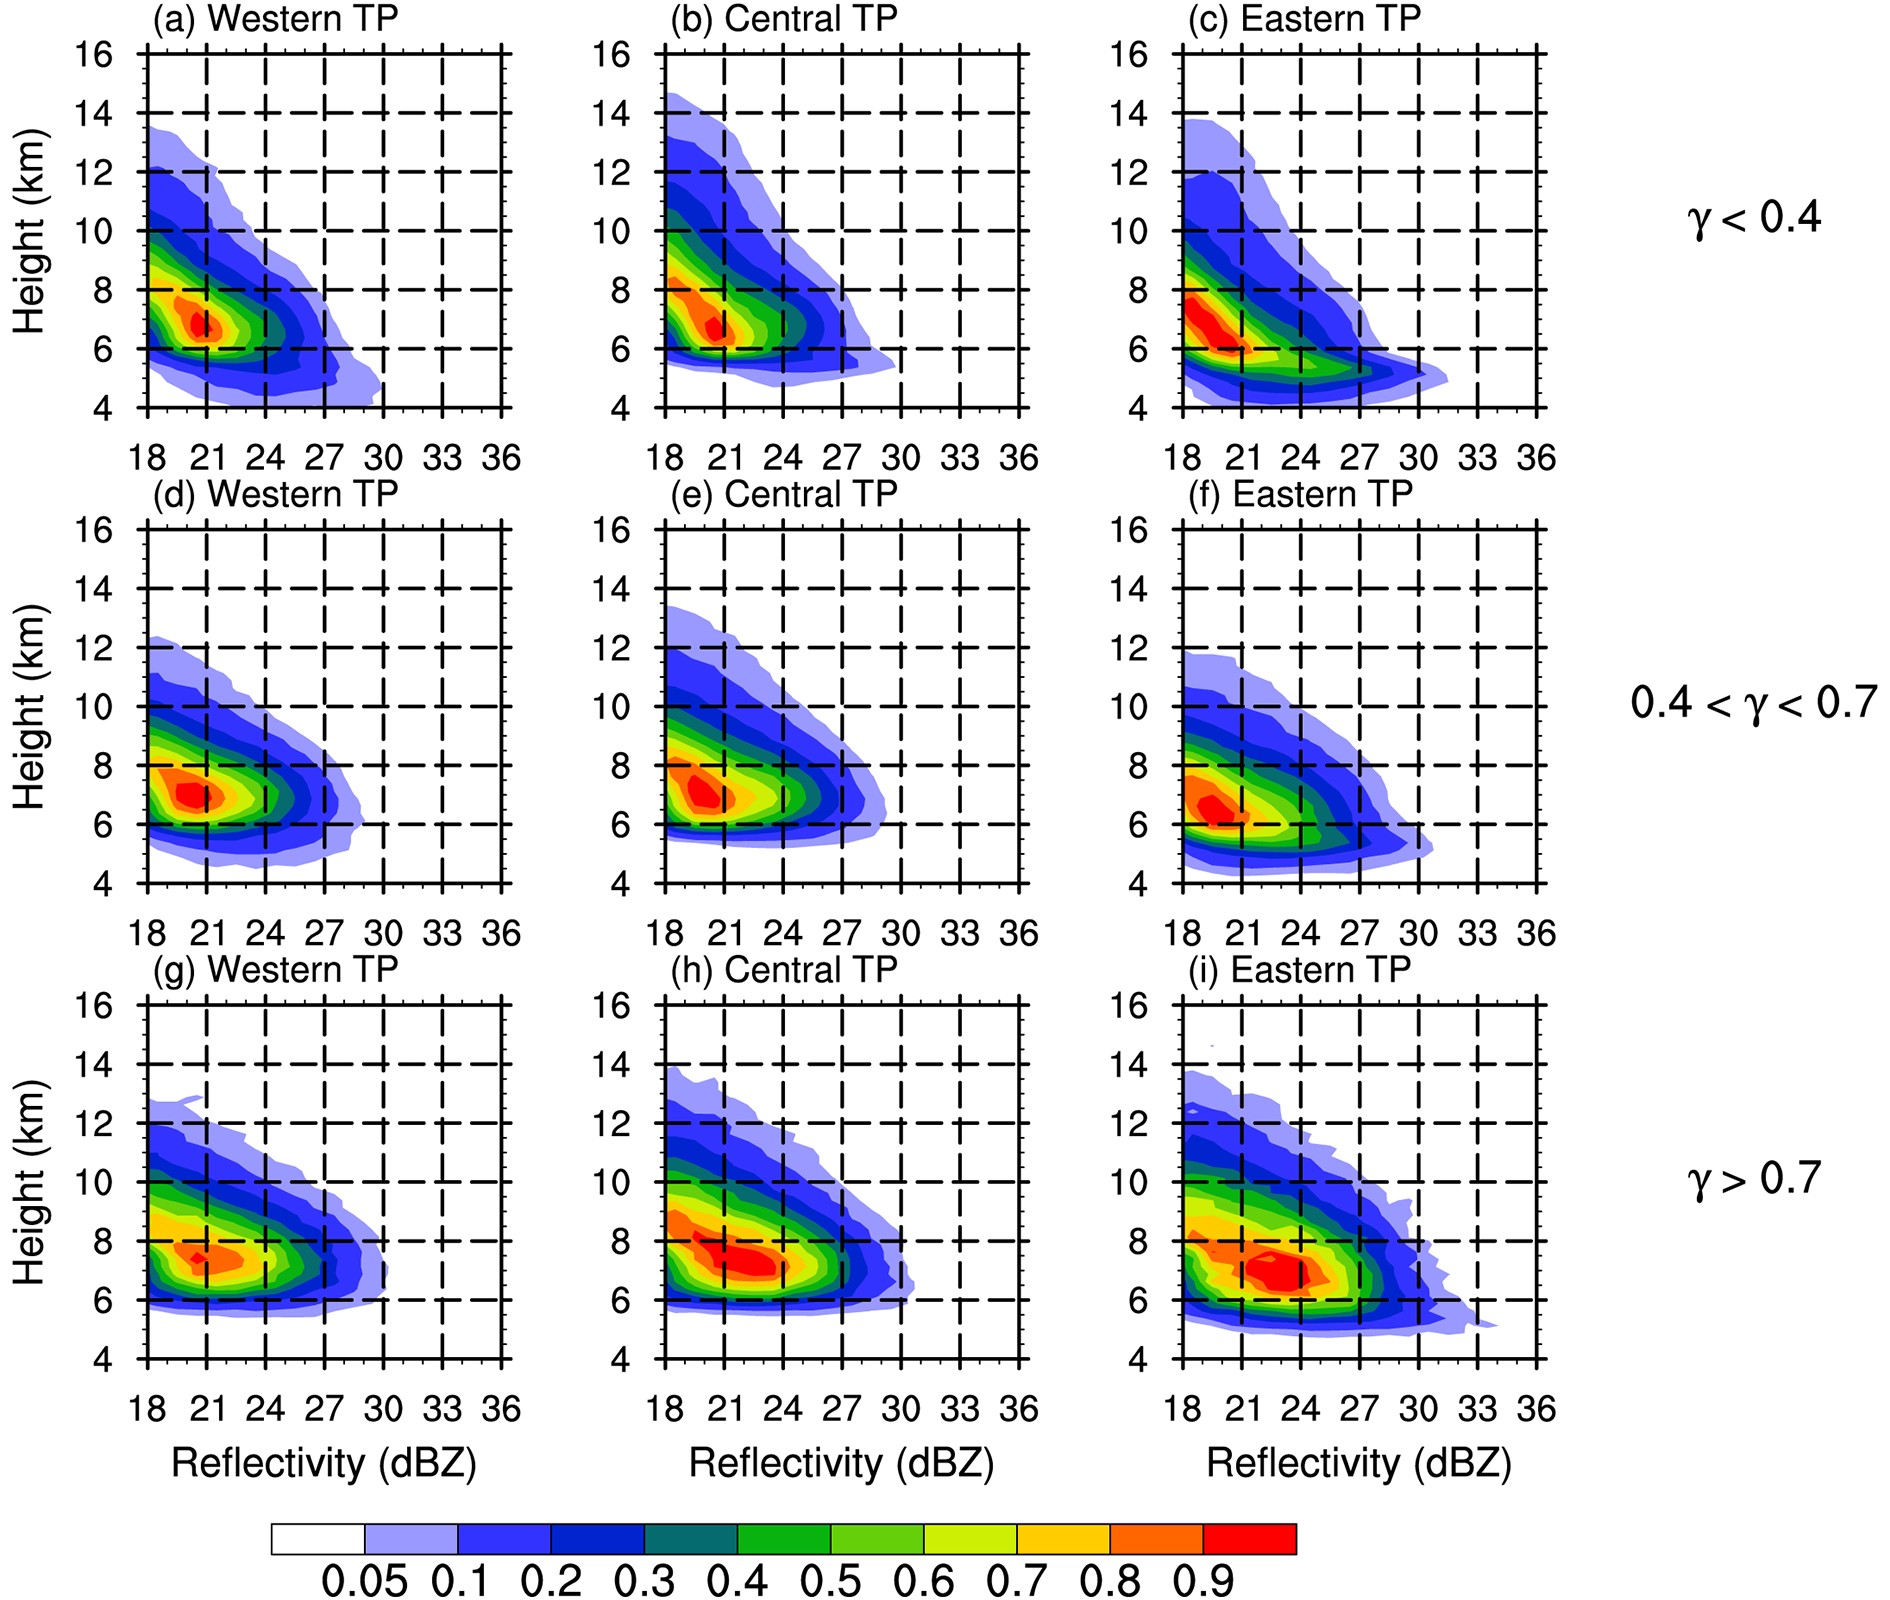 Figure8. CFAD of the precipitation-area reflectivity with different values of γ. The left-hand, center and right-hand panels represent the western, central and eastern Tibetan Plateau (TP), respectively: (a–c) γ < 0.4; (d–f) 0.4 < γ <0.7; and (g–i) γ > 0.7.
Taking the eastern Tibetan Plateau as an example, the plump-and-short precipitation areas have the highest outermost contour of up to 14 km (Fig. 8c). However, under constant reflectivity, the plump-and-short precipitation areas have a large difference in height between contours. For example, the distance between the 0.05 and 0.1 contours at 18 dBZ is > 2 km (Fig. 8c), whereas this distance is < 1.5 km for thin-and-tall precipitation areas (Fig. 8i). This suggests that although a few pixels of the plump-and-short precipitation areas have high rain tops, more of the other pixels have not been equally developed in terms of depth.
There is a bulge at a height of 5 km (Fig. 8c), which corresponds to the height of the freezing level over the Tibetan Plateau in summer. This indicates that there is a large proportion of stratiform precipitation pixels in the plump-and-short precipitation areas. The reflectivity in the thin-and-tall precipitation areas (Fig. 8i) is enhanced at about 10 km and the 0.5 contour exceeds 27 dBZ at 8 km, whereas the reflectivity of the plump-and-short precipitation areas is only 21 dBZ in the same situation. The reflectivity of the thin-and-tall precipitation areas does not show a sudden increase near the freezing level, indicating that there are more convective pixels with vigorous development in the vertical direction. The precipitation areas with a moderate 3D morphology have the lowest CFAD with a weak bulge at the freezing level (Fig. 8f), meaning that these precipitation areas produce mainly weak convective precipitation and may contain a few stratiform precipitation pixels.
3
3.2.3. Spatial distribution
Figure 9 shows the spatial distribution of the precipitation area RRav with different morphological characteristics over the Tibetan Plateau. There are two major centers of precipitation over the Tibetan Plateau: east of the Tibetan Plateau (east of 100°E) and south of the Tanggula Mountains (30°–33°N, 85°–93°E). In both regions, RRav has a clear tendency to increase with the size of the precipitation area. The value of RRav increases from 1.6 to >2.5 mm h?1 over the Tibetan Plateau east of 100°E and to nearly 2.5 mm h?1 over the southern slopes of the Tanggula Mountains. It is worth noting that these two regions are relatively flat: one is 3 to 4.5 km above sea level, and the other is mainly 4.5 to 5 km above sea level (Fig. 1b). By contrast, RRav and the scale of the precipitation area show different relationships in areas with a low RRav. Over the northern part of the Tibetan Plateau, RRav increases from ~1.2 mm h?1 in small precipitation areas to ~1.6 mm h?1 in large precipitation areas. Over the trumpet-shaped region (~30°N, 90°E) and the northwestern Tibetan Plateau (north of 32°N, west of 80°E), RRav is ~1.4 mm h?1 regardless of the scale of the precipitation area. The high altitude and steep terrain in these areas (Fig. 1b) may not be conducive to the development of scale and rain rate.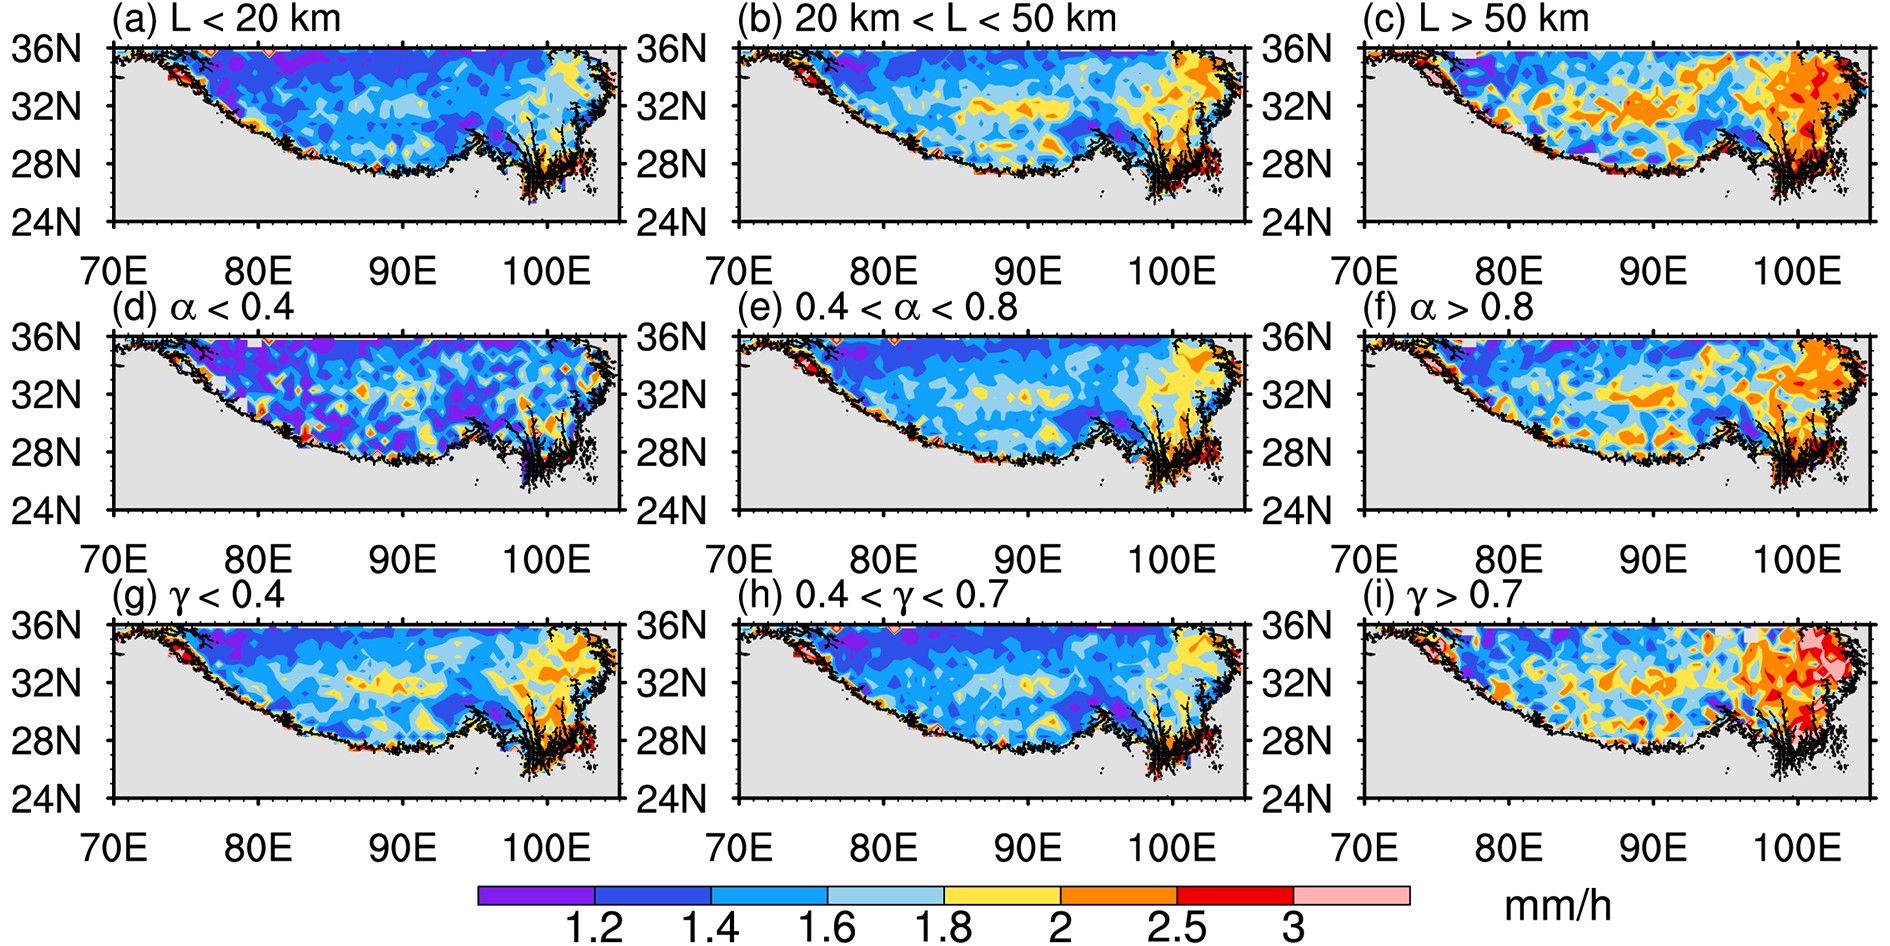 Figure9. Spatial distribution of the average precipitation area RRav with different morphological characteristics: (a) L < 20 km; (b) 20 < L < 50 km; (c) L > 50 km; (d) α < 0.4; (e) 0.4 < α < 0.8; (f) α > 0.8; (g) γ < 0.4; (h) 0.4 < γ < 0.7; and (i) γ > 0.7.
The relationship between α and RRav (Figs. 9d–f) shows that RRav increases with increasing values of α, similar to that shown in Figs. 9a–c. As α increases to 0.8, the area with RRav < 1.4 mm h?1 decreases significantly. The RRav values of linear precipitation areas are almost all < 1.8 mm h?1 (Fig. 9d). By contrast, for the square-shaped precipitation areas, part of the central Tibetan Plateau has values of RRav > 2 mm h?1 and almost all of the eastern Tibetan Plateau is > 2 mm h?1 (Fig. 9f). According to our criteria, the typical example of isolated convective rain shown by Fu et al. (2006) is a square-shaped precipitation area. We therefore speculate that square-shaped precipitation systems are produced by the strong solar heating at flat areas over the Tibetan Plateau, and are continuously strengthened by the release of latent heat. However, some precipitation systems are blocked by topography and develop linearly along the mountain slope, which hinders energy transfer and weakens precipitation intensity.
With an increase in γ, RRav shows a tendency to first decrease and then increase. The thin-and-tall precipitation area in the northeast corner of the Tibetan Plateau (Fig. 9i) shows the largest RRav, which can reach >3 mm h?1. In the trumpet-shaped region, the thin-and-tall precipitation areas show a larger RRav than the other 3D morphologies of precipitation areas. We speculate that those thin-and-tall precipitation areas mainly appear in the daytime, corresponding to stronger surface heating and larger convective available potential energy than those in the plump-and-short precipitation areas. This phenomenon has been revealed by using CloudSat observations that the outflow height of deep convection systems is higher but the horizontal range is smaller over the southern slope of the Tibetan Plateau during daytime than those during nighttime (Chen et al., 2019). For precipitation areas with a moderate γ, RRav is < 1.8 mm h?1 in most regions of the Tibetan Plateau.
For the 1D morphological parameter L, the RRav distribution of small precipitation areas is the widest. When L > 20 km, RRav increases with an increase in scale, which is most significant over the eastern Tibetan Plateau. There are more embedded deep precipitation pixels in the large precipitation areas, although the increase in reflectivity mainly occurs at low levels. By contrast, small precipitation areas show more convective features in their vertical structure. RRav is most sensitive to L over the eastern part of the Tibetan Plateau and the southern slopes of the Tanggula Mountains, increasing from 1.6 (small precipitation areas) to 2.5 (large precipitation areas) mm h?1. RRav is almost unchanged over the trumpet-shaped terrain in the southeast of the Tibetan Plateau.
For the 2D morphological parameter α, the RRav distribution is the narrowest for the linear precipitation areas, which have the lowest value, whereas RRav is highest for square-shaped precipitation areas. The response of the vertical structure to α is unclear. In terms of the spatial distribution, the RRav of the linear precipitation areas over the whole Tibetan Plateau is almost < 1.8 mm h?1, whereas the RRav of the square-shaped precipitation areas over the eastern Tibetan Plateau is almost > 2 mm h?1.
For the 3D morphological parameter γ, 0.6 is a critical threshold. When γ is less than (greater than) the threshold, RRav decreases (increases) as γ increases. Different values of γ correspond to completely different vertical structures of precipitation areas. Plump-and-short precipitation areas have a few pixels with high echo-top heights, but their other pixels have not been developed equally. Thin-and-tall precipitation areas develop vigorously in the vertical direction, whereas the precipitation areas with a moderate γ are shallow and weak in terms of their vertical structure. Thin-and-tall precipitation areas show an average RRav > 3 mm h?1 in parts of the eastern Tibetan Plateau, whereas precipitation areas with a moderate γ have RRav values of 1.8–2 mm h?1 in the same region.
These morphological characteristics of precipitation areas are obtained from long-term satellite observations and it will be easy to compare these results with the results of numerical models. Such a comparison will be able to verify the stability of the simulation of precipitation over the Tibetan Plateau from a morphological perspective. Knowledge of the morphology of precipitation areas will also provide an observational basis for estimating 3D latent heating in this region (Li et al., 2019).
Acknowledgements. The data can be obtained from the websites
APPENDIX
