HTML
--> --> -->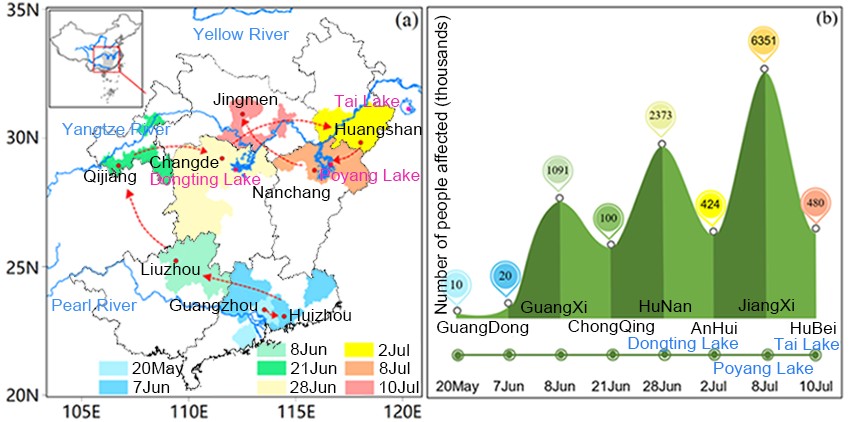 Figure1. (a) Distribution map of flood events from late May to mid-July 2020. Red arrows indicate the timeline of flood-event occurrences and red dots indicate the most severely affected cities. (b) Number of people affected by each major event, according to social media sources.
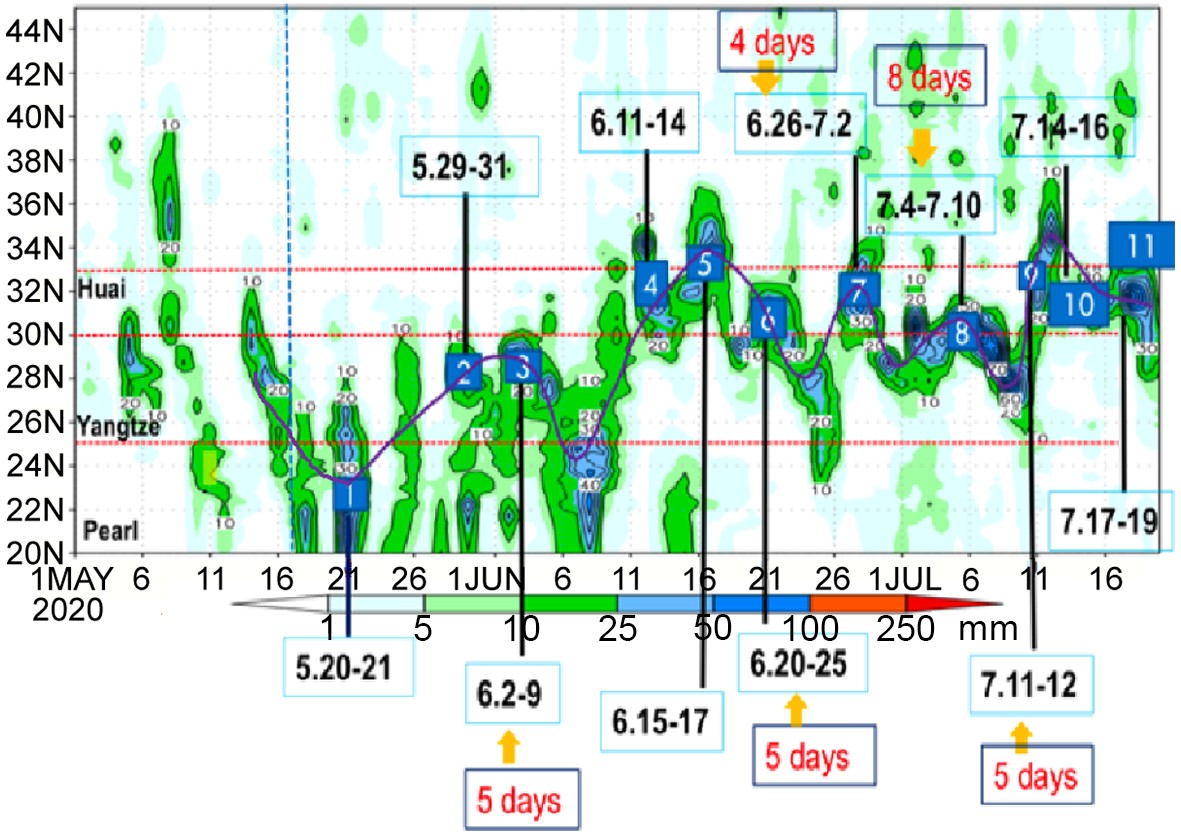 Figure2. Daily zonal mean precipitation over part of mainland China (20°–44.5°N). Eleven extreme precipitation events (dates in bold black font) in central to eastern China since the onset of the monsoon up to 28 July 2020. The number of days (in red) are the lead days when corresponding events were skillfully predicted with good quality using medium- and extended-range quantitative precipitation forecasting by the National Meteorological Center.
These anomalously high precipitation and severe flooding events have resulted in serious impacts, exerting much higher than usual pressure on emergency response, flood control and mitigation measures, yet simultaneously occurring severe flood events in different locations due to heavy long-lasting rainfall is not uncommon for China. Timely and accurate maps showing current and days-ahead flood risk at both regional and local scales are thus highly desirable for decision-makers. This is clearly within the scope of responsibility and within the capabilities of the international hydrometeorological community. Instead of looking into the causes of this year’s extreme flooding, which certainly warrants in-depth analysis, in this article we intend to provide a short view toward a more general hydrometeorological solution to this problem of growing concern at the global level. We urge the international hydrometeorological community to do more for better preparedness and for a better response to such catastrophic flooding events, in particular from the perspective of hydrometeorological modeling, given the projections of more frequent and extreme precipitation events under a continuously warming climate (e.g., Allan and Soden, 2008; Trenberth, 2011; Chen et al., 2020). Given the complex relationship between precipitation and flooding (Wu et al., 2017; Yan et al., 2020), detailed and accurate monitoring and better forecasting of flooding ought to be done jointly between the meteorological and the hydrological communities, through sharing observations, measurements and modeled data, modeling techniques and outputs, as well as expertise and lessons learned.
Meanwhile, practical flood defense and mitigation efforts are conducted at local level and in upstream headwater areas prone to flash flooding and are put in place quickly, following heavy rainfall, and in certain river reaches and reservoirs/lakes after upstream flood waves cause significant fluvial flooding in downstream areas. However, although fluvial floods usually develop from upstream (flash) flooding, different methods and tools exist to predict and warn against fluvial flooding and pluvial (flash) flooding. Fluvial flooding is predicted mostly using process-based hydrological or hydraulic models with different levels of representation of river channel geometry, floodplain topography and flood defense measures. Pluvial and flash flooding is typically forecast based on data-driven techniques, and on the identification of extreme rainfall intensities over short periods, although hydrological models are often involved to improve the simulation of the flood dynamics. In addition to differences in defense mechanisms between fluvial floods and flash floods, and different challenges in deriving reliable predictions for both, hydrologists and meteorologists are typically not collaborating given the non-trivial differences in and traditional separation of the disciplines they work in. However, in reality, there is of course no clear boundary between pluvial (flash) floods and fluvial flooding (Figs. 3a–c). A state-of-the-art flood modeling framework should be able to provide both large-scale flood detection and detailed flood delineation at local scales with sufficient levels of accuracy.
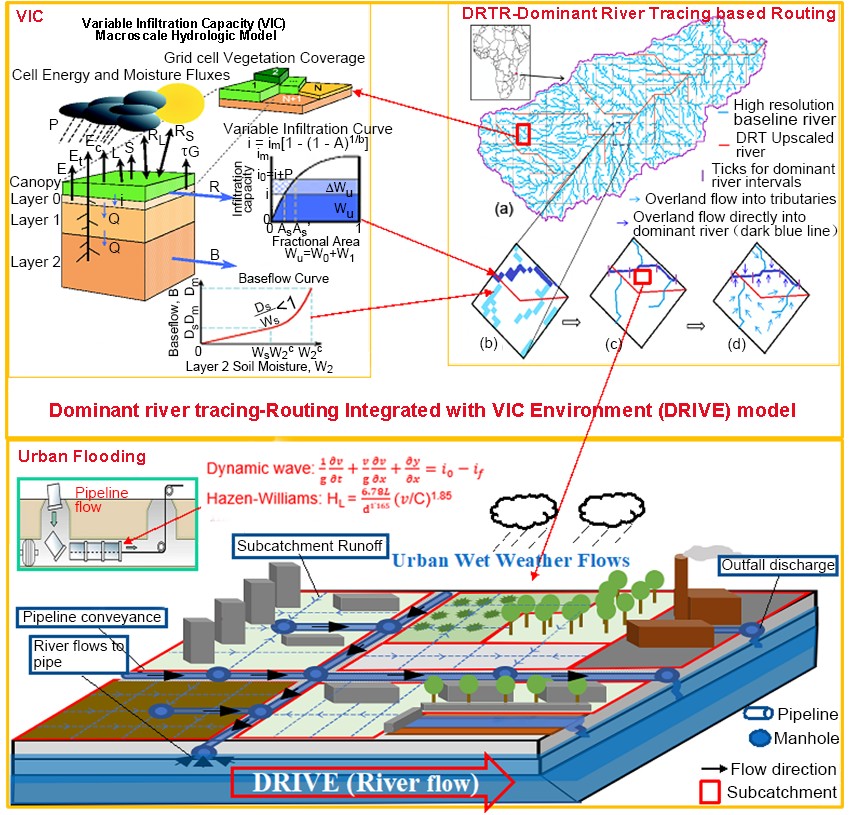 Figure3. Schematic illustration of a GHS-F: DRIVE model, including an urban flood module in addition to pluvial (flash) flooding and fluvial flood modeling.
The feasibility of a high-resolution large-scale flood model had been suggested about 10 years ago by Wood et al. (2011), with a lot of ensuing and interesting discussion (Beven and Cloke, 2012; Bierkens et al., 2015). We have now reached the era of unprecedented computing capability and timely data availability as well as model and data interoperability, so as to unify a modeling platform for monitoring and forecasting flood risk from global to local scales, and from flash flood to fluvial flood, including urban flooding (Fig. 3). Urban flooding is usually caused by high water levels in river channels and/or extreme precipitation in urban areas, which saturate the capacity of the drainage system. The Global Flood Monitoring System (GFMS) based on the Dominant river tracing-Routing Integrated with VIC Environment (DRIVE) model developed by Wu et al. (2011, 2012, 2014, 2019) provides a solid blueprint and basis for a GHS-F prototype model (Fig. 4), having been employed routinely to provide global to local flood monitoring and forecasting, serving international, national and local communities with various options for user-specific decision-making, including current ongoing support for response actions of the Chinese Ministry of Emergency Management, on a daily basis.
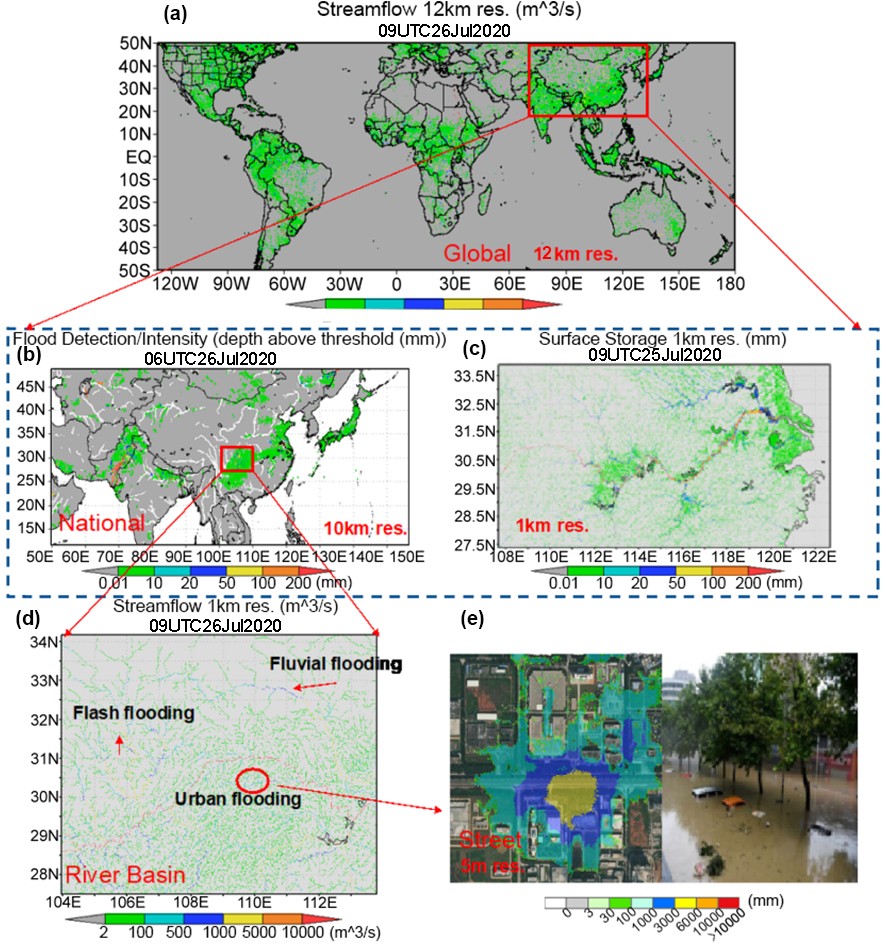 Figure4. An example of GFMS output from global to local scale flooding. (a) Global streamflow distribution map with resolution of 12 km. (b) China’s flood detection/intensity distribution map with resolution of 10 km. (c) Distribution map of surface storage of local watershed with resolution of 1 km (d) Local streamflow distribution map resolution of 1 km. (e) Urban waterlogging map with 5 km resolution
The estimation of risk from dam and levee breaches, as well as loss and damage estimations is central to the whole decision-making processes (Fig. 5a). Although decision-makers place high value on observations from ground stations and satellites, significant spatiotemporal gaps exist widely in current observational infrastructures, leading to limited confidence in risk estimation that typically further decreases as the lead time of prediction increases. However, decision-makers tend to value model-based information when observations are not available or the model results show good consistency with observations (Fig. 5b) or reported loss and damage, and can be trusted. Therefore, two critical components of higher priority are suggested in developing a GHS-F. First, the real-time assimilation of streamflow or water level observations, which is particularly important for improving the modeling of larger rivers that are often significantly regulated by dam and reservoir operations, and significantly affected by various human activities, leading to modified flood peak magnitude and timing. The second important component that should be implemented in a GHS-F as a top priority is a high-resolution hydrodynamic module for better simulation of floodplain inundation, flood duration and water storage, with the capability of integrating with or assimilating high-resolution inundation mapping from remote sensing (Fig. 5c). With these two major components, inundation depth and duration can be accurately modeled at high spatial resolutions (e.g., 5–10 m) in both nowcasting and forecasting modes, providing the critical basis for damage function derivation and risk assessment.
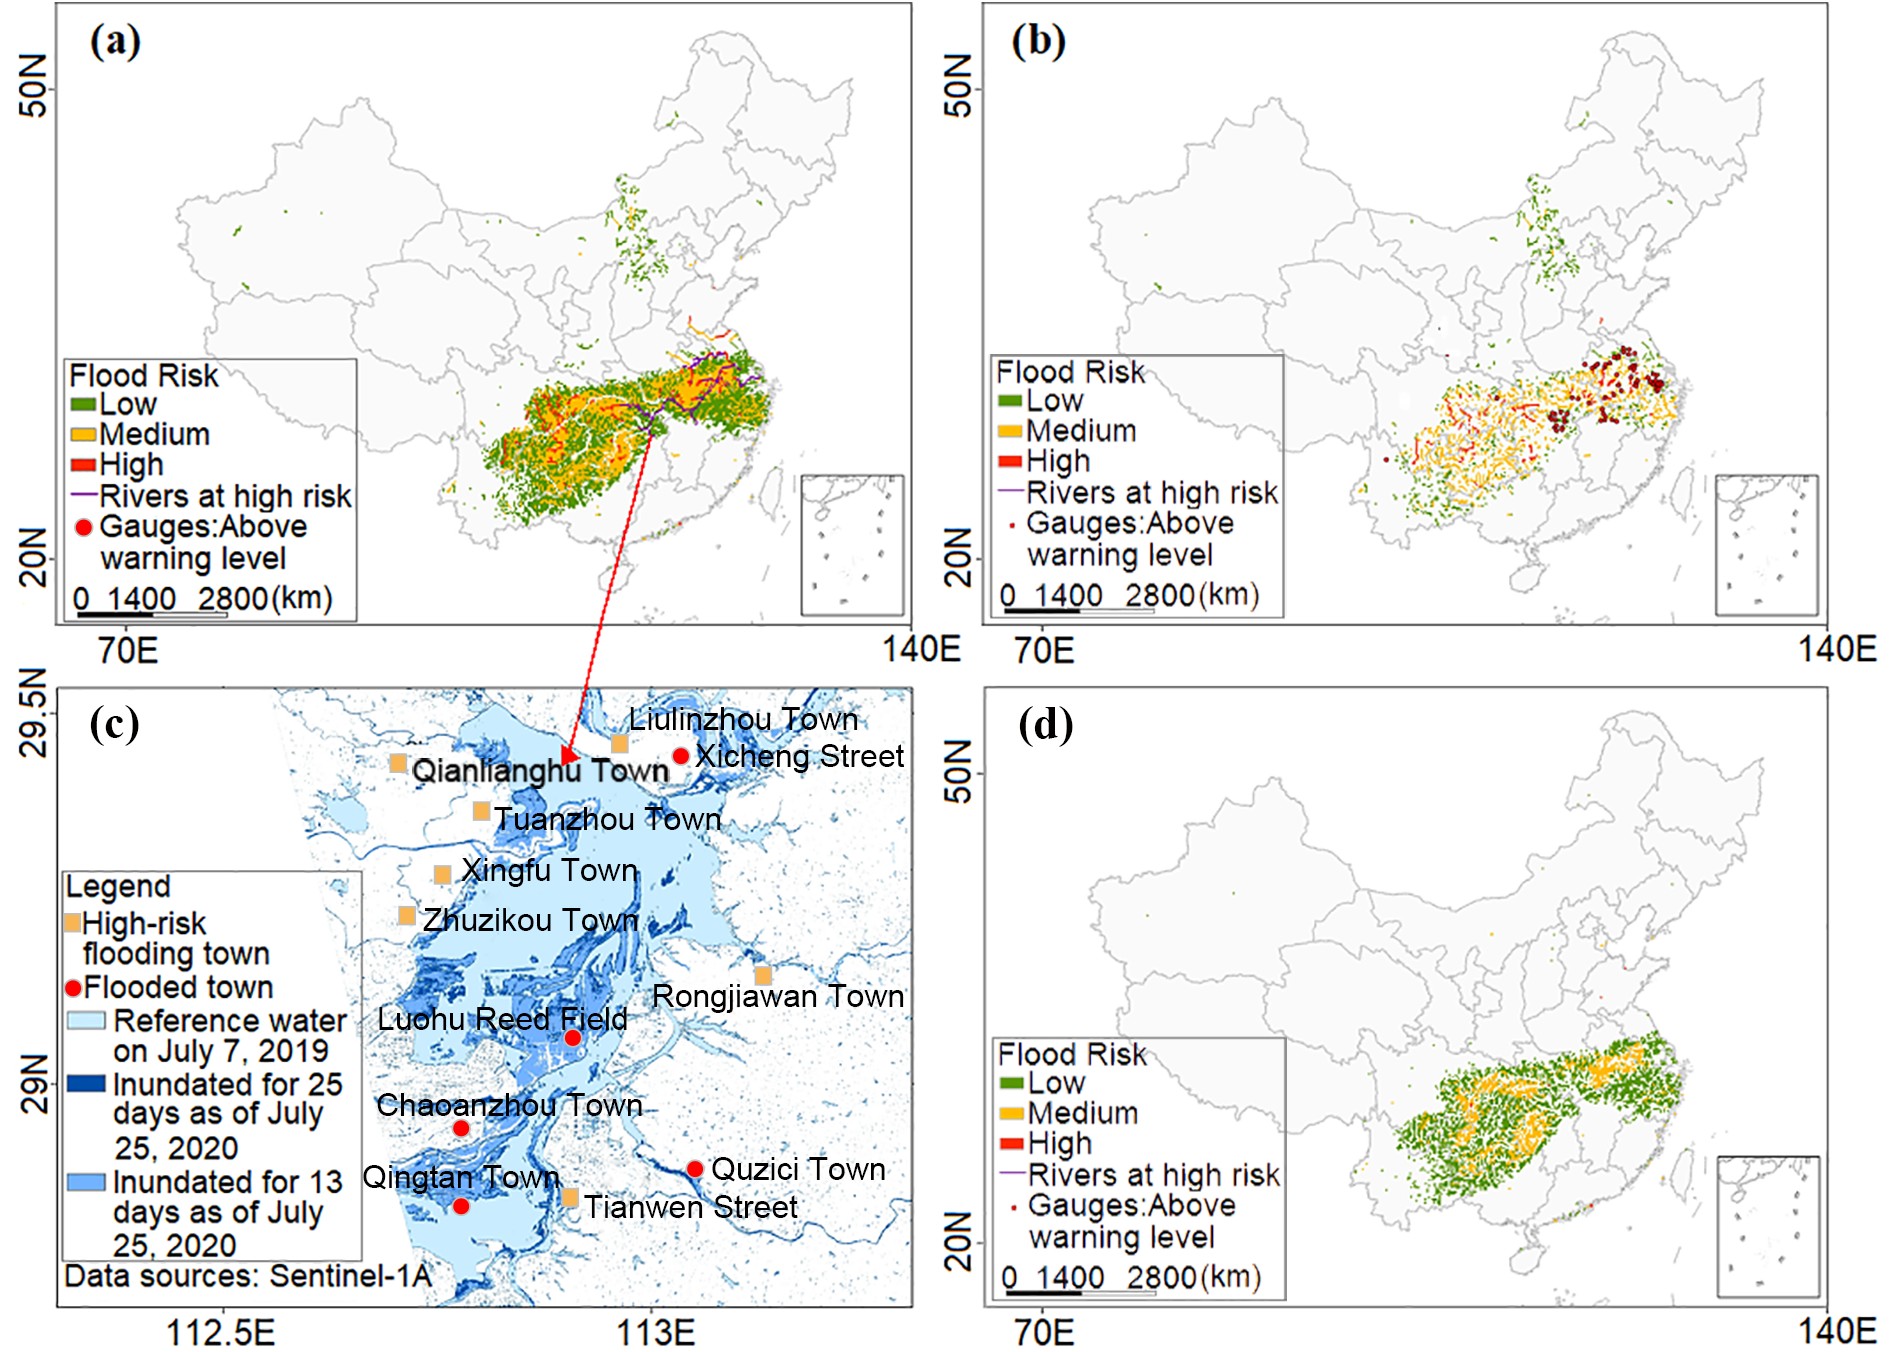 Figure5. (a) Flood detection and intensity by GFMS with the China Meteorological Administration’s real-time quantitative precipitation estimation. (b) Risk estimation of flash flooding. (c) Sentinel-1-based flood inundation mapping for Dongting Lake, with the inset showing the temporal variations of lake areas, estimated by NOAA NPP satellite optical band data, together with the water level measured on the ground at the lake outlet. (d) Fluvial flooding in small- to mid-sized rivers.
With this said, high-quality precipitation forecasting always plays the most important role in driving models from global to local scales, which is the main link connecting the meteorological and hydrological communities for a joint undertaking in better predicting and mapping severe flooding, such as that still ongoing in China and several other places around the world. High-quality precipitation forecasting with an adequate lead time of four to eight days, for example, looks promising for a GHS-F to produce better flood outputs and flood risk monitoring and forecasting capabilities.
Acknowledgements. This study was supported by the National Key R&D Program of China (Grant No. 2017YFA0604300) and the National Natural Science Foundation of China (Grant Nos. 41861144014, 41775106 and U1811464), as well as partially by the Program for Guangdong Introducing Innovative and Entrepreneurial Teams (Grant No. 2017ZT07X355) and the project of the Chinese Ministry of Emergency Management on “Catastrophe Evaluation Modeling Study”.
