HTML
--> --> -->Continuously upgraded and refined observations provide valuable insights into the understanding of the microphysical structure of the TC rainband, such as in-situ aircraft (Houze et al., 1992) and satellite observations (Hence and Houze, 2012; Chen et al., 2019a), which can be used to improve microphysical parameterizations (Brown et al., 2017; Murphy et al., 2019). Recently, the widespread use of polarimetric radar (PRD) has brought new opportunities for the observation of microphysical processes in TC convection. Compared with conventional radar variables, reflectivity (ZH), and radial velocity, PRD adds variables, such as differential reflectivity (ZDR), specific differential phase (KDP), and the copular correlation coefficient between horizontal and vertical polarizations (ρHV), which provide more useful information to characterize bulk microphysical characteristics (Bringi and Chandrasekar, 2001; Kumjian, 2018). The unique observational advantages make PRD observations widely useful in studying cloud precipitation microphysics, such as hydrometeor classification (Vivekanandan et al., 1999), raindrop size distribution (DSD) retrieval (Zhang et al., 2001; Sun et al., 2020), QPE (Ryzhkov et al., 2005; Chen et al., 2019b), microphysical fingerprinting (Kumjian and Ryzhkov, 2010, 2012; Kumjian and Prat, 2014), microphysical parameterization checking (Brown et al., 2016; Wang et al., 2020), and analyses of squall lines (Wen et al., 2017; Wu et al., 2018a), mesoscale convection systems (Chang et al., 2014), and winter storms (Moisseev et al., 2015; Schrom and Kumjian, 2016).
Although TCs mostly develop over the ocean, current PRD observations for TCs focus mainly on landfalling TCs because PRDs are deployed on land. At present, although there are very few TCs observed by PRD, each case has deepened the understanding of the microphysical structure of TCs. May et al. (2008) first analyzed the hydrometeor type distribution in the eyewall and rainband of TC Ingrid (2005). Didlake and Kumjian (2017) documented the vertical profile of PRD variables in different dynamic regions of the eyewall and inner and outer rainbands of Hurricane Arthur (2014). Didlake and Kumjian (2018) further related the microphysics to the asymmetric dynamic structure of Hurricane Irma (2017). Kalina et al. (2017) examined the ice particle distribution and ice-water path of Hurricane Arthur (2014) and Irene (2011).
In China, PRD observations of TCs have recently started to be made (Zhao et al., 2019). Such studies have mainly focused on TCs making landfall in the east of China, including analyses of hydrometeor type distributions, kinematics and microphysical processes in the inner and outer rainbands (Wang et al., 2016; Wu et al., 2018b), and the relationship between kinematics and microphysics (Wang et al., 2018). Wen et al. (2018) showed that the microphysical processes of TCs occurring over continental China are different to those in other regions (e.g., western Pacific and Atlantic). Previous studies in China have mostly focused on TCs that make landfall in midlatitude areas. During its northward movement, a TC rainband may interact with midlatitude air masses; thus, even for the same TC, the DSD characteristics of different rainbands may have obvious differences (Bao et al., 2019, 2020). A midlatitude landfalling TC is likely to be affected by the midlatitude air mass, and it is difficult to represent the natural attributes of TCs.
Hainan Island is located in a tropical area, and TCs landing in that area maintain their original attributes. PRD observations in this area can be used to study the precipitation attributes of the TC itself. To the best of our knowledge, few studies have focused on the microphysical processes of TCs in the South China Sea (SCS) observed by PRD (Zhao et al., 2019). The present work is a preliminary study to address this knowledge gap. Specifically, the differences in the microphysical processes of TC rainbands in different climate regions still need to be revealed, so more in-depth PRD observations are needed to analyze the development processes of different TC rainbands. In addition, ice particles have a significant effect on the precipitation process (Brown et al., 2017), while existing studies seldom discuss the interaction of ice processes and warm-rain processes in the TC rainband.
In this paper, we document for the first time the microphysical characteristics and processes during the inner rainband life cycle of TC Kajiki (2019) in the SCS based on 2D video disdrometer (2DVD) and PRD data, as well as the potential impact of ice particles on the DSD aloft, to improve our understanding of the microphysical characteristics and processes in the TC rainband and provide a reference for the design and verification of microphysical parameterizations in NWP models.
The rest of the paper is organized as follows: Section 2 describes the data and analysis methods. Section 3.1 discusses the characteristics of Kajiki DSDs observed by 2DVD. Section 3.2 presents the synoptic conditions and evolution of the inner rainband of Kajiki. The vertical microphysical structure and processes are examined in section 3.3. The conclusions and some further discussion are presented in section 4.
2.1. Observations
The main observational instruments used in this paper are the PRD located at Haikou (20.00°N, 110.25°E; hexagonal star in Fig. 1) and the 2DVD located at the Tunchang station (32.36°N, 110.10°E; blue cross in Fig. 1, approximately 70 km southwest of the Haikou radar). The best track of TC Kajiki (2019) from the China Meteorological Administration (Ying et al., 2014) of TC Kajiki (2019) and the locations of observation sites are shown in Fig. 1. The Haikou PRD has a 0.987° beam width and a 460-km detection distance with a 250-m range resolution and is operated in the VCP21 (volume coverage pattern) mode consisting of nine elevations (0.5°, 1.5°, 2.4°, 3.3°, 4.3°, 6.0°, 9.9°, 14.6°, and 19.5°). TC Kajiki’s inner rainband is ~80?160 km away from the PRD. There is a beam width of ~1.3 km at the 80-km range, and ~2.7 km at the 160-km range. The sampling volume increases as the beam spreads with increasing range, and this beam spreading will lead to degrading vertical resolution at large ranges (Didlake and Kumjian, 2017). Figure1. Location of the Haikou polarimetric radar (HK, red hexagonal star), 2-D video distrometer (2DVD, blue cross, approximately 70 km southwest of the Haikou PRD), along with the topography (units: m) and the best track (solid green line and red dots) from the China Meteorological Administration every 3 h from 2100 UTC 1 September to 0600 UTC 2 September 2019.
The PRD at Haikou is China’s newest generation Doppler weather radar (CINRAD), and the data have undergone effective quality control, including calibration and correction for PRD variables before operational observation. The accuracy of the quantitative application of polarimetric data, such as DSD retrieval and hydrometeor classification, depends heavily on the accurate estimation of ZDR. This study uses the method of Guo et al. (2019) to measure the system ZDR bias of the Haikou PRD, and the results show that the system ZDR bias is approximately 0.03 dB, which meets the accuracy requirement of ZDR (< 0.2 dB). In addition, the ZDR calculated by the 2DVD is closely consistent with that of the PRD, suggesting that the PRD-measured ZDR data are well corrected.
This paper uses the algorithms of Schuur et al. (2003) and Park et al. (2009) to perform further data quality control procedures based on the output data of the Haikou radar. First, the non-meteorological returns, such as ground clutter and biological scatter, are discarded, and ZH and ZDR are smoothed along the radial using a five-gate median average and a five-gate running mean, respectively, to reduce fluctuations (Schuur, 2003). Then, noise corrections of ZDR and ρHV are performed by the signal-to-noise ratio at horizontal polarization (Schuur, 2003), and KDP is estimated by a least-squares fit of the filtered differential phase. Finally, ZH and ZDR are corrected for attenuation in heavy rain using the filtered differential phase (Park et al., 2009). After quality control, the radar data are interpolated onto a Cartesian grid at a 1-km horizontal and 0.5-km vertical resolution using bilinear interpolation.
Before calculating the DSD, some quality control procedures on the 2DVD data are performed. First, raindrops with falling velocities 60% lower or higher than the empirical fall velocity-diameter of Brandes et al. (2002) are removed to eliminate the oversampling error. One minute samples with fewer than 50 drops or rain rates less than 0.1 mm h?1 are removed (Wang et al., 2016; Bao et al., 2019). After quality control, the 2DVD data from 1800 UTC 1 September 2019 to 1800 UTC 3 September 2019 are used.
2
2.2. Methods
32.2.1. Rain type classification
Samples with rain rates (measured by the 2DVD) less than 10 mm h?1 are considered stratiform; otherwise, they are convective (Chang et al., 2014; Wang et al., 2016; Wen et al., 2018; Wu et al., 2019). A robust separation algorithm is used to identify the rain type from PRD measurements based on ZH at a 2-km height (Steiner et al., 1995). The classification results are used to calculate the contoured frequency by altitude diagram (CFAD) proposed by Yuter and Houze (1995) to analyze the vertical structure of the inner rainband of TC Kajiki.3
2.2.2. DSD retrieval
The Marshall and Palmer distribution was first used for the natural DSD fit (Marshall and Palmer, 1948), Ulbrich (1983) introduced a new shape parameter and proposed the gamma distribution:where N(D) (m?3 mm?1) is the number concentration parameter, N0 (m?3 mm?1?μ) is the intercept parameter, Λ (mm?1) is the slope parameter, and D (mm) is the equivalent volume diameter. The liquid water content (LWC, g m?3) can be computed as follows:
where Dmax, Dmin is the maximum or minimum diameter of raindrops measured by the 2DVD, and ρw (g cm?3) is the water density (1 g cm?3). The normalized intercept parameter Nw (m?3 mm?1) and the mass-weighted diameter Dm (mm) are defined as follows (Testud et al., 2001; Bringi et al., 2003):
DSD aloft, it is necessary to retrieve the DSD based on PRD. Zhang et al. (2001) provided the constrained gamma model to retrieve the DSD, which depends on the μ?Λ relation. This study derives the relationship based on the truncated method (Vivekanandan et al., 2004). The distribution of μ?Λ is more scattered when the rain rate is less than 5 mm h?1; thus, this study uses DSDs in which the rain rate is greater than 5 mm h?1 to establish the μ?Λ relation (Chang et al., 2009; Wen et al., 2018):
The scattering characteristics of raindrops can be simulated by the T-matrix (Mishchenko et al., 1996). PRD variables can be calculated from DSD using the PyTMatrix developed by Leinonen (2014).
3
2.2.3. Classification of hydrometeor types
This paper follows the hydrometeor classification algorithms of Park et al. (2009) and Wang et al. (2018), resulting in the hydrometeor types in this study including eight classes: light rain, moderate rain, heavy rain, ice crystals, dry snow, wet snow, graupel, and rain and hail. The same membership functions as Wang et al. (2018) are used.3
2.2.4. Liquid and ice water content estimation
To estimate the LWC and ice water content (IWC) in the ice?water mixed phase, both ZH (dBZ) and ZDR (dB) are analyzed to separate water and ice using the difference reflectivity (ZDP, dB) method proposed by Golestani et al. (1989). The ZRAIN?ZDP relation is first established based on the 2DVD observations and is expressed as follows:where ZDP = 10lg(Zh ? Zv), in which Zh (mm6 m?3) and Zv (mm6 m?3) are the horizontal and vertical polarized reflectivity in line scale, respectively. Zrain (mm6 m?3) is the estimated rain portion of the total Zh, where ZRAIN = 10lg(Zrain) and ZH=10lg(Zh). Then, the estimated ice portion Zice (mm6 m?3) is Zice = Zh – Zrain. Finally, the LWC and IWC can be derived (Carey and Rutledge, 2000; Wen et al., 2017) as follows:
where ρi (= 0.917 × 10³ kg m?3) is the ice density and N0 (= 4 × 10⁶ m?4) is the intercept parameter.
3.1. Precipitation characteristics of the inner rainbands in TC Kajiki
Previous studies have shown that the microphysical characteristics of TC precipitation change with different climate regimes (Wen et al., 2018). To reveal the unique microphysics of Kajiki over the SCS, Fig. 2a shows the Nw and Dm distributions based on the 2DVD observations. The results show that the mean Nw and Dm of convective precipitation in different climate regimes are quite different. The convective precipitation of Kajiki is close to the maritime-like convective precipitation defined by Bringi et al. (2003), but the average diameter is slightly lower (Dm of ~1.5 mm). Compared with the results in Bao et al. (2019), our Dm is smaller and the Nw is larger. Compared with the TC landing in East China given by Wen et al. (2018) and Wang et al. (2016), our Dm is larger and the Nw is smaller. The difference in Nw and Dm may be attributable to the different climatic regions, with the caveat that other factors may be contributing as well (such as different storm regions, different storm strengths, land vs. oceanic processes), which need further study. Figure2. Raindrop characteristics based on the 2DVD observations: (a) distribution of the lgNw and Dm for convective (red circles) and stratiform (blue points) TC Kajiki [black circles indicate the average convective result (along with ± standard deviation); the two outlined rectangles correspond to the maritime (left) and continental (right) convective clusters reported by Bringi et al. (2003); ORR represents the convective outer-rainband rain and CFR represents the coastal-front rain defined by Bao et al. (2019)]; (b) the μ?Λ relation for TC Kajiki’s rainfall [the red solid line is the μ?Λ relation derived by the least-squares method based on the blue scatter points (rain rate, R > 5 mm h?1); the green solid line represents the Dm contour]; (c, d) contribution of raindrops in different diameter ranges to Nt and rain rate (R) in convective (Con., red color) and stratiform (Str., blue color) precipitation.
Figure 2b shows that the μ?Λ relationship derived in our study has a lower value of μ for a given Λ than that of the studies of Chang et al. (2009) and Bao et al. (2019), which indicates a smaller Dm compared with the previous studies mentioned above. Compared with the landfalling typhoon in Southeast China studied by Wen et al. (2018), the value of μ for a given Λ in this study is higher, indicating a smaller Dm, which is in line with the results of Fig. 2a. Therefore, the microphysical processes of tropical typhoons over the SCS are different from the systems observed in continental China.
Figures 2c and d show the proportion of raindrops with bins of different sizes in rain rate and total concentration Nt. The results show that small raindrops (0?1 mm) have the highest contribution to Nt, with an average of ~91.4%, but the contribution to the rain rate is only ~24.6%. The contribution to Nt of medium raindrops (1?3 mm) decreases to ~8.5%, but the contribution to the rain rate increases to ~73.7%. There are very few raindrops greater than 3 mm, and the contribution to the rain rate is rare (~1.7%). Thus, these results indicate that TC precipitation in the SCS is dominated by small and medium (1?3 mm) raindrops with high concentrations.
2
3.2. Evolution of the inner rainband
During the landfalling of TC Kajiki, a rainband is excited in its northeast quadrant. The life history of the rainband is close to 3 h (0100?0400 UTC), accompanied by short-term heavy precipitation, and the maximum rain rate exceeds 100 mm h?1. Kajiki has a minimum pressure of 996 hPa, a maximum wind speed of 15 m s?1, and a moving speed of approximately 22 km h?1 during the maturation of the inner rainband. The environmental conditions are shown in Fig. 3. Kajiki is located on the southwest side of the subtropical high, and it is moving southwestward with the guidance of the airflow at 500 hPa. The white square area in Fig. 3 is the inner rainband development area, in which the specific humidity is close to 11 g kg?1 at 700 hPa and 16 g kg?1 at 850 hPa. The specific humidity nearly exceeds 13.5 g kg?1 near the southeast side of the target area, which indicates a sufficient water vapor supply. The sounding observed at Haikou at 0000 UTC 2 September is presented in Fig. 3d, which shows that the freezing level is approximately 5.3 km.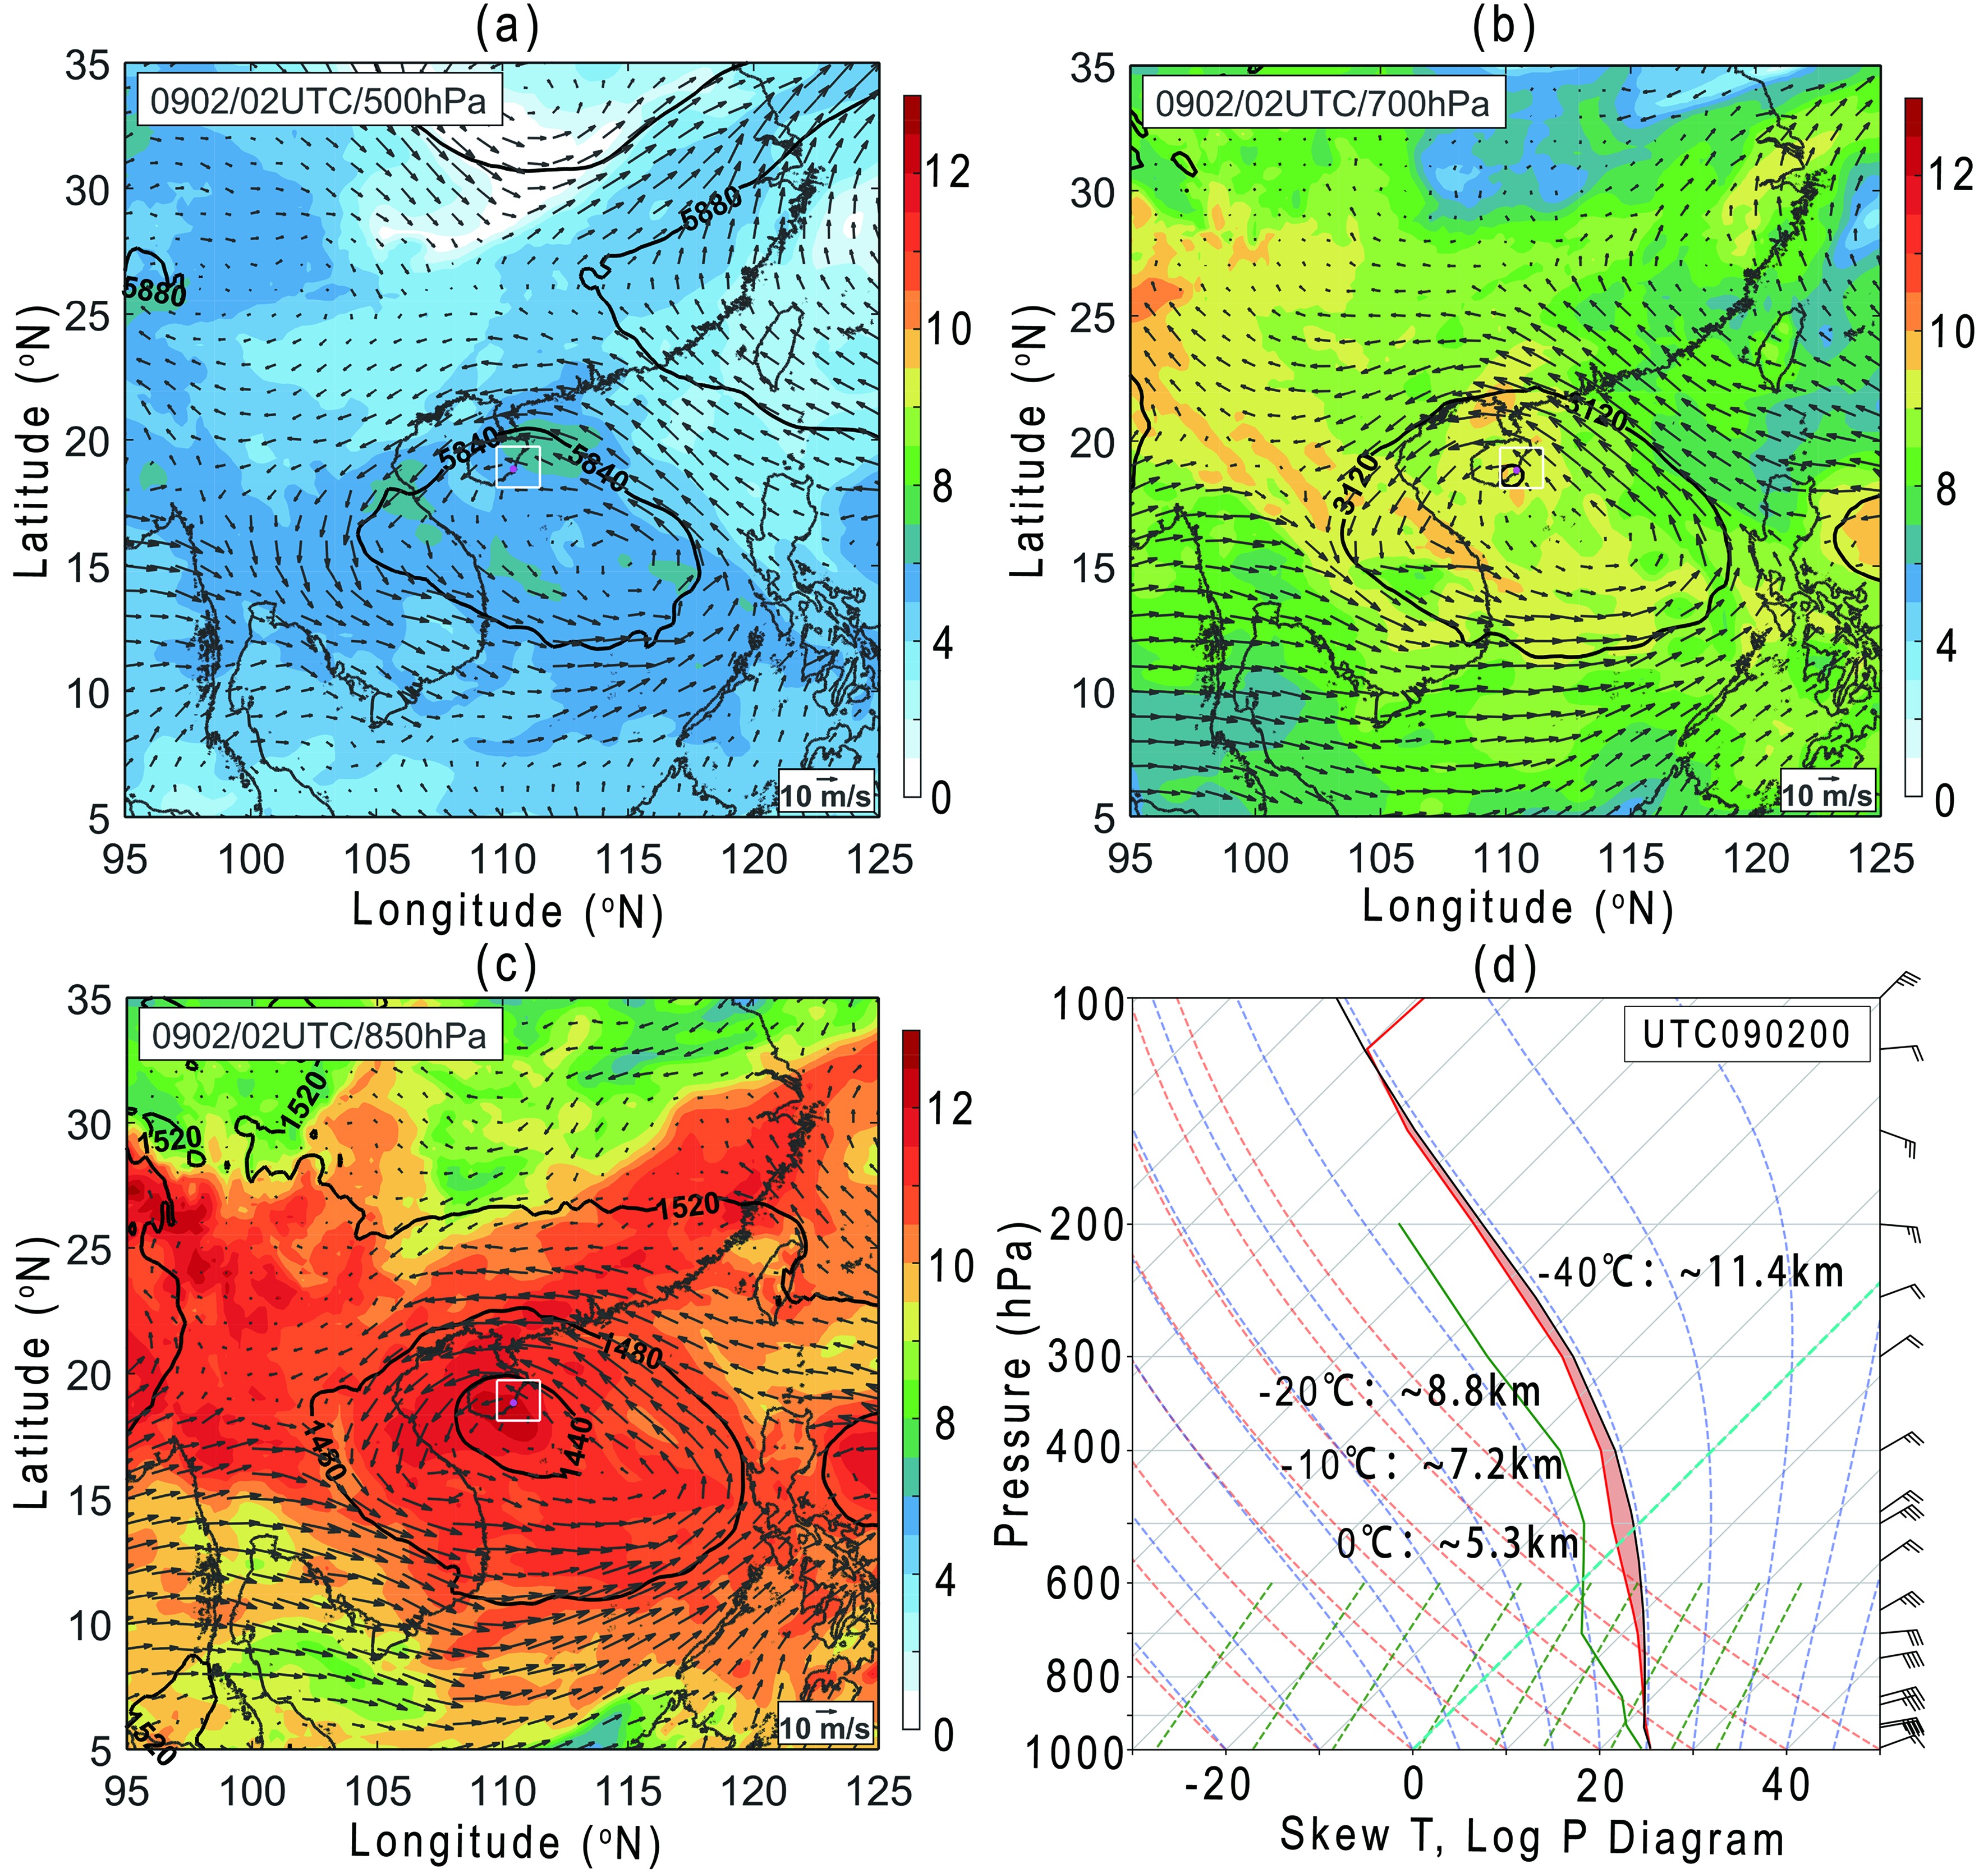 Figure3. (a?c) Environmental conditions of TC Kajiki at 0200 UTC 2 September 2019, including specific humidity (color shading; units: g kg?1), wind fields (black arrows; units: m s?1), and geopotential height (solid black lines; units: m) at 500, 700 and 850 hPa from the ERA5 dataset. The white boxes in (a?c) represent the area of the inner rainband system (shown in Fig. 4). (d) Sounding information of Haikou station at 0000 UTC 2 September 2019. The green and red solid lines represent the dewpoint temperature and temperature profiles, respectively. The black solid curve is the ascending path of a surface-based parcel.
To analyze the evolution of the rainband microphysical processes, the life of Kajiki’s rainband is separated into three stages according to the echo structure of the rainband: development (Stage 1, S1); mature (Stage 2, S2); and decay (Stage 3, S3). The distributions of ZH, ZDR and KDP at 0.5° elevation observed by the HK PRD of the three stages are shown in Fig. 4, where the black contours represent the convective area. The rainband is approximately 55 km away from the eye of TC Kajiki, which can be considered a typical inner TC rainband (Wang, 2009; Houze, 2010).
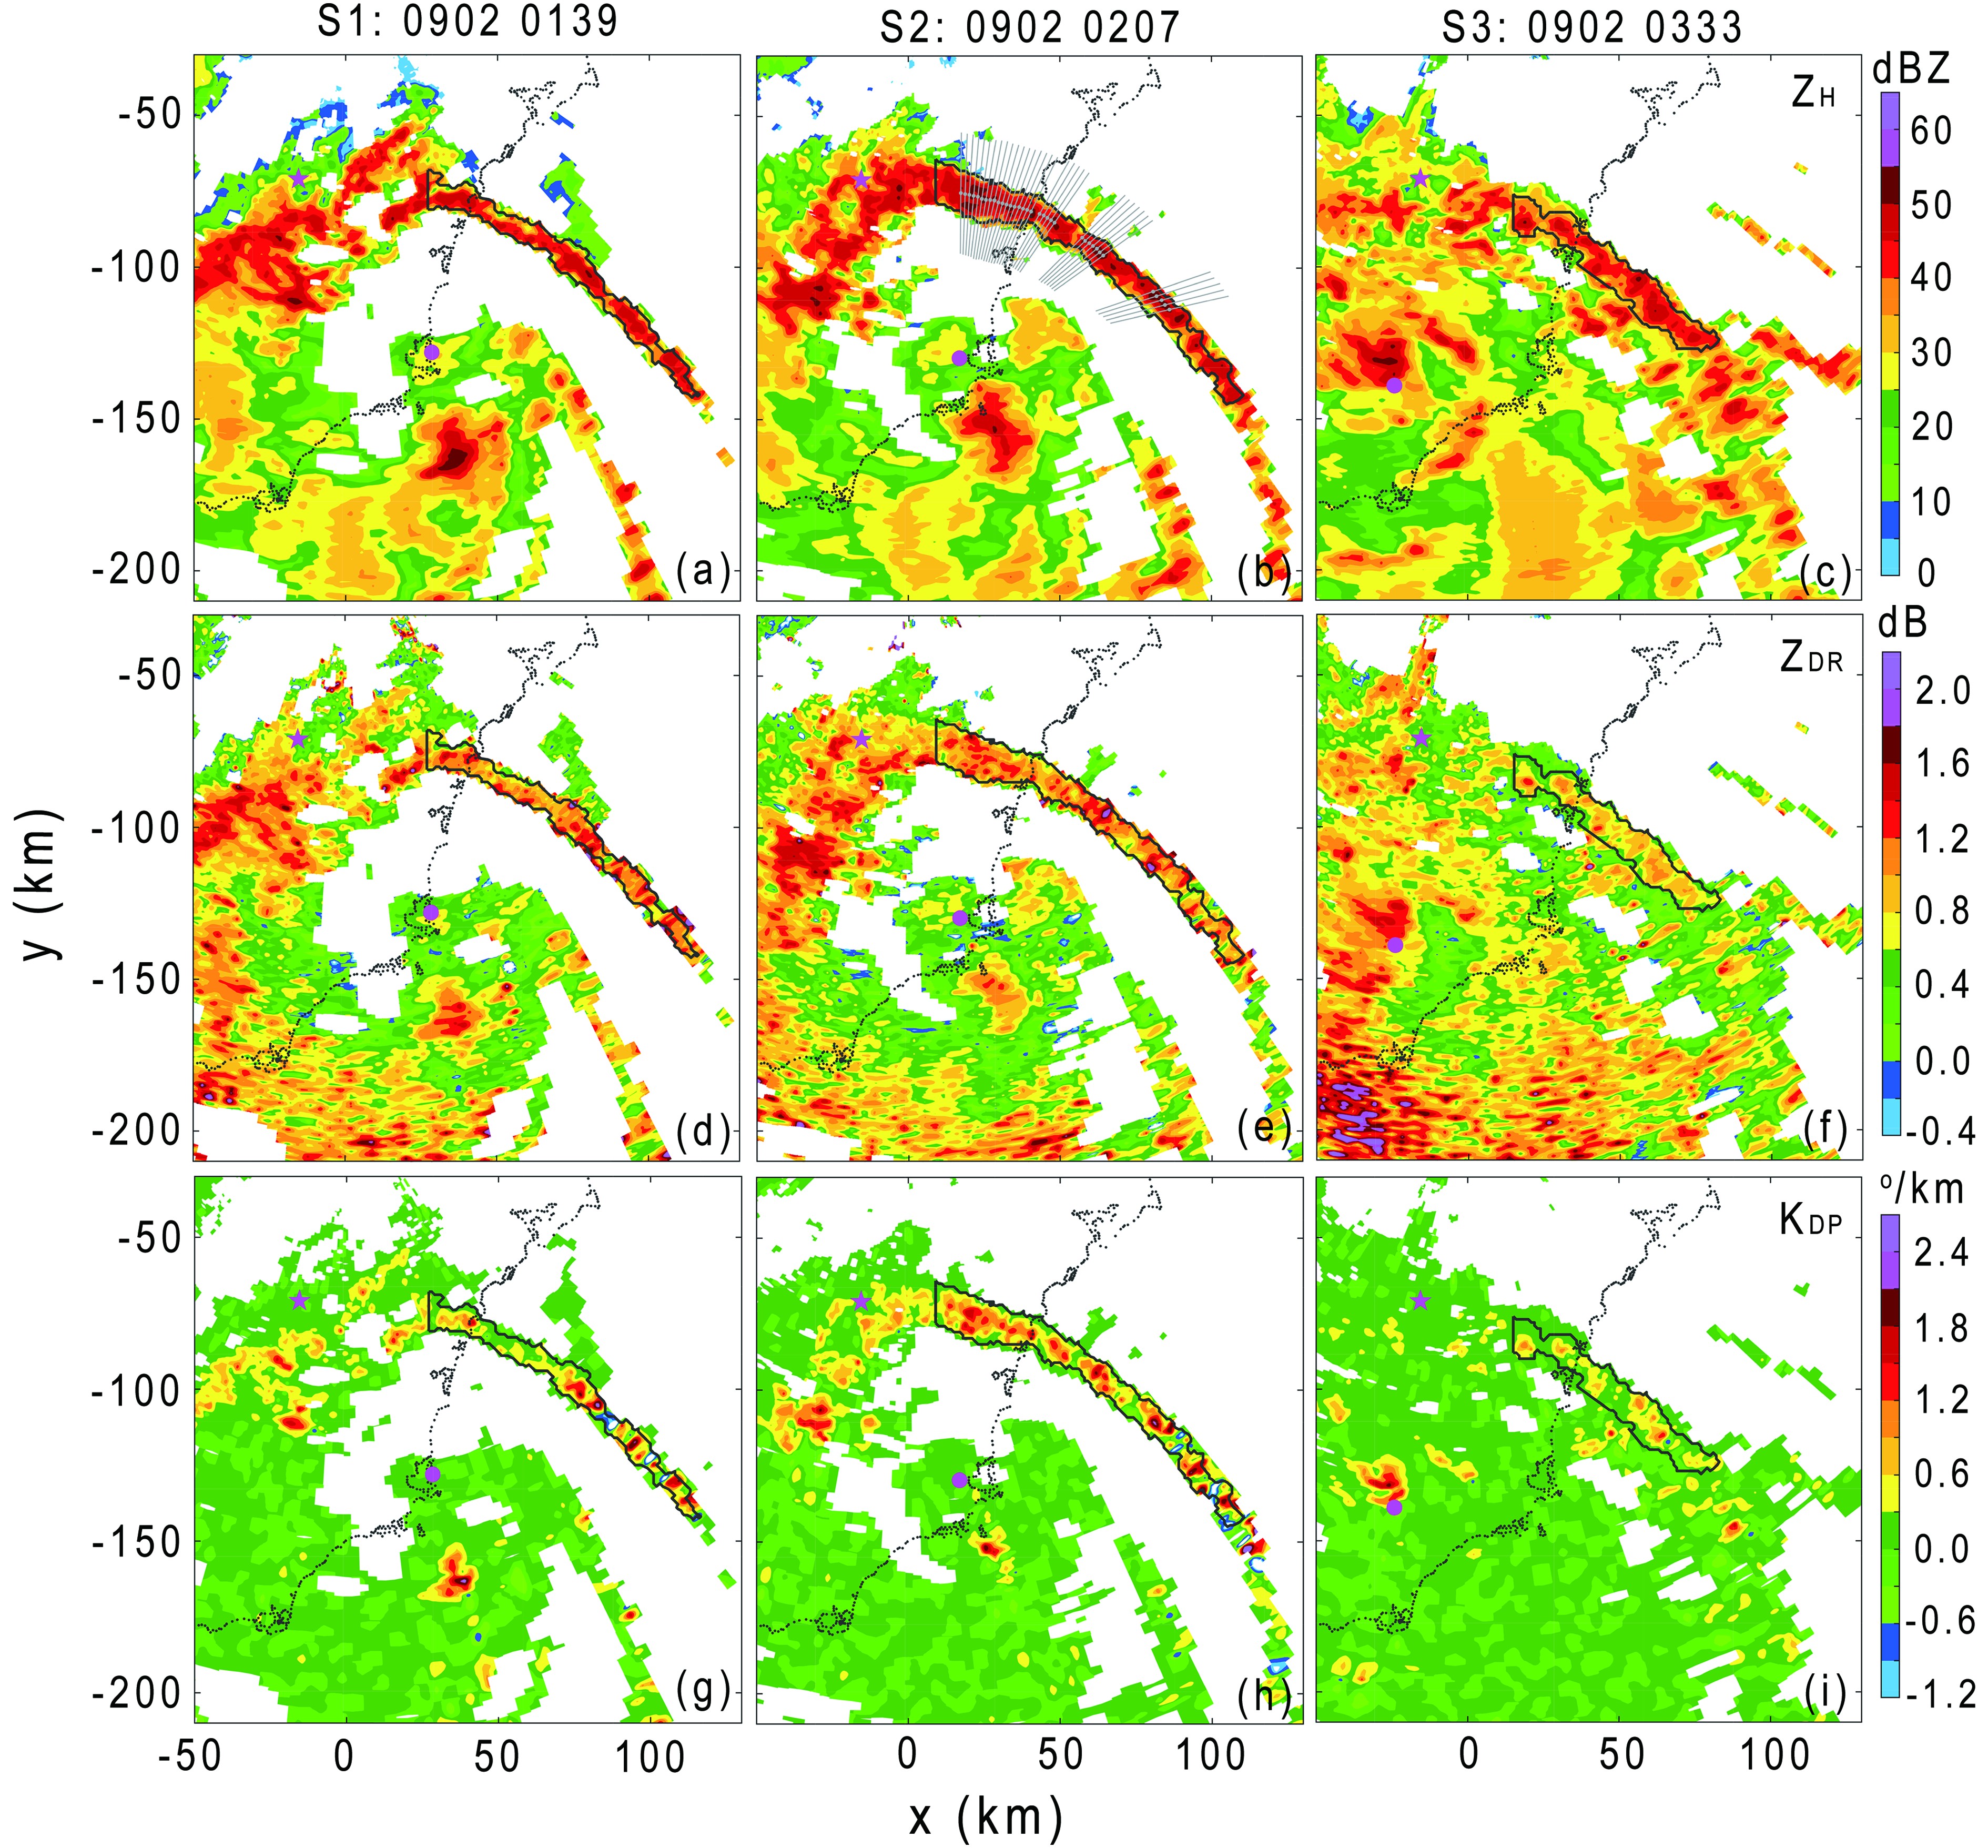 Figure4. The (a?c) ZH, (d?f) ZDR, and (g?i) KDP at 0.5° elevation observed by the Haikou PRD in three stages: 0139 UTC (S1, first column), 0207 UTC (S2, second column), and 0333 UTC (S3, third column) on 2 September 2019. The black contours represent the convective area, the purple dot is the location of the TC eye, the purple pentagram is the location of the 2DVD, and the gray lines in (b) are the locations of the cross sections described in Fig. 9. The coordinate of the Haikou PRD is (0, 0) and the negative values of x- and y-axis represent the west and south sides of the Haikou PRD.
The inner rainband emerges at 0116 UTC and gradually develops after 0139 UTC (Fig. 4a). At approximately 0207 UTC, the inner rainband is arranged in a spiral around TC Kajiki’s eye (Fig. 4b), which is at the mature stage. The inner rainband structure becomes fragmented after 0333 UTC (Fig. 4c), which is at the decay stage. There is usually a large stratiform area near the inner rainband away from the TC eyewall (Yu and Tsai, 2012), but Kajiki’s inner rainband does not have such a stratiform area, which may be related to the weak strength of Kajiki and lack of dense cloud cover. The convective area is arranged linearly during S2, which is similar to the horizontal structure of a squall line at midlatitudes (Wen et al., 2017).
2
3.3. Microphysical structure and the dominant processes of the rainband
The CFAD is a classic method for analysis of precipitation structure (Yuter and Houze, 1995), and has been widely used in analyzing the vertical structure of squall lines, mesoscale convective systems, and TC rainbands (Hence and Houze, 2011; Wu et al., 2018a, b). To investigate the vertical structure of the inner rainband of TC Kajiki, the CFAD distribution normalized by the maximum occurrence frequency of ZH (Figs. 5a-c), ZDR (Figs. 5e-g), and KDP (Figs. 5i-k) during the three stages of the rainband are shown in Fig. 5. The height of the 30-dBZ echo top is often related to the intensity of rainfall (DeMott and Rutledge, 1998).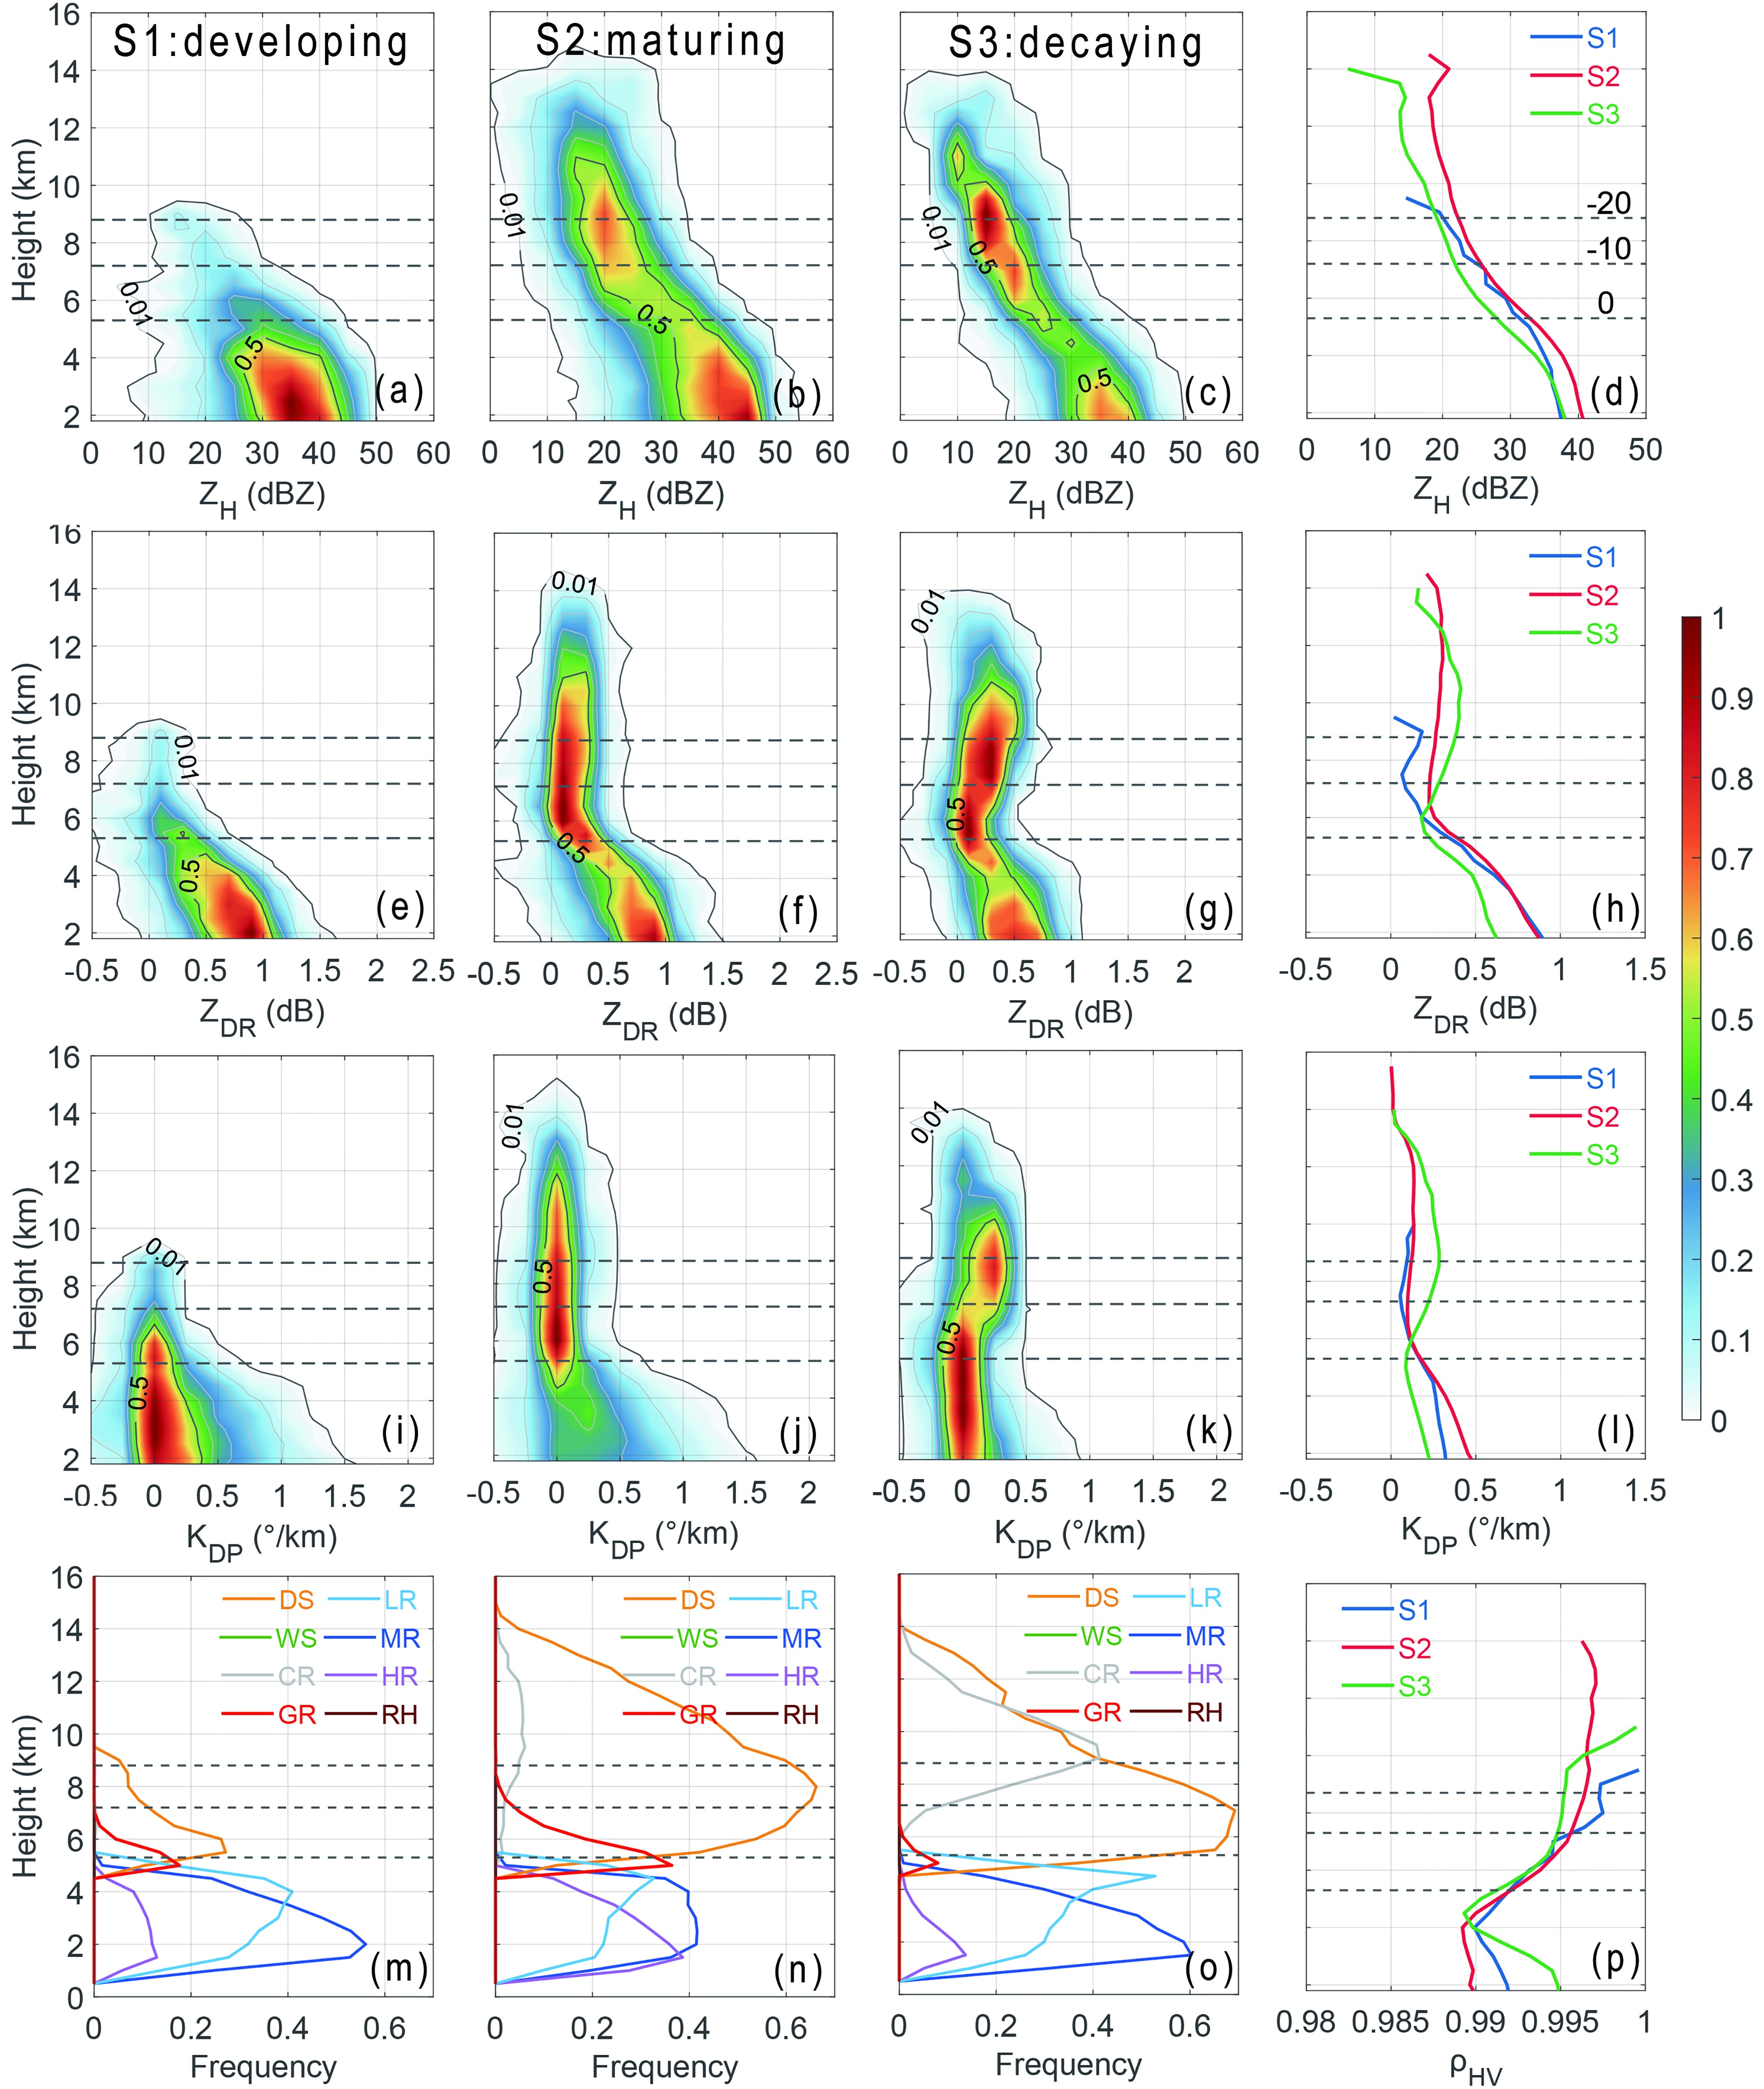 Figure5. (a?c) CFADs (contours represent the frequency of occurrence relative to maximum absolute frequency) of ZH in the convective area during the three stages of development (S1), maturity (S2), and decay (S3). The solid gray line in (a) represents the contours of the 0.01 and 0.5 occurrence frequencies. (d) Average profiles of ZH from the three stages. (e?h, i?l) As in (a?d) but for ZDR and KDP. (m?o) Frequency of each hydrometeor class changing with height during the three stages (DS, dry snow; LR, light rain; WS, wet snow; MR, moderate rain; CR, ice crystals; HR, heavy rain; GR, graupel; RH, rain and hail). (p) Average profiles of ρHV from the three stages. The three dotted lines are the heights of 0°C ?10°C and 20°C.
During S1, the 0.1 occurrence frequency of 30 dBZ extends 7 km (Fig. 5a). The ZH at 2 km is concentrated between 30 and 42 dBZ (Fig. 5a), which is close to S3 and smaller than S2. The ZDR below the freezing level (Fig. 5e) is higher than that of S3 and close to that of S2, which indicates a higher mean raindrop diameter during the developing and mature stages. Below the freezing level, the ZDR is close to that of S2 (Fig. 5h), and the KDP is lower than that of S2 (Fig. 5l), indicating a similar mean raindrop size and low raindrop concentration compared to S2.
During S2, the peak height of 30 dBZ rises significantly, the 0.1 occurrence frequency extends to 9 km, the 30-dBZ echo height reaches a maximum of 12 km, and the ZH and KDP below the freezing level become larger, suggesting a stronger rainfall intensity. The ZDR under the freezing level is mainly between 0.5 and 1 dB, which changes little compared with S1. The main changes in ZDR and KDP from S1 to S2 are distributed above the freezing level: the 0.5 occurrence frequencies of ZDR and KDP become significantly wider (Figs. 5f and j). This is because there is greater scatter above the freezing level, which means deeper convection and more abundant ice particles accordingly.
During S3, ZH is obviously weakened, and the 0.1 occurrence frequency of 30 dBZ is reduced to approximately 6 km. At the same time, the ZDR below the freezing level is significantly decreased, which is distributed at approximately 0.5 dB (Fig. 5g), indicating that the average diameter of raindrops decreases. However, the ZDR and KDP above the freezing level are obviously increased (Figs. 5g and k), which is related to the transformation of the dominant ice process from riming to aggregation (Moisseev et al., 2015; Li et al., 2018).
To examine the evolution of the microphysical processes, the vertical mean profiles of ZH (Fig. 5d), ZDR (Fig. 5h), KDP (Fig. 5l) and ρHV (Fig. 5p) of the three stages of the inner rainband are shown in Fig. 5. The occurrence frequency of each particle type is also shown, in Figs. 5m-o. The frequency at each height during each stage is the ratio of the number of specific hydrometeor types to the sum of convective grid points. For example, during S2, if 50 graupels are identified at 5.5 km and 100 convective grids are identified at 2 km using ZH, then the occurrence frequency for graupel at that height is 50 / 100 = 0.5.
Dry snow and graupel are the dominant hydrometeor types during S1 (Fig. 5m), and with the development of the inner rainband, dry snow and graupel are obviously more widely distributed during S2 (Fig. 5n) with increases in ZH (Fig. 5d), ZDR (Fig. 5h) and KDP (Fig. 5l), which indicates that the ice processes are more active. During S3, the occurrence frequency of graupel decreases sharply, and dry snow and ice crystals are dominant above the freezing level (Fig. 5o). By comparing the PRD variables during S2 and S3, the dominant ice processes are obviously different. During S2, ZH is higher, while ZDR and KDP are significantly lower compared with S3, which is related to the heavily rimed processes, because particles tend to be round as riming continues (Li et al., 2018). In addition, the proportion of graupel increases significantly (Fig. 5n), also suggesting an active riming process during S2.
During S3, the ZH above the freezing level is significantly lower than that of S2, while ZDR and KDP are higher. Above ?20°C, ZDR and KDP gradually increase with decreasing height, which is an indicator of the crystal growth zone (Moisseev et al., 2015), and it can be further verified from the classification result of hydrometeor types (Fig. 5o), which shows that ice crystals increase as height decreases. The ZDR peak is clearly above the ?20°C level, while the KDP peak is approximately at the ?20°C level. The peak value height of KDP appears to be slightly lower than that of ZDR (Figs. 5h and l). The vertical offsetting from one another is related to the conversion of the crystal growth zone to the aggregation growth zone (Andri? et al., 2012; Moisseev et al., 2015). As the pristine crystals begin to aggregate, ZDR will decrease because low-density aggregates will start masking the contribution of crystals (Moisseev et al., 2015). ZH increases and KDP decreases because the particles become larger but less dense (Li et al., 2020a). However, at the beginning of aggregation, many early aggregates are formed, which are still oblate particles and will offset the decreasing impact of low concentration results of aggregation (Moisseev et al., 2015). In addition, the proportion of dry snow increases significantly (Fig. 5o), indicating an active aggregation process during S3.
The above analysis uses three typical stages of the inner rainband of TC Kajiki. To obtain a comprehensive understanding of the rainband’s life cycle, time series of the averaged profiles of ZH, ZDR and KDP are shown in Fig. 6 (first row). The results show that the three stages described above represent the typical stage of the rainband well, which reaches development at S1, maturity near S2, and decay after S3. During the decay stage of the rainband, the growth of ZDR and KDP at approximately ?20°C can be seen (Figs. 6b and c), which is consistent with the result of Fig. 6. The relative magnitudes of IWC and LWC retrieved from PRD can be used to measure the contribution of the ice-phase process and warm-rain process to precipitation formation (Wang et al., 2016; Wen et al., 2017; Wu et al., 2018b).
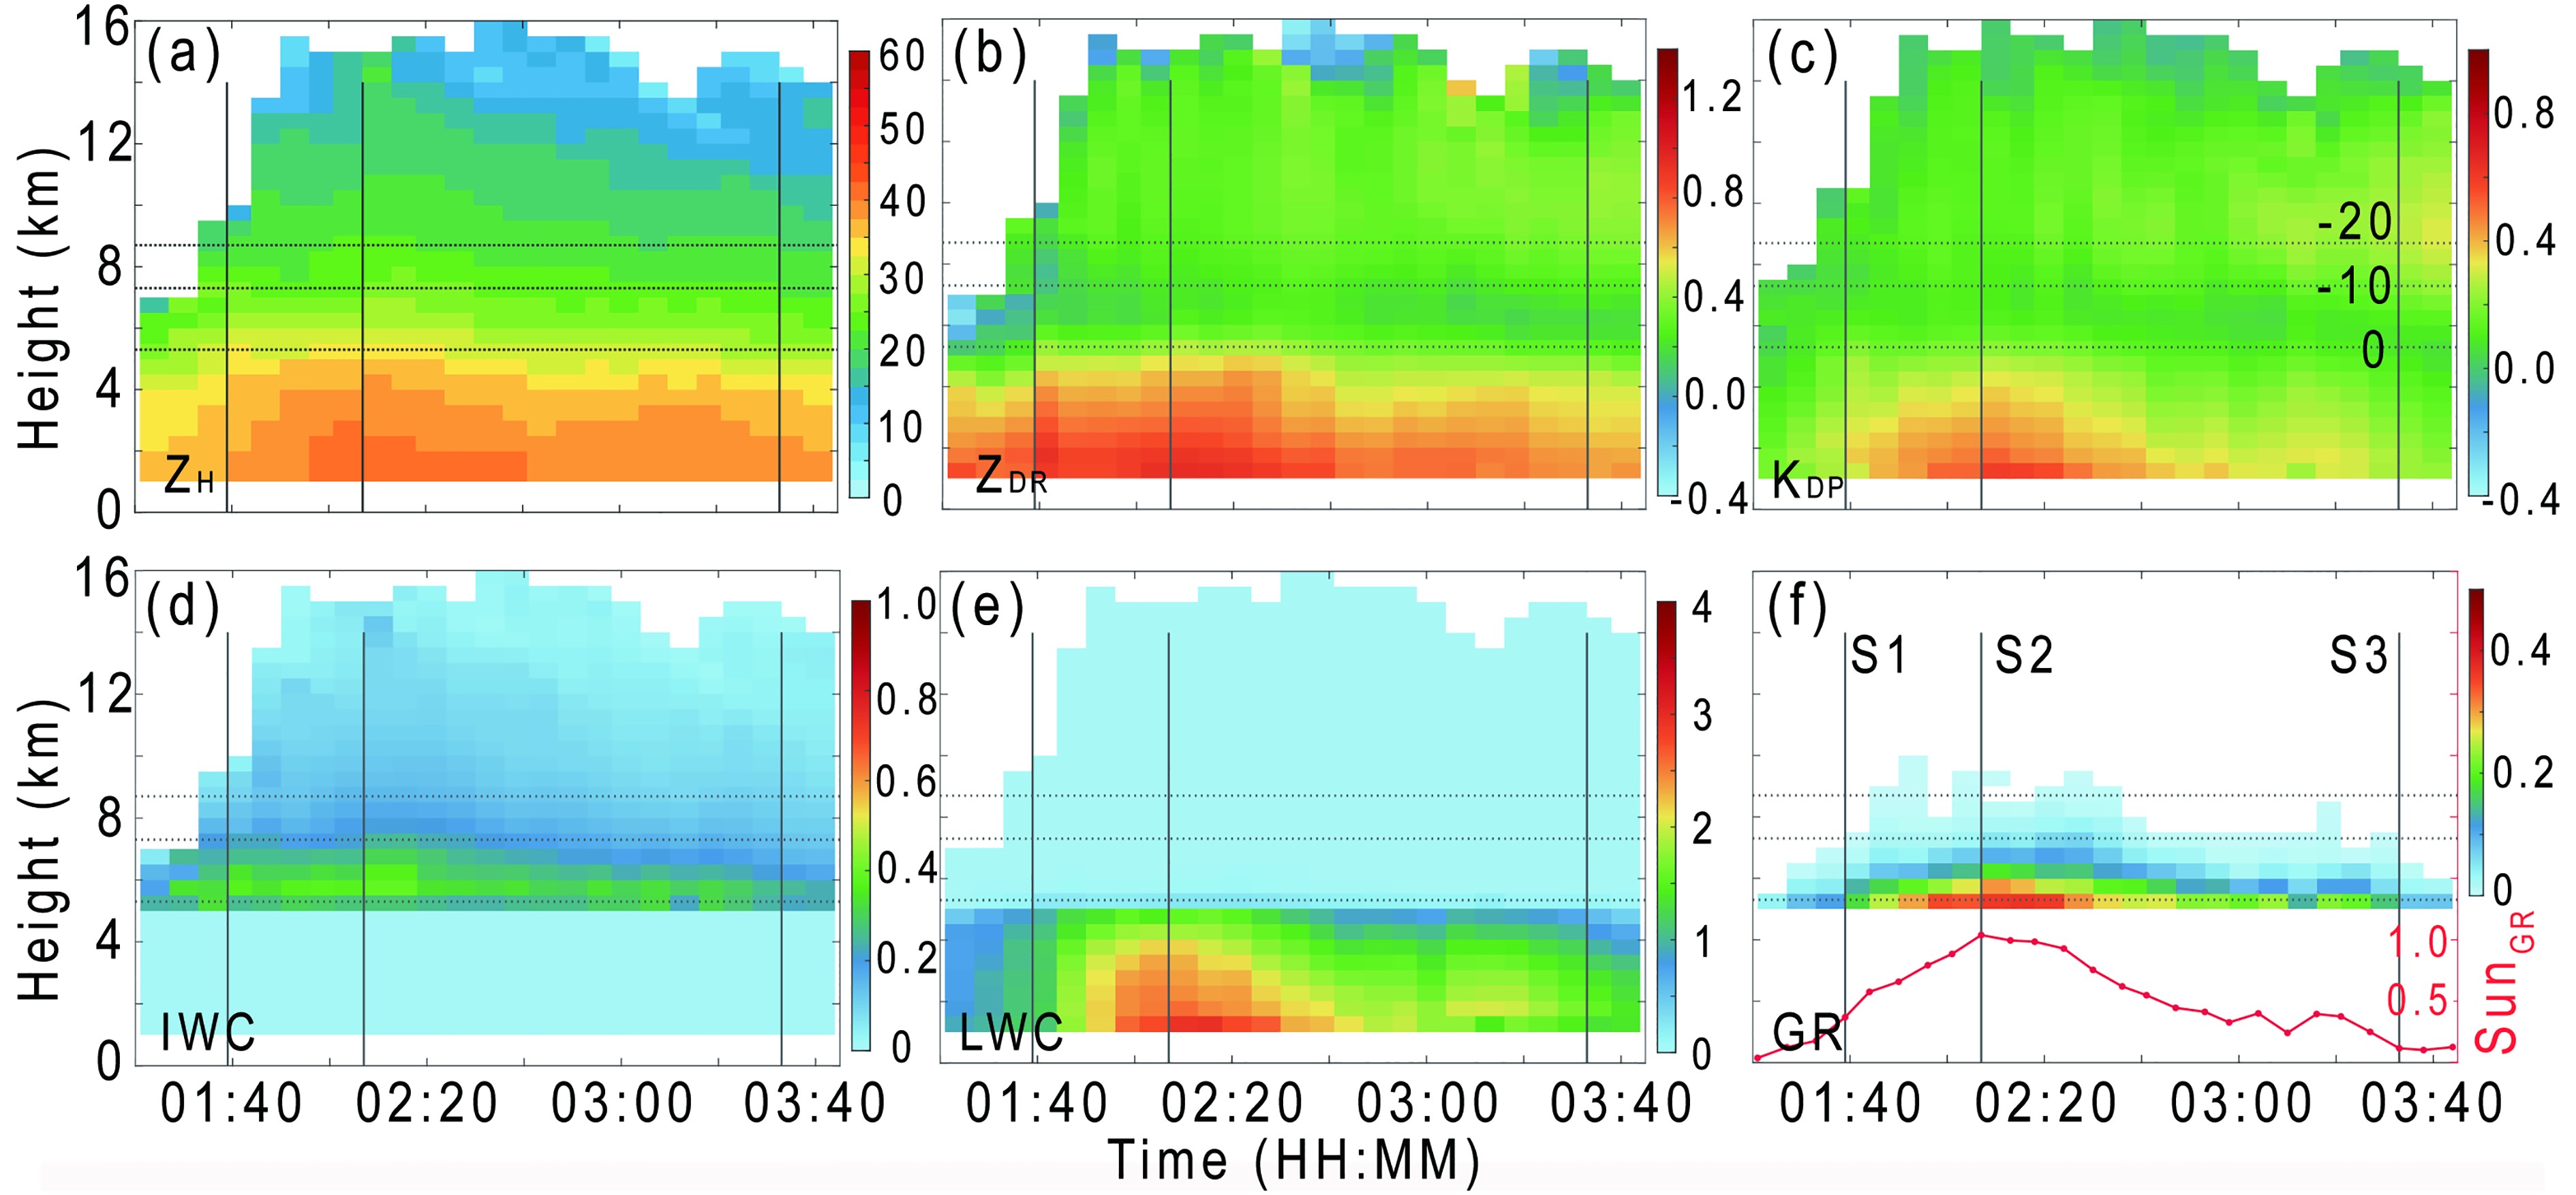 Figure6. (a) Time series of average profiles of ZH, where the three gray solid lines represent the three stages of development (S1), maturity (S2), and decay (S3). (b?e) As in (a) but for ZDR, KDP, IWC and LWC, respectively. (f) Occurrence frequency of graupel (color shading) changing with height during the life of the inner rainband. The red line is the sum of the frequencies at all heights.
The evolution of the average profile of IWC and LWC during the life of the rainband is shown in Figs. 6d and e. With the development of the rainband, the IWC and LWC both gradually increase and reach peak values near S2. In addition, the LWC increases rapidly towards the ground, and the maximum IWC near the freezing level at S2 is approximately 0.4 g m?3, while the LWC near the surface layer is approximately 3 g m?3 (approximately 7.5 times higher than the IWC), which suggests that heavy rainfall is mainly produced by warm-rain processes. Wu et al. (2018b) found that the content of graupel in the inner rainband is very low compared with the outer rainband in TC Nida (2016). However, the content of graupel during the development and mature stages in the inner rainband of Kajiki is very high (Figs. 5m-o, Fig. 6f), and the peak value reaches approximately 0.4, which indicates that nearly 40% of the convective area is covered by graupel, so the effect of graupel on the precipitation below should be considered.
It is helpful to diagnose the potential ongoing microphysical processes from the changes in ZH and ZDR between different heights (Fig. 7a) (Kumjian and Ryzhkov, 2010, 2012; Kumjian and Prat, 2014). In addition, the combination of LWC and ZDR (Fig. 7d) can further distinguish accretion and autoconversion processes (Wang et al., 2018). Figure 7 shows the modal distribution [frequency greater than 50% (Hence and Houze, 2011)] and mean values (cross points) of ΔZDR-ΔZH and ΔZDR-ΔLWC during S1?S3 at 4?3 km (blue) and 3?2 km (red). The modal distributions of ΔZDR-ΔZH and ΔZDR-ΔLWC are mostly distributed in the first quadrant (Fig. 7), and all the mean values are located in the first quadrant, which indicates that accretion and coalescence are dominant during the life of the inner rainband of Kajiki. In addition, the changes in the mean values of ΔZDR-ΔZH and ΔZDR-ΔLWC aloft are higher than those at low levels, suggesting a more active accretion aloft, which can also be seen in the model simulation results of Wang et al. (2020), who found that the mass content transfer rates of accretion are the highest near the freezing level and gradually decrease with decreasing height. The modal distributions of ΔZDR-ΔZH and ΔZDR-ΔLWC during S1 and S2 are obviously wider than that of S3, indicating that the rainband has a stronger warm-rain process in the development and mature stages.
 Figure7. (a) Joint frequency distribution of ΔZDR-ΔZH during development normalized by the maximum frequency in each region (only the 50% contour lines are shown). The blue (red) color represents the changes from 4 km to 3 km (3 km to 2 km), and the cross point is the location of the mean value. (b, c) As in (a) but for the mature and decay stages. (d?f) As in (a?c) but for ΔZDR-ΔLWC.
The DSDs can directly reflect rain-forming physical processes. Rosenfeld and Ulbrich (2003) analyzed the impact of coalescence, breakup, coalescence and breakup combined, accretion, evaporation, and size sorting (acting alone) on the DSD (in their Fig. 3). Although there is often more than one microphysical process in reality, it provides insight into the various processes of natural DSDs. Figure 8 shows the three parameters of the gamma DSD model retrieved by the constrained gamma model. The intercept, shape, and slope parameter both decrease with decreasing height (Fig. 8, columns 1?3). From 4 km to 2 km, Dm gradually increases during S1?S3, and the DSD spectral width broadens, reflecting the coalescence process.
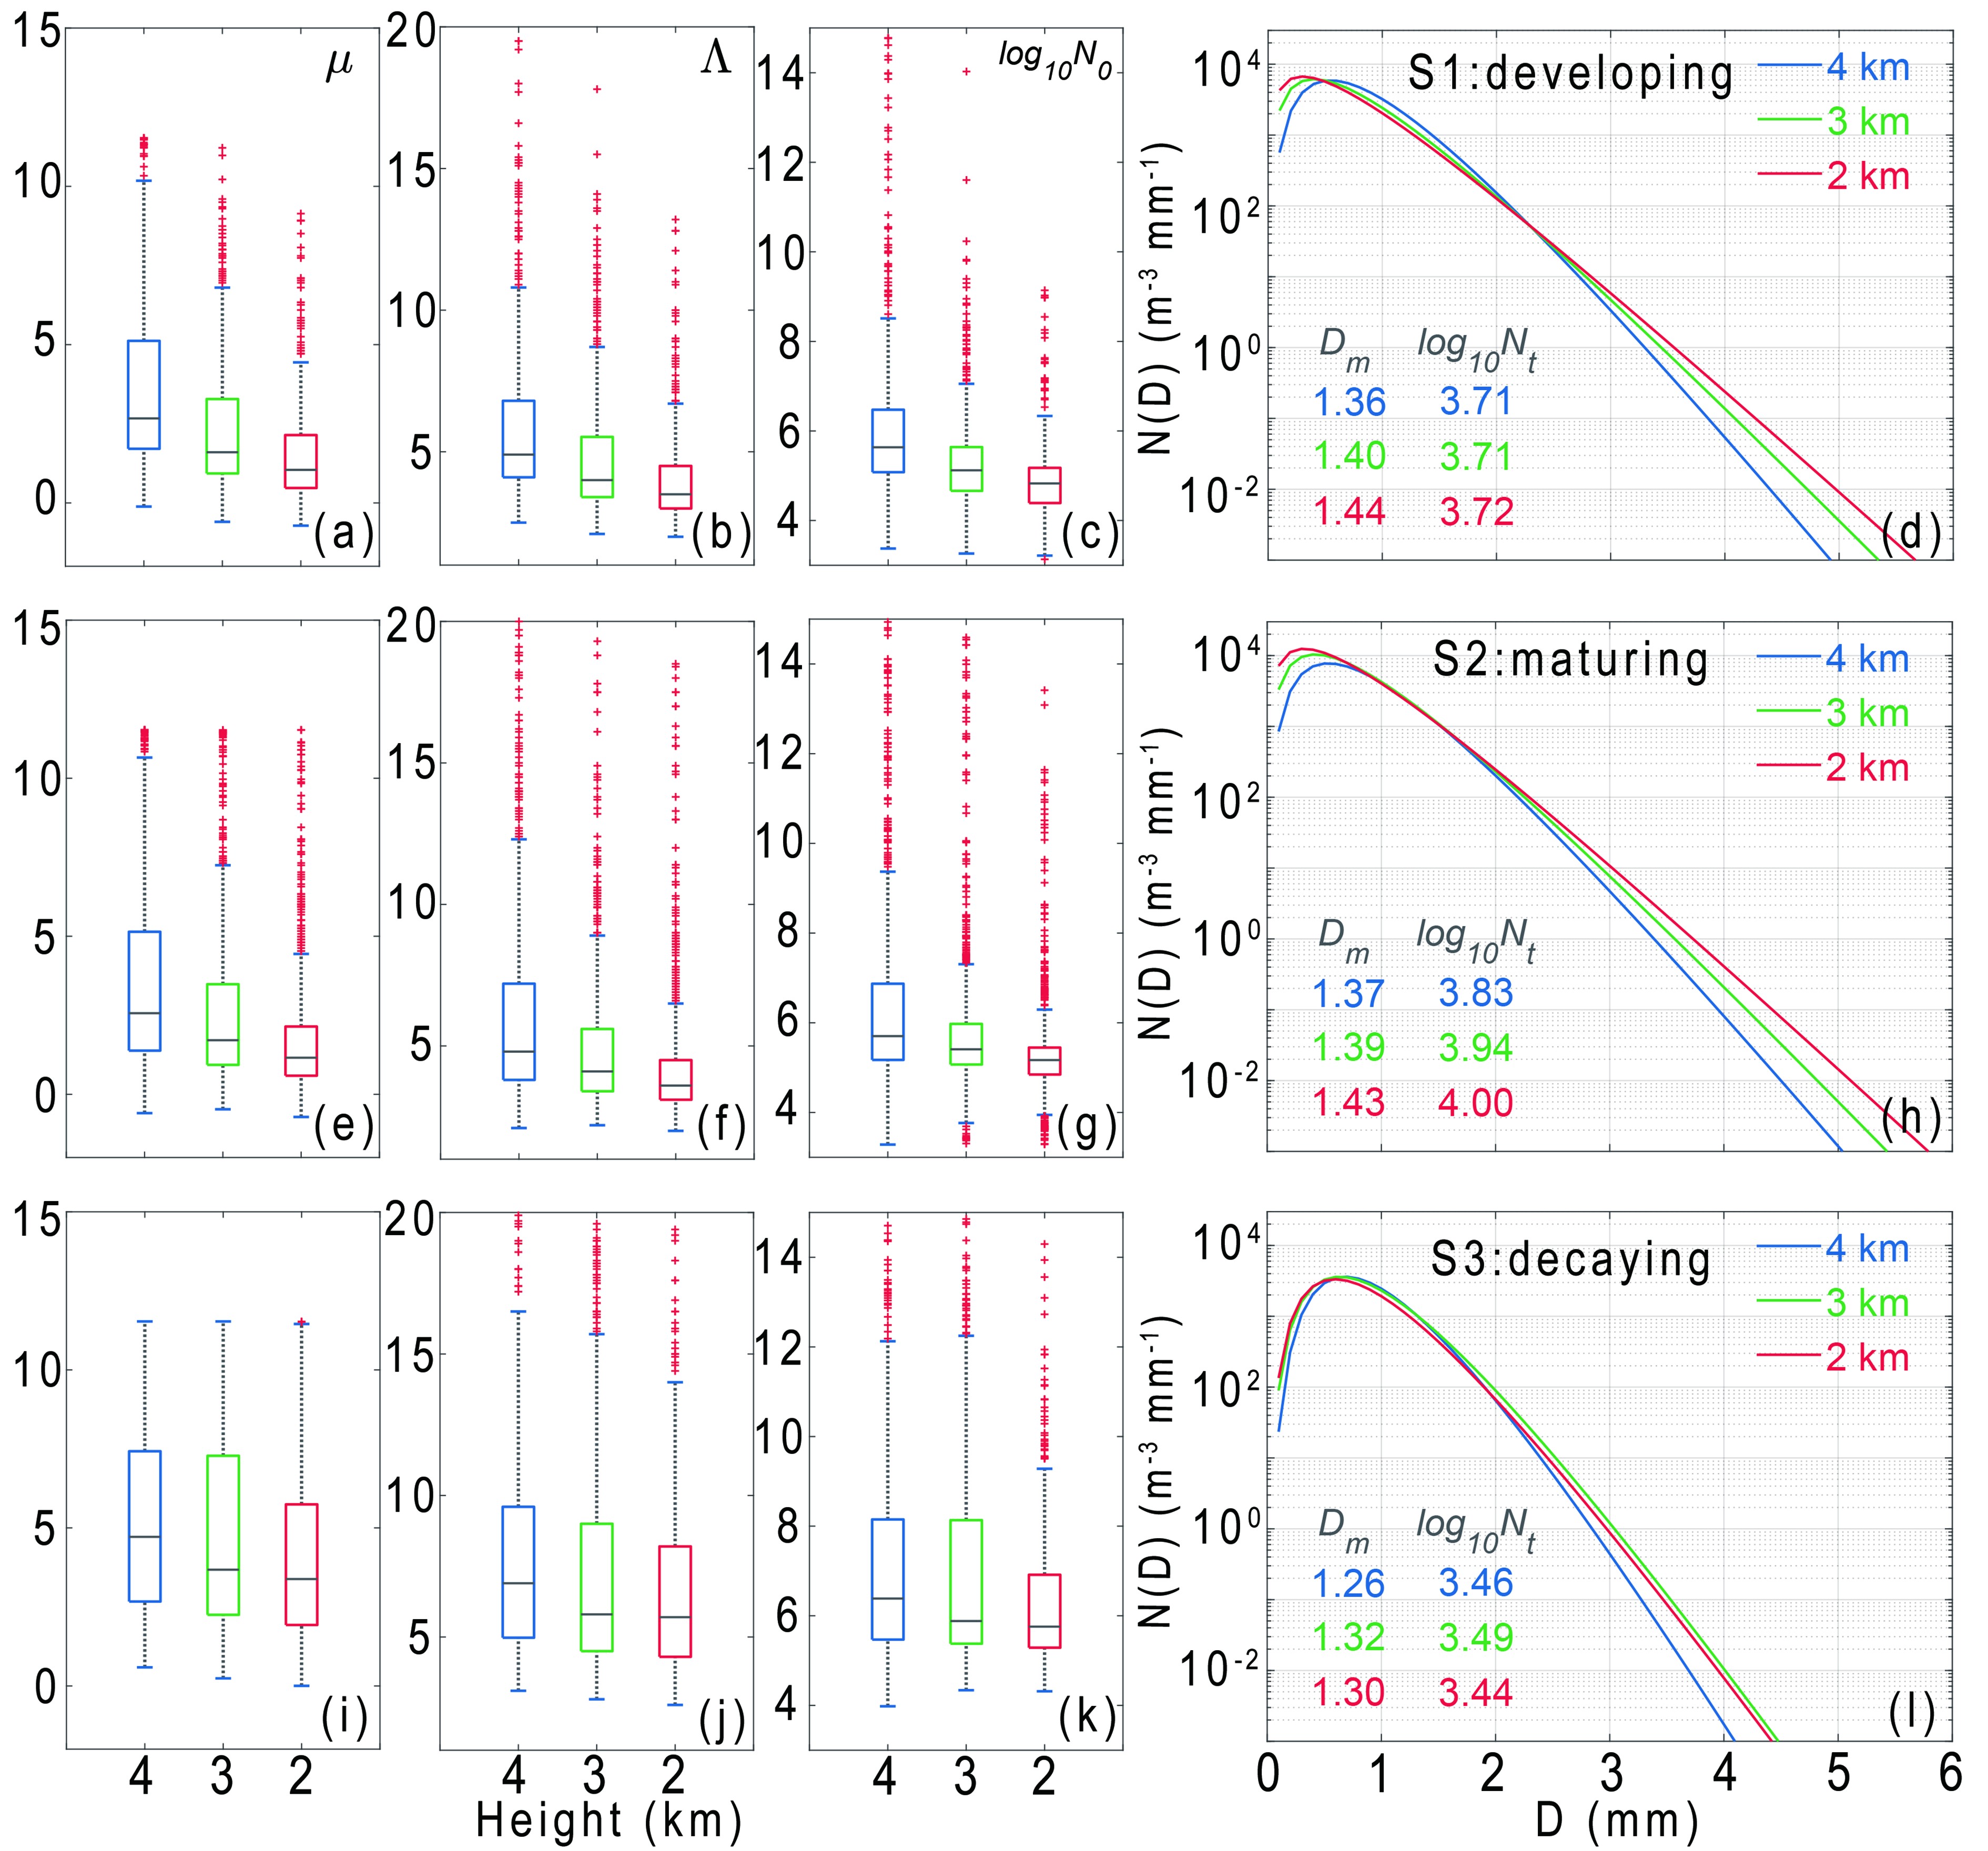 Figure8. (a?c) Boxplots of lgN0, μ and Λ at 4 km (blue), 3 km (green) and 2 km (red) during S1. (d) DSD at 4 km (blue), 3 km (green) and 2 km (red) during S1, with the Dm and Nt shown in the lower-left corner. (e?h, i?l) As in (a?e) but for the mature and decay stages.
During S1, the DSD changes from 4 km to 2 km show that the concentrations of the medium (0.5?2.2 mm) raindrops decrease while the small (< 0.5 mm) and big (> 2.2 mm) raindrops increase (Fig. 8d). In the developing stage of convective cells, updrafts often exist (Wang et al., 2018), which can transport medium and small raindrops upward. Besides, coalescence may occur when the raindrops fall, causing a bin transfer from medium to large raindrops. The above two reasons can lead to a decrease in the concentration of medium raindrops at a low level.
The increase in the concentrations of small and large raindrops is related to the autoconversion and accretion processes. That is, the conversion of cloud droplets to raindrops increases the concentration of small raindrops, and at the same time some small particles are collected by large raindrops, indicating the accretion and coalescence processes (Rosenfeld and Ulbrich, 2003), which is consistent with the conclusion from Figs. 7a and d.
During S2, as height decreases, Dm increases from 1.37 to 1.43 mm, and the concentration of both small and large particles increases (Fig. 8h), which embodies the processes of autoconversion and accretion as claimed in S1. The DSD during S3 (Fig. 8l) changes significantly (a smaller Dm and DSD spectral width) compared with S1 and S2, and DSD does not change much as the height decreases, indicating that the size of raindrops tends to be uniform during rainband decay, which is in agreement with the smaller ZDR (Fig. 5h) and larger ρHV (Fig. 5p).
The formation of large raindrops below the freezing level is mainly affected by the melting of dry snow (Fig. 5o) during S3, but graupel during S2. The obvious change in DSD between S2 and S3 at the 4-km level (Fig. 8h, l) indicates that the initial DSD below the freezing level can be affected by the ice-phase particles above. Wang et al. (2018) found that the heavy rainfall in the updraft region is mainly contributed by the warm-rain process, while outside the updraft region the melting of graupel mainly produces heavy precipitation. The inner rainband usually tilts away from the center of the TC, affected by the wind field in the TC environment (Yu and Tsai, 2012), and graupel usually appears on the downwind side near the freezing level (Wang et al., 2018), indicating that the two heavy rainfall formation mechanisms often work separately.
To better understand the vertical structure of the inner rainband, the average of all vertical cross sections (gray line in Fig. 4b) during S2 are shown in Fig. 9. Judging from the average profiles of ZH, ZDR, and KDP (Figs. 9a-c), the tilt of the rainband is not obvious, and graupel exists almost totally above the heavy rainfall (Fig. 9d). The graupel distribution is different from that of the inner rainband of TC Matmo (2014) (Wang et al., 2018). The inner rainband studied by Wang et al. (2018) is located in the ~120?180-km region from the TC center, while it is ~40?80 km in this study. In addition, the strengths of Matmo (minimum sea level pressure: 992 hPa; maximum surface wind: 20 m s?1) and Kajiki (996 hPa, 15 m s?1) are also quite different. The difference in rainband location and storm strength will lead to the difference in the tilted structure of the rainband, and then affect the distribution of graupel. The vertical structure and hydrometeor type distribution of Kajiki’s inner rainband are similar to the squall line studied by Wen et al. (2017), but the intensity of the convection is lower. Therefore, although the formation of heavy rain is mainly contributed by the warm-rain process, due to the less tilted structure of the rainband, the influence of the melting of ice particles, such as graupel and snow above, is worth noting.
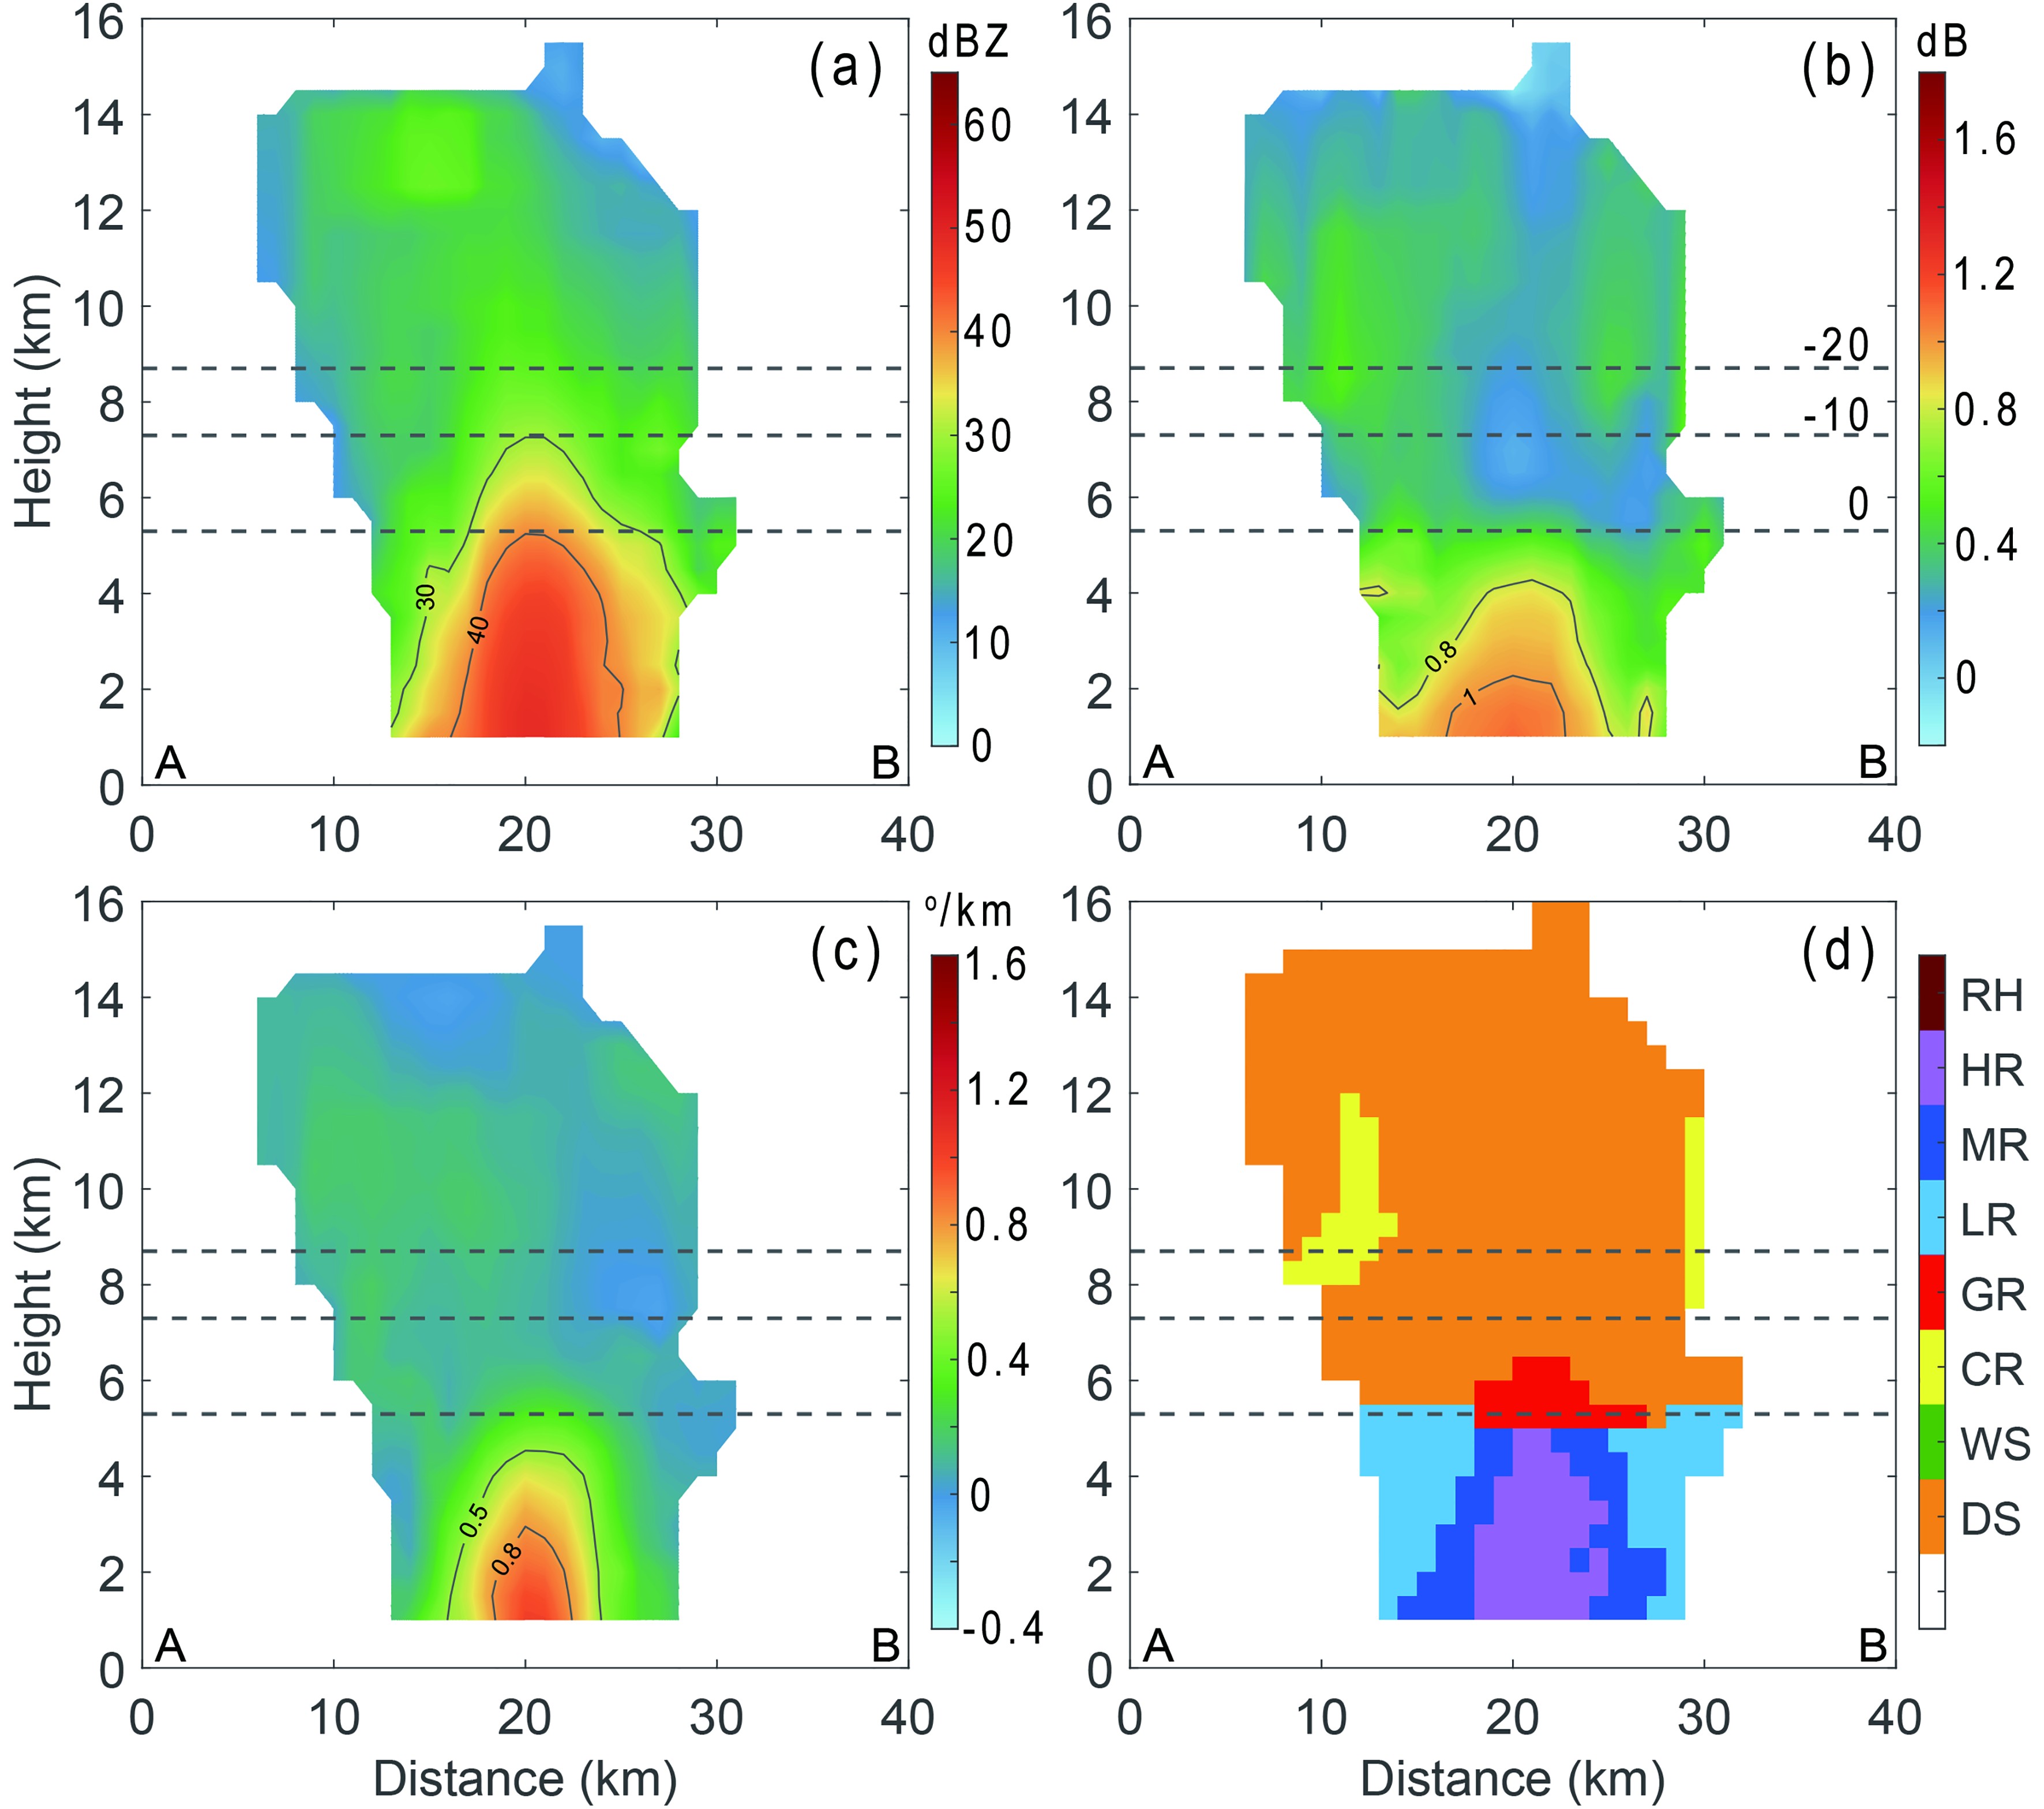 Figure9. Average vertical cross sections of (a) ZH, (b) ZDR and (c) KDP. The cross-sectional position is the solid gray line in Fig. 4b, and point A is on the side of the TC eye. (d) The most likely hydrometeor type among all cross sections (RH, rain and hail; HR, heavy rain; MR, moderate rain; LR, light rain; GR, graupel; CR, ice crystals; WS, wet snow; DS, dry snow).
To further analyze the effect of graupel on the DSD aloft, we select the mature stage of the rainband of Kajiki to study the region above the heavy rain with the effect of graupel and without graupel (non-graupel), separately. The classification of graupel versus non-graupel is based on having at least one graupel pixel in a column. Ultimately, 394 graupel and 143 non-graupel grid points above the heavy rain are identified. Figure 10 shows the DSD above the heavy rain and below the graupel (Fig. 10a) and non-graupel regions (Fig. 10b) during S2. As the height decreases, the Dm and the DSD spectral width gradually increase, indicating the coalescence process, and the concentration of all diameter bins increases (Figs. 10a and b), suggesting autoconversion and accretion processes. The DSD at 4 km, however, has a clear difference between the graupel and non-graupel regions.
 Figure10. The DSD above heavy rainfall at 4 km, 3 km and 2 km during S2: (a) region affected by graupel (394 grid points); (b) region not affected by graupel (143 grid points).
In the graupel region, the DSD spectral width is significantly wider and the concentration is higher compared with the non-graupel region, while the DSD spectral width is obviously narrower in the non-graupel region, which is close to the 4-km DSD shape of S3 (Fig. 8l). In the non-graupel region, the ice-phase particles above the freezing level are mainly dominated by dry snow generated by the aggregation process, which has a lower density compared with graupel generated by the riming process. The diameter of raindrops below the freezing level is usually very small, originating from the active autoconversion process, and begins to increase by the coalescence of other cloud drops or raindrops during the descent process. The generation of large raindrops near the freezing level usually comes from the melting of ice-phase particles above the freezing level.
Above the heavy rain region, the Dm and DSD spectral width at 4 km below the graupel region are significantly higher than those of the non-graupel area, which indicates that the melting of graupel produced by the riming process produces larger raindrops compared with dry snow produced by the aggregation process. Because the accretion efficiency is proportional to the size of raindrops (Brandes et al., 2006), the appearance of large raindrops melted by graupel will broaden the DSD spectral width aloft and enhance the coalescence and accretion of the warm-rain process, resulting in heavier rainfall.
In general, the LWC near the ground is much higher than the IWC near the freezing level, and the formation of heavy rain is mainly affected by the warm-rain process. The ice particles, such as graupel and dry snow, generated by the ice processes, will also play an important role in the warm-rain process by affecting the DSD aloft. Therefore, the two mechanisms of heavy rainfall reported by Wang et al. (2018) work together in the inner rainband of Kajiki. Compared with the dry snow, the melting of the graupel will produce larger raindrops, increase the DSD spectral width aloft, and enhance the warm wain process, such as accretion and coalescence, to form heavy rainfall.
The precipitation of TC Kajiki over the SCS is dominated by high concentrations of small and medium raindrops (D < 3 mm), which contribute approximately 98.3% to the total precipitation. The average Dm of convection is 1.49 mm, and the lgNw is 4.47, with obvious characteristics of maritime convection rainfall (Bringi et al., 2003). Compared with TCs in eastern China (Wang et al., 2016; Wen et al., 2018), the average diameter of raindrops is higher and the concentration is lower, which indicates that this TC over the SCS has different microphysical processes compared with those in other climatic regions.
The ice microphysical processes in the TC inner rainband have obvious differences in different stages. The graupel content correlates highly with the degree of rainband development. The riming process is more active as the inner rainband develops, and the graupel content increases gradually before reaching its maximum during the mature stage. The riming process is dominant during the mature stage, while during the decay stage the aggregation process is dominant.
The freezing level is ~5.3 km, with a high specific humidity (~16 g kg?1) near the ground, which is conducive to the development of warm-rain processes. The estimated vertical profiles of IWC and LWC and the distribution of ΔZDR-ΔZH and ΔZDR-ΔLWC show that heavy rainfall originates mainly through warm-rain processes, primarily from accretion and coalescence processes. In addition, the concentration of small raindrops also increases during the mature stage of the inner rainband, indicating that the autoconversion process is also important.
The inner rainband of Kajiki is more upright compared with that of the previous study of Wang et al. (2018). Although warm-rain processes, such as autoconversion, accretion and coalescence, play a critical role in the formation of heavy rainfall, the melting of ice particles also has an impact on the warm-rain processes. The formation of the DSD below the freezing level is closely related to the ice particles above. Above the heavy rain region, the DSD near the freezing level, with the effect of graupel, has a wider spectral width and higher Dm and Nt. Compared with the dry snow formed by aggregation, graupel melting will generate larger raindrops and broaden the DSD aloft, which can enhance the accretion and coalescence processes below the freezing level and promote the formation of heavy rainfall.
Recent NWP model and observation results show that there are complex potential connections between the ice and liquid processes (Brown et al., 2017; Li et al., 2020a), while the current study has difficulty quantitatively measuring the promotion of ice processes to warm rain processes. The next step is to further study the transformation of ice particles in the TC convection area near the freezing level to evaluate the effect of the melting of ice particles on the rainfall process below.
Acknowledgements. This work was primarily supported by the National Key Research and Development Program of China (Grant No. 2018YFC1507304) and the National Natural Science Foundation of China (Grant Nos. 42075080, 41975066 and 41865009). Datasets for this research are available at
