HTML
--> --> -->In the past three decades, considerable research on TC precipitation (TCP) has been conducted on both regional and global scales (Rodgers et al., 1994, 2000; Rodgers and Pierce, 1995; Corbosiero et al., 2009; Kubota and Wang, 2009; Khouakhi et al., 2017). Results show that the western North Pacific (WNP) is a site with large percentages of TCP contributions, ranked next to the eastern-central Pacific and South Indian Ocean (Jiang and Zipser, 2010), and that China is seriously affected by TCP. Ren et al. (2002, 2006) and Wang et al. (2007, 2008) adopted the Objective Synoptic Analysis Technique (OSAT) (Ren et al., 2001, 2007, 2011) to partition TCP from station observations and then examine the spatiotemporal characteristics of TCP over China. They found that TCP covers most of central?eastern China, and that it decreases gradually from the southeastern coastal regions to the northwestern mainland, with the downward trend of TCP due to the decrease in TC frequency.
Landfalling TC (LTC) precipitation (LTP) accounts for a large percentage of the total TCP amount. Previous studies indicate that LTP is closely related to complex topography, vertical wind shear, TC structure, and interaction between TCs and midlatitude traveling systems (e.g., Chen, 1977; Chen et al., 2004, 2010; Shi et al., 2009; Chen and Xu, 2017). For example, numerical simulations of Hurricane Bonnie (1998) by Rogers et al. (2003) and Zhu et al. (2004) showed that significant changes in vertical wind shear impact the precipitation distribution. Wu et al. (2013) pointed out that significant differences in LTP amount and distribution are primarily related to wind directions on the windward side of mountains due to LTC track differences. Typhoon Nina (1975), which caused extreme precipitation in Henan Province, is one of the most severe TC cases on record. Local topography (Ding et al., 1978) and the interaction between multiscale circulations and weather systems (Tao, 1980) appear to have played important roles in the generation of Nina’s extreme precipitation. Another extreme rain-producing LTC was Typhoon Morakot (2009), in which strong southwesterly moisture transport, coupled with local steep topography, was crucial to the occurrence of extreme precipitation (Ge et al., 2010; Hong et al., 2010; Chien and Kuo, 2011; Huang et al., 2011; Xie and Zhang, 2012; Yu and Cheng, 2013), and its slow propagation was another key factor (Lee et al., 2011; Yen et al., 2011; Wang et al., 2012).
Besides LTP, another kind of TCP over land is produced by TCs that do not make landfall. Two examples of extreme cases in this regard are Typhoons Flossie (1969) and Polly (1971), which produced daily precipitation in excess of 700 mm and 500 mm over northern Taiwan and over Weishan of Shandong Province, respectively. Ren et al. (2011) defined these TCs as “sideswiping” TCs (STCs), and Lei (2012) later categorized them into several different types. However, few studies have been conducted to examine the characteristics of STC precipitation (STP), despite its important contribution to TCP over land.
Thus, the major purpose of this study is to fill this knowledge gap by investigating the spatiotemporal variations and patterns of STCs and STP over China. The next section describes the data and methods employed in this study. Section 3 presents the main results from analyzing a 59-year (1960?2018) climatology of STC activity and associated STP, with a focus on the characteristics of extreme STP. A summary and concluding remarks are provided in section 4.
2.1. Data
The TC best-track data from 1960 to 2018 over the WNP from the Shanghai Typhoon Institute of the China Meteorological Administration (CMA) (The daily precipitation data, starting at 1200 UTC during 1960?2018 are from those archived by the CMA/National Meteorological Information Center. The dataset includes 2027 rain gauge stations, of which 2006 cover most of mainland China and 21 cover Taiwan Island.
The National Centers for Environmental Prediction?National Center for Atmospheric Research global reanalysis data with a 2.5° resolution (
2
2.2. Methods
As mentioned above, STCs in China are TCs that produce precipitation over the mainland or any of the two largest islands (i.e., Hainan and Taiwan) without making landfall on China’s coastline. An approximation method is used to describe the coastline of China (Ren et al., 2008), which involves replacing China’s coastline with an approximate line formed by 0.5° × 0.5° latitude?longitude grids, as shown by the black solid dots in Fig. 1a. Here, China’s coastline extends from Dandong of Liaoning Province in Northeast China to Dongxing of Guangxi Province in South China, plus the two largest islands. Distances of every STC from the coastline can be calculated between its observed central location and the coastline grids. Thus, we may define the minimum sideswiping distance (MSD) as the key metric, as shown as Fig. 1b, which is calculated by: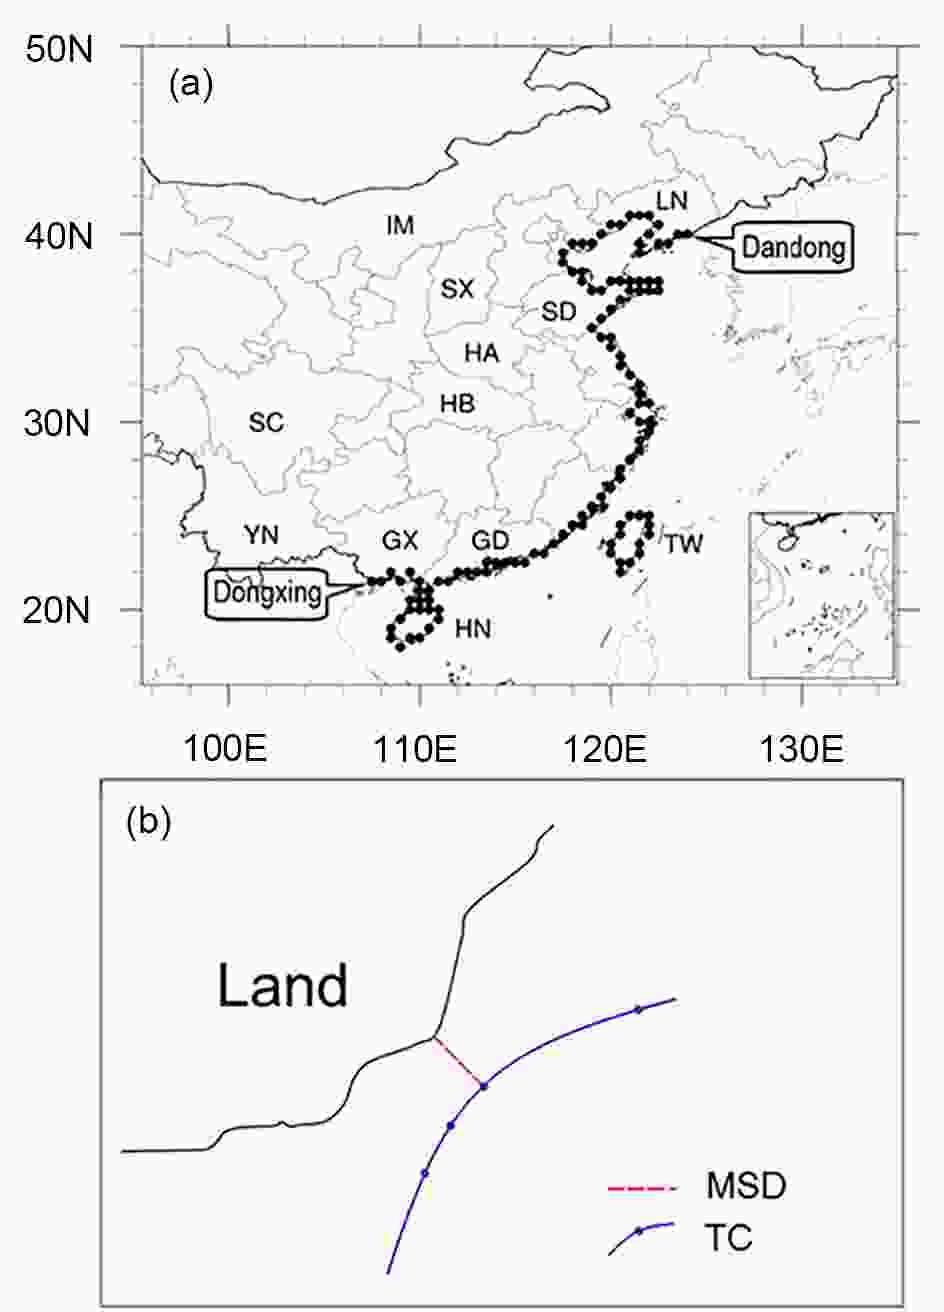 Figure1. Schematic diagram of (a) the distribution of China’s coastline approximated by latitude?longitude grids (black dots), and provincial names mentioned in the text: IM (Inner Mongolia), LN (Liaoning), Shandong (SD), SX (Shanxi), HA (Henan), HB (Hubei), SC (Sichuan), YN (Yunnan), GX (Guangxi), GD (Guangdong), Hainan (HN), and Taiwan (TW); and (b) the MSD (in red) between the coastline (in black) and TC track (in blue), with blue dots as the observed TC central locations at 6-h intervals.
where di,j represents the distances between coastline grids and STC central location, m is the number of coastline grids, and n is the number of TC observation locations.
Since the OSAT has been widely used to identify TC-related precipitation (Chang et al., 2012; Su et al., 2015; Luo et al., 2016; Jiang et al., 2018; Qiu et al., 2019; Jia et al., 2020), it is also adopted in this study. Based on the daily precipitation data, the STP data are partitioned with the OSAT of Ren et al. (2001, 2007, 2011), in which the distance from the TC center and the closeness and continuity between neighboring stations recording rain are used to trace TC-influenced rain belts that may extend from 500 to 1100 km away from the TC center. The method of Ren et al. (2006) is adopted to calculate the precipitation amount in terms of STP volume (units: km3). Currently, two different methods with arbitrary thresholds are commonly used to define extreme precipitation: one based on the actual rainfall amounts (e.g., 50 or 100 mm d?1), and the other based on the 95th or 99th percentile (Manton et al., 2001; Wang and Zhou, 2005; Zhai et al., 2005). However, some studies have explored alternative ways to define extreme precipitation (Xia et al., 2017; Jiang et al., 2018; Qiu et al., 2019), which include: (i) a station with maximum daily precipitation among all stations in a case; and (ii) a maximum daily precipitation of Pmax ≥ 50 mm. The second method is adopted in the present study when depicting extreme STP.
2
3.1. Characteristics of STC activities
During the 59-year period of 1960?2018, on average, there are 8.8 STCs affecting China per year. The interannual variation of STC frequency is given in Fig. 2a, showing a maximum frequency of 17 STCs in 1970, and a minimum frequency of 3 STCs in 2005, with pronounced fluctuations. As will be seen below, a higher (lower) frequency of STCs tends to produce more (less) STP, albeit not exactly due to their different intensities. Of interest is an apparent long-term downward trend at a rate of ?0.6 (10 yr)?1, which is statistically significant at a level of 0.05 according to the t-test (Thom and Thom, 1972). In contrast, there are 8.8 LTCs per year on average with a downward of ?0.3 (10 yr)?1, which does not pass the significance test, so the related figure is omitted. Both trends are consistent with the downward trend of China-impacting TCs found by Wang et al. (2007), which can be related to global warming (Liu et al., 2013). The China-impacting TCs are defined herein as TCs that produce precipitation over China, including both LTCs and STCs. Since the trend of STCs has a more negative value than that of LTCs for their same annual mean numbers, the downward trend of China-impacting TCs is mainly due to the decreasing STCs; their annual frequencies have a correlation coefficient of 0.16, albeit with no statistical significance. Nevertheless, STC occurrence is favored in 1964, 1970, 1978 and 1979 (Fig. 2a), whereas LTC occurrence is favored in 1980, 1981, 1994, 1995, 2001, 2008 and 2009. To investigate whether or not the above annual frequencies of STCs and LTCs are affected by climate variability, an analysis of their correlations with ENSO is performed. Results show that the correlation coefficients between ENSO and STC, STP, LTC and LTP are all negative, and only those for the frequencies of LTCs (?0.40) and STCs (?0.29) are of statistical significance at the 99% and 95% confidence levels, respectively. These results are consistent with those reported by Wang and Chan (2002), Chia and Ropelewski (2002), and Kim et al. (2011), showing that the number of TCs decreases (increases) in the northwestern quadrant in the WNP during the warm (cold) phase of ENSO. In addition, there is a downward trend, though with no statistical significance, in the ratio of STCs to China-impacting TCs (Fig. 2b), while the ratio of LTCs to China-impacting TCs shows an increasing trend. Figure 2c shows the seasonal variation of monthly STC frequency, indicating that the STC activity runs from June to November with a peak value of 1.9 in August. There are few STCs from January to March. These results are consistent with the monthly variations of TCs that develop over the WNP [cf. Fig. 2c herein and Fig. 5a in Zhang et al. (2018b)]. Figure2. Time series of STC frequency during 1960?2018: (a) annual variation of the mean frequency; (b) the ratio of STCs to China-impacting TCs; and (c) seasonal variation of the 59-year mean frequency.
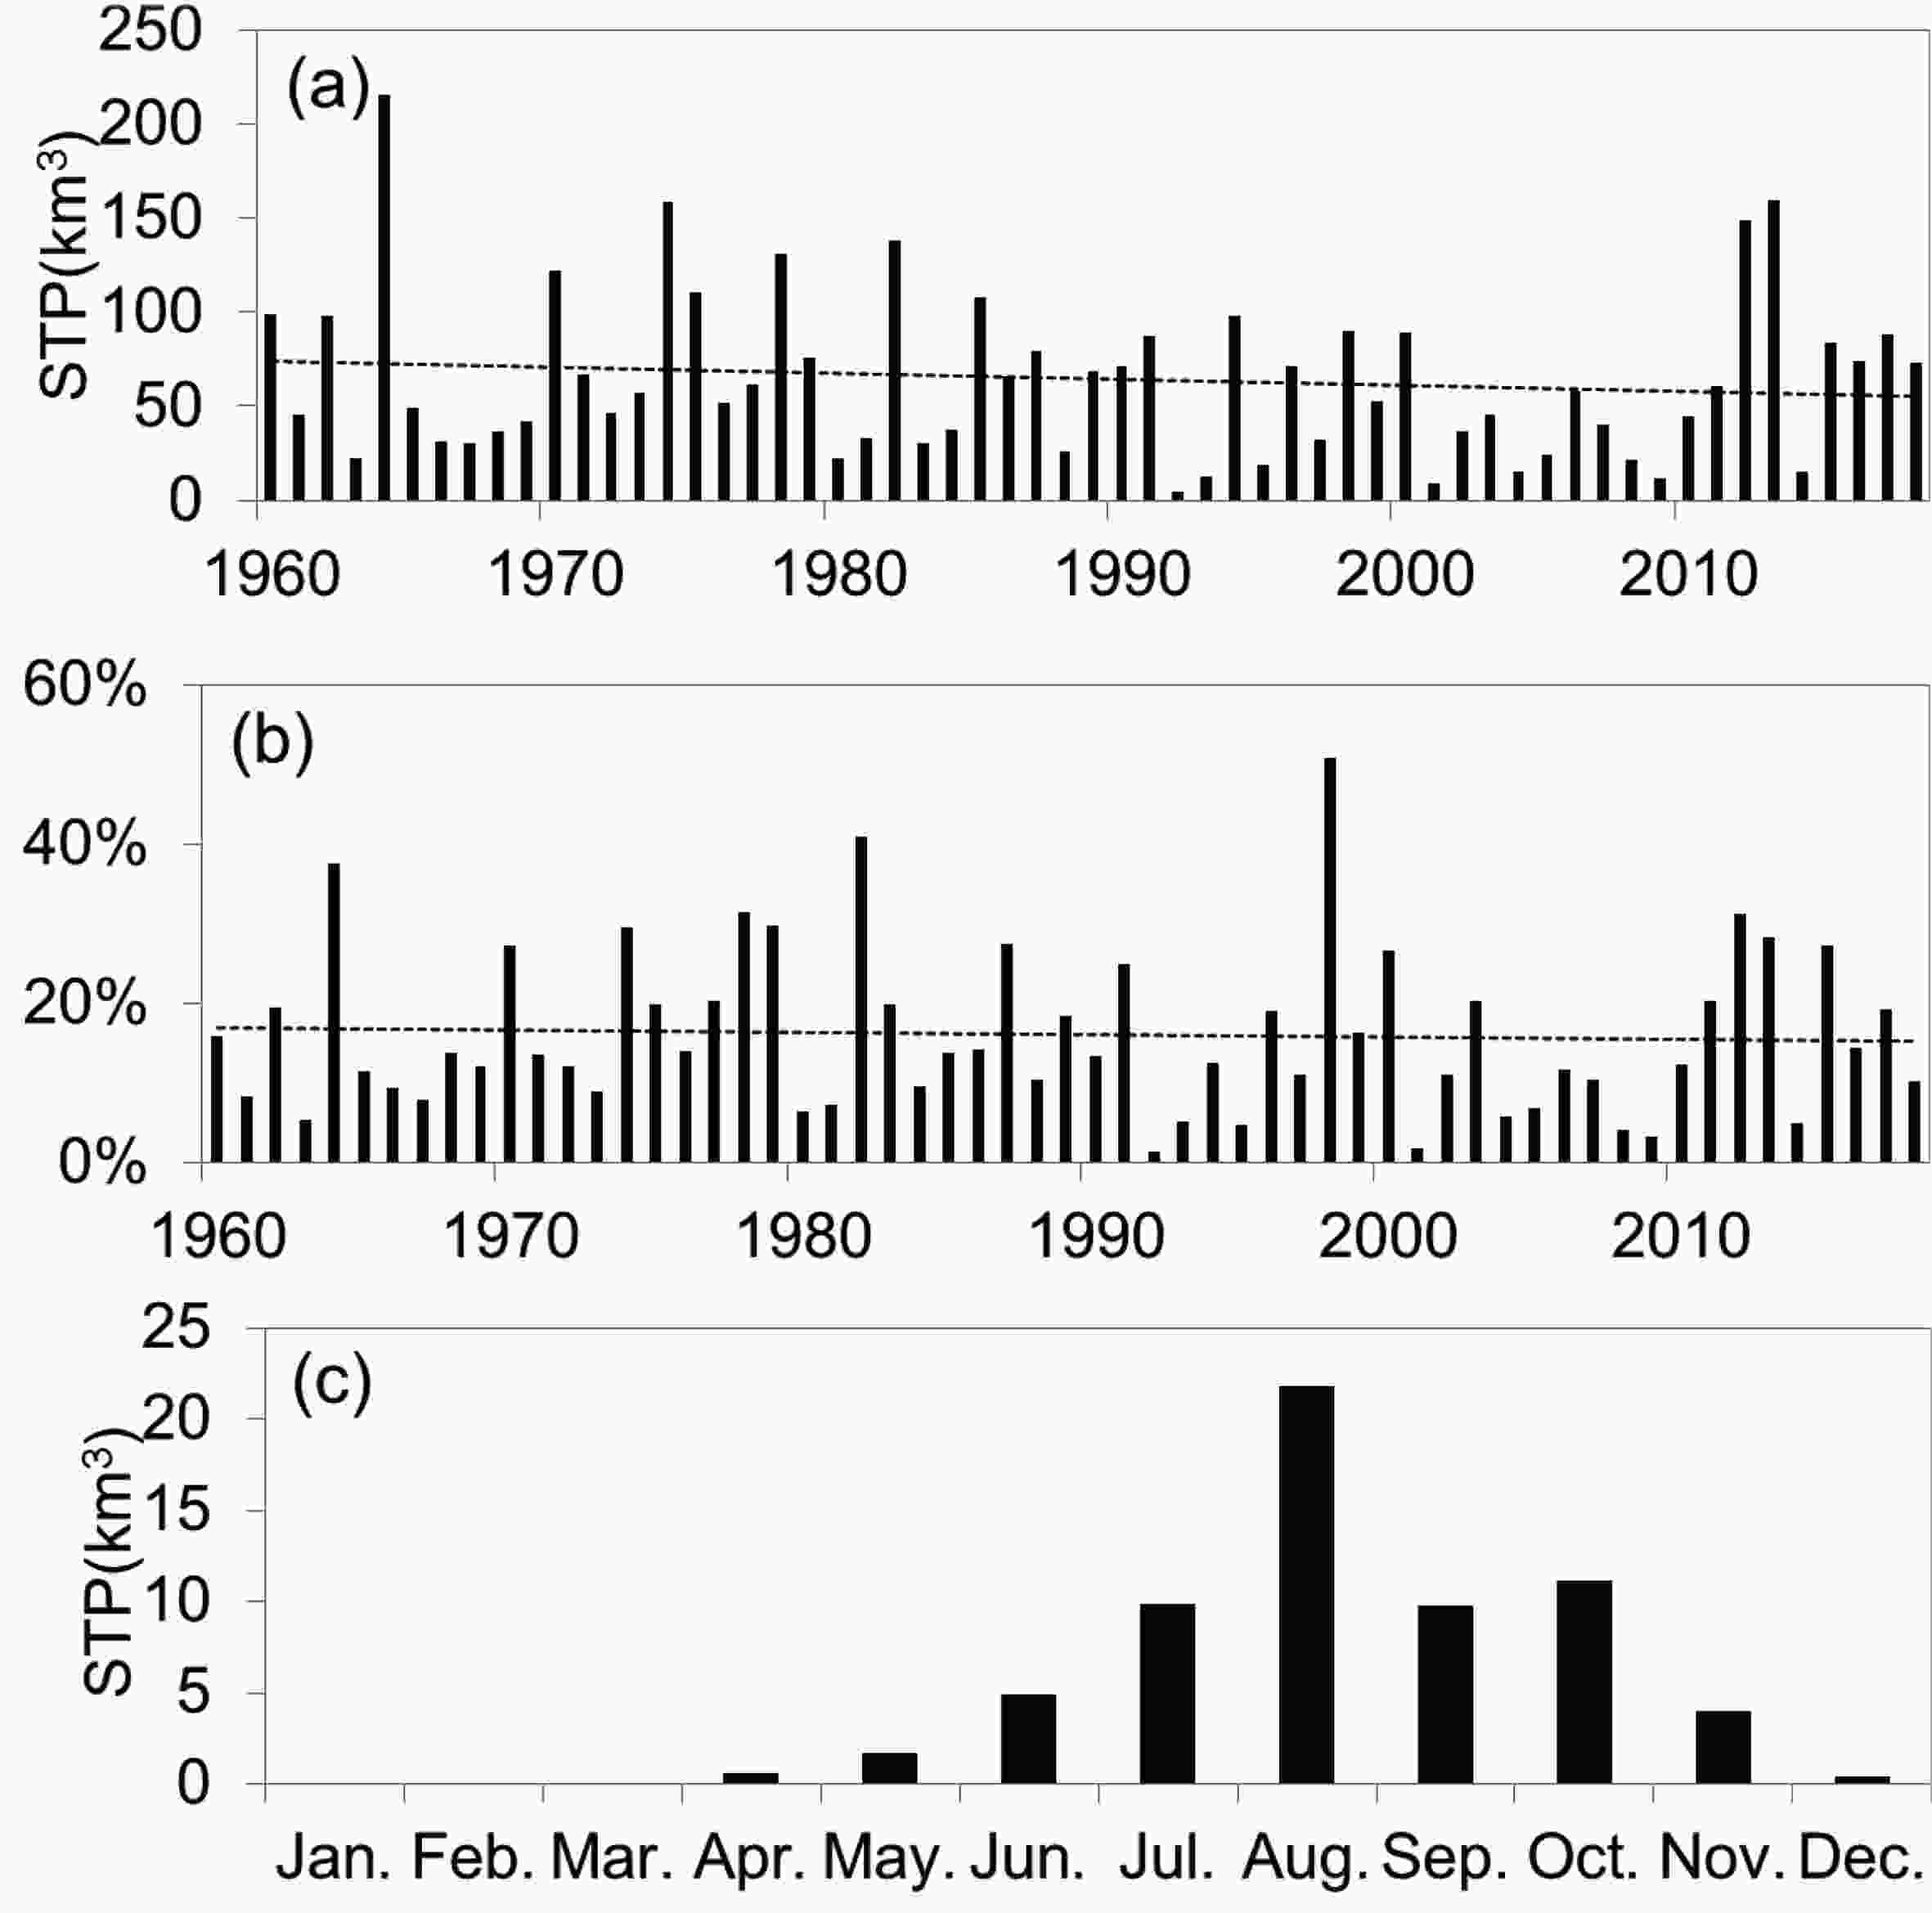 Figure5. Temporal variation of STP during 1960?2018: (a) annual variation of the mean precipitation (units: km3); (b) the ratio of STP to total TCP; (c) seasonal variation of STP (units: km3).
Figure 3 presents the tracks of all STCs during 1960?2018. They can be divided into three types: westward, northwestward, and northward paths. Near China’s coastline, the westward-path STCs appear mainly to move across the northern portion of the South China Sea, or westward besides southern Hainan Island and then over the Beibu Gulf area. The northwestward-path STCs move from Luzon Island to the Luzon Strait and then move towards the coastal region of South China. Most of them begin to dissipate prior to landfall. By comparison, the northward-path STCs move northwards besides western or eastern Taiwan Island, and then northwards along the northeastern or eastern coast of China.
 Figure3. The best tracks of STCs during 1960?2018. Blue rectangular frames are used to denote three types of TC tracking directions: westward (W), northwestward (NW), and northward (N); see the main text.
A scatterplot of MSD and STP is given in Fig. 4, showing that the STP generally decreases with increasing MSD. After utilizing linear and nonlinear regression to fit the relationship between MSD and STP, we find the best-fit nonlinear regression equation as:

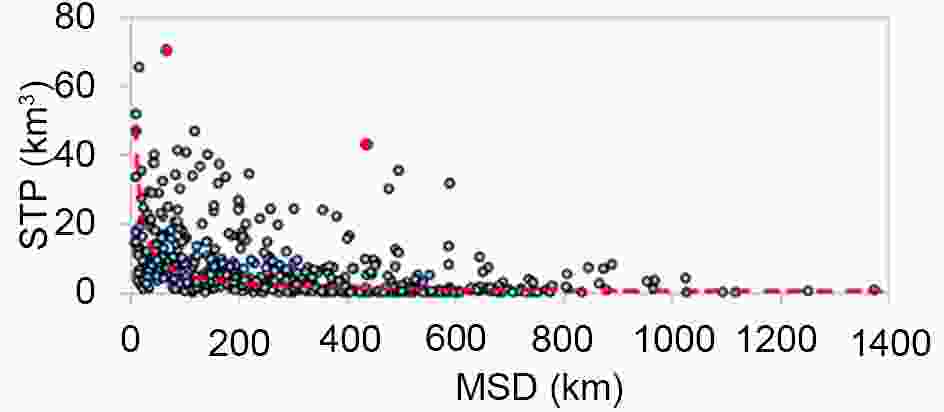 Figure4. Scatterplot of the MSD and STP from 518 STC cases. Red dashed lines denote a nonlinear-fit curve, and two extreme cases are shown as red dots.
2
3.2. Temporal characteristics of STP
Figure 5a displays the temporal variation of annual STP during 1960?2018. A downward linear trend is apparent during the 59-year period with a rate of ?32 km3 (10 yr)?1, although the trend is not statistically significant. Using the fifth-order polynomial fits and Mann?Kendall analysis, we can see relatively obvious interdecadal variations of STP during the 59-year period, with a regime shift in 2001. Specifically, there is a mainly decreasing trend in the sub-period of 1960?2000, but an increasing trend in the sub-period of 2001?18. The STP also shows prominent year-to-year fluctuations with a maximum value of 215.0 km3 in 1964, in which 17 STCs are present, and a minimum of 4.8 km3 in 1992, in which year 5 STCs occur (cf. Figs. 5a and 2a). The correlation coefficient between the annual number of STCs and the amount of STP is 0.66 with statistical significance at the 99% confidence level, suggesting that STC frequency has an important impact on the long-term trend of STP. This is consistent with the relationship between TCP and TC frequency (Liu et al., 2013). A comparison of Figs. 2a and 5a shows that the year with the largest (smallest) number of STCs is not the year with the largest (smallest) amount of STP, indicating that STC frequency is not the only key factor in determining STP. Clearly, the intensities and MSD of STCs, as well as the larger-scale environments in which they are embedded, would also play important roles in determining their associated STP. Given the factors of the annual number (


The ratio of STP to total TCP shows a slight decreasing trend (Fig. 5b), which can be clearly seen with similar interdecadal variation and year-to-year fluctuations in Fig. 5a for the annual STP. The greatest ratios of 50.1%, 40.1% and 37.5% correspond to the years of 1998, 1983 and 1964, respectively, whereas the smallest ratio of 1.5% occurs in 1992. A close examination of the above results shows that STP is almost the same as LTP in 1998 because of lower LTP frequency and weaker LTC intensities.
The seasonal variation of STP is given in Fig. 5c, showing that—like STCs—more significant STP appears from June to November, with the maximum STP amount of 21.9 km3 associated with 1.9 STCs occurring in August. STP in April, May and December is very small.
2
3.3. Spatial characteristics of STP
Figure 6a shows the spatial distribution of climatological-mean annual STP. Generally, STP impacts China from its southern coastal region to southeastern and eastern coastal regions, as recorded by 80% of the total rain gauge stations chosen in this study. It is evident that the 31°N latitude and 112°E longitude form a folding angle in the northwestern portion of Hubei Province, with a symmetric distribution of the inland periphery (i.e., the locations STP reaches) for the coverage of STP impact. That is, the inland periphery extends from central Inner Mongolia to the west of Shanxi and Henan, and from the northwest of Hubei to central Sichuan (see Fig. 1a). The outline of the inland periphery is similar to the outer envelope of all TC tracks or the distribution of China’s southeastern coastline (cf. Figs. 6 and 3). It is also evident from Fig. 6a that the southeastern coastal region receives high STP and its amount decreases with distance away from the coastline as expected. Of course, the maximum STP occurs over the two largest islands of Hainan and Taiwan. Figure6. Spatial distribution of (a) the annual mean STP (units: mm), (b) the ratio of STP to total TCP, and (c) the ratio of the STC frequency to the China-impacting TC frequency.
The spatial distribution of the ratio of STP to total TCP is presented in Fig. 6b, showing that the ratio increases from less than 10% over the southern coastal region to about 25% over the eastern coast region, and more than 50% in Northeast China. This could be attributed to the large spatial differences in the ratio of STC frequency to China-impacting TC frequency (Fig. 6c); namely, more than 50% over part of Northeast China but less than 10% along most of the southern coastal region. This result indicates that South China suffers little influence from STP, except for parts of Yunnan and southwestern Guangxi, while southeast- and east-coastal regions are more significantly influenced by STP, with its highest influences in Northeast China. Over the islands of Taiwan and Hainan, the ratio ranges from 10% to 50%.
To help understand the impact of STC intensity on STP, all STCs are classified into three categories: weak STCs (WTDs and TDs); moderate STCs (TSs and STSs); and intense STCs (TYs, STYs and SuperTYs), as mentioned in section 2.1. Figures 7a-c show the spatial distributions of STP in the three different intensity categories, respectively, revealing that the inland coverage of STP influences increases as the STC intensity category is shifted from weak to intense. [Note that STP to the north of 33°N is small (Fig. 7a), due to the presence of few and weak STCs with above-mean MSDs]. In particular, STP from the intense category, shown in Fig. 7c, is similar in distribution to that of STP from all STCs shown in Fig. 6a. This implies that the spatial range of STP influences, and to some extent, the STP amount, is dominated by intense STCs.
 Figure7. Spatial distribution of STP of different intensities (unit: mm): (a) weak STCs (WTDs and TDs); (b) moderate STCs (TSs and STSs); and (c) intense STCs (TYs, STYs, and SuperTYs).
2
3.4. Extreme STP
Given the important roles of more intense STCs in determining the coastal coverage and magnitude of STP, it is of interest to examine the general characteristics of extreme STP. For this purpose, the frequency distribution of extreme STP is given in Fig. 8a, showing that extreme STP events are densely recorded at most stations on the islands of Taiwan and Hainan, but coarsely recorded at mainland stations. In fact, only one extreme STP event during the 59-year study period was recorded by mainland stations, while those with higher frequency of extreme STP events are found on Taiwan and Hainan. Only one mainland station (i.e., Hunchun of Jilin Province) has a frequency of extreme STP events greater than three. The highest extreme STP frequency is 33 at Anbu, Taiwan, and the highest one in Hainan is 17 at Qiongzhong.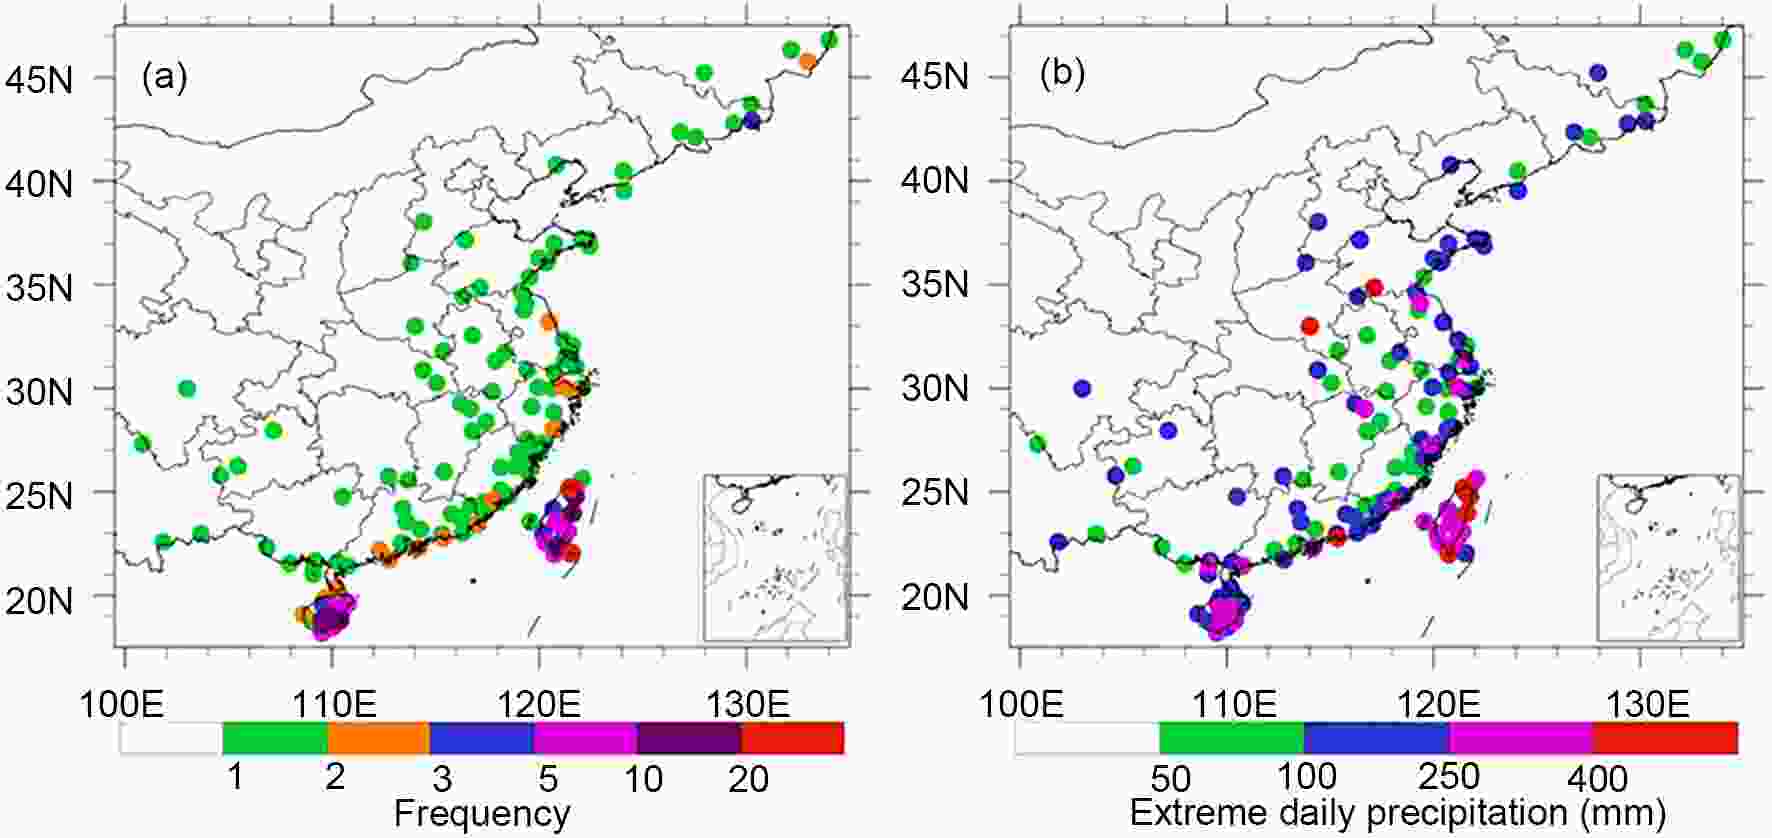 Figure8. Spatial distribution of extreme STP cases: (a) frequency; (b) rainfall values (units: mm) for individual STC cases.
Figure 8b shows the amount of extreme STP ranges from 50 to 400 mm at most stations. STP exceeding 400 mm is recorded at several stations in Taiwan, a coastal station in Guangdong, and two inland stations in Henan and Shandong. As can be expected, more extreme STP events tend to occur in coastal regions, and Taiwan and Hainan, with few over inland areas. For example, TY Flossie (1969) and STY Ora (1978) caused daily precipitation of about 750 mm and 733 mm in Taiwan, respectively. STS Polly (1971) produced daily precipitation of 559 mm in Weishan of Shandong Province, and SuperTY Cecil (1982) produced greater than 420 mm in Zhumadian of Henan Province.
It is evident from the above analysis that coastal areas, especially in Taiwan and Hainan, are more vulnerable to extreme STP, with Taiwan suffering from the most severe extreme STP events. There are a total of 10 STC cases with extreme precipitation of over 400 mm in Taiwan during the 59-year study period. Figure 9 shows the tracks for six of them after removing four cases that interacted with other TCs. The MSDs of the six STCs range from 32 to 165 km, with the STC intensity ranging from STS to SuperTY. These short MSDs remind us of the similarity between STCs and LTCs because both of their inner-core convection or rainbands① occur over land regions. Of interest is the sharp track turnings of the extreme STP storms as they move close to the island. According to the analysis of unusual tracks of TCs over China’s coastal waters by Zhang et al. (2018b), the sharper the track turnings, the more slowly TCs tend to move. This indicates that the generation of extreme STP could be attributed to the slower displacements during the turnings from northwestward to northeastward, in addition to the important influences of the STC intensities.
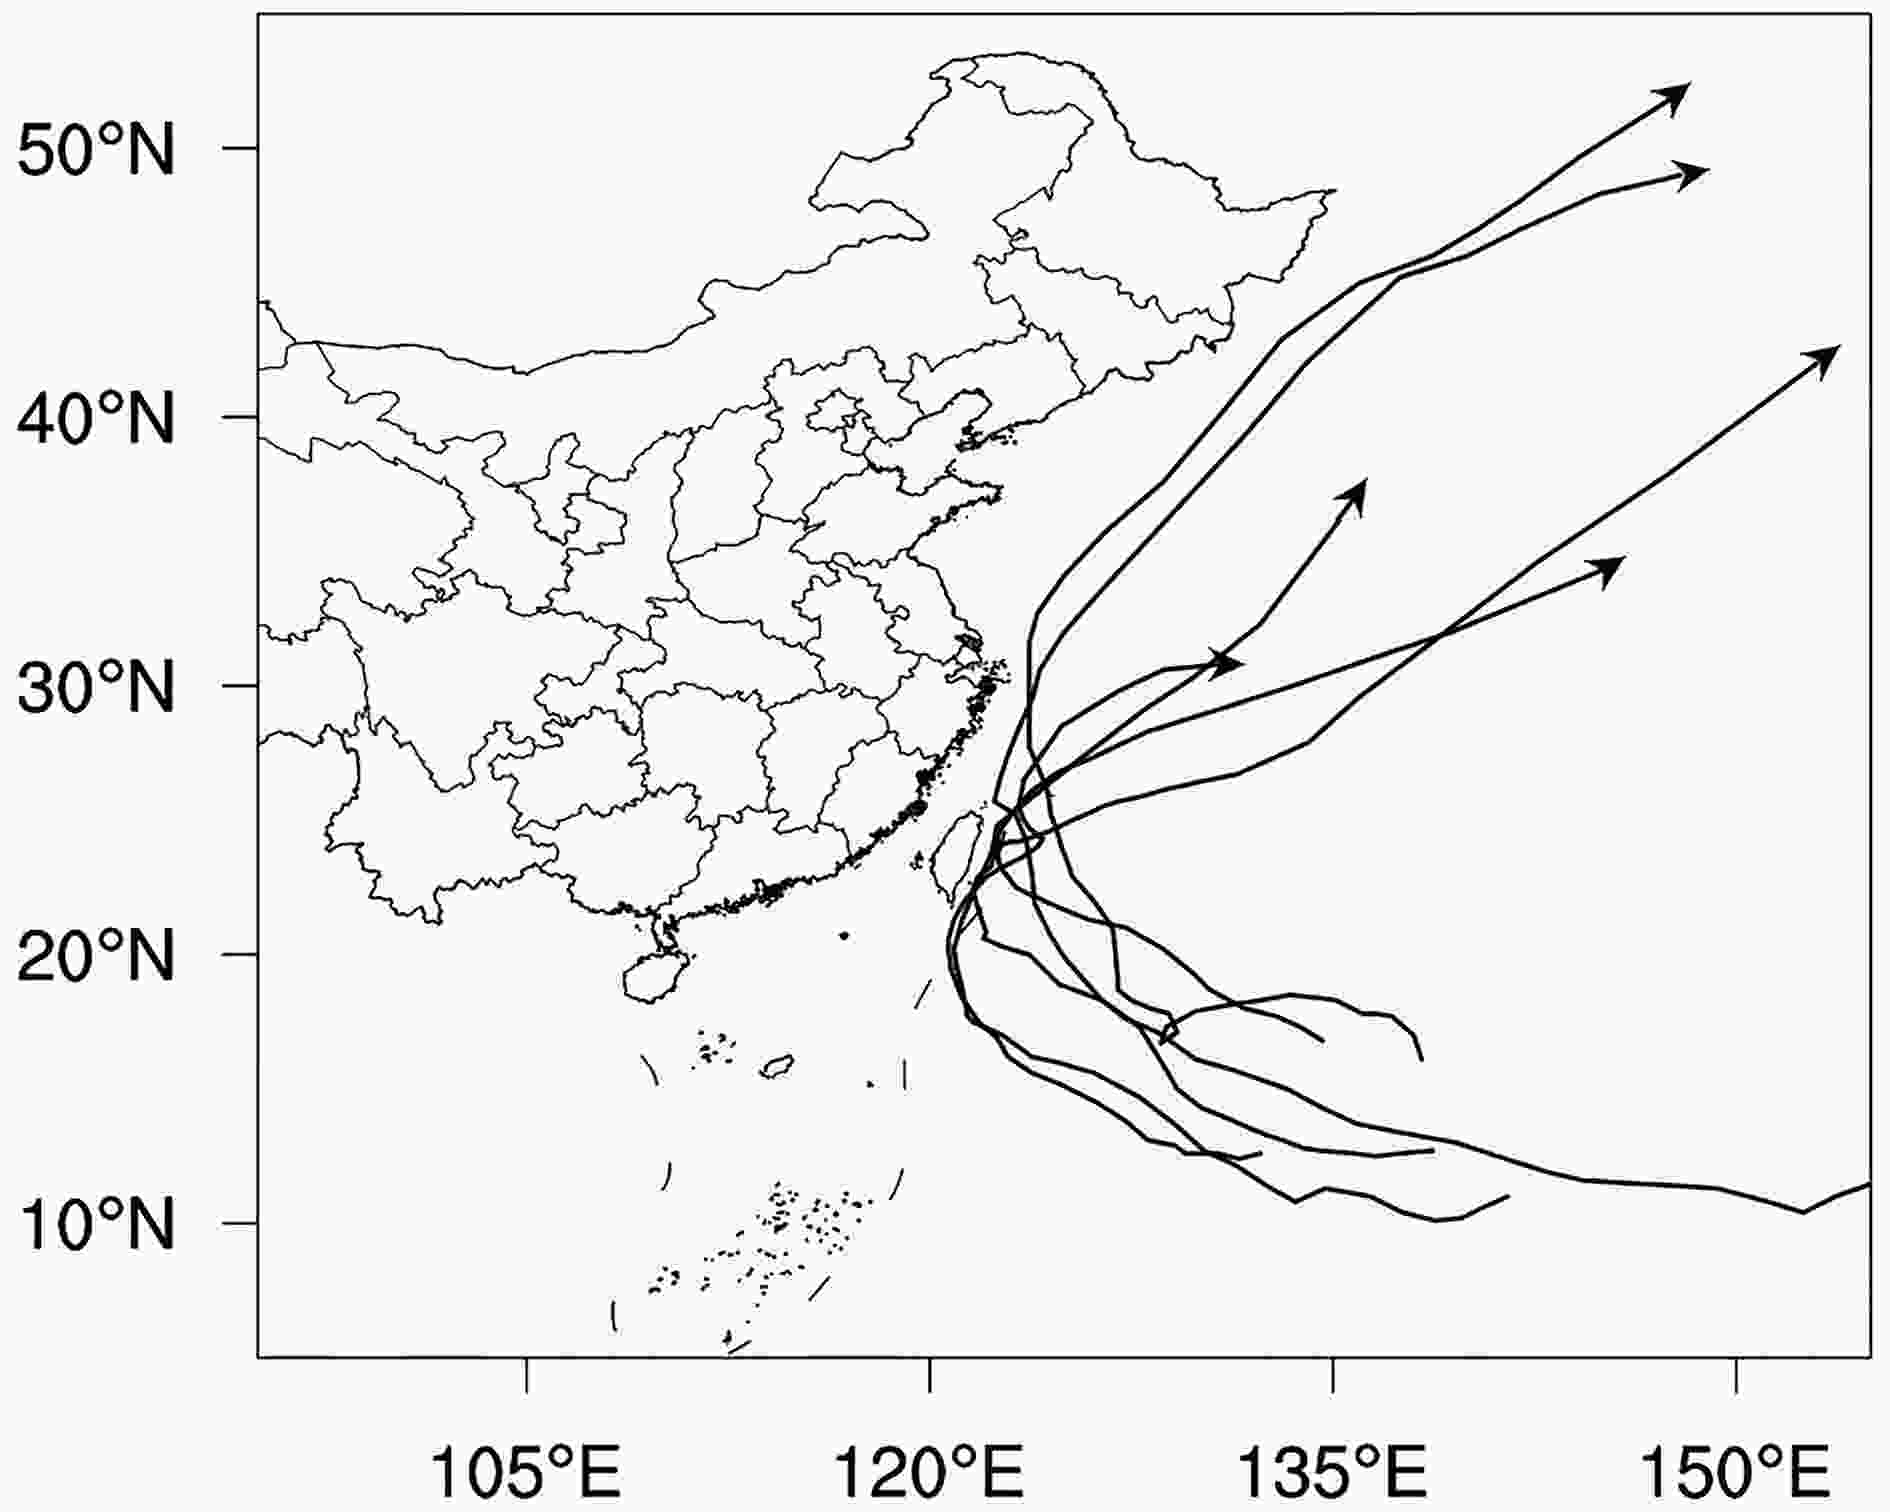 Figure9. The tracks of six STCs that caused extreme STP events in Taiwan.
While most extreme STP events occur close to coastline, inland areas could also experience extreme STP, albeit much less frequently than coastal areas. STS Polly (1971) and SuperTY Cecil (1982), which generated extreme STP events over inland areas, i.e., Weishan of Shandong Province and Zhumadian of Henan Province, respectively, are two examples of extreme-rain-producing STCs.
To help understand the generation of extreme STP over inland areas, Figs. 10a and b present the large-scale flows and the tracks with recorded STC centers together with the precipitation field that were associated with STS Polly (1971) on 9 August and SuperTY Cecil (1982) on 13 August, respectively. Although the STC centers are far from the extreme precipitation location of Weishan, Shandong, i.e., with an average distance of 969 km, the strong southeasterly flow north of the STC centers accounts for transporting warm and moist air from the underlying ocean surface for the development of this extreme STP event. Local steep topography along the coastal region of Shandong’s peninsula also plays an important role in lifting and blocking the moist air for enhanced convective overturnings.
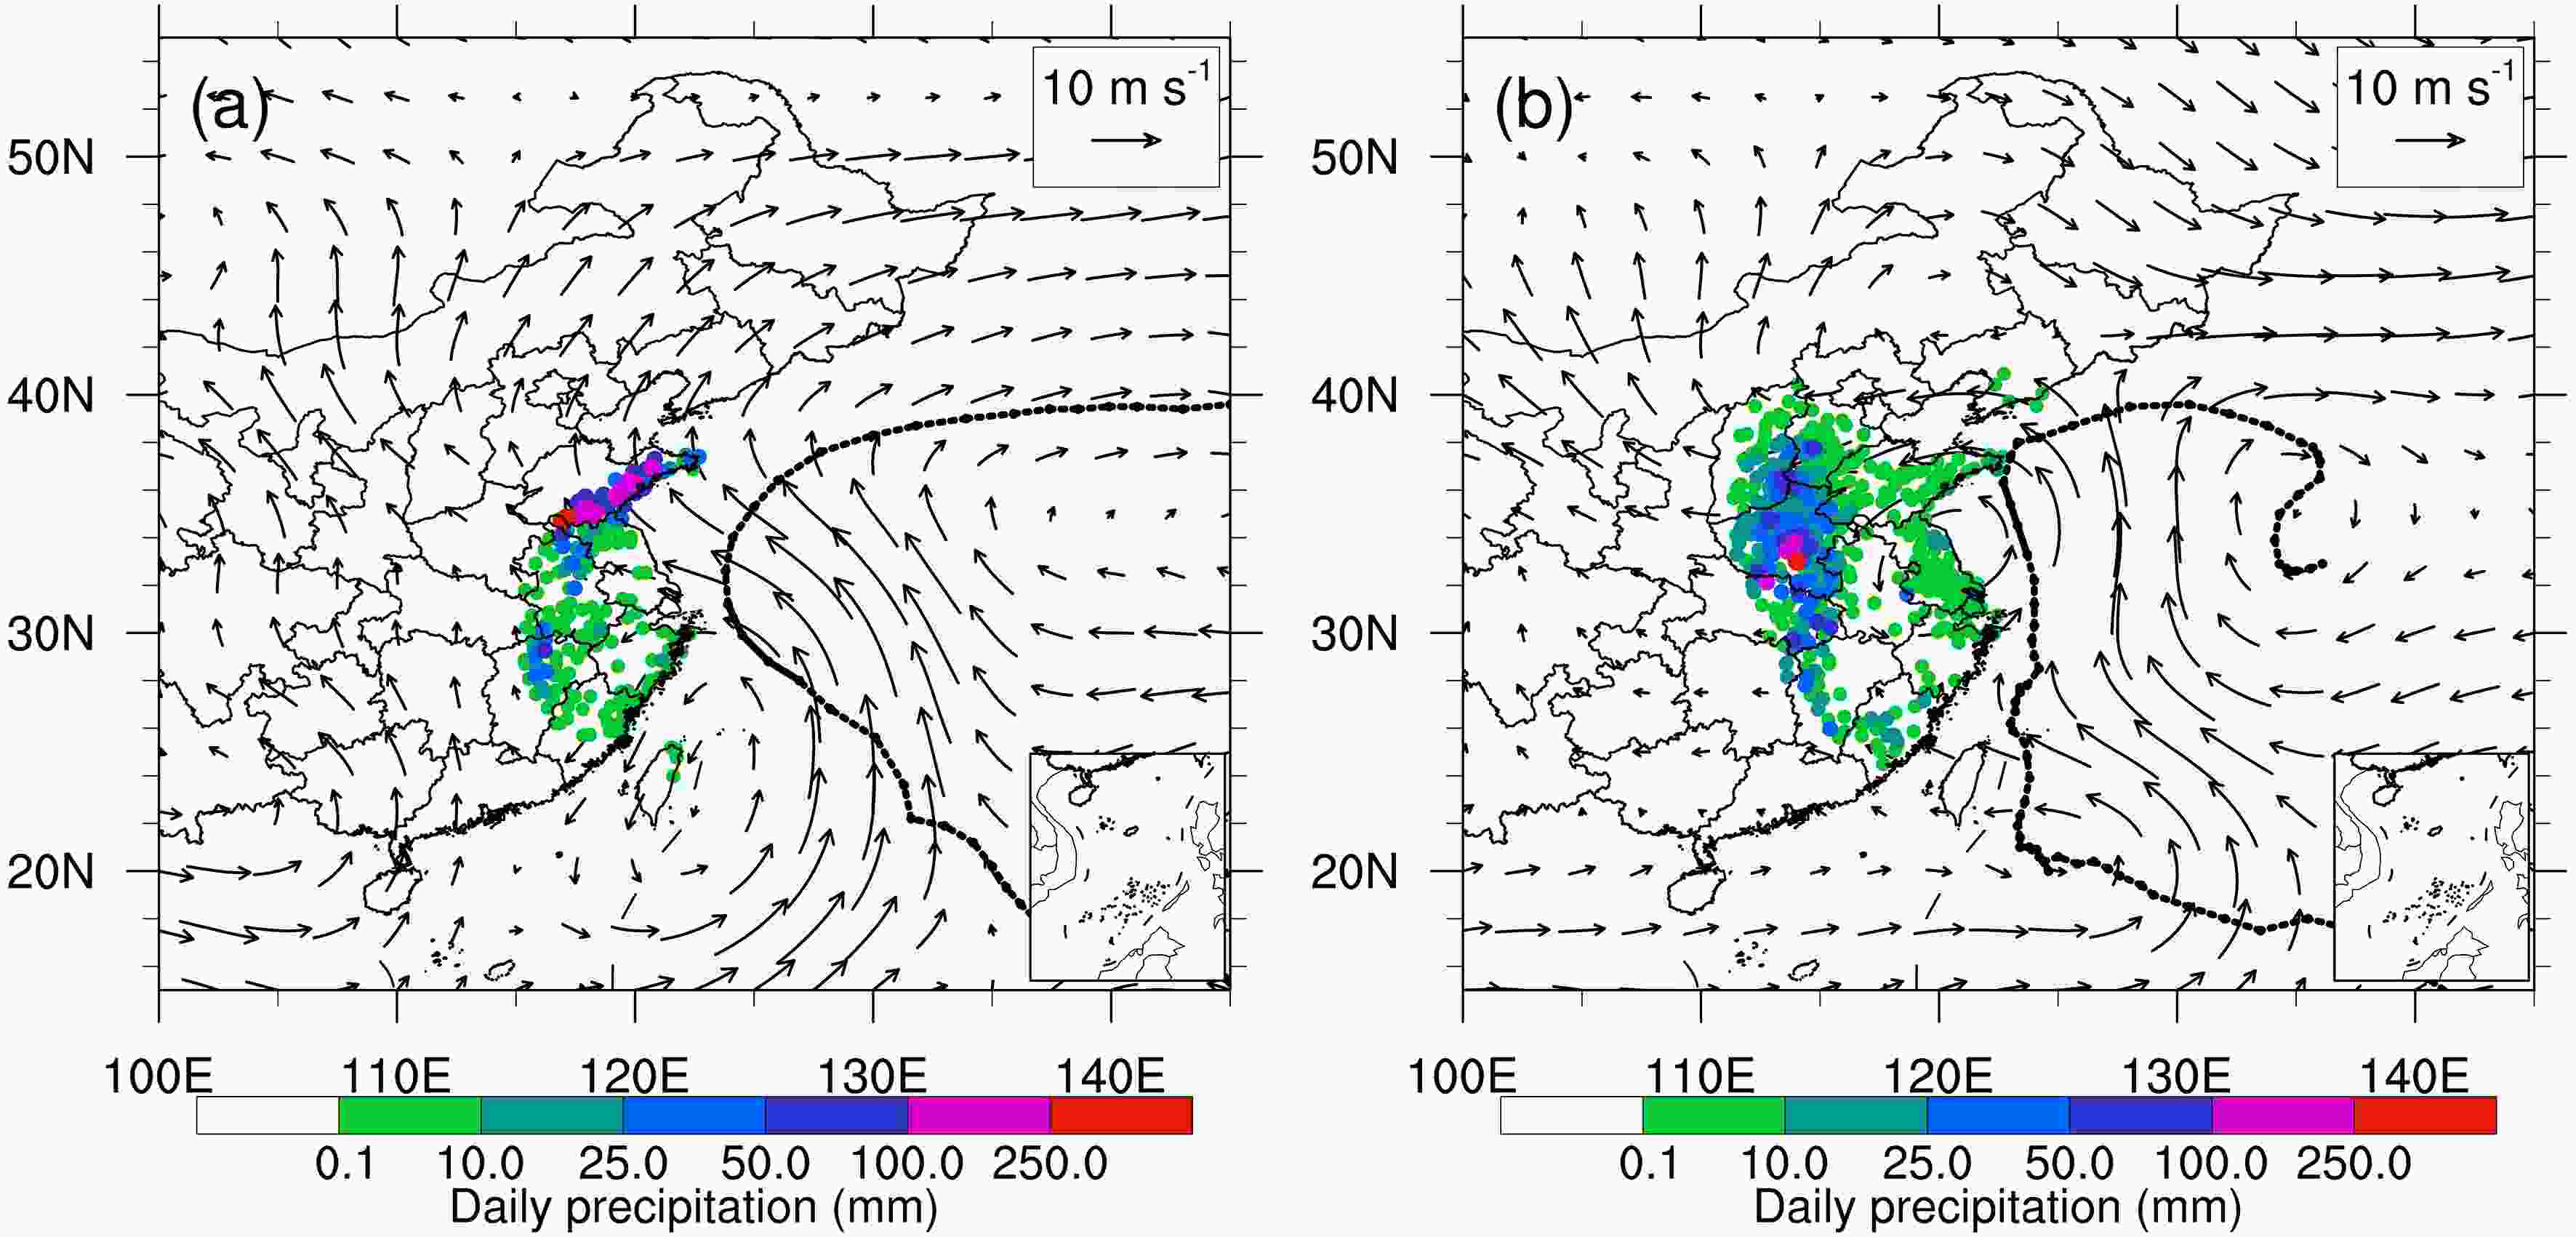 Figure10. Distribution of STP (colored dots; units: mm), TC tracks (black dots at 6-h intervals and with the period of extreme precipitation denoted by solid lines), and the 850-hPa wind vectors (units: m s?1), associated with (a) STS Polly on 9 August 1971; and (b) SuperTY Cecil on 13 August 1982.
In contrast, the extreme STP associated with SuperTY Cecil occurs over Zhumadian of Henan Province, which is located in the bordering area of Mt. Qinling and the Huanghe?Huaihe River valleys, throughout which the terrain is high in the west and low in the east, with a minimum distance of 870 km from the offshore TC center. The large-scale flows are characterized by a southwesterly airflow ahead of an upper-level trough (Han and Pan, 1982), and a southeasterly low-level jet in the northern semicircle of the STC (Fig. 10b). Clearly, the upper-level trough provides favorable quasi-geostrophic lifting of moist southwesterly air, while local undulating topography accounts for lifting the low-level southeasterly moist air for the development of extreme STP. The topographical effects can be seen from the south?north-oriented heavy precipitation field that is parallel to the orientation of Mt. Taihang.
(1) The annual number of STCs affecting China fluctuates significantly from 3 to 17, with a mean frequency of 8.8 STCs per year. The STC activity runs mainly from June to November with a peak value of 1.9 in August. In general, STP decreases with increasing MSD, except for some extreme cases in which local orography and some favorable large-scale forcing play critical roles.
(2) The annual frequency of STCs and its ratio to that of TCs impacting China show a long-term declining trend, which is consistent with the trend of China-impacting TCs; similarly for the annual variation of STP and its ratio to total TCP. This could be related to the current trend of global warming that tends to produce fewer but more intense TCs.
(3) STCs can produce large coverage of inland precipitation, sometimes with extreme intensity, depending on the intensity of STCs and their interaction with local orography and larger-scale disturbances. That is, the inland periphery of STP resembles the outer envelope of STC tracks or China’s coastline, and the total STP is more dominated by intense STCs. Moreover, STP decreases in amount away from the coastline, and from China’s southeastern to the northeastern coastal regions with intense magnitudes occurring over the islands of Taiwan and Hainan.
(4) Extreme STP occurs not only over the islands and coastal regions, but also over inland areas where STCs experience synergistic interaction with local orography and large-scale disturbances.
In conclusion, STP makes an important contribution to the total inland precipitation associated with TCs, some of which can produce extreme rainfall events leading to devastating impacts on our living environment and society not only in coastal regions but also in inland areas far away from the coastline. Clearly, more detailed studies should be conducted to understand the impacts of large-scale flows, TC structures, and underlying surface conditions on the distribution and amount of STP, especially in association with extreme STP events. There are indeed numerous issues that are worthy of further investigation. This study is merely the beginning of studying STCs and STP affecting China. In our future studies, we plan to examine the asymmetrical distribution of STP and the differences between STP and LTP, and then compare the associated statistics to those based on other best-track data, such as the IBTrACS data (Knapp et al., 2010).
Acknowledgements. This work was supported by the National Key R&D Program of China (Grant Nos. 2018YFC1507703 and 2018YFC1507400), the National Natural Science Foundation of China (Grant No. 41675042), the project entitled “Dynamical?Statistical Ensemble Techniques for Predicting Landfalling Tropical Cyclone Precipitation”, and the Jiangsu Collaborative Innovation Center for Climate Change.
