HTML
--> --> -->Temperature and precipitation are essential indicators for climate change. In the past few years, many research efforts have been devoted to model evaluations and projections of temperature and precipitation over China within the CMIP phase 5 (CMIP5) framework. The evaluations indicated that the CMIP5 models, in general, show reasonable performance in capturing the geographical distributions of surface temperature and precipitation (e.g., Xu and Xu, 2012b; Guo et al., 2013; Huang et al., 2013; Kumar et al., 2014; Sun et al., 2015; Jiang et al., 2016). Compared with CMIP phase 3 (CMIP3), the CMIP5 performances were improved for temperature while there was little performance change for precipitation (Kumar et al., 2014; Sun et al., 2015; Jiang et al., 2016). Some common biases, such as topography-related cold biases, underestimations of southeast-northwest precipitation gradients, and overestimations of the magnitudes of the interannual variability of temperature and precipitation, are also present in the CMIP5 simulations (Su et al., 2013; Chen et al., 2014; Bao and Feng, 2016; Jiang et al., 2016). For the CMIP5 projections, an overall warming of temperature and a general increase in precipitation are projected over China by the end of the 21st century under the Representative Concentration Pathways (RCPs), further noting the expectation of larger changes to occur for higher RCPs (e.g., Xu and Xu, 2012a; Su et al., 2013; Chen and Frauenfeld, 2014; Hu et al., 2015; Wu et al., 2015; Tan et al., 2016; Zhang et al., 2017).
In general, these findings improve our knowledge of the simulation abilities of CMIP5 models and future climate changes under the RCP scenarios. Questions naturally arise regarding the performance of CMIP6 models for the climate in China and how China’s climate would change in the context of the new CMIP6 scenarios (i.e., Shared Socioeconomic Pathways, SSPs), which represents the motivation of this study. Some recent studies have begun to evaluate and project the East Asian monsoon climate using CMIP6 data (Chen et al., 2020; Ha et al., 2020; Jiang et al., 2020; Nie et al., 2020; Zhu et al., 2020; Xin et al., 2020) and have indicated a general improvement of CMIP6 models compared with CMIP5 models regarding simulations of both mean temperature and precipitation as well as extreme temperature and precipitation events. For example, a smaller spread is observed among CMIP6 models as well as a weaker cold bias of temperature and a weaker underestimation of the southeast–northwest precipitation gradient (Chen et al., 2020; Jiang et al., 2020). However, more detailed regional analysis is still needed. In addition, some previous CMIP studies have used the multimodel ensemble for projecting the climate of China (e.g., Xu and Xu, 2012a; Chen and Frauenfeld, 2014; Zhou et al., 2014; Tian et al., 2015; Wu et al., 2015; Wang et al., 2017) and some have used the optimal model ensemble (e.g., Chen and Sun, 2009, 2013; Chen et al., 2011; Hu et al., 2015; Zhou et al., 2018a; Rao et al., 2019). Determining the nature of the differences between the optimal model ensemble and the multimodel ensemble for CMIP6 projections of climate over China is also an area of concern in this study. Addressing this topic will aid in the understanding of uncertainties in the projections.
| ID | Model name | Institution and country | Atmospheric resolution (lon×lat: number of grids, L: vertical levels) |
| 1 | ACCESS-CM2 | Commonwealth Scientific and Industrial Research Organization, Australian Research Council Centre of Excellence for Climate System Science, Australia | 192×144, L85 |
| 2 | ACCESS-ESM1-5 | Commonwealth Scientific and Industrial Research Organization, Australia | 192×145, L38 |
| 3 | BCC-CSM2-MR | Beijing Climate Center, China | 320×160, L46 |
| 4 | CanESM5 | Canadian Centre for Climate Modelling and Analysis, Canada | 128 × 64, L49 |
| 5 | CESM2 | National Center for Climate Research, USA | 288 × 192, L32 |
| 6 | CESM2-WACCM | National Center for Climate Research, USA | 288 × 192, L70 |
| 7 | EC-Earth3 | EC-Earth Consortium, Europe | 512 × 256, L91 |
| 8 | EC-Earth3-Veg | EC-Earth Consortium, Europe | 512 × 256, L91 |
| 9 | FGOALS-g3 | Chinese Academy of Sciences, China | 180 × 80, L26 |
| 10 | GFDL-CM4 | National Oceanic and Atmospheric Administration, Geophysical Fluid Dynamics Laboratory, USA | 288 × 180, L33 |
| 11 | GFDL-ESM4 | National Oceanic and Atmospheric Administration, Geophysical Fluid Dynamics Laboratory, USA | 288 × 180, L49 |
| 12 | INM-CM4-8 | Institute for Numerical Mathematics, Russia | 180 × 120, L21 |
| 13 | INM-CM5-0 | Institute for Numerical Mathematics, Russia | 180 × 120, L73 |
| 14 | IPSL-CM6A-LR | Institute Pierre Simon Laplace, France | 144 × 143, L79 |
| 15 | MIROC6 | Atmosphere and Ocean Research Institute, The University of Tokyo, Japan | 256 × 128, L81 |
| 16 | MPI-ESM1-2-HR | Max Planck Institute for Meteorology, Germany | 384 × 192, L95 |
| 17 | MPI-ESM1-2-LR | Max Planck Institute for Meteorology, Alfred Wegener Institute, Germany | 192× 96, L47 |
| 18 | MRI-ESM2-0 | Meteorological Research Institute, Japan | 320 ×160, L80 |
| 19 | NorESM2-LM | NorESM Climate modeling Consortium, Norway | 144 × 96, L32 |
| 20 | NorESM2-MM | NorESM Climate modeling Consortium, Norway | 288 × 192, L32 |
Table1. Basic information for the CMIP6 models used in this study.
The observed temperature and precipitation data of CN05.1 with a resolution of 0.25°×0.25° (Wu and Gao, 2013) are used to validate the performance of the CMIP6 models. For convenience, all data are converted to the same 1°×1° grid using a bilinear interpolation scheme before analysis. As recommended by the CMIP6, the period 1995–2014 is used as the reference period for the evaluation and projection. The ensemble in this study is calculated with the same weight. The statistical significance is examined by the Student’s t-test.
A Taylor diagram (Taylor, 2001) is used to evaluate spatial distributions of temperature and precipitation over China. This diagram provides a concise statistical summary of how well a simulated pattern matches an observed pattern in terms of the spatial correlation coefficient (SCC), the root-mean-square error (RMSE), and the ratio of variances. The interannual variability of the simulations relative to the observations is assessed by the interannual variability skill score (IVS) (Gleckler et al., 2008; Scherrer, 2011), which is calculated as
where STDm and STDo are the standard deviations of the simulation and observation, respectively. IVS is a symmetric variability statistic that is used to measure the similarity of interannual variation between the simulation and observation. A smaller IVS value indicates a better simulation of interannual variability.
To quantitatively examine regional differences, following Zhou et al. (2014), we divide China into eight subregions: Northeast China (NEC; 39°–54°N, 119°–134°E), North China (NC; 36°–46°N, 111°–119°E), East China (EC; 27°–36°N, 116°–122°E), Central China (CC; 27°–36°N, 106°–116°E), Northwest China (NWC; 36°–46°N, 75°–111°E), Tibetan Plateau (SWC1; 27°–36°N, 77°–106°E), Southwest China (SWC2; 22°–27°N, 98°–106°E), and South China (SC; 20°–27°N, 106°–120°E) (see Fig. 1), all of which are based on administrative boundaries and societal and geographical conditions (National Report Committee, 2007).
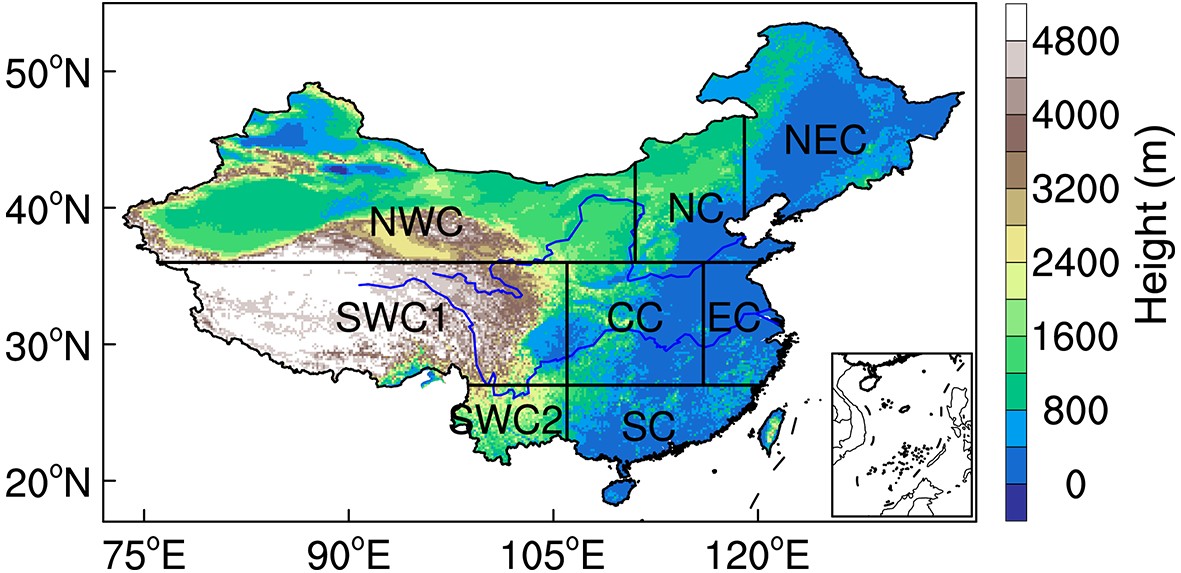 Figure1. Domains and topography (shading, units: m) of eight sub-regions in China. NEC: Northeast China; NC: North China; EC: East China; CC: Central China; NWC: Northwest China; SWC1: Tibetan Plateau; SWC2: Southwest China; SC: South China.
3.1. Climatology and interannual variability
Figures 2a–f show the climatological spatial distributions of annual, winter (December to February, DJF), and summer (June to August, JJA) temperatures from observations and the ensemble simulation of all models (AMME), respectively. In general, the AMME simulated spatial patterns approximate those of the observations. However, relative to the observations, a general underestimation of annual temperature is noted over most of China in the AMME simulation. The most pronounced cold bias is located in the Tibetan Plateau (Fig. 2g). This phenomenon was also present in the CMIP3 and CMIP5 simulations as revealed by previous studies (Jiang et al., 2005; Xu and Xu, 2012a; Jiang et al., 2016). For winter (Fig. 2h) and summer (Fig. 2i) temperatures, there are notable warm biases in parts of northern China, in addition to the cold bias in the Tibetan Plateau. Figure2. Spatial distributions of (a?c) observed temperature (units: °C), (d?f) AMME simulated temperature (units: °C), and (g?i) AMME simulation biases from the observation (simulation minus observation, units: °C) for the period 1995–2014. The panels from the left to right side are for annual (ANN), winter (DJF), and summer (JJA), respectively. The black lines in (g)?(i) show the boundary of subregions. Note that the scales of color bars are different.
For observed precipitation (Figs. 3a–c), the annual, winter, and summer precipitation amounts decrease from the southeast coast to the northwest areas. These spatial patterns are captured by the AMME simulation (Figs. 3d–f) but with overall wet biases (Figs. 3g–i). The wet bias for annual precipitation appears in most parts of northern and western China, particularly on the northern and southern flanks of the Tibetan Plateau (Fig. 3g), which was also reported for the CMIP3 and CMIP5 simulations (Jiang et al., 2005; Xu and Xu, 2012a; Jiang et al., 2016). Compared with the CMIP5, the wet bias in the CMIP6 models was observed to be smaller (Jiang et al., 2020; Zhu et al., 2020). The spatial distributions of wet biases for winter precipitation resemble that for annual precipitation, but with larger bias magnitudes (Fig. 3h). Besides the wet bias, dry biases are also notable for summer precipitation in parts of Northwest China and East China (Fig. 3i).
 Figure3. Spatial distributions of (a?c) observed precipitation (units: mm), (d?f) AMME simulated precipitation (units: mm), and (g?i) AMME simulation biases from the observation ((simulation minus observation)/observation, units: %) for the period 1995–2014. The panels from the left to right side are for annual (ANN), winter (DJF), and summer (JJA), respectively. The black lines in (g)?(i) show the boundary of subregions. Note that the scales of color bars are different.
Figure 4 shows the Taylor diagrams for annual, winter, and summer temperature and precipitation over China as simulated by the 20 CMIP6 models and AMME against the observations. The azimuthal position of the model point indicates the SCC between the simulated and observed patterns. The distance from the reference point (REF) to the model point indicates the normalized RMSE of the simulation relative to the observation. The radial distance from the origin to the model point indicates the ratio of standard deviations between the simulation and observation. The overall model biases are excluded in this diagram. Clearly, the CMIP6 models show better performance for temperature than for precipitation. For temperature, regardless of whether winter, summer, or annual mean values are used, the SCCs between the simulations and observations are all greater than 0.9, the RMSEs of the simulations relative to the observations are generally below 0.5, and the ratios of variances to the observations are close to 1 for most models. These results indicate that the CMIP6 models effectively capture the climatological distributions in terms of annual, summer, and winter temperatures.
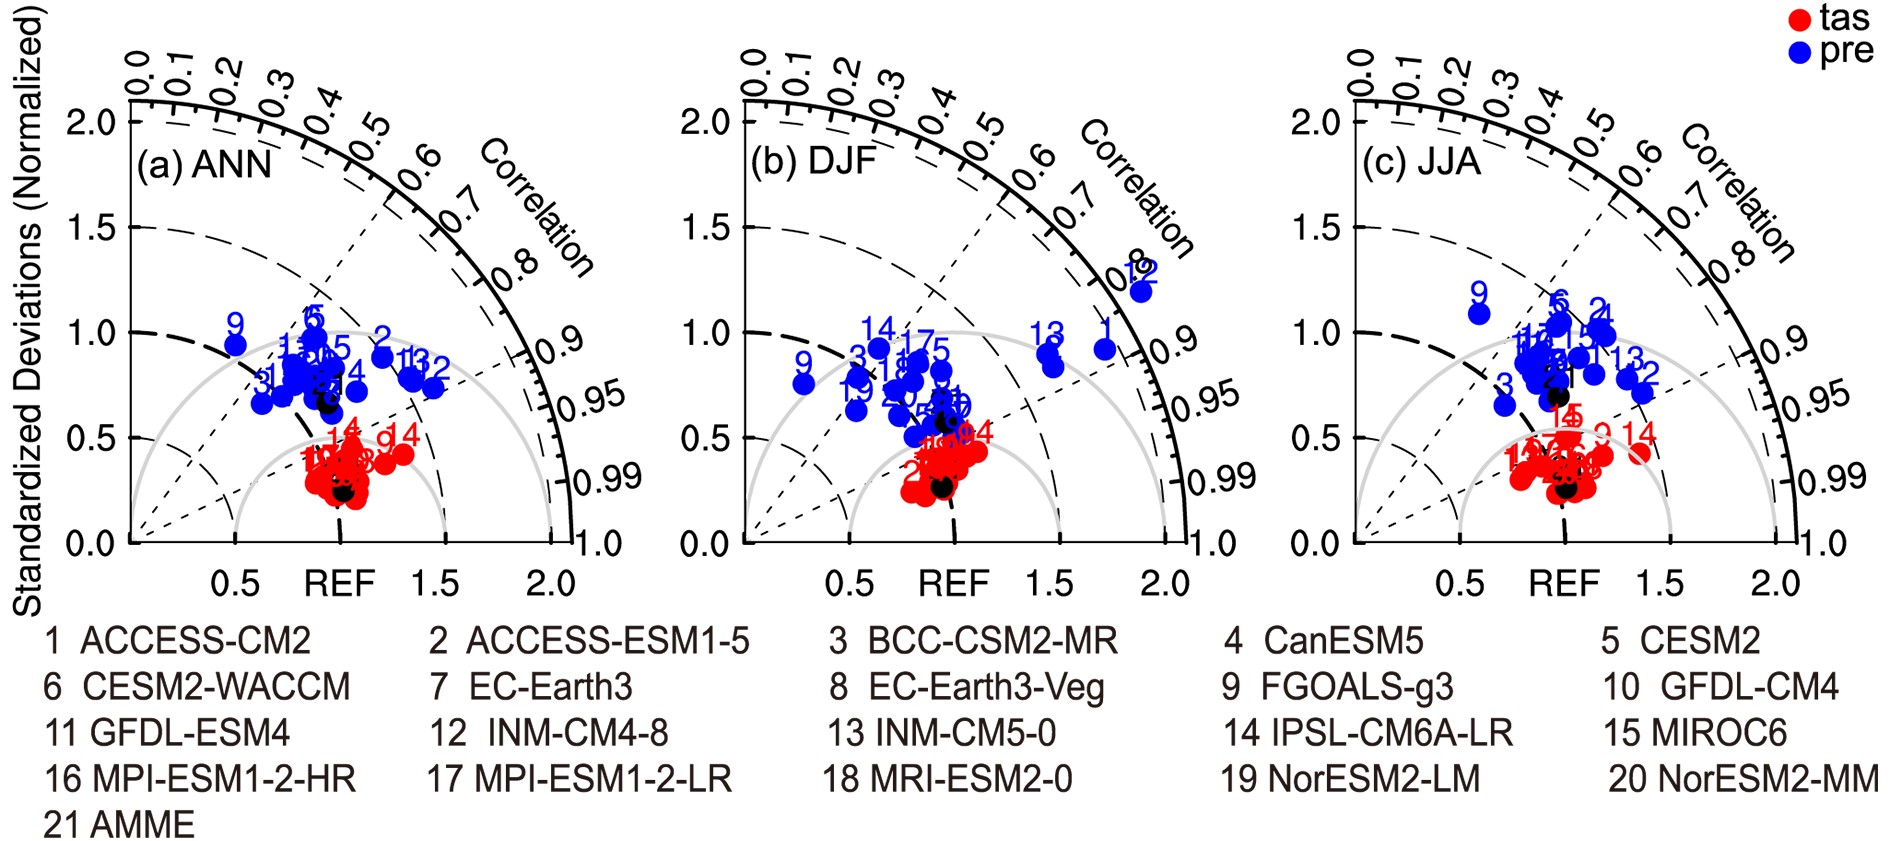 Figure4. Taylor diagrams of (a) annual (ANN), (b) winter (DJF), and (c) summer (JJA) temperature (red dots; units: °C) and precipitation (blue dots; units: mm) over China for the period 1995–2014. The black dot in each panel represents AMME.
Compared with temperature, the SCCs for precipitation over China are relatively lower and the RMSEs are relatively higher. Specifically, the SCCs and RMSEs are mainly in the range of 0.6–0.9 (still statistically significant) and 0.5–1, respectively. In addition, the ratios of variances mostly lie between 1 and 1.5. Overall, the simulations of most models are reliable for the spatial patterns of annual, summer, and winter precipitation, although the variances are overestimated.
Figure 5 presents the IVS values of the simulations for the interannual variability of annual, winter, and summer temperature and precipitation over China. In this study, the IVS values were first calculated in each grid of China and then averaged. For temperature (Fig. 5a), the IVS values are below 1.5 for all models except for CanESM5 which shows a value of 4.0 in summer. This suggests that the CMIP6 models can reasonably reproduce the observed interannual variability of annual, winter, and summer temperature. In comparison, the model performances for the interannual variability of annual and winter temperatures are better than their performances in summer. For precipitation (Fig. 5b), though the IVS values are larger than those for temperature, the relatively low IVS values in annual mean and summer imply a reasonable reproduction of the observed interannual variability by the CMIP6 models. It also reflects the dominant contribution of summer precipitation to annual precipitation (Sui et al., 2013). There is a large range for the winter IVS values, which vary from 7.1 to 62.9 and are much larger than those of annual mean and summer. This result indicates large inconsistencies among the models and poor simulations for the interannual variability of winter precipitation.
 Figure5. Interannual variability skill score (IVS) of the CMIP6 models for annual (ANN), winter (DJF), and summer (JJA) (a) temperature and (b) precipitation over China. Note that the IVS for winter precipitation is divided by 10.
According to Gleckler et al. (2008), the rankings for all models that considered the three factors of the Taylor diagram and the interannual variability skill score are summarized in Fig. 6. This figure depicts the overall performance of individual models. A smaller ranking value indicates a better performing model. The rankings for the Taylor diagram are the average of the rankings of SCC, RMSE, and ratio of variance. On the whole, the AMME outperforms its ensemble members in a comprehensive manner. For a given individual model, the performance ranks are somewhat different for different metrics. Considering the comprehensive performance for both spatial patterns and IVS, the relatively “highest-ranked” and “lowest-ranked” models are selected based on Fig. 6 and listed in Table 2. For these “highest-ranked” and “lowest-ranked” models, their comprehensive performances (arithmetic average of the rankings for Taylor Diagram and IVS) rank in the top three and bottom three among all models, respectively. Note that ACCESS-ESM1-5 and CESM2-WACCM (ACCESS-ESM1-5 and CESM2) show the same ranking for annual (summer) precipitation.
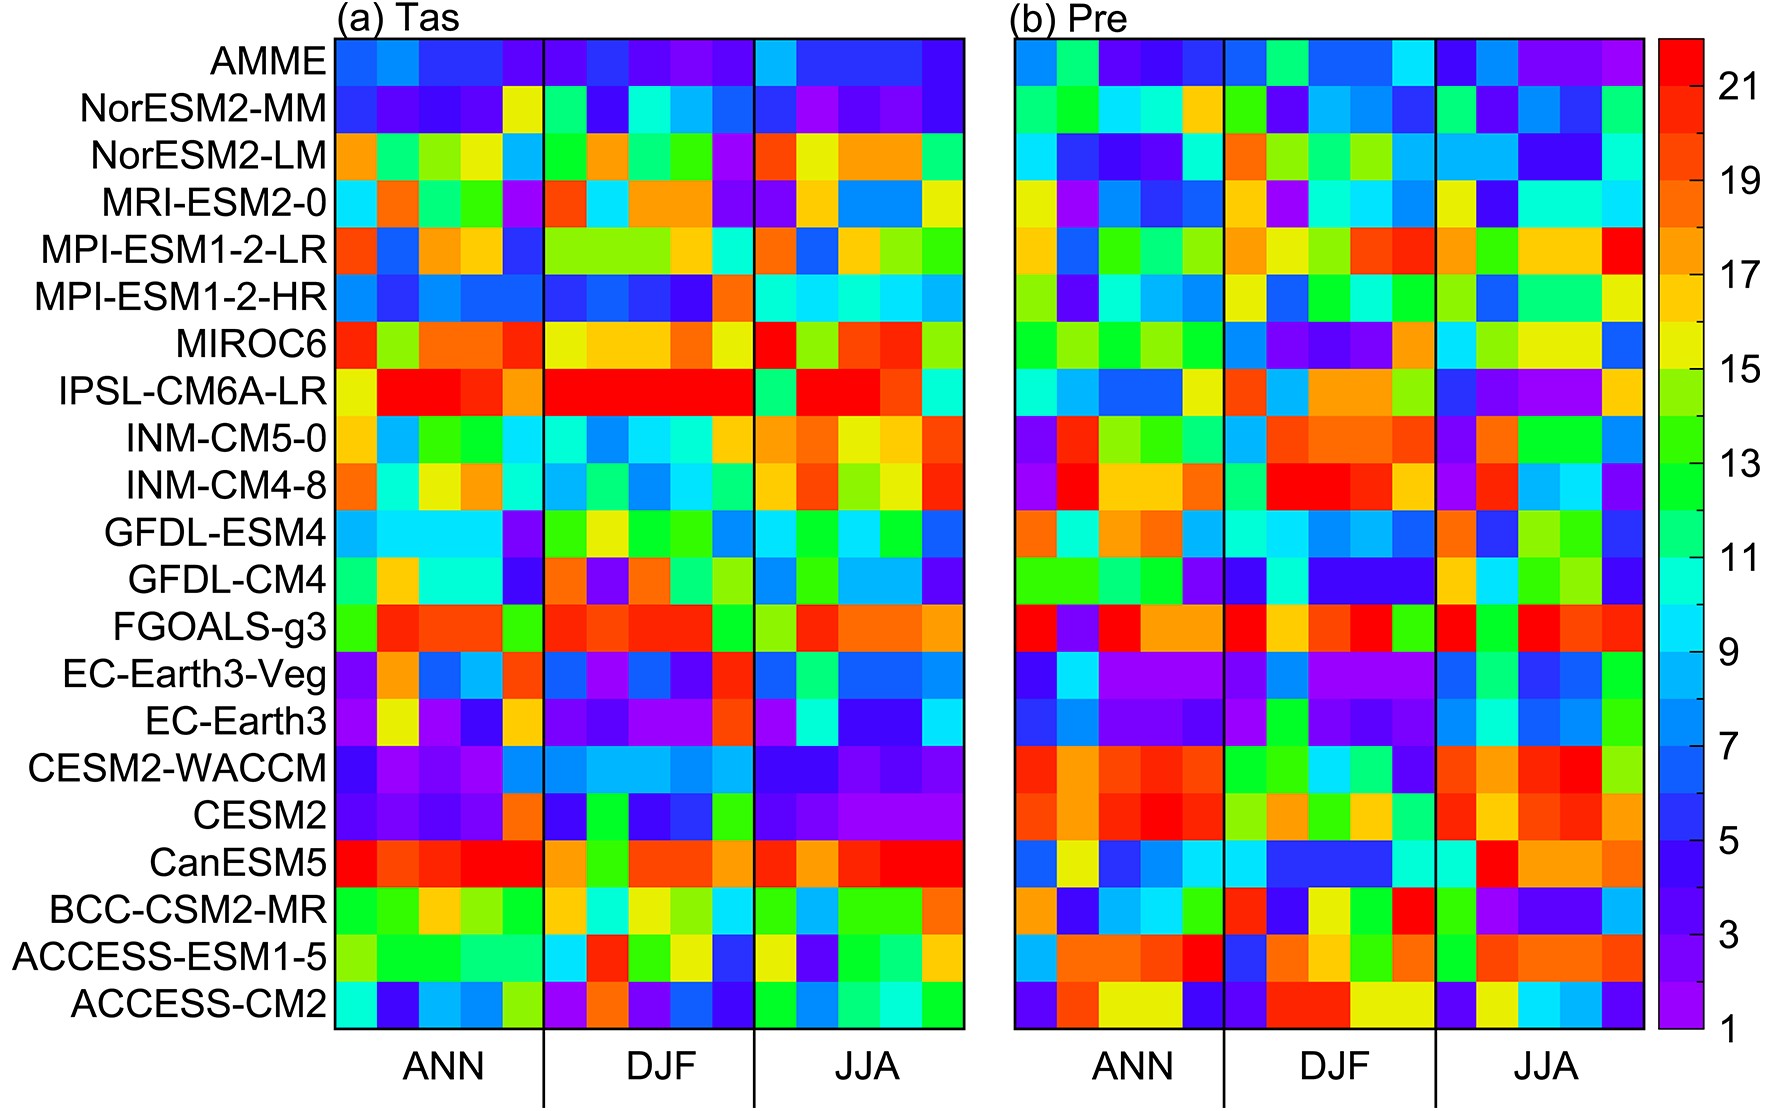 Figure6. Portrait diagram of the rankings of model performance for annual (ANN), winter (DJF), and summer (JJA) (a) temperature (units: °C) and (b) precipitation (units: mm). The colors in the label bar indicate the rankings. A smaller ranking number indicates a better model performance. Columns from the left to the right side in each group show the rankings of the SCC, ratio of variances, and RMSE, mean rankings of the three factors in the Taylor diagram, and IVS rankings, respectively.
| ANN | DJF | JJA | ||||||
| Highest ranked models | Lowest ranked models | Highest ranked models | Lowest ranked models | Highest ranked models | Lowest ranked models | |||
| Tas | CESM2-WACCM | CanESM5 | ACCESS-CM2 | CanESM5 | CESM2 | CanESM5 | ||
| GFDL-ESM4 | IPSL-CM6A-LR | CESM2-WACCM | IPSL-CM6A-LR | CESM2-WACCM | FGOALS-g3 | |||
| MPI-ESM1-2-HR | MIROC6 | NorESM2-MM | MIROC6 | NorESM2-MM | INM-CM5-0 | |||
| Pre | EC-Earth3 | ACCESS-ESM1-5 | EC-Earth3 | MPI-ESM1-2-LR | ACCESS-CM2 | ACCESS-ESM1-5 | ||
| EC-Earth3-Veg | CESM2 | EC-Earth3-Veg | INM-CM4-8 | BCC-CSM2-MR | CESM2 | |||
| MRI-ESM2-0 | CESM2-WACCM | GFDL-CM4 | INM-CM5-0 | INM-CM4-8 | FGOALS-g3 | |||
| FGOALS-g3 | MPI-ESM1-2-LR | |||||||
Table2. Highest and lowest ranking models selected for the ensembles for annual (ANN), winter (DJF), and summer (JJA) temperature and precipitation.
Some studies have shown that increasing the model resolution is an effective way to improve the performance of model simulations (Yao et al., 2017; Zhou et al., 2018b; Bador et al., 2020), thus we examine the relationships between the model performances and resolutions. The analyses show that the comprehensive performances of the models and their resolutions are significantly correlated. The correlation coefficients are 0.50 and 0.81 for annual and summer temperatures, respectively. The comprehensive performance of the models for winter precipitation also show a significant correlation of 0.65 with their resolutions, which is consistent with the previous finding that model resolution influences the simulation of winter precipitation in China (Gao et al., 2006; Jiang et al., 2016, 2020).
2
3.2. Comparison of different ensemble simulations
Figure 7 shows the spatial distributions of the biases from the “highest-ranked” model ensemble (hereafter BMME) and the “lowest-ranked” model ensemble (hereafter WMME) for annual temperature and precipitation. Compared with the AMME simulation (Fig. 2g), the cold bias over the Tibetan Plateau is reduced in the BMME simulation (Fig. 7a) and augmented in the WMME simulation (Fig. 7b). The regionally averaged BMME, AMME, and WMME biases in SWC1 are ?1.3°C, ?2.0°C, and ?4.3°C, respectively (Fig. 8a). From a seasonal perspective, the performance of the BMME for winter temperature is better than that of the AMME and WMME simulations over SWC1, CC, EC, SC, and SWC2 (Fig. 8c). However, due to an overall warm bias, the BMME does not perform better than the AMME in simulating summer temperature but does indicate a smaller spread (Fig. 8e). Figure7. Spatial distributions of (a, c) BMME and (b, d) WMME simulation biases for annual (a, b) temperature (simulation minus observation, units: °C) and (c, d) precipitation [(simulation minus observation)/observation, units: %]. The black lines show the boundary of subregions.
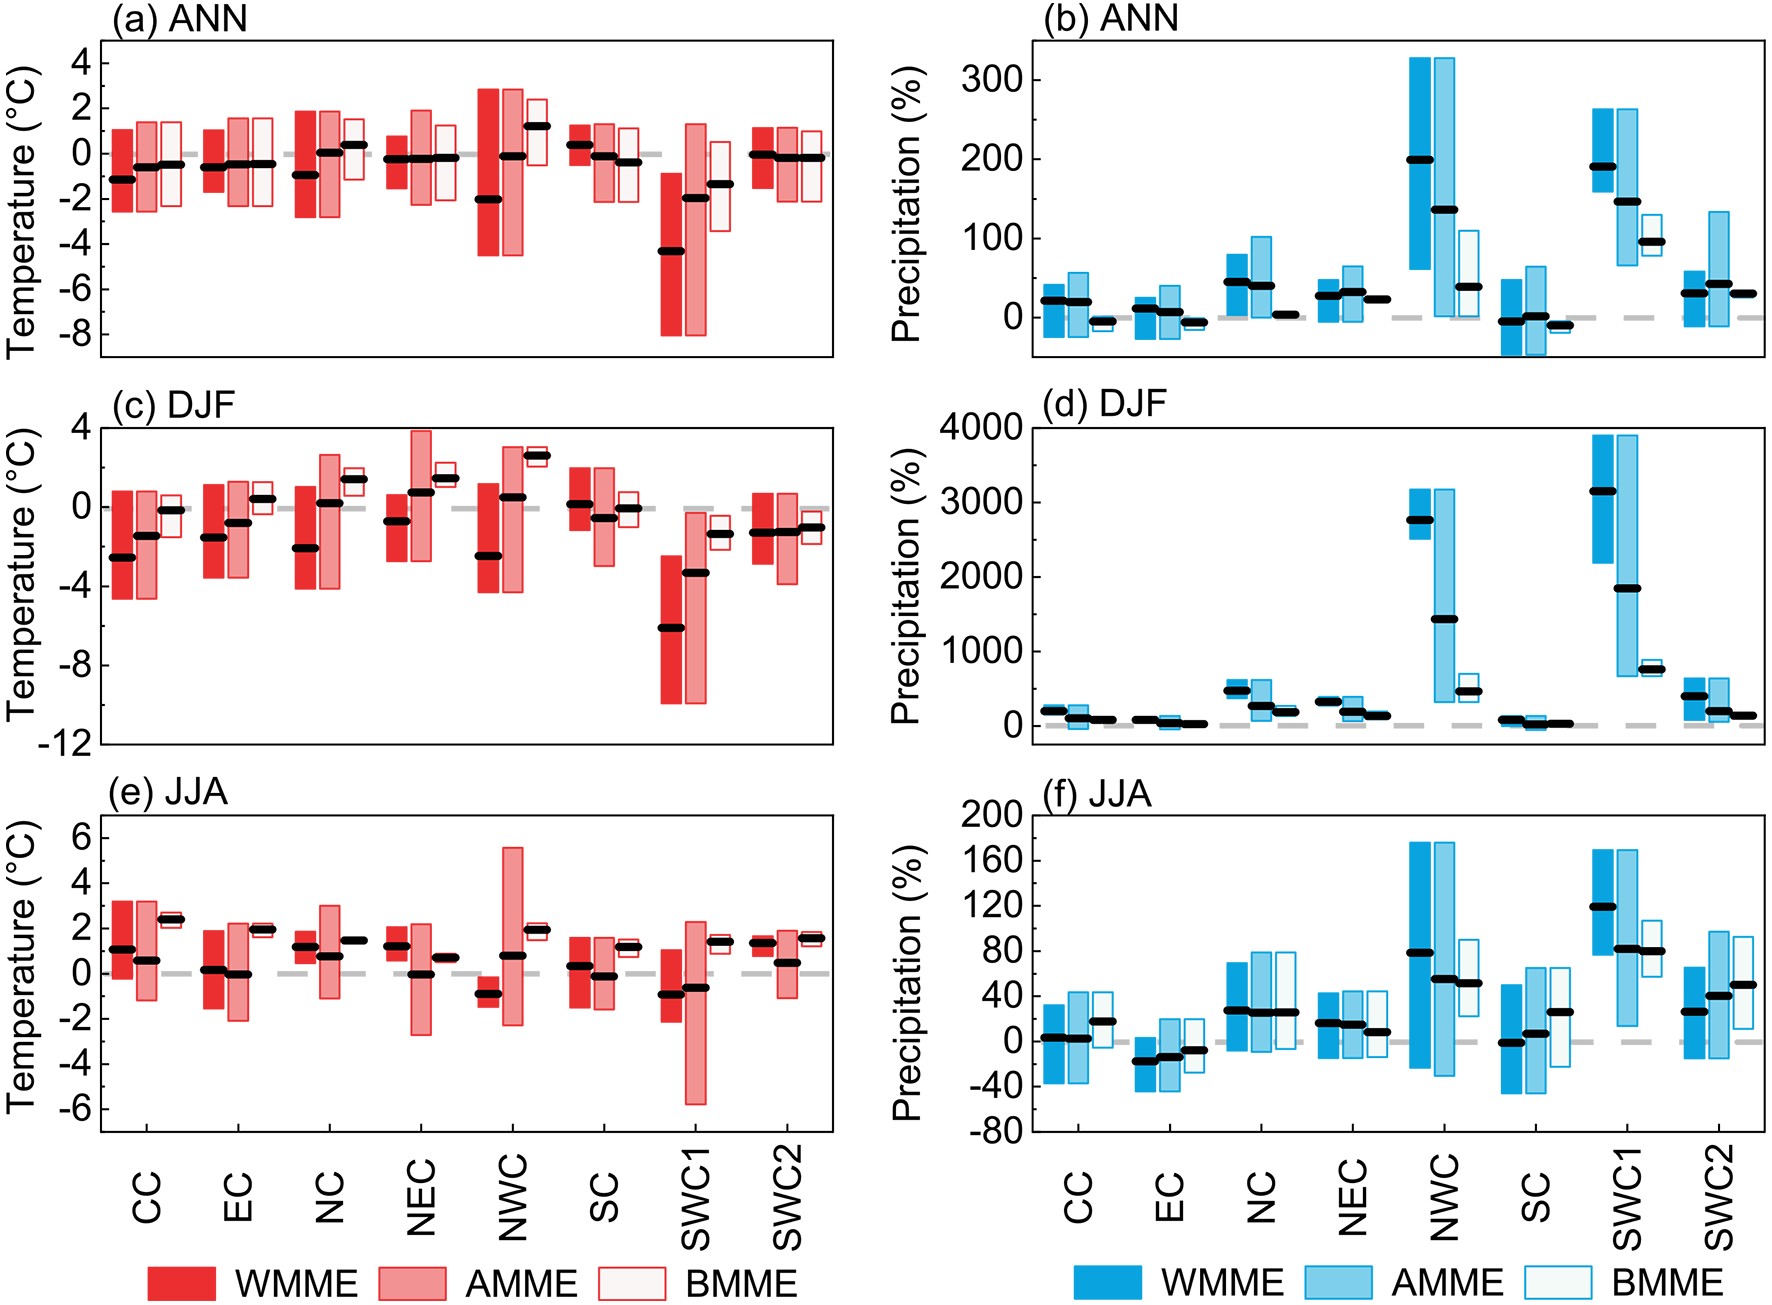 Figure8. Biases of the BMME, AMME, and WMME simulations for annual (ANN), winter (DJF), and summer (JJA) temperature (left panel, units: °C) and precipitation (right panel, units: %) in eight subregions of China. Boxes indicate the range of biases from the ensemble models and the black lines show the ensemble mean values. Note that the vertical scales are different.
For annual precipitation, the wet biases in the AMME simulation (Fig. 3g) decrease in the BMME simulation (Fig. 7c) and increase in the WMME simulation (Fig. 7d). When regionally averaged, the percentage-based wet biases over NWC, SWC1, NC, and NEC are 199%, 191%, 45%, and 28% respectively for the WMME simulation. These decrease to 136%, 147%, 40%, and 32% for the AMME simulation; the wet biases further reduce to 39%, 96%, 4%, and 23% in the BMME simulation, respectively (Fig. 8b). Similar results are obtained for the simulation of winter precipitation (Fig. 8d). Nevertheless, there is no improvement in the BMME simulation for summer precipitation over subregions except for EC, NWC, and NEC when compared to the AMME and WMME simulations, although the model spread is reduced.
In short, the BMME generally shows better performance than the AMME and WMME in reproducing the spatial patterns of annual and winter temperature and precipitation, particularly in subregions with complex terrain. Similarly, regardless of whether for annual, winter, or summer temperature (precipitation), the BMME presents the smallest IVS values, followed by the AMME and then by the WMME. The IVS values for annual, winter, and summer temperature (precipitation) over China are 0.1 (0.9), 0.2 (8.3), and 0.3 (1.0) from the BMME simulation, 0.2 (1.4), 0.3 (22.2), and 0.5 (1.0) from the AMME simulation, and 0.6 (2.4), 0.7 (43.4), and 1.1 (1.4) from the WMME simulation, respectively.
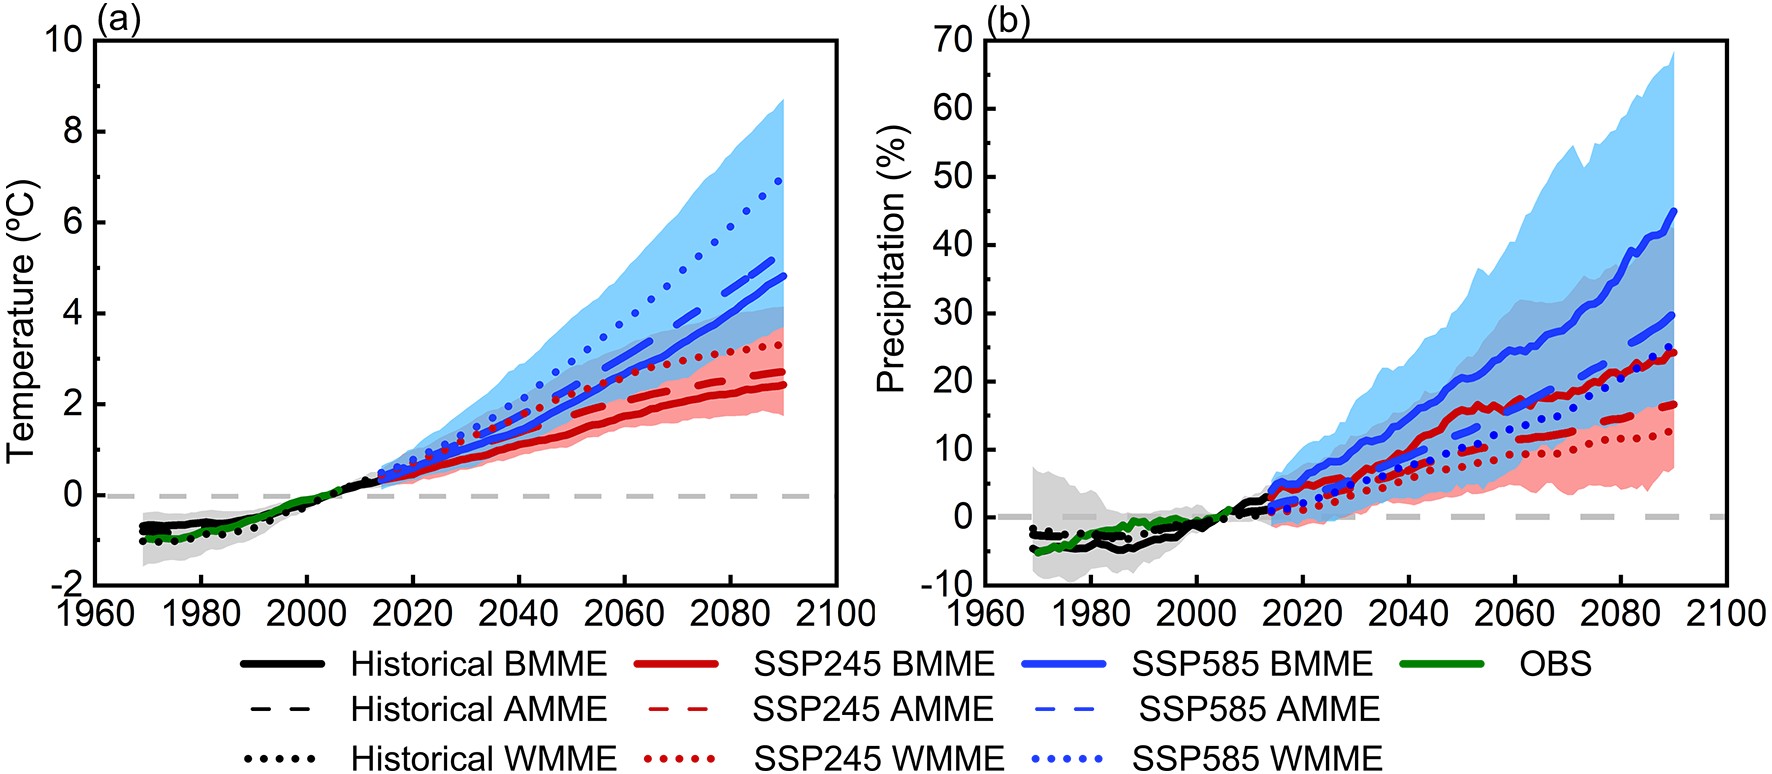 Figure9. Time series of annual (a) temperature (units: °C) and (b) precipitation (units: %) anomalies (relative to 1995–2014) over China for the observation (green), historical simulation (black), SSP245 (red), and SSP585 (blue). Solid, dashed, and dotted lines indicate the BMME, AMME, and WMME simulations, respectively. The shadings show the AMME ensemble spread. The time series are smoothed with a 20-yr running mean filter.
Figure 10 further illustrates the spatial distributions of the projected changes in annual temperature under SSP245 and SSP585 by the end of the 21st century. The annual temperature is projected to increase across China, with much stronger warming under SSP585. The greatest warming under SSP585 occurs at higher latitudes and higher elevations of China such as in NEC, NWC, and SWC1. In contrast, the warming is comparable across subregions under SSP245. Of particular interest, the warming magnitudes under both scenarios gradually increase from the BMME projection to the AMME projection and then to the WMME projection, which may be associated with different climate sensitivities in the models and/or regional land-atmosphere feedbacks (Zhou and Chen, 2015; Tokarska et al., 2020; Zelinka, et al., 2020). When regionally averaged over subregions (Fig. 11a), the BMME projects an increase of 2.1°C (SWC2) to 2.6°C (NC) under SSP245. The increases projected by the AMME range from 2.3°C (SWC2) to 2.9°C (NEC), which are slightly higher than the BMME projection in each subregion. Those projected by the WMME are in a range of 2.5°C (SC) to 3.7°C (SWC1), which are the highest among the three ensemble projections. Under SSP585, the greatest changes that exceed 5°C as projected by the AMME, occur in NEC (5.8°C), NWC (5.7°C), NC (5.4°C), and SWC1 (5.4°C). The magnitudes of increase over these subregions decrease to 5.2°C, 5.0°C, 4.9°C, and 4.8°C, respectively, in the BMME projection, while they increase to 7.6°C, 7.6°C, 7.1°C, and 7.4°C in the WMME projection, respectively. From a seasonal perspective, the AMME and WMME generally project larger increases in winter temperature than in summer temperature by the end of the 21st century under SSP585. The BMME projected increases in winter temperature are also larger than those of summer temperature in NEC, SWC1, SWC2, and SC, but it is reversed in NWC, NC, CC, and EC (Figs. 11b, c). In addition, the BMME projected increases in winter temperature are generally higher than the AMME projection and lower than the WMME projection (Fig. 11b); the increases in summer temperature from the BMME projection are larger than the AMME and WMME projections (Fig. 11c). Moreover, the spreads of the projections for annual, winter, and summer temperature from the BMME ensemble members are narrowed, compared with the projections from the AMME and WMME ensemble members (Figure not shown).
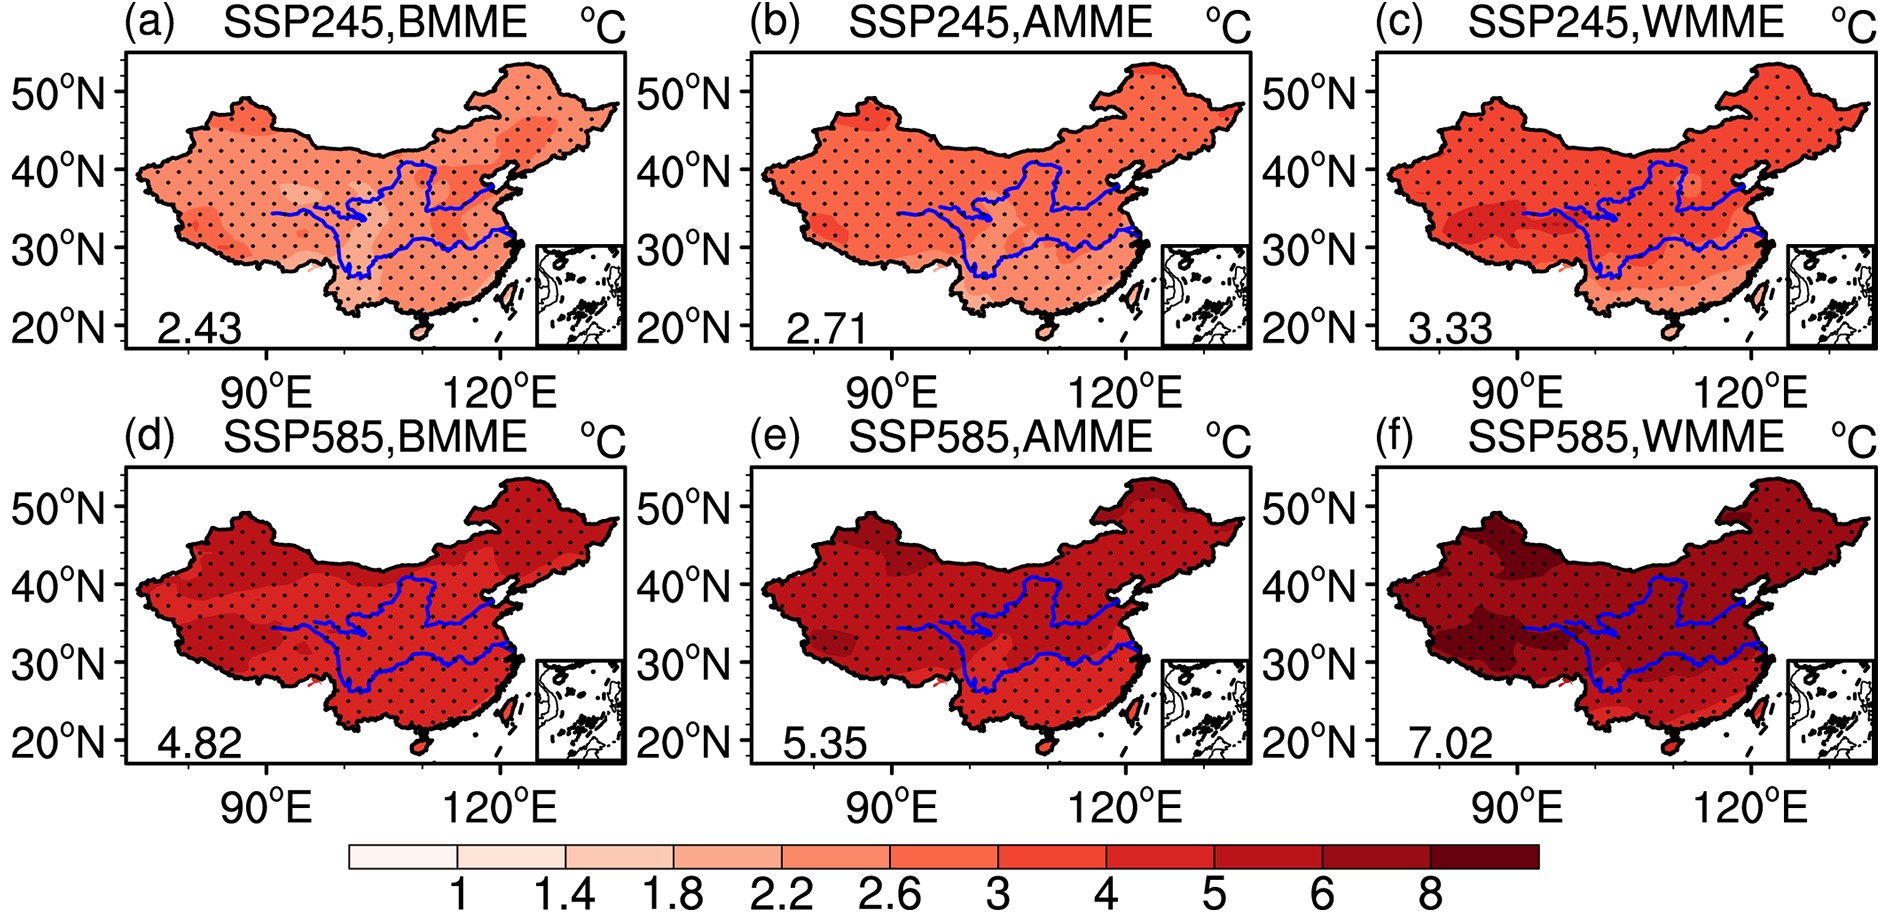 Figure10. Projected changes in annual temperature (units: °C) under (a–c) SSP245 and (d–f) SSP585 over the period 2081–2100 relative to the reference period 1995–2014 from (a, d) BMME, (b, e) AMME, and (c, f) WMME. Black solid dots indicate those grids with statistically significant changes at the 95% level. The values in the lower-left corners represent the changes averaged over China.
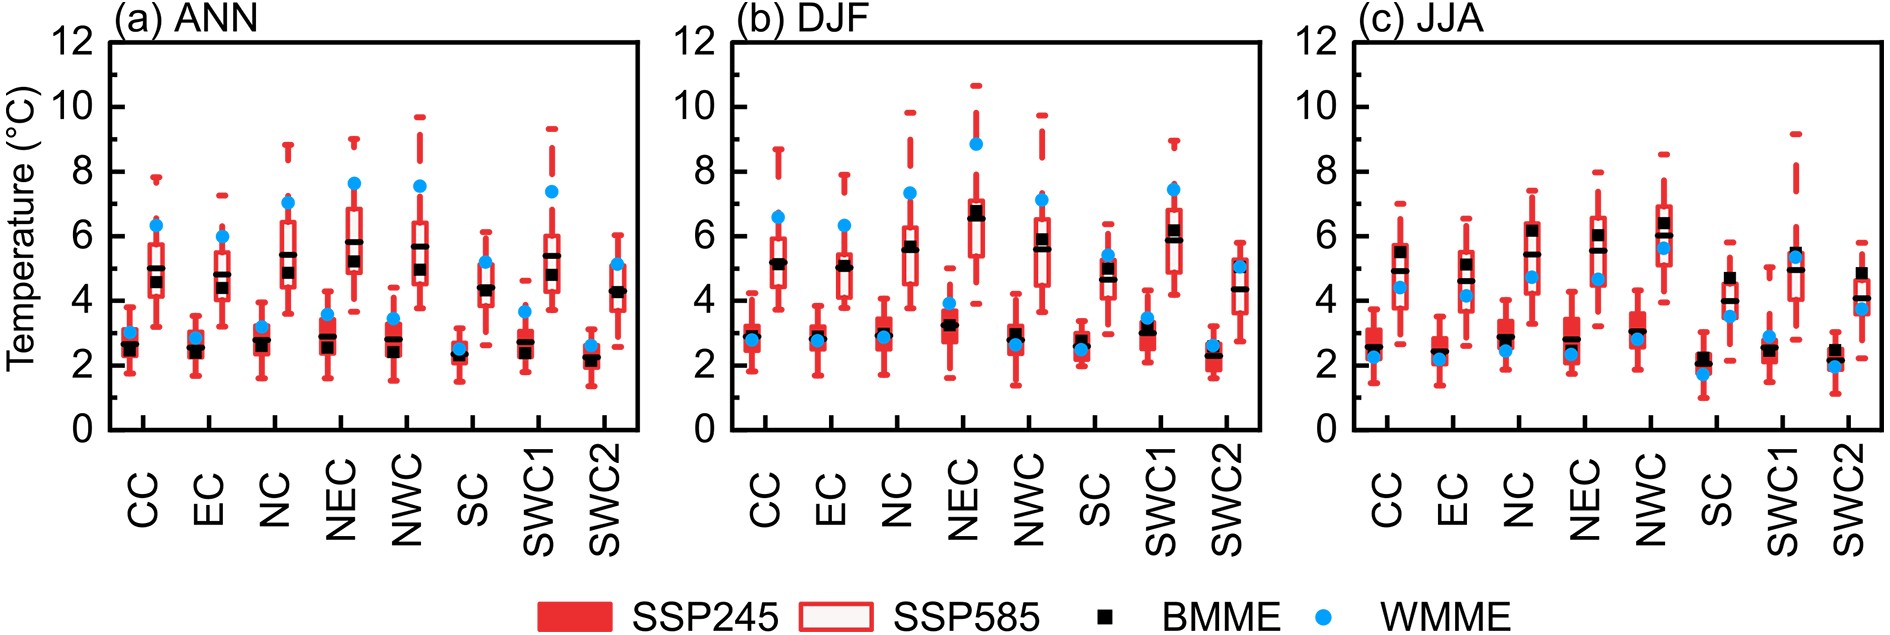 Figure11. Projected changes in (a) annual (ANN), (b) winter (DJF), and (c) summer (JJA) temperature (units: °C) under SSP245 and SSP585 over the period 2081–2100 relative to the reference period 1995–2014. Boxes indicate the interquartile model spread (i.e., 25th and 75th quantiles), horizontal lines indicate the AMME values, and whiskers show the AMME ensemble ranges. Black rectangles and blue solid dots represent the BMME and WMME values, respectively.
The spatial distributions of the projected percentage changes for annual precipitation under SSP245 and SSP585 are shown in Fig. 12. By the end of the 21st century, the annual precipitation is projected to increase uniformly across the country, and the magnitude of the increase is greater under SSP585 than under SSP245. Moreover, the projected percentage increases are larger in northern China than in southern China. The largest increase is anticipated over western China due to the drier climate toward the north and northwest areas, which is consistent with the CMIP5 projection (Zhou et al., 2014). Although the three ensembles show resemblances in their spatial distributions for the projected changes, salient differences exist in the magnitudes among the projections. For instance, compared with the AMME projection under SSP585 (Fig. 12e), the percentage increases of annual precipitation over northern and western China are enhanced in the BMME projection, whereas they are reduced in the WMME projection. There are no obvious differences among the three ensembles for the precipitation projections over eastern China.
 Figure12. Same as in Fig. 10, but for annual precipitation (units: %).
Figure 13a summarizes the projected percentage changes in annual precipitation over subregions. Under SSP585, annual precipitation amounts, as projected by the BMME in NWC, NC, NEC, and SWC1 (i.e., northern and western regions of China) are expected to increase by 81%, 43%, 35%, and 32% at the end of the 21st century, respectively, which are larger than those of the AMME projection (45%, 30%, 25%, 29%, respectively) and the WMME projection (33%, 21%, 20%, 29%, respectively). Note that the historical simulation of the BMME shows the smallest biases from the observation in these subregions (Fig. 8b). The case for the SSP245 scenario is generally similar but with smaller magnitudes of percentage increase. Seasonal changes in precipitation in winter (Fig. 13b) and summer (Fig. 13c), as projected from the three ensembles under SSP585, generally approximate those of annual precipitation in the above subregions. We also notice that the magnitudes of percentage increases are much more pronounced in winter than in summer. For example, in the NWC, NC, and NEC subregions, the increases of winter precipitation from the BMME projection are 262%, 145%, and 106%, compared with 28%, 30%, and 29% increases for summer, respectively. This result suggests a relatively larger contribution to annual precipitation change from the increased winter precipitation. However, because of the different climatology of seasonal precipitation, it may not necessarily reflect the absolute changes in precipitation values. A similar seasonal change but with smaller magnitudes of percentage increase is noted in CC. The opposite seasonal pattern is projected in SC, where the projected percentage increases in summer are larger than those in winter. The cases for other subregions (e.g., SWC2 and EC) are diverse for the three ensemble projections.
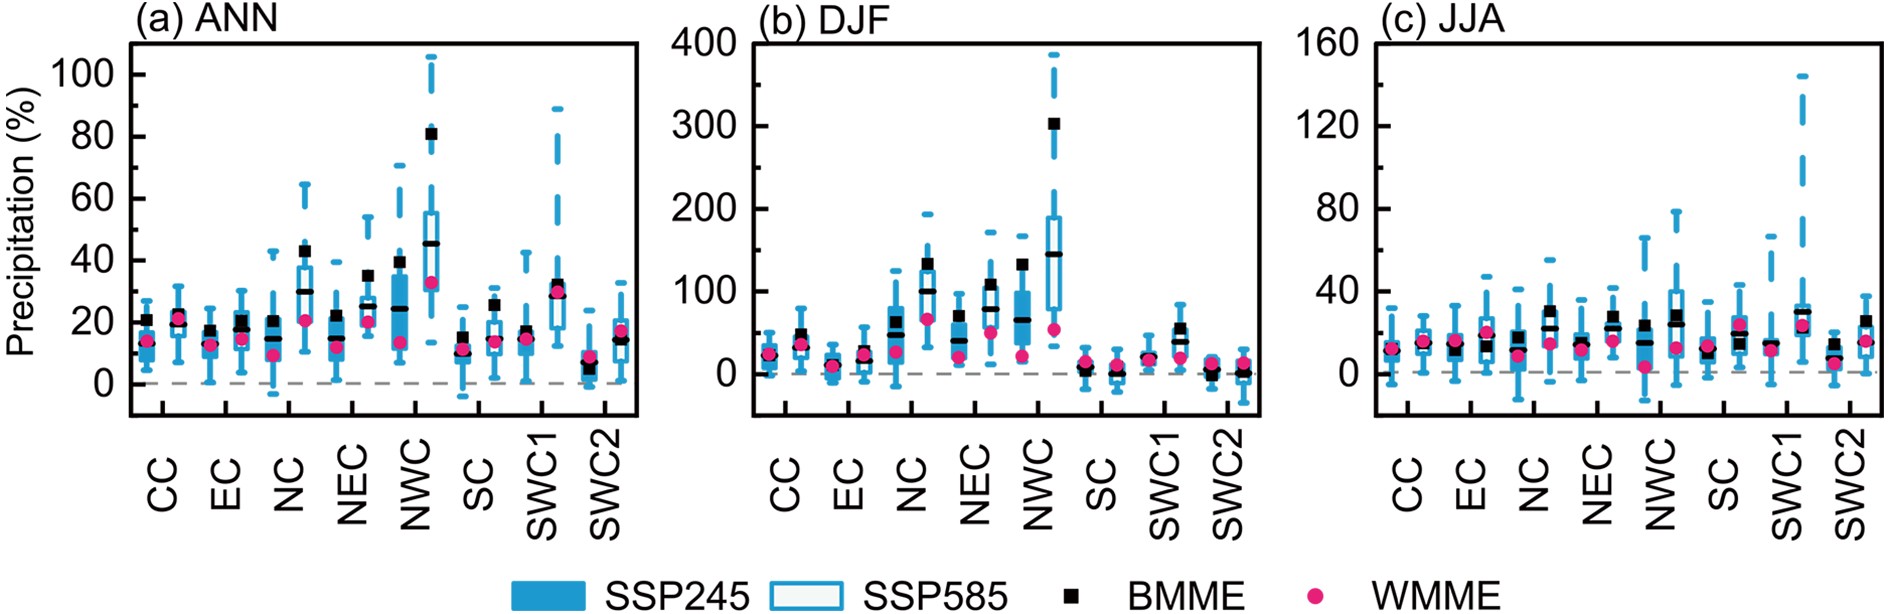 Figure13. Same as in Fig. 11, but for precipitation (units: %). Note that the vertical scales are different.
(1) The BMME outperforms the AMME and WMME for the simulation of annual and winter temperature and precipitation, particularly in those subregions with complex terrain. Nevertheless, there is no salient improvement for summer temperature or precipitation over most of the subregions.
(2) The three ensembles all project increased temperature and precipitation over China by the end of the 21st century, accompanied by larger increases under SSP585 than under SSP245. For the SSP585 scenario, the greatest warming is projected to occur at higher latitudes and at higher elevations of China (such as in NEC, NWC, and SWC1). The largest percentage-based increase in annual precipitation is anticipated in northern and western China.
(3) The three ensembles project different magnitudes of increase in temperature and precipitation. By the end of the 21st century under SSP585, the warming of annual temperature is the lowest in the BMME projection, which increases successively in the AMME and WMME projections. The BMME projected percentage increases in annual, summer, and winter precipitation over northern and western China are larger than those projected from the AMME and WMME.
Acknowledgements. We acknowledge the World Climate Research Program’s Working Group on Coupled Modeling and thank the climate modeling groups for producing and sharing their model outputs. This research was jointly supported by the National Key Research and Development Program of China (2018YFA0606301) and the National Natural Science Foundation of China (42025502, 41991285, 42088101).
