HTML
--> --> -->Thus, snow over Arctic sea ice is an essential climate variable in diagnosing changes in the surface heat and freshwater budget of the Arctic climate system and mass balance of sea ice. Because of amplified warming in the Arctic, and the potential role of the Arctic in rapid climate change, it is important to know how well coupled global climate models simulate snow depth over Arctic sea ice, so that the representation of physical processes in the Arctic Ocean can be improved and uncertainties in the projections of future climate change can be reduced. Hezel et al. (2012) validated the multi-model mean snow depth in the Arctic archived by phase 5 of the Coupled Model Intercomparison (CMIP5) against the observational data reported by Warren et al. (1999) and IceBridge data (Kwok et al., 2011) for April only and found an underestimation by the CMIP5 models. Light et al. (2015) suggested that summer Arctic snowfall events and associated effects on sea-ice conditions are not well represented in Community Climate System Model version 4 (CCSM4) simulations (Gent et al., 2011). Blazey et al. (2013) showed that biases in precipitation and omission of snow processes in CCSM4 likely lead to wrong reproductions in snow depth over sea ice. To date, there is very limited research on the assessment of model-simulated snow depth over sea ice, which is largely owing to a lack of high-quality Arctic-wide and long-term snow depth observation data.
Recently, phase 6 of the Coupled Model Intercomparison Project (CMIP6; Eyring et al. 2016) has released the latest climate model simulations whose ability to simulate current climate has been improved. Meanwhile, the Sea-Ice Model Intercomparison Project (SIMIP) has been endorsed by CMIP6, which aims to define a comprehensive set of diagnostics for a better understanding of the role of sea ice for the changing climate (Notz et al., 2016). Snow depth on sea ice is one of the most fundamental variables that SIMIP requests to quantify the physical cause and location of ice growth and melt (Notz et al., 2016).
The goal of this paper is to provide a comprehensive evaluation of the simulations for historical snow depth over sea ice in the Arctic basin and how snow depth may change in the future. Specifically, we want to answer the following three questions:
(1) How well do CMIP6 models perform in reproducing the historical snow depth over Arctic sea ice from the perspectives of climatology, interannual variability, and trend?
(2) How will snow depth in the Arctic basin change in the future compared to the present day under different emission scenarios?
(3) What are the possible effects of different configurations of the CMIP6 models (coarse/fine resolution etc.) on the simulations of snow depth over Arctic sea ice?
2.1. Satellite-derived snow depth
To assess the capability of current state-of-the-art global climate models in simulating snow depth over Arctic sea ice, a recently developed satellite-based snow depth dataset is used in this study. This dataset is retrieved from the brightness temperatures measured by the Special Sensor Microwave Imager/Sounder at all frequencies using an ensemble-based deep neural network, and validated against snow depth measured by the sea-ice mass balance buoy [see Liu et al. (2019) for details]. This satellite-based snow depth dataset (referred to as SD-LZ19 hereafter) is available for both first-year sea ice (FYI) and multi-year sea ice (MYI), as well as during the melting period since 1993. SD-LZ19 has higher correlations and lower root-mean-square errors than previous Arctic-wide snow depth datasets and provides better snow depth estimates over Arctic sea ice (Liu et al., 2019). Figure 1 shows the annual mean snow depth climatology and uncertainty of SD-LZ19. The thickest snow (~30–40 cm) is found in the areas north of Greenland and the Canadian Archipelago, and the thinner snow dominates the periphery of the Arctic Basin (see details in section 3.2.1). The largest uncertainty of SD-LZ19 is also in the areas covered by the thickest snow (about 10 cm), and the uncertainty decreases toward the Eurasian Basin to approximately 2–5 cm (Fig. 1b). In the central Arctic, the uncertainty is roughly in the range of 5–9 cm. Here, the monthly-mean snow depth is calculated from the original SD-LZ19 data with a daily temporal resolution and then interpolated onto the grid with a horizontal resolution of 1° × 1° from the original polar stereographic grid with a spatial resolution of 25 km. The snow depth climatology developed by the sea-ice remote sensing group of the University of Bremen using the brightness temperatures from AMSR-2 (SD-UB AMSR2) is used as an additional satellite retrieval of snow depth over Arctic sea ice ( Figure1. (a) Annual mean snow depth climatology of SD-LZ19 during 1993–2014 (units: cm). (b) Uncertainties of SD-LZ19 (units: cm). (c) Mask of areas with high frequency of occurrence of multi-year sea ice (yellow) and first-year sea ice (blue).
To facilitate the analysis of snow depth over the areas frequently covered by different types of sea ice (FYI vs MYI), a weekly sea-ice age dataset during 1993–2014 is obtained from the National Snow and Ice Data Center (
2
2.2. CMIP6 climate models
The simulated monthly-mean snow depths are obtained from coupled climate models archived at the CMIP6 portal based on data availability (Eyring et al., 2016). Specifically, we utilize 31 and 21 models, respectively, for the historical simulation (1993–2014) and the future projection (2015–99) under the two scenarios of SSP2-4.5 and SSP5-8.5 (O’Neill et al., 2016; Gidden et al., 2019; see Table 1 for details). The future projections are driven by a new set of emission and land-use scenarios produced with integrated assessment models based on new future pathways of societal development, the Shared Socioeconomic Pathways (SSPs), which are similar to the corresponding CMIP5 Representative Concentration Pathways (RCPs; Taylor et al., 2012). The SSP2-4.5 (SSP5-8.5) scenario represents a medium (high) increase in the radiative forcing by 4.5 (8.5) W m?2 in the year 2100 compared to the pre-industrial level. Here, only the first realization (r1i1p1f1) from each model is analyzed. Since each of the CMIP6 models has its own grid configuration, the simulated snow depth over Arctic sea ice is interpolated from model grids to the grid with a spatial resolution of 1° × 1°. To ensure the comparability between CMIP6 simulations and SD-LZ19, the same mask shown in Fig. 1c is used for all the models. The domain selected for this assessment encompasses the Arctic Ocean and peripheral seas. The common period for all the data is 1993–2014, since the observed snow depth starts in 1993 and the historical simulation ends in 2014.| No. | Model | Modeling group | Approximate resolution (km) | |||
| Atmos. | Land | Ocean | Sea ice | |||
| 1 | ACCESS-CM2* | Commonwealth Scientific and Industrial Research Organisation - Australian Research Council Centre of Excellence for Climate System Science | 250 | 250 | 100 | 100 |
| 2 | ACCESS-ESM1-5* | Commonwealth Scientific and Industrial Research Organisation - Australian Research Council Centre of Excellence for Climate System Science | 250 | 250 | 100 | 100 |
| 3 | AWI-CM-1-1-MR* | Alfred Wegener Institute | 100 | 100 | 50 | 50 |
| 4 | BCC-CSM2-MR* | Beijing Climate Center | 100 | 100 | 50 | 50 |
| 5 | BCC-ESM1 | Beijing Climate Center | 250 | 250 | 50 | 50 |
| 6 | CAMS-CSM1-0* | Chinese Academy of Meteorological Sciences | 100 | 100 | 100 | 100 |
| 7 | CAS-ESM2-0 | Chinese Academy of Sciences | 100 | 100 | 100 | 100 |
| 8 | CESM2-FV2 | National Center for Atmospheric Research | 250 | 250 | 100 | 100 |
| 9 | CESM2-WACCM-FV2 | National Center for Atmospheric Research | 250 | 250 | 100 | 100 |
| 10 | CESM2-WACCM* | National Center for Atmospheric Research | 100 | 100 | 100 | 100 |
| 11 | CESM2* | National Center for Atmospheric Research | 100 | 100 | 100 | 100 |
| 12 | CanESM5* | Canadian Centre for Climate Modelling and Analysis | 500 | 500 | 100 | 100 |
| 13 | E3SM-1-0 | E3SM-Project | 100 | 100 | 50 | 50 |
| 14 | E3SM-1-1-ECA | E3SM-Project | 100 | 100 | 50 | 50 |
| 15 | E3SM-1-1 | E3SM-Project | 100 | 100 | 50 | 50 |
| 16 | EC-Earth3-Veg* | EC-Earth-Consortium | 100 | 100 | 100 | 100 |
| 17 | EC-Earth3* | EC-Earth-Consortium | 100 | 100 | 100 | 100 |
| 18 | FGOALS-f3-L* | Institute of Atmospheric Physics, Chinese Academy of Sciences | 100 | 100 | 100 | 100 |
| 19 | FIO-ESM-2-0* | First Institute of Oceanography - Qingdao National Laboratory for Marine Science and Technology | 100 | 100 | 100 | 100 |
| 20 | GFDL-CM4* | National Oceanic and Atmospheric Administration, Geophysical Fluid Dynamics Laboratory | 100 | 100 | 25 | 25 |
| 21 | GFDL-ESM4* | National Oceanic and Atmospheric Administration, Geophysical Fluid Dynamics Laboratory | 100 | 100 | 50 | 50 |
| 22 | IPSL-CM6A-LR* | Institut Pierre Simon Laplace | 250 | 250 | 100 | 100 |
| 23 | MIROC6 | MIROC | 250 | 250 | 100 | 100 |
| 24 | MPI-ESM-1-2-HAM | HAMMOZ-Consortium | 250 | 250 | 250 | 250 |
| 25 | MPI-ESM1-2-HR* | Max Planck Institute for Meteorology | 100 | 100 | 50 | 50 |
| 26 | MPI-ESM1-2-LR* | Max Planck Institute for Meteorology | 250 | 250 | 250 | 250 |
| 27 | MRI-ESM2-0* | Meteorological Research Institute | 100 | 100 | 100 | 100 |
| 28 | NESM3* | Nanjing University of Information Science and Technology | 250 | 2.5 | 100 | 100 |
| 29 | NorCPM1 | NorESM Climate modeling Consortium | 250 | 250 | 100 | 100 |
| 30 | NorESM2-LM* | NorESM Climate modeling Consortium | 250 | 250 | 100 | 100 |
| 31 | NorESM2-MM* | NorESM Climate modeling Consortium | 100 | 100 | 100 | 100 |
| Notes: the 21 models marked with an asterisk (*) were used for the future projections. | ||||||
Table1. List of CMIP6 models used in this study and their resolutions.
3.1. Temporal variation
33.1.1. Seasonal cycle
Figure 2 shows the seasonal cycle of the Arctic-wide averaged snow depth calculated from the 31 CMIP6 models, SD-LZ19, and SD-UB AMSR2. According to SD-LZ19, the seasonal variation of snow depth over Arctic sea ice reaches a maximum in March (24.8 cm) and minimum in August (7.3 cm) (Fig. 2). The amplitude of the observed snow depth season cycle is 17.6 cm, which is calculated by subtracting the minimum value from the maximum value. SD-LZ19 shows that the snow depth grows quickly from August (7.3 cm) to December (23.6 cm) and it tends to increase very slowly to the succeeding March. After that, it decreases until August. The uncertainty for each individual month of the SD-LZ19 snow depth is approximately 7.2 cm from November to June, which is relatively larger than that from July to October (~3.9 cm, Fig. 2). The snow depth of SD-UB AMSR2 is about 2–4 cm smaller than that of SD-LZ19 from October to April. Note that the temporal coverage of SD-UB AMSR2 is after 2012, whereas SD-LZ19 covers 1993–2014. The snow depth difference between SD-UB AMSR2 and SD-LZ19 is in part due to the different time period. SD-UB AMSR2 also shows that the snow depth increases very slowly after December and maximizes in March (22.1 cm).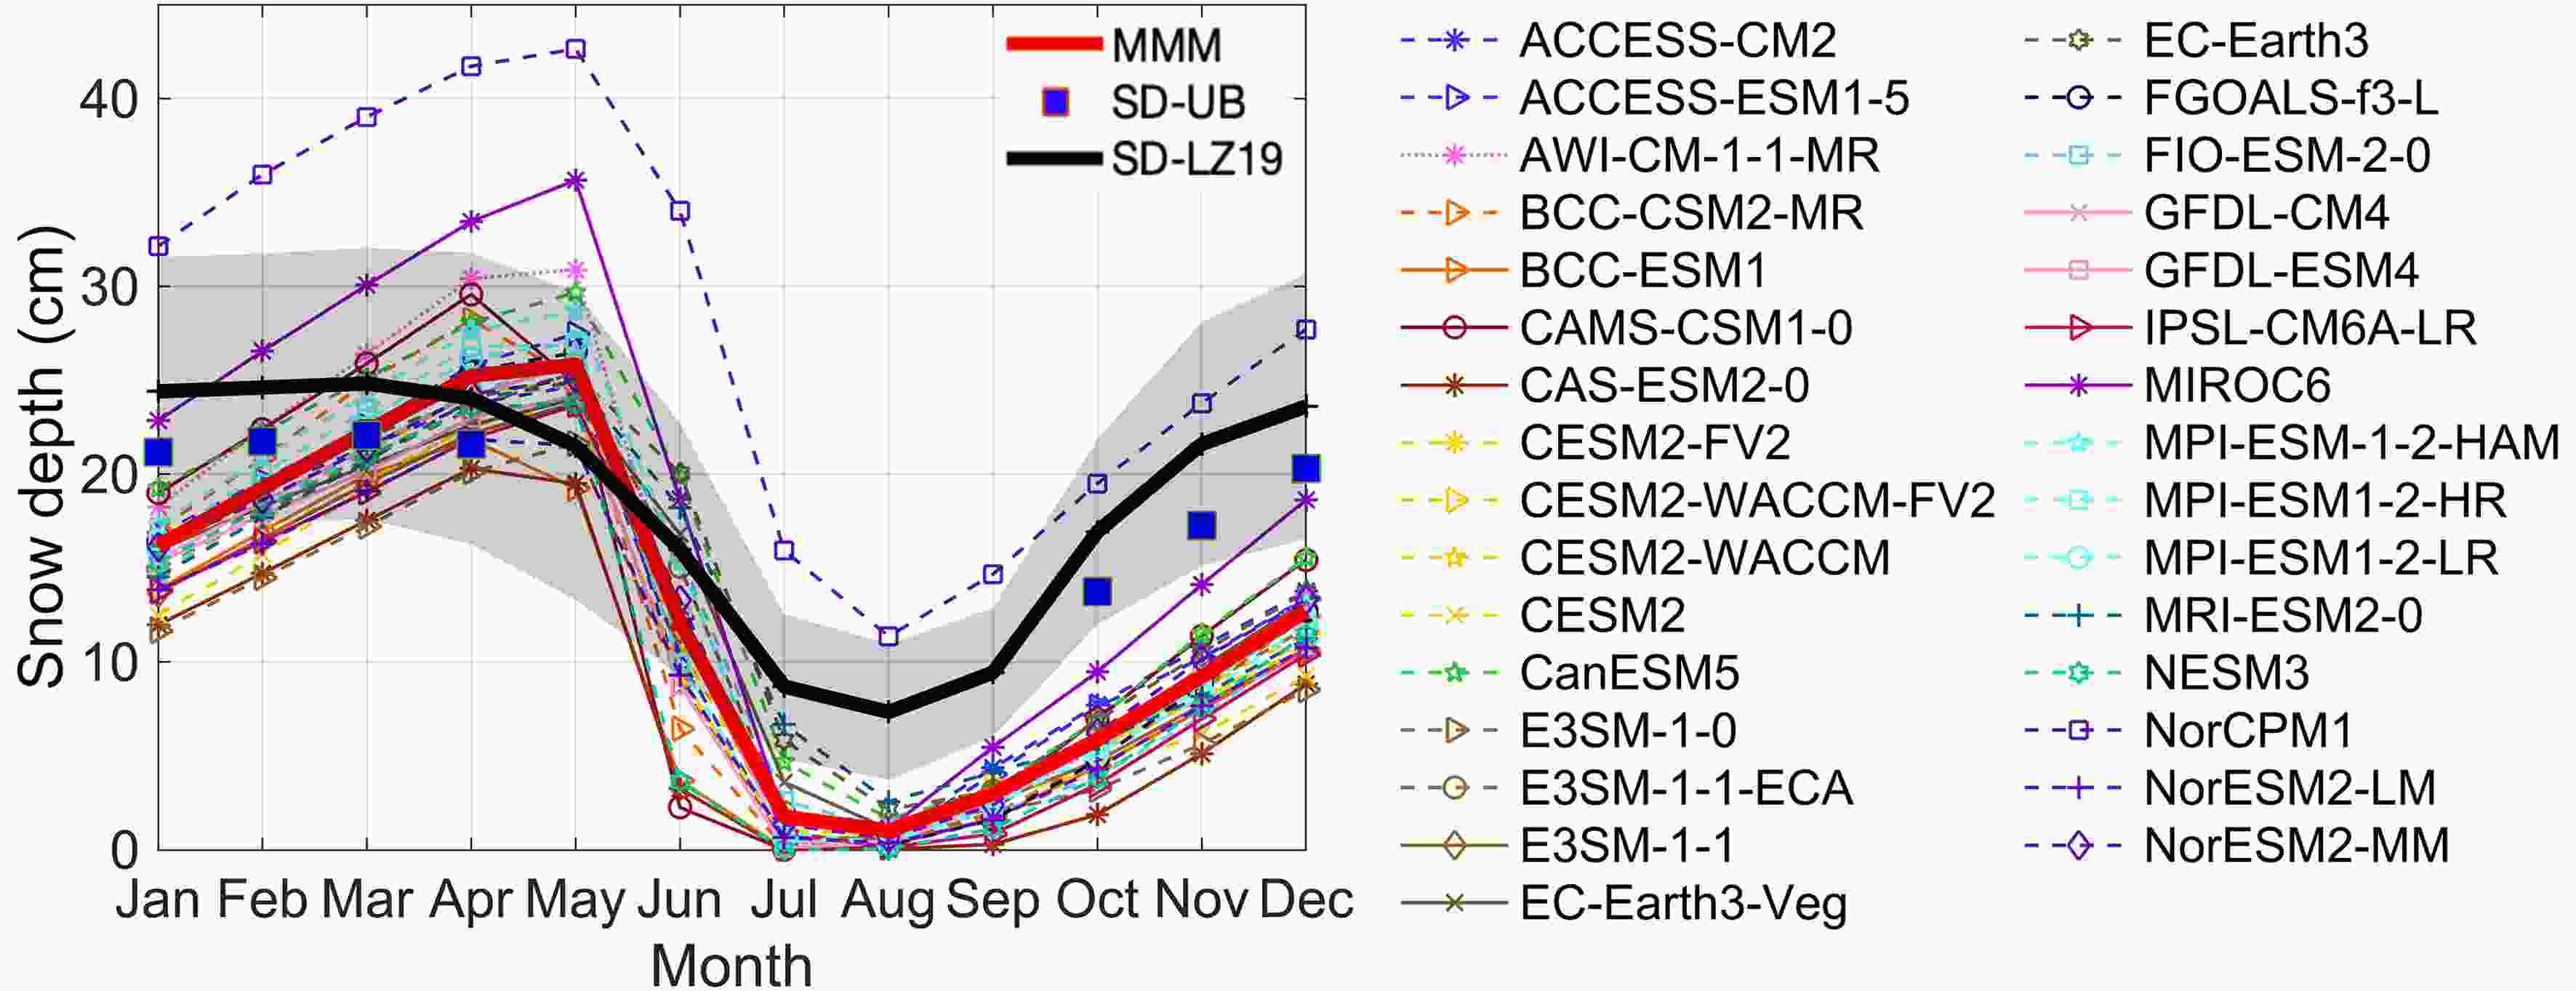 Figure2. Seasonal cycles of Arctic-wide averaged snow depth (unit: cm). The thick black line represents SD-LZ19 and the thick red line represents the CMIP6 MMM. Thin various-colored lines represent each individual CMIP6 model. The gray shaded area represents the uncertainty of the SD-LZ19 seasonal cycle. Blue dots represent snow depth from SD-UB AMSR2, which is only available after 2012 from October to April.
The multi-model ensemble mean (MMM) shows that the maximum snow depth occurs in May (25.8 cm), which is two months later than that from the observation. Among the 31 models, 26 models have the maximum snow depth in May and the other 5 maximize in April. The minimum snow depth of the MMM occurs in August, which is consistent with the observation, but its magnitude is remarkably smaller than that of the observation (1 cm vs 7.3 cm). A total of 22 out of 31 models have the minimum snow depth in August and the other 9 models minimize in July. As a result, the MMM has a larger seasonal variation (24.8 cm) relative to that of the observation (17.6 cm) (Fig. 2). Unlike SD-LZ19 and SD-UB AMSR2, the MMM has an extended growth period to the succeeding May (two months longer than both satellite retrievals). The MMM also produces a much larger decrease in snow depth during the decay period, especially from May to July, compared to SD-LZ19. Thus, the CMIP6 models have certain problems in reproducing the observed season-to-season variability, especially the transition from the growth to the decay period. Both SD-LZ19 and SD-UB AMSR2 show thicker snow depth than the MMM from October to February, which indicates that the CMIP6 models underestimate the Arctic-wide averaged snow depth during the freeze-up period.
Some significant differences are found between each individual model simulation and satellite observation. Specifically, NorCPM1 simulates extremely large snow depth (Figs. 2, 3 and 4a), with thick biases for all the months compared to other models and the observation (the annual mean values are 28.2 and 18.5 cm for NorCPM1 and SD-LZ19, respectively). In addition to NorCPM1, MIROC6 produces much thicker snow compared to other models, but mainly from December to May. The spread of the simulated snow depth among the models can be as large as 9.1 cm in March, a factor of 3.6 larger than that in August (2.5 cm), even with NorCPM1 and MIROC6 excluded. For the annual mean snow depth, only MIROC6 and CanESM5 are within one standard deviation (std) of the observed snow depth in SD-LZ19 (here, 1 std is calculated based on snow depth simulated by 31 models). However, MIROC6 is a balance of the thick snow bias from February to June and thin snow bias for the rest of the months compared to the observed one (Fig. 2). In total, 17 models are within 2 std of the observed snow depth in SD-LZ19.
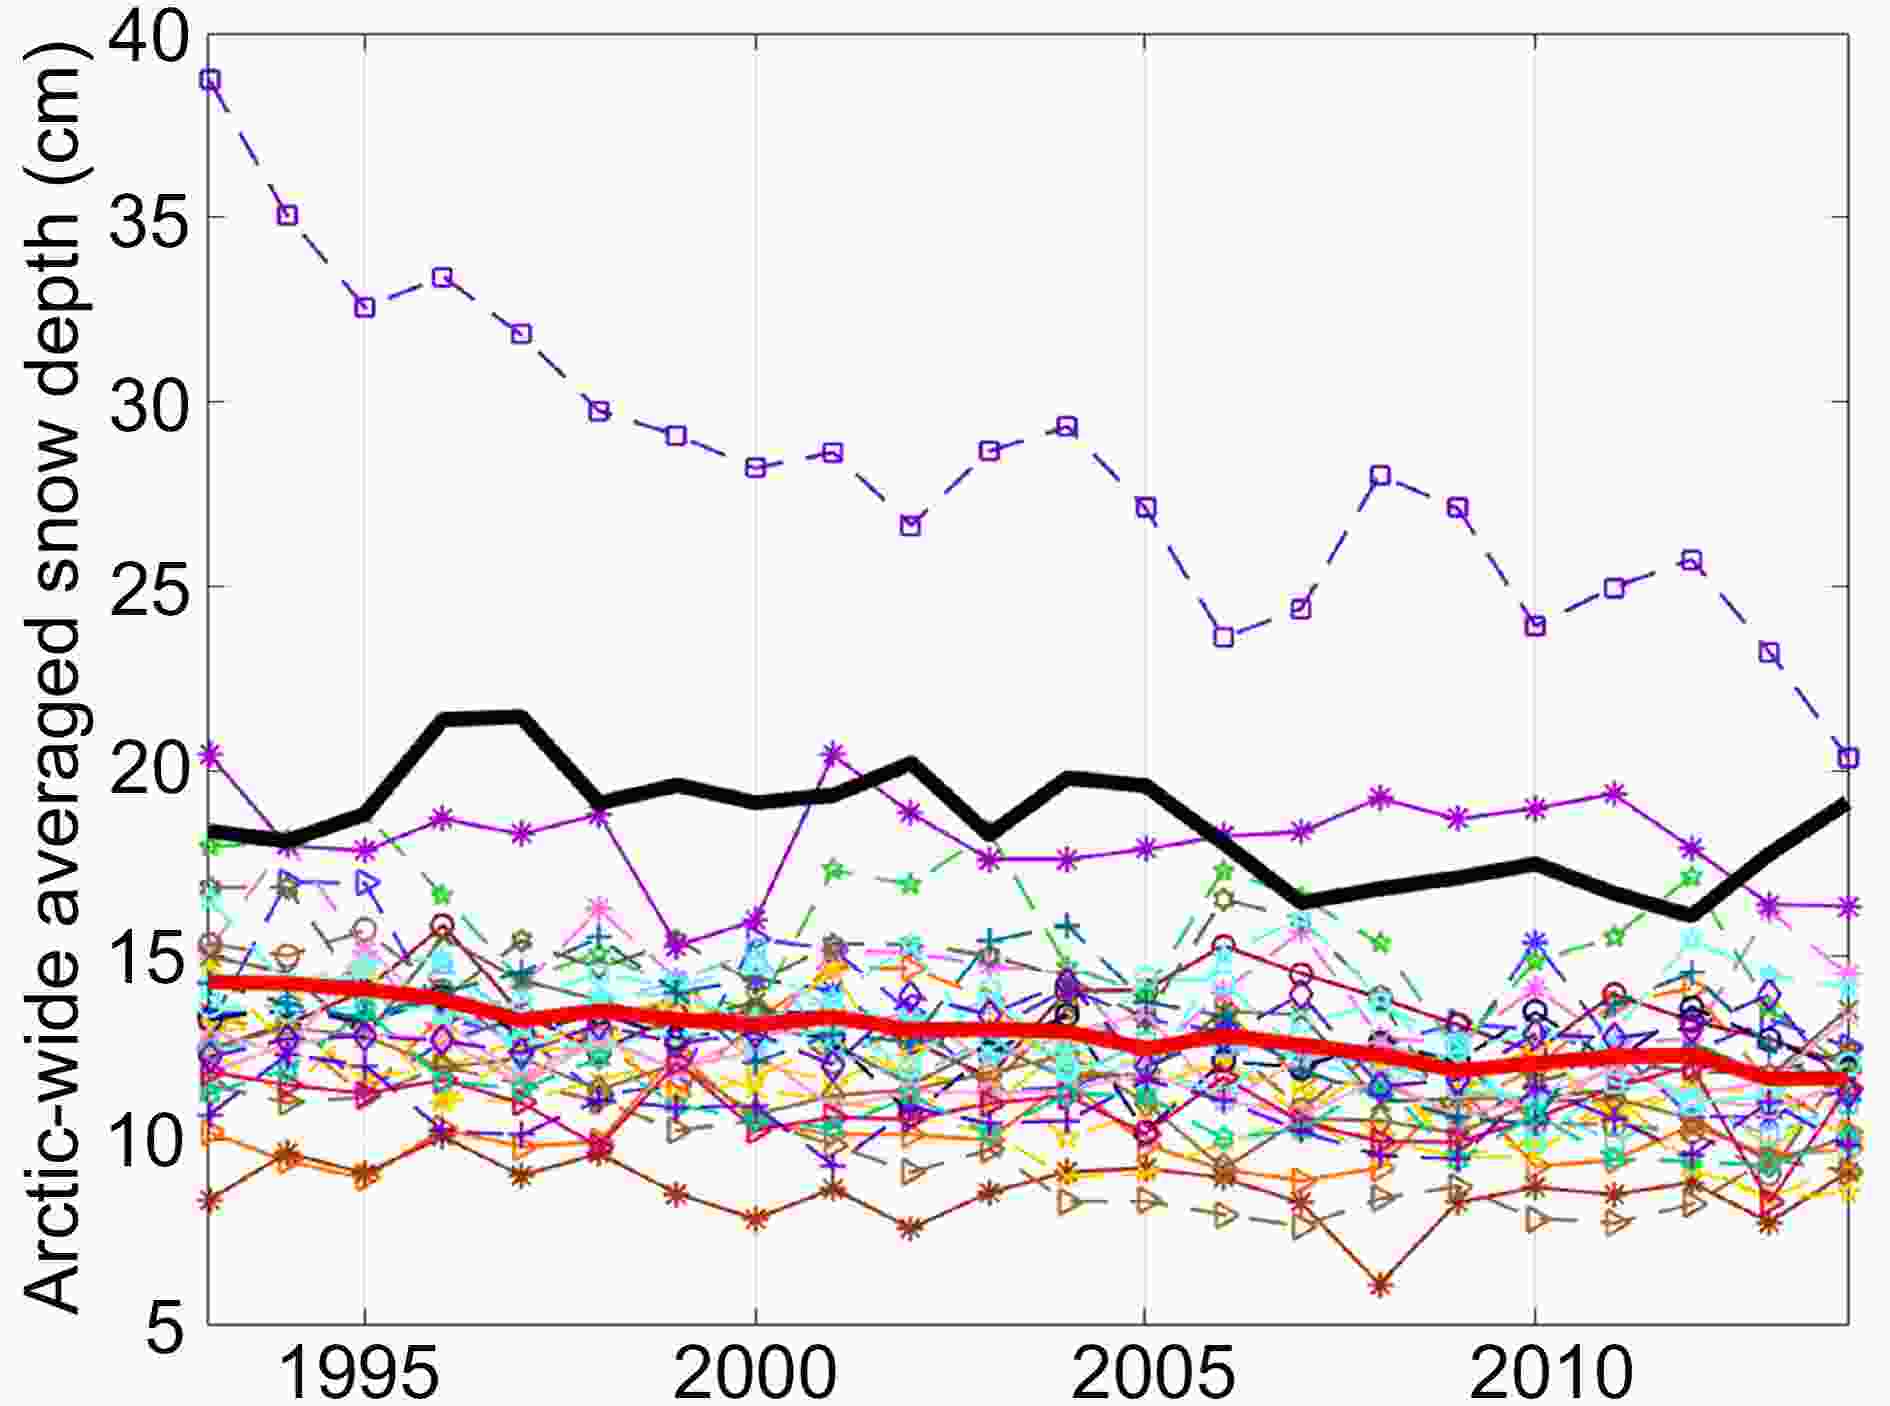 Figure3. Time series of annual mean Arctic-wide averaged snow depth based on SD-LZ19 and 31 CMIP6 models. The thick black line represents SD-LZ19, and the red thick line represents the MMM. Other various-colored thin lines represent each individual model using the same color scheme as in Fig. 2.
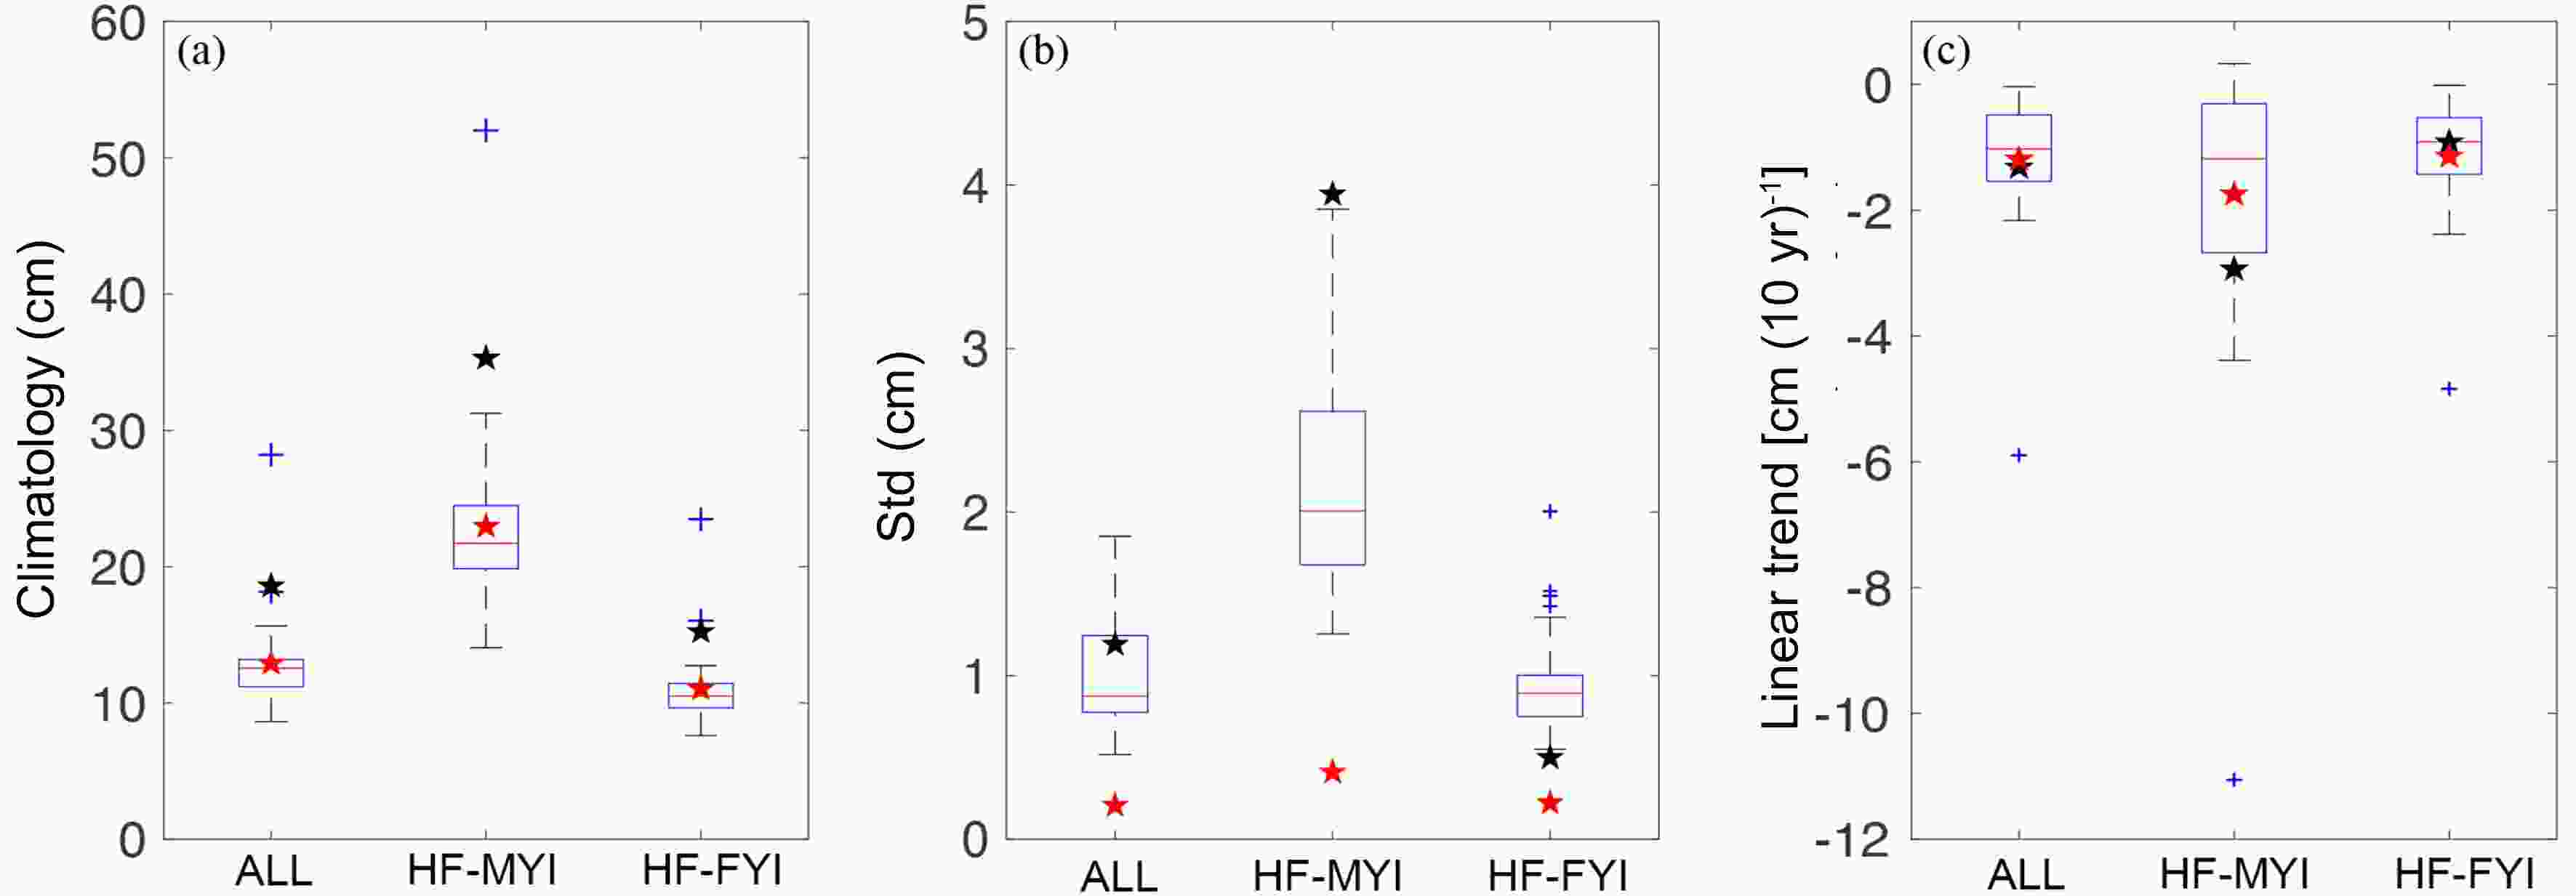 Figure4. Boxplot of snow depth for the (a) annual mean climatology, (b) interannual variability, and (c) linear trend, based on SD-LZ19 and 31 CMIP6 models. The Arctic-wide averaged snow depth is assigned as ALL; snow depth averaged over the area frequently covered by multi-year and first-year sea ice are assigned as HF-MYI and HF-FYI, respectively. In each boxplot, the red line represents the median value of 31 CMIP6 models, the bottom and top edges of the box indicate the 25th (Q1) and the 75th (Q3) percentiles, respectively. The whiskers correspond to the 1.5 interquartile range (IQR = Q3–Q1) above the 75th and below the 25th percentiles. Blue crosses represent outlier models. Red (black) pentagrams corresponds to the values of the CMIP6 multi-model ensemble mean (SD-LZ19).
3
3.1.2. Variability and trend
Figure 3 shows the historical variation of the annual mean Arctic-wide averaged snow depth. The observed snow depth is larger than all of the model simulations except for NorCPM1 and MIROC6. The interannual variability of the observed annual mean snow depth is 1.2 cm during the period 1993–2014 (Fig. 4b). SD-LZ19 indicates a declining linear trend of ?1.3 cm (10 yr)?1 in the annual mean Arctic-wide averaged snow depth (significant at the 95% confidence level) from 1993 to 2014. We also apply a regime shift detection algorithm proposed by Rodionov (2004) to the time series of the observed snow depth. The result indicates that a regime shift occurred in 2006, from the annual mean value of 19.4 cm during 1993–2006 to 17.2 cm during 2007–2014.Encouragingly, there is no single model with simulated interannual variability exceeding the 1.5 interquartile range (Fig. 4b, “ALL”). A total of 13 out of 31 models have interannual variability within 1 std of the observed SD-LZ19 (here, 1 std is calculated based on the interannual variability of the annual mean snow depth simulated by 31 models), including ACCESS-CM2, ACCESS-ESM1-5, AWI-CM-1-1-MR, BCC-CSM2-MR, CAMS-CSM1-0, CESM2-FV2, E3SM-1-1-ECA, EC-Earth3-Veg, EC-Earth3, FIO-ESM-2-0, MIROC6, MPI-ESM-1-2-HAM, MRI-ESM2-0. The MMM, which filers out the internal variability, reproduces a similar thinning trend of ?1.2 cm (10 yr)?1. The trend of snow depth simulated by each individual model varies (Fig. 4c). A total of 27 out of 31 models simulate the Arctic-wide averaged snow depth trend within 1 std of the observed one (here, 1 std is calculated using the trend of snow depth simulated by 31 models), except for NorCPM1, BCC-ESM1, CAMS-CSM1-0, and NorESM2-MM. NorCPM1 dramatically overestimates the thinning rate of snow depth in the Arctic [?5.9 cm (10 yr)?1; Table 2]. On the contrary, BCC-ESM1, CAMS-CSM1-0, and NorESM2-MM show little trend of snow depth.
| Sources | Stats | ||||||||||
| Climatology (cm) | Interannual variability (cm) | Trend [cm (10 yr)?1] | |||||||||
| ALL | HF-FYI | HF-MYI | ALL | HF-FYI | HF-MYI | ALL | HF-FYI | HF-MYI | |||
| SD-LZ19 | 18.6 | 15.2 | 35.3 | 1.2 | 0.5 | 4.0 | ?1.3* | ?0.9* | ?2.9 | ||
| ACCESS-CM2 | 12.8 | 11.5 | 21.4 | 1.1 | 0.9 | 2.4 | ?0.7* | ?0.7* | ?0.8 | ||
| ACCESS-ESM1-5 | 13.1 | 10.8 | 24.5 | 1.5 | 1.4 | 2.6 | ?1.0 | ?1.3 | ?0.7 | ||
| AWI-CM-1-1-MR | 14.3 | 12 | 26.2 | 1.4 | 1.4 | 2.9 | ?0.8 | ?0.7 | ?1.2 | ||
| BCC-CSM2-MR | 12.6 | 11.7 | 19.7 | 1.2 | 1 | 2.9 | ?0.5 | ?0.8* | 0.1* | ||
| BCC-ESM1 | 10 | 9.8 | 14.4 | 0.9 | 0.9 | 1.7 | ?0.2 | ?0.3 | 0.3* | ||
| CAMS-CSM1-0 | 13.4 | 12.5 | 21 | 1 | 1 | 1.7 | ?0.2 | ?0.3 | ?0.1 | ||
| CAS-ESM2-0 | 8.6 | 7.8 | 14.1 | 0.8 | 0.8 | 1.5 | ?0.4 | ?0.5 | ?0.4 | ||
| CESM2-FV2 | 11.9 | 10.2 | 21.1 | 1.1 | 1 | 2.1 | ?1.6* | ?1.7* | ?2.0* | ||
| CESM2-WACCM-FV2 | 12.1 | 10.3 | 21.8 | 0.8 | 0.7 | 1.6 | ?1.4* | ?1.4* | ?1.7* | ||
| CESM2-WACCM | 11.2 | 9.6 | 19.7 | 0.8 | 0.7 | 1.9 | ?1.8* | ?1.7* | ?2.7* | ||
| CESM2 | 10.5 | 8.9 | 19.1 | 0.8 | 0.7 | 1.5 | ?1.5* | ?1.2* | ?2.8* | ||
| CanESM5 | 15.6 | 12.7 | 29.7 | 1.7 | 1.5 | 3.8 | ?1.5* | ?1.0 | ?3.2 | ||
| E3SM-1-0 | 9.5 | 7.6 | 18.5 | 0.8 | 0.9 | 1.6 | ?1.8* | ?1.7* | ?2.7* | ||
| E3SM-1-1-ECA | 12.5 | 10.5 | 22.8 | 0.9 | 1 | 2 | ?2.2* | ?2.0* | ?3.4* | ||
| E3SM-1-1 | 11.2 | 9.1 | 21.3 | 0.6 | 0.6 | 1.3 | ?1.3* | ?1.2* | ?1.8* | ||
| EC-Earth3-Veg | 12.8 | 10.4 | 24.4 | 1 | 0.8 | 2.6 | ?1.3* | ?0.4 | ?4.4* | ||
| EC-Earth3 | 14.1 | 11.3 | 27.3 | 1.3 | 1 | 3.5 | ?2.0* | ?1.9* | ?2.9* | ||
| FGOALS-f3-L | 12.6 | 11 | 22.2 | 0.9 | 0.9 | 2 | ?0.5* | ?0.3 | ?1.1 | ||
| FIO-ESM-2-0 | 12.3 | 9 | 26.2 | 0.9 | 0.6 | 2.5 | ?1.6* | ?0.8* | ?4.3* | ||
| GFDL-CM4 | 12.5 | 11.1 | 20.8 | 0.9 | 0.9 | 2.1 | ?0.7 | ?1.1* | 0.1* | ||
| GFDL-ESM4 | 11.6 | 10.3 | 19.6 | 0.5 | 0.6 | 1.7 | ?0.7* | ?0.9* | ?0.3 | ||
| IPSL-CM6A-LR | 10.8 | 8.7 | 21 | 0.8 | 0.8 | 1.7 | ?0.4 | ?0.04 | ?1.7 | ||
| MIROC6 | 18.2 | 16 | 31.3 | 1.3 | 1.2 | 2.7 | ?0.3 | ?0.6 | 0.3* | ||
| MPI-ESM-1-2-HAM | 13.8 | 12.4 | 23.2 | 1.4 | 1.5 | 2.4 | ?0.5 | ?0.4 | ?0.9 | ||
| MPI-ESM1-2-HR | 12.8 | 11.2 | 22.2 | 0.8 | 0.9 | 2.5 | ?1.9* | ?2.4* | ?1.2 | ||
| MPI-ESM1-2-LR | 12.7 | 11.3 | 21.7 | 0.8 | 0.8 | 1.8 | ?0.8* | ?0.7* | ?1.2* | ||
| MRI-ESM2-0 | 13.2 | 10.5 | 25.9 | 1.3 | 1 | 3.5 | ?1.1* | ?1.1* | ?1.7 | ||
| NESM3 | 10.8 | 10.3 | 16.3 | 0.7 | 0.8 | 1.3 | ?1.2* | ?1.4* | ?1.0 | ||
| NorCPM1 | 28.2 | 23.5 | 52.0 | 1.9 | 2 | 3.9 | ?5.9* | ?4.8* | ?11.1* | ||
| NorESM2-LM | 10.6 | 8.6 | 20.3 | 0.7 | 0.8 | 1.8 | ?0.5 | ?0.8* | 0.3* | ||
| NorESM2-MM | 12.7 | 11.1 | 22.1 | 0.8 | 0.7 | 1.9 | ?0.04* | ?0.02* | ?0.1 | ||
| MMM | 12.9 | 11 | 23 | 0.2 | 0.2 | 0.4 | ?1.2* | ?1.2* | ?1.8 | ||
Table2. Climatology, interannual variability, and linear trend of the annual mean snow depth for SD-LZ19, historical simulations of 31 CMIP6 models, and their MMM. An asterisk (*) indicates the 95% confidence level. ALL, HF-FYI, and HF-MYI stand for the averaged snow depth for the entire Arctic, HF-FYI, and HF-MYI areas, respectively.
3
3.1.3. HF-MYI vs HF-FYI
Next, we extend the analysis to the areas with high frequency of occurrence of MYI/FYI (HF-MYI and HF-FYI). Boxplots are utilized to show the performance of the CMIP6 models against SD-LZ19 from the perspectives of the annual mean snow depth climatology, interannual variability, and linear trend (detailed statistics are also included in Table 2).In terms of the climatology, SD-LZ19 (MMM) reports a snow depth of 15.2 (11.0) and 35.3 (23.0) cm over HF-FYI and HF-MYI, respectively. The median values of the corresponding simulated snow depth are 10.5 and 21.7 cm. The snow depth of SD-LZ19 over both HF-FYI and HF-MYI falls outside the upper bound of whiskers of the CMIP6 model simulations (the 1.5 interquartile range; Fig. 4a). This confirms that the CMIP6 models underestimate the Arctic-wide averaged snow depth regardless of the underlying sea-ice types. The observation shows that HF-MYI has much thicker snow compared to that of HF-FYI. The MMM captures this feature. However, the MMM produces greatly thinner snow over HF-MYI relative to the observation. It is noticeable that the spread of whiskers is larger over HF-MYI compared to HF-FYI, suggesting that the CMIP6 models have more difficulty in simulating snow depth over HF-MYI. According to the whiskers, NorCPM1 can be considered as an outlier over both HF-MYI and HF-FYI, while MIROC6 is only considered as an outlier with anomalously thick snow over HF-FYI (Fig. 4a). CAMS-CSM1-0, CanESM5, MIROC6, and MPI-ESM-1-2-HAM simulate snow depth over HF-FYI within 1 std of the observation (15.2 cm), whereas CanESM5 and MIROC6 simulate snow depth over MYI within 1 std of the observation (35.3 cm).
In terms of the interannual variability, SD-LZ19 reports an annual mean snow depth variability of 0.5 and 4.0 cm over HF-FYI and HF-MYI, respectively (Table 2). The median values of the simulated snow depth variability are 0.9 and 2.0 cm. The variability of SD-LZ19 over both HF-MYI and HF-FYI falls outside the range of whiskers (the 1.5 interquartile range), but exceeds the upper bound for HF-MYI and the lower bound for HF-FYI. This suggests that the CMIP6 models tend to underestimate the interannual variability of snow depth over HF-MYI while overestimating it over HF-FYI. ACCESS-ESM1-5, CanESM5, MPI-ESM-1-2-HAM, and NorCPM1 are considered as outliers on the high side for the simulated snow depth variability over HF-FYI (Fig. 4b). In total, 12 models simulate the interannual variability of snow depth over HF-FYI within 1 std of the observed one (0.5 cm), including CAS-ESM2-0, CESM2-WACCM-FV2, CESM2-WACCM, CESM2, E3SM-1-1, EC-Earth3-Veg, FIO-ESM-2-0, GFDL-ESM4, IPSL-CM6A-LR, MPI-ESM1-2-LR, NESM3, and NorESM2-MM. However, only 4 models simulate the interannual variability of snow depth over HF-MYI within 1 std of the observed one (4.0 cm), including CanESM5, EC-Earth3, MRI-ESM2-0, and NorCPM1.
In terms of the linear trend, SD-LZ19 reports a decreasing rate of snow depth of ?2.9 cm (10 yr)?1 (not statistically significant) and ?0.9 cm (10 yr)?1 (significant at 95% confidence level) over HF-MYI and HF-FYI, respectively. The MMM suggests a smaller thinning rate over HF-MYI [?1.8 cm (10 yr)?1; not statistically significant] and a slightly larger thinning rate over HF-FYI [?1.2 cm (10 yr)?1; significant at the 95% confidence level] compared to those for SD-LZ19. Figure 4c shows that the CMIP6 models can capture the observed decreasing tendency regardless of the underlying sea-ice types, as both are in between the whiskers, although many models underestimate the thinning rate for snow over HF-MYI. NorCPM1 extremely overestimates the thinning rate of snow depth over both HF-MYI and HF-FYI. With NorCPM1 excluded, the spread of the simulated snow depth trend is larger over HF-MYI than HF-FYI, suggesting greater uncertainty in the trend simulation for snow depth over HF-MYI. In total, 27 and 20 models simulate the trend of snow depth over HF-FYI and HF-MYI within 1 std of the observed one, respectively. By contrast, 5 models simulate the opposite trend of snow depth over HF-MYI, including BCC-CSM2-MR, BCC-ESM1, GFDL-CM4, MIROC6, and NorESM2-LM (Table 2).
2
3.2. Spatial pattern
33.2.1. Climatology
Figure 5 shows the spatial distribution of the annual mean snow depth for the MMM averaged during the period 1993–2014. For SD-LZ19, the thickest snow (~25–40 cm) is found in the areas north of Greenland and the Canadian Arctic, where MYI dominates (Fig. 1a). In the central Arctic, the snow depth is approximately 20–30 cm. The snow is thinner in an arc around the periphery of the Arctic Basin extending from the southern Beaufort Sea (~10–15 cm), through the Chukchi and eastern Siberian seas (~15–20 cm) to the Kara and Barents seas (~15–20 cm). A major characteristic of the observed spatial distribution is the large snow thickness gradient from the Canadian Arctic to the outer areas. In general, the MMM underestimates the snow depth almost everywhere compared to SD-LZ19, except along the east coast of Greenland (Fig. 5). Although the simulated snow depth maximum also concentrates over the areas north of Greenland and the Canadian Arctic as well as the central Arctic Ocean, a large underestimation of snow depth (~15 cm) is found in those regions. Small to moderate underestimation (~5 cm) is found in the arc around the periphery of the Arctic Basin extending from the Beaufort Sea to the Kara Sea. As a result, the MMM cannot reproduce the observed snow thickness gradient. Figure5. Spatial pattern of the annual mean snow depth climatology for 1993–2014 derived from the MMM of 31 CMIP6 models.
Figure 6 gives the annual mean snow depth distribution simulated by the 31 CMIP6 models. MIROC6 generates the spatial distribution of snow depth similar to that of SD-LZ19 and reproduces the observed snow thickness gradient (note the cancellation effect between the overestimation during the growth period and the underestimation during the decay period by MIROC6). Besides MIROC6, CanESM5, EC-Earth3, FIO-ESM-2-0 and MRI-ESM2-0 can simulate a similar snow thickness gradient as SD-LZ19, but the areas covered by thick snow are more confined to the north of Greenland and the Canadian Arctic. To a lesser extent, ACCESS-ESM1-5, AWI-CM-1-1-MR and EC-Earth3-Veg produce some sort of thickness gradient in snow depth but only having thick snow in a very narrow area in the north of Greenland. These models also tend to simulate thick snow in the east coastal areas of Greenland, which is not the case for SD-LZ19. Unlike other models, NorCPM1 produces greatly thicker snow for much of the Arctic basin, with the thickest snow in the central Arctic (Fig. 6).
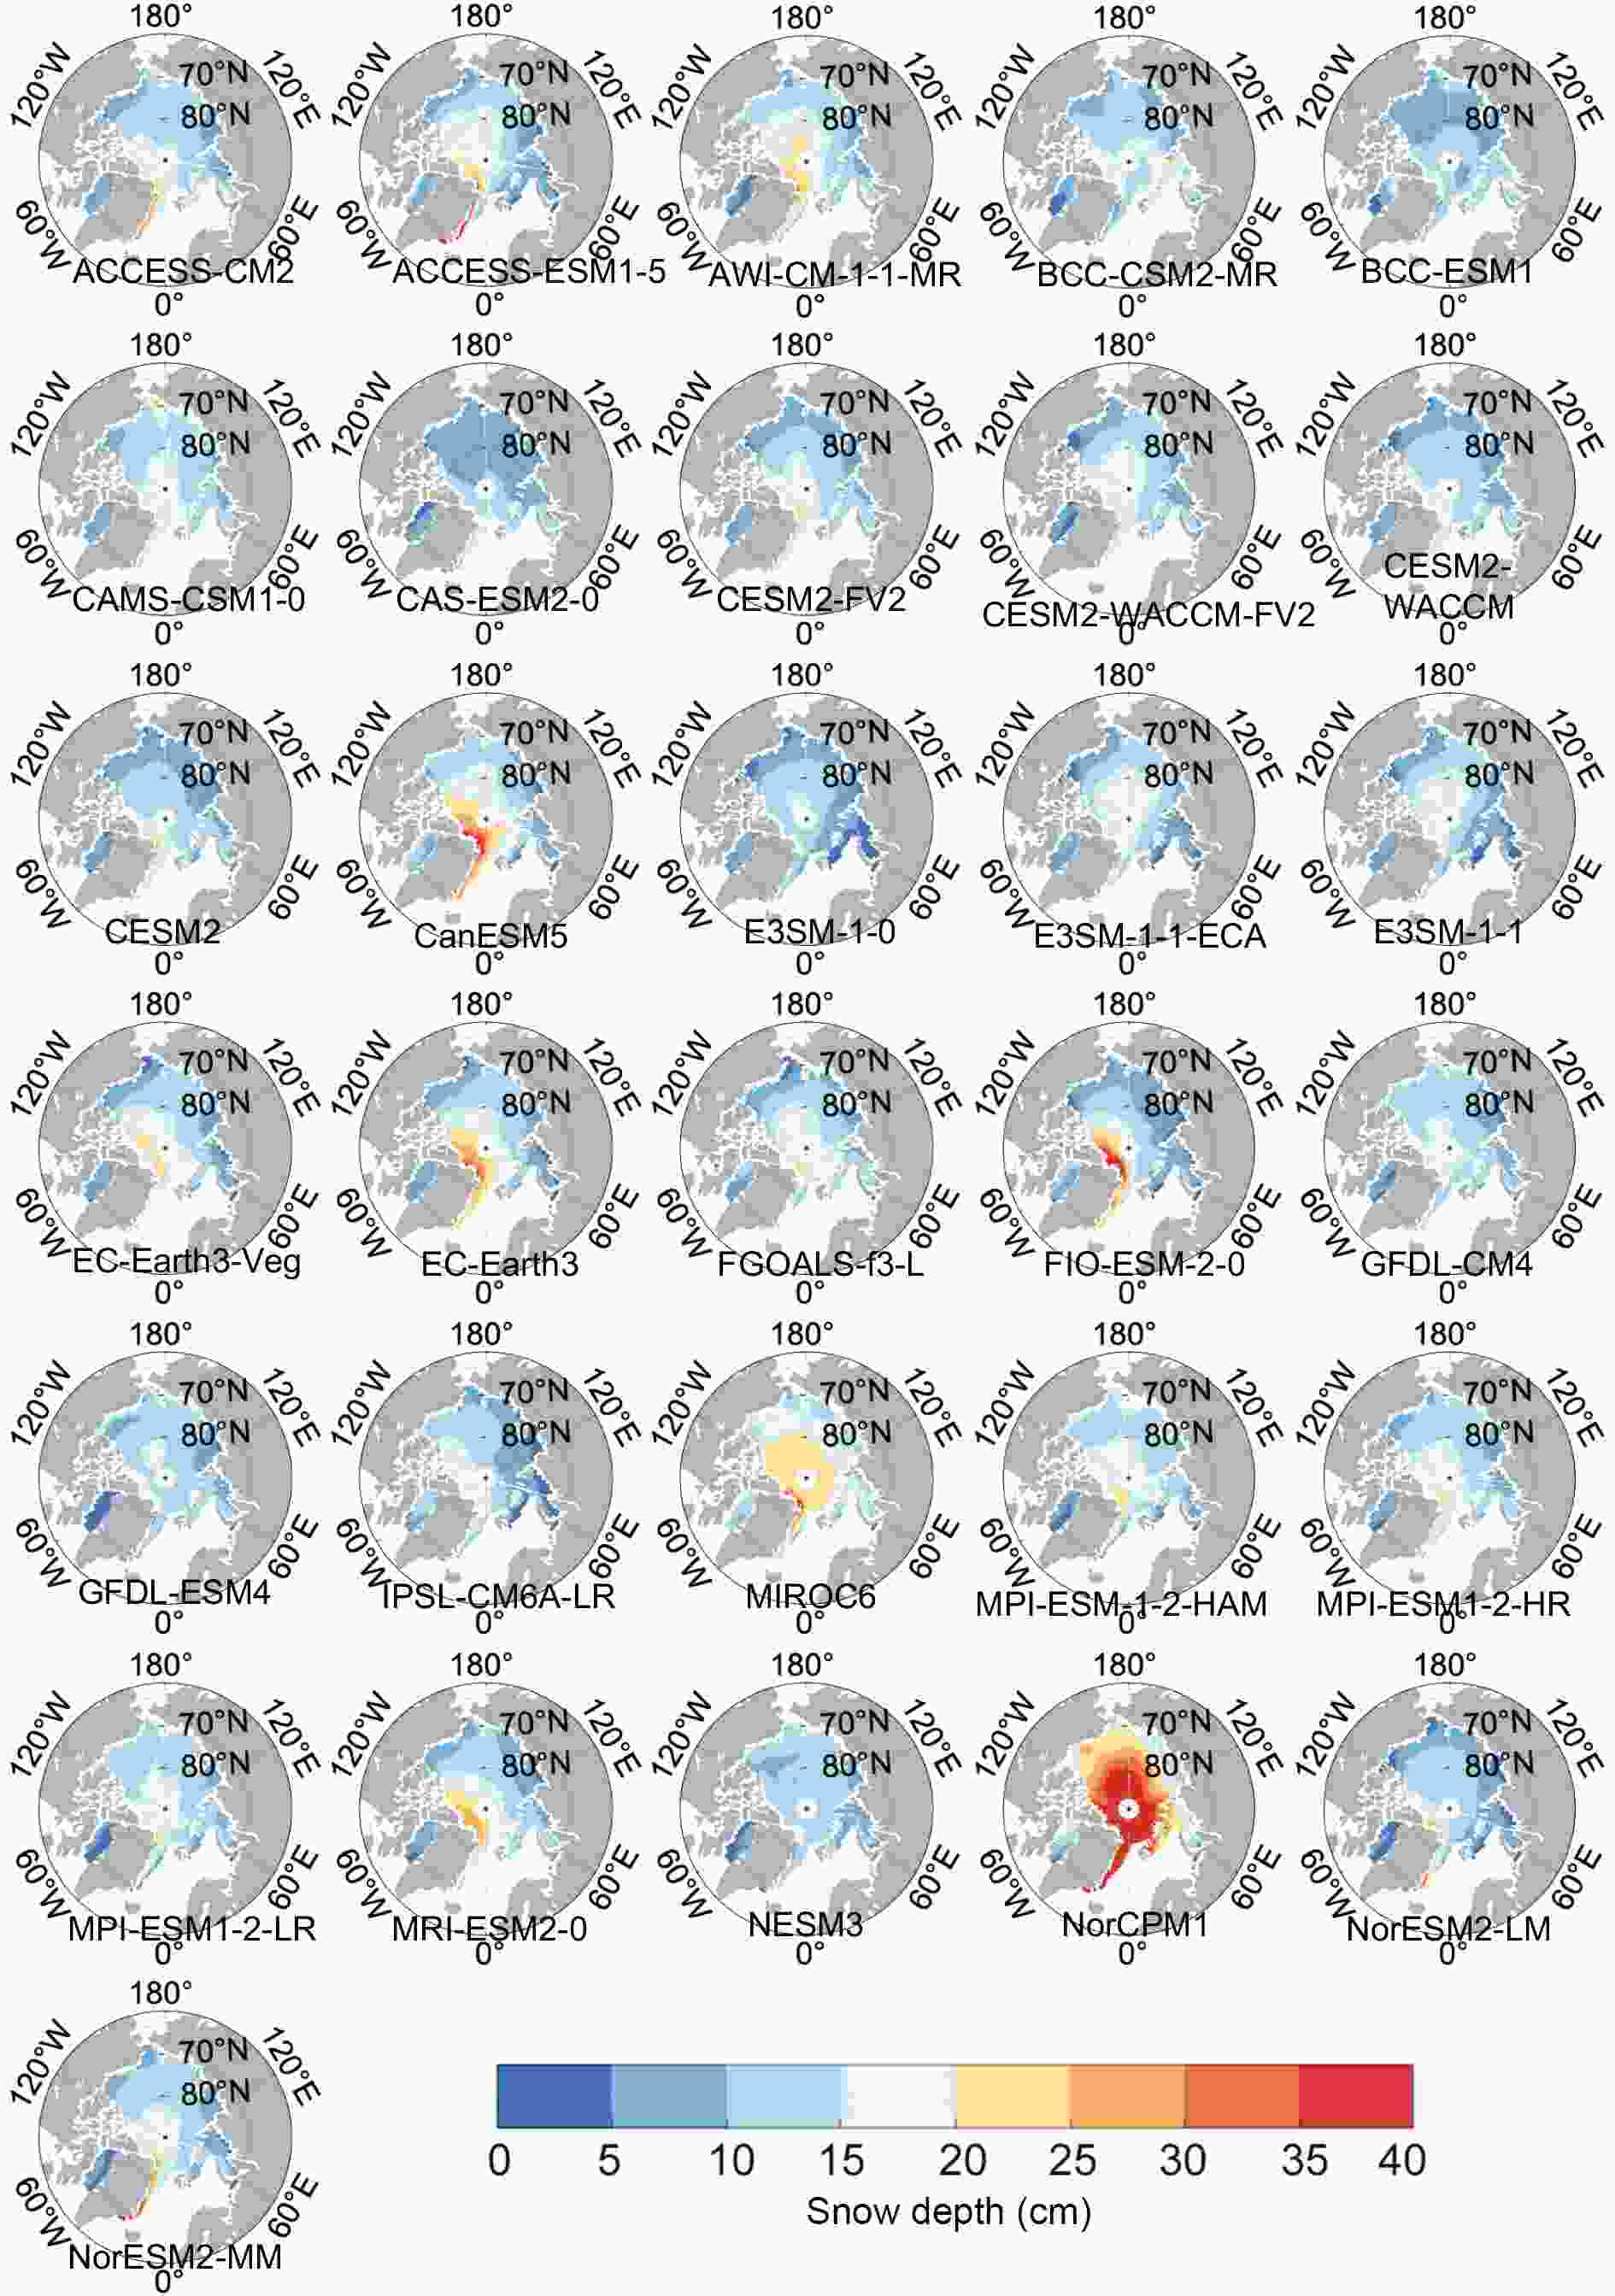 Figure6. Spatial pattern of annual mean snow depth climatology for 1993–2014 derived from each individual model.
3
3.2.2. Variability and trend
As shown in Fig. 7a, the Canadian Archipelago and the areas north of Greenland, where the largest snow depth is located, also have the largest interannual variability, at approximately 6–10 cm. The variability of annual mean snow depth decreases to approximately 2–6 cm in the central Arctic and the eastern Beaufort Sea. The rest regions have small variability (< 2 cm). Such a pattern is generally similar to that of the snow depth. The MMM is obtained by averaging all models’ simulations. By doing so, only the signal due to the external forcing is preserved and the internal variability signal is filtered out by this ensemble averaging approach (Fig. 7b). The interannual variability shown in Fig. 7a, however, includes signals from both external forcing and internal variability because it is based on the observation. By comparing Figs. 7a and b, it is suggested that the large interannual variability of snow depth in the areas north to the Canadian Arctic and Greenland, as well as the moderate interannual variability in the central Arctic, are largely due to the internal variability.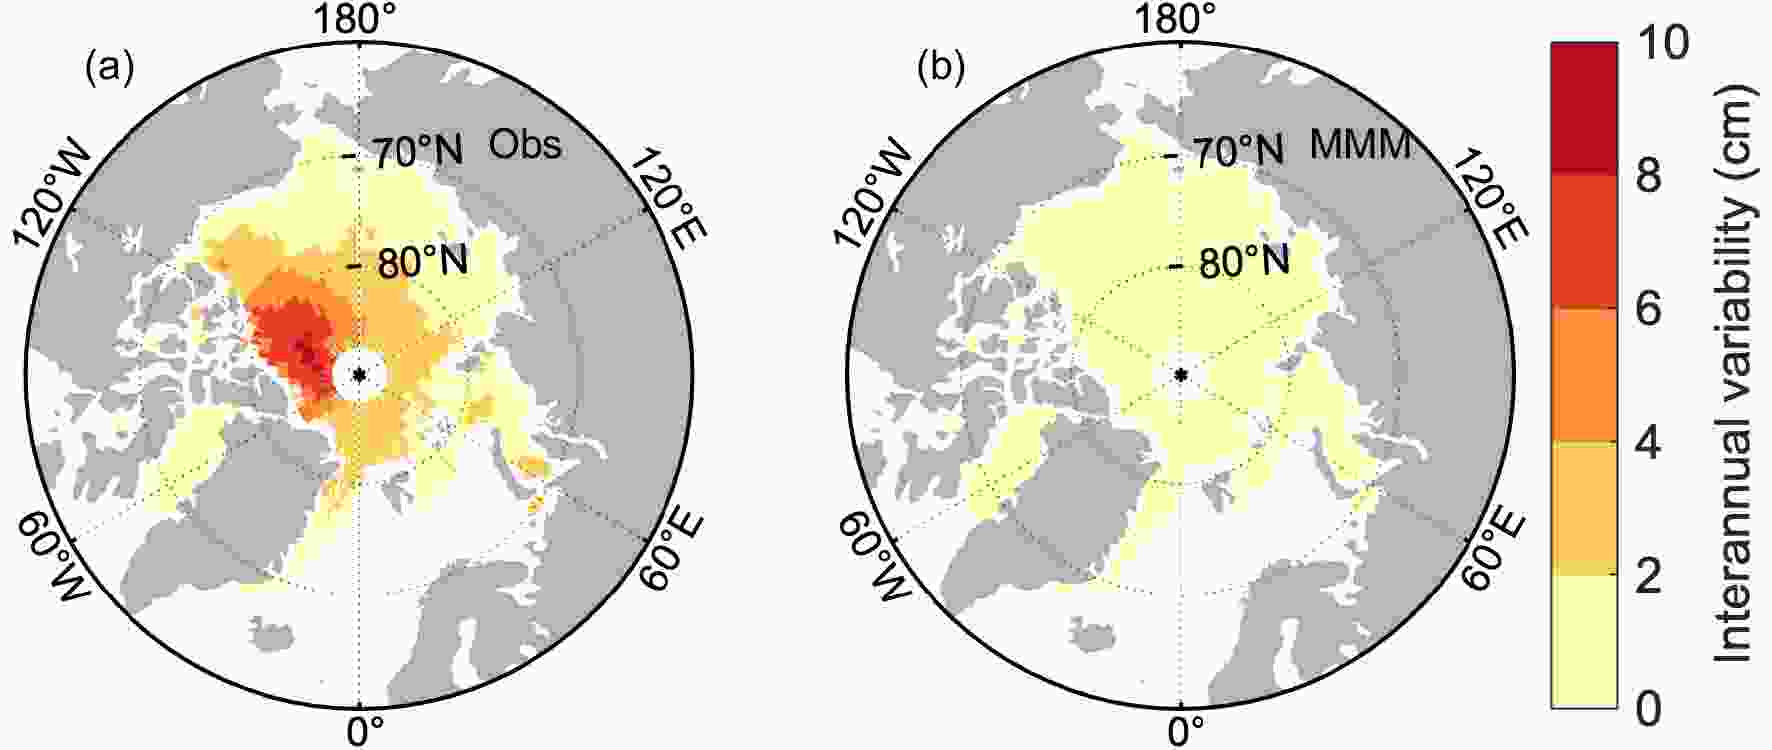 Figure7. Spatial pattern of interannual variability of annual mean snow depth for 1993–2014 derived from (a) SD-LZ19 and (b) the MMM of 31 CMIP6 models.
Figure 8 shows that the capability of reproducing the observed annual mean snow depth variability varies among the CMIP6 models. CanESM5, EC-Earth3-Veg, EC-Earth3, FIO-ESM-2-0, and MRI-ESM2-0 reproduce similar spatial patterns of the snow depth interannual variability to the observed one. However, the areas with high variability mainly concentrate in the narrow areas north of Greenland and the Canadian Archipelago. Besides, those models also have high variability of snow depth in the east coastal areas of Greenland and the Beaufort, Chukchi and East Siberian seas, compared to SD-LZ19. NorCPM1, on the other hand, highly overestimates the interannual variability over almost the entire Arctic.
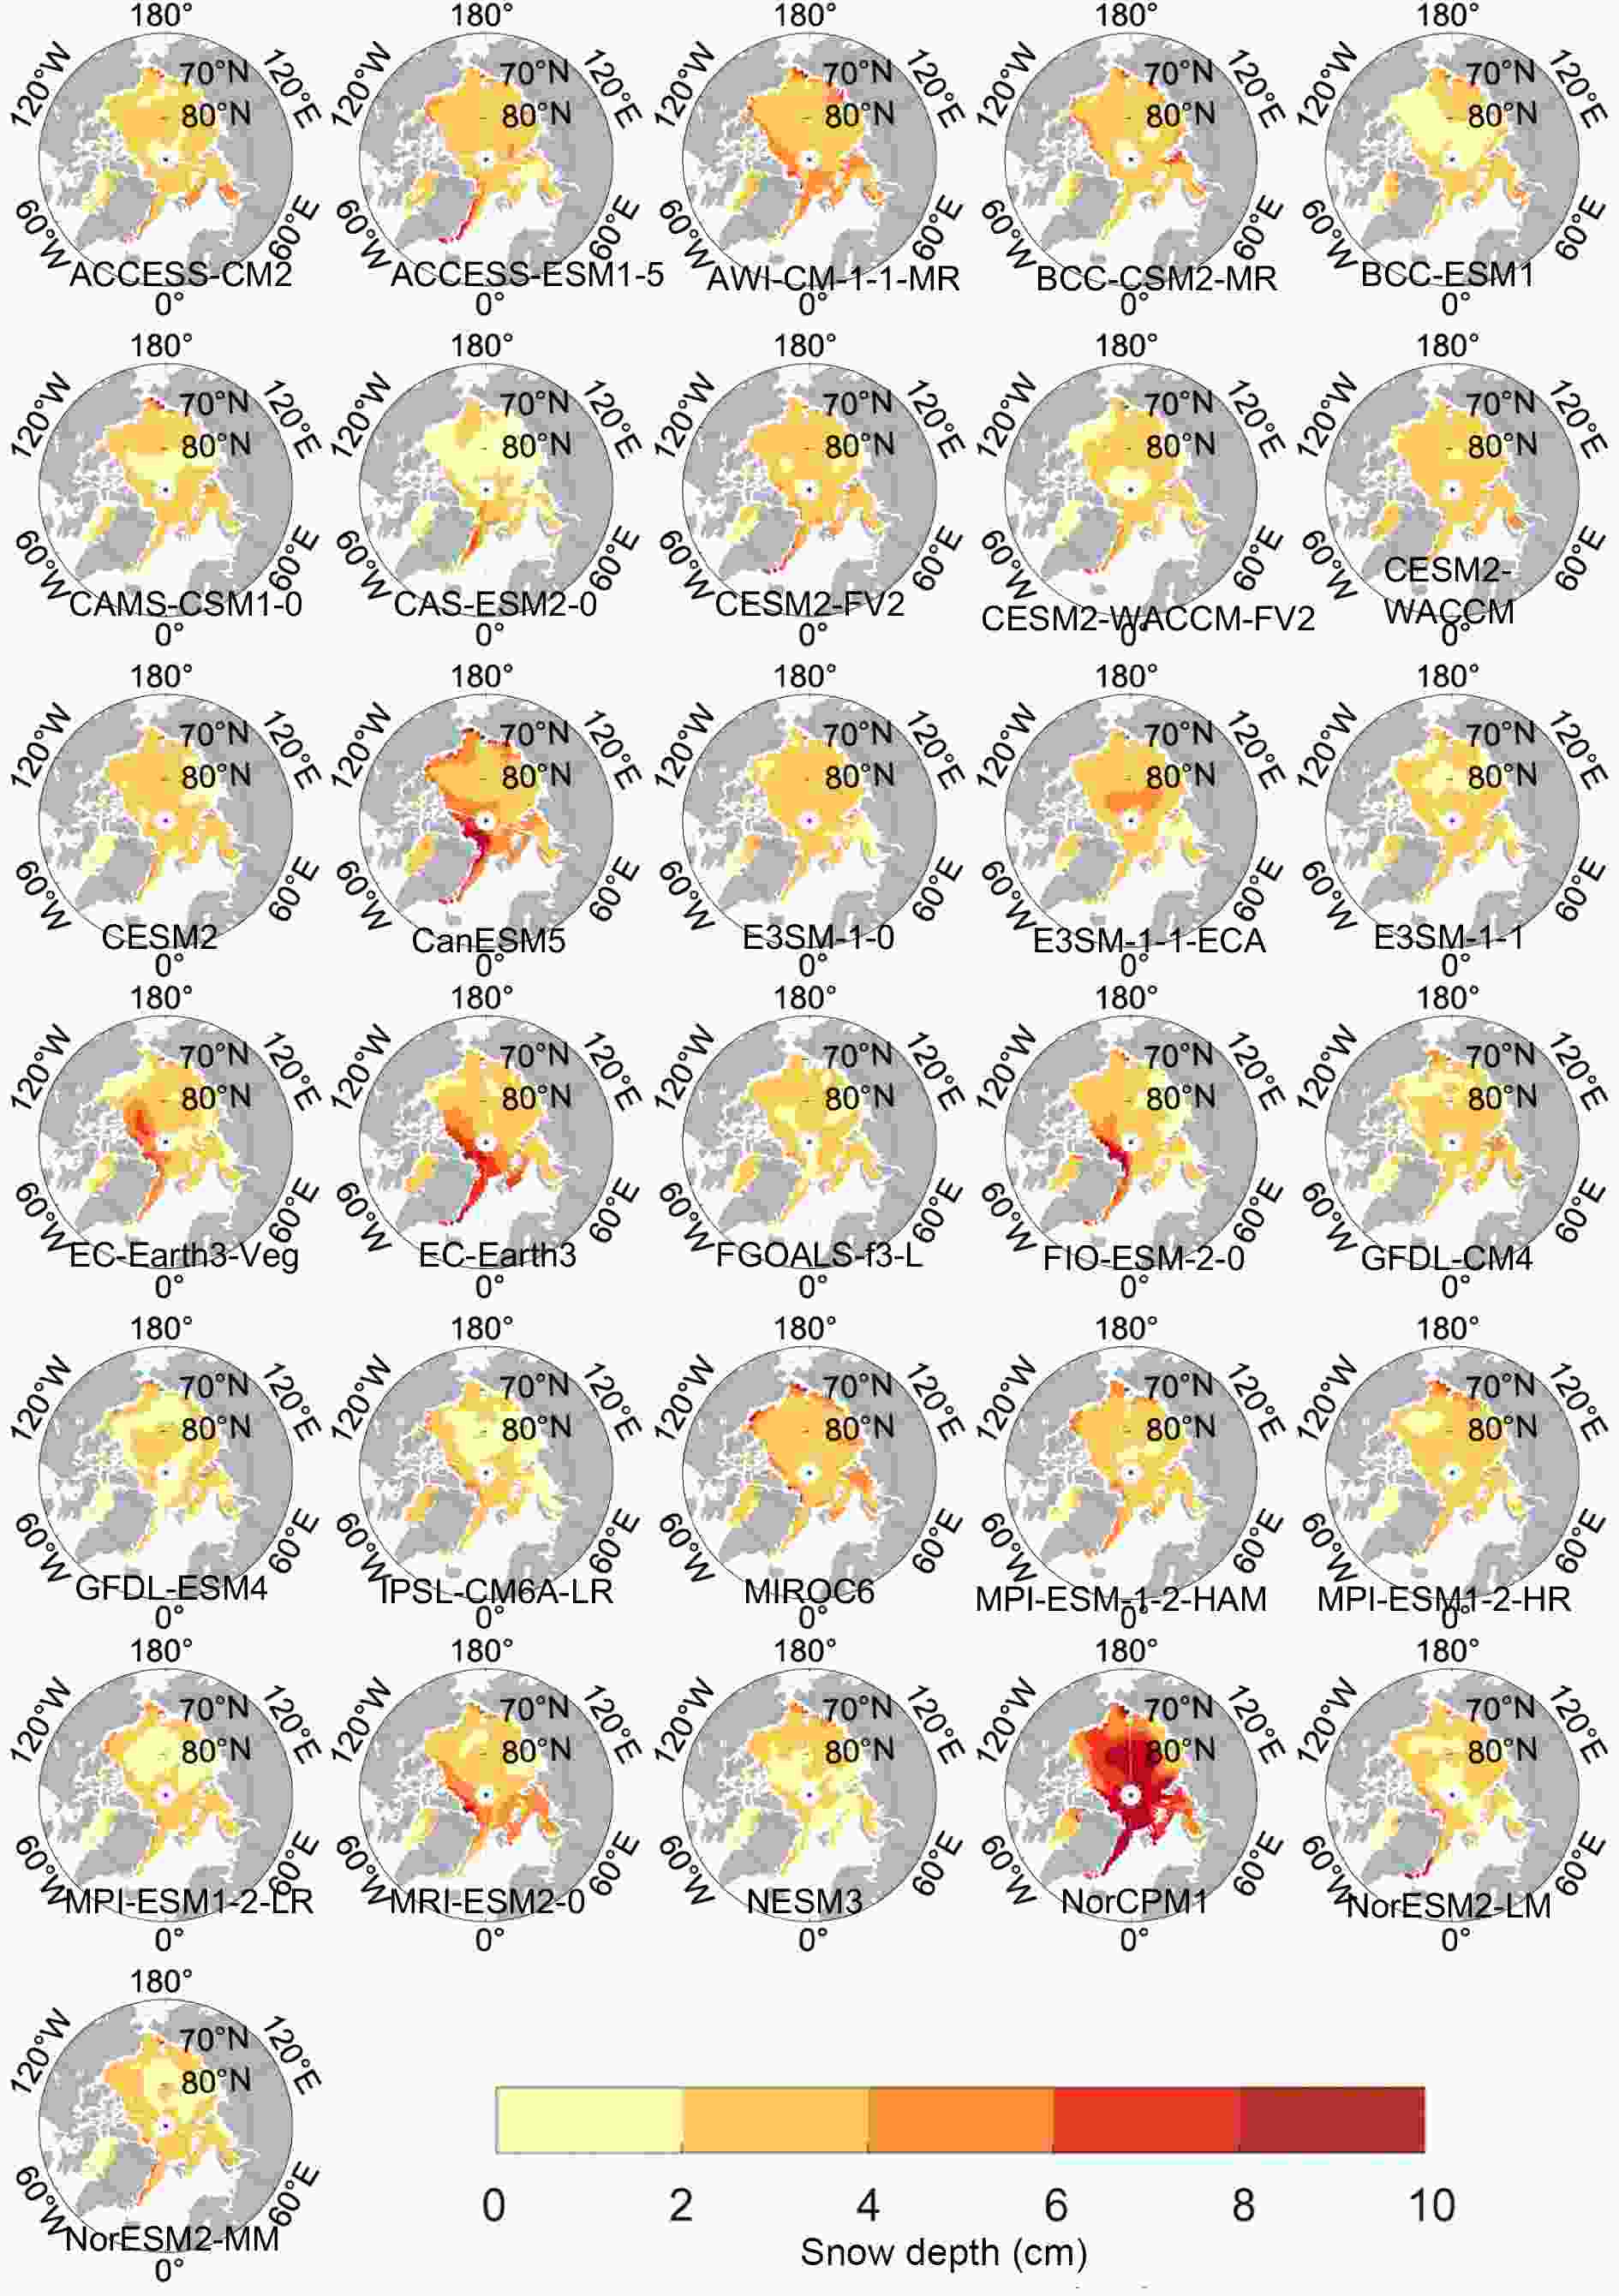 Figure8. Spatial pattern of the interannual variability of annual mean snow depth for 1993–2014 derived from each individual model.
As shown in Fig. 9, the annual mean snow depth in the Arctic is dominated by a decreasing linear trend during the period 1993–2014, especially in the central Arctic (significant at the 95% confidence level). However, snow depth in parts of the northern Beaufort and Chukchi seas has a significant positive linear trend during the same period. Consistent with the observation, the MMM simulates the snow depth decreasing in the Arctic from 1993 to 2014, but (1) only scattered areas have a statistically significant trend and in agreement across the models in terms of the direction of changes [two thirds of the significant models agree on the sign of the changes, similar to Tebaldi et al. 2011], (2) the decreasing trend in the central Arctic is much weaker than that of the observation [roughly ?1 cm (10 yr)?1 vs roughly ?5 cm (10 yr)?1], and (3) there is no increasing snow depth as shown by SD-LZ19 (Fig. 9b).
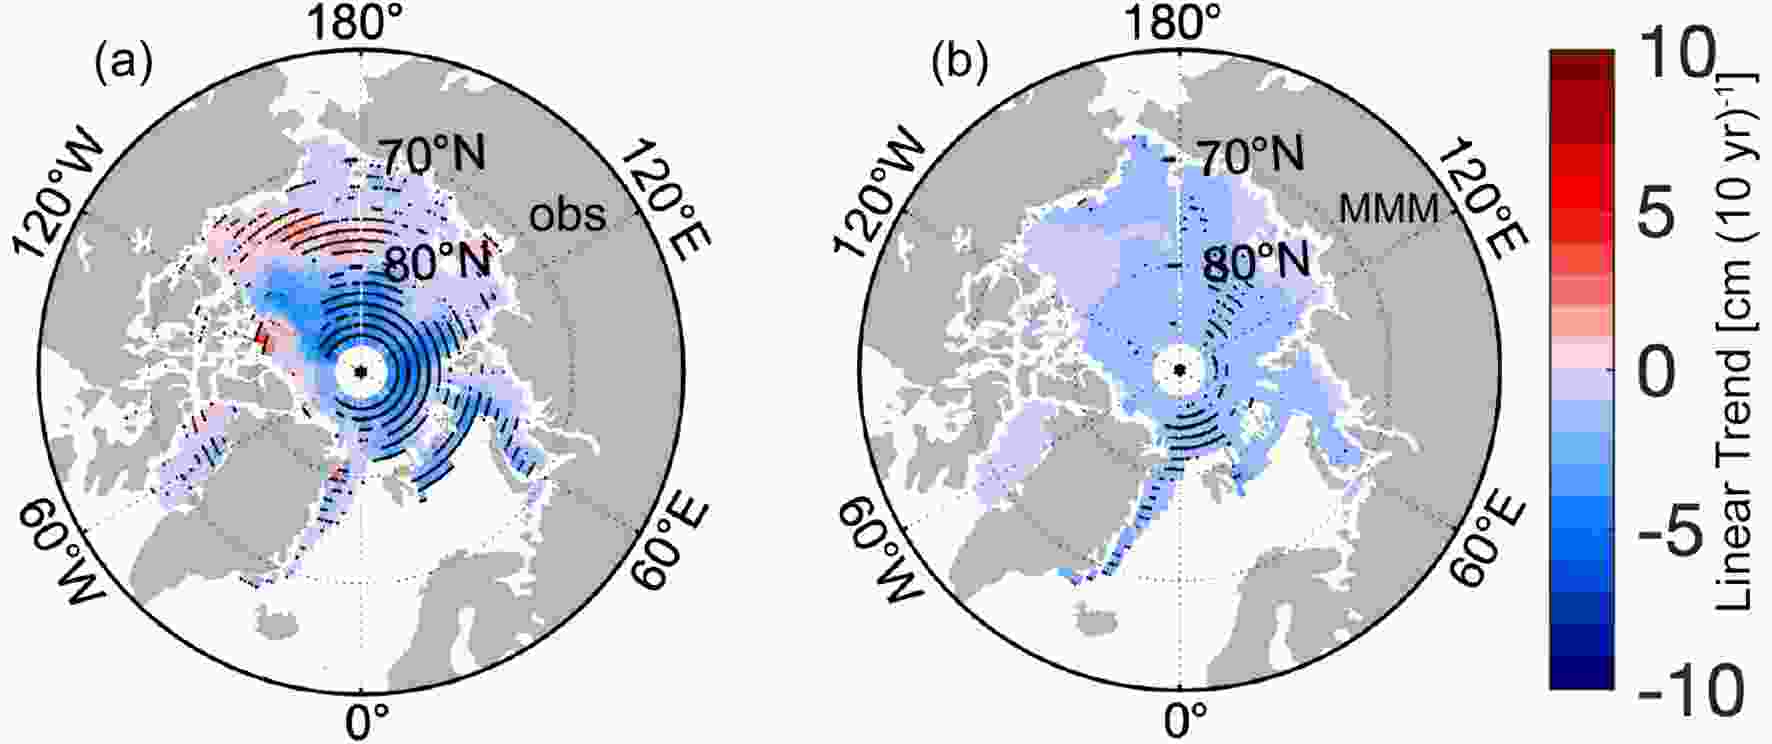 Figure9. Spatial pattern of the snow depth linear trend for 1993–2014 derived from (a) SD-LZ19 and (b) the MMM of 31 CMIP6 models.
Among the 31 models, E3SM-1-1 closely reproduces the spatial pattern of the annual mean snow depth linear trend (Fig. 10). E3SM-1-1 not only simulates the thinning snow in the central Arctic during 1993–2014 but also reproduces the belt area with increasing snow depth in the northern Beaufort and Chukchi seas. The magnitude of trends reflected by E3SM-1-1 is also similar to that of SD-LZ19. Besides E3SM-1-1, CESM2-FV2, CESM2-WACCM-FV2, CESM2-WACCM, CESM2, E3SM-1-1-ECA, E3SM-1-0, MPI-ESM1-2-HR, and NESM3 simulate similar trend patterns to a lesser extent—all are capable of capturing the negative trend in much of the Arctic, even though only E3SM-1-1 and MPI-ESM1-2-HR can simulate the positive trend in the northern Beaufort and Chukchi seas. NorCPM1 highly overestimates the negative trend of snow depth in the Arctic. Some models, i.e., BCC-ESM1, IPSL-CM6A-LR, MIROC6, MPI-ESM-1-2-HAM, NorESM2-LM, and NorESM2-MM, show more areas of the Arctic having positive trends of snow depth than that of the observation.
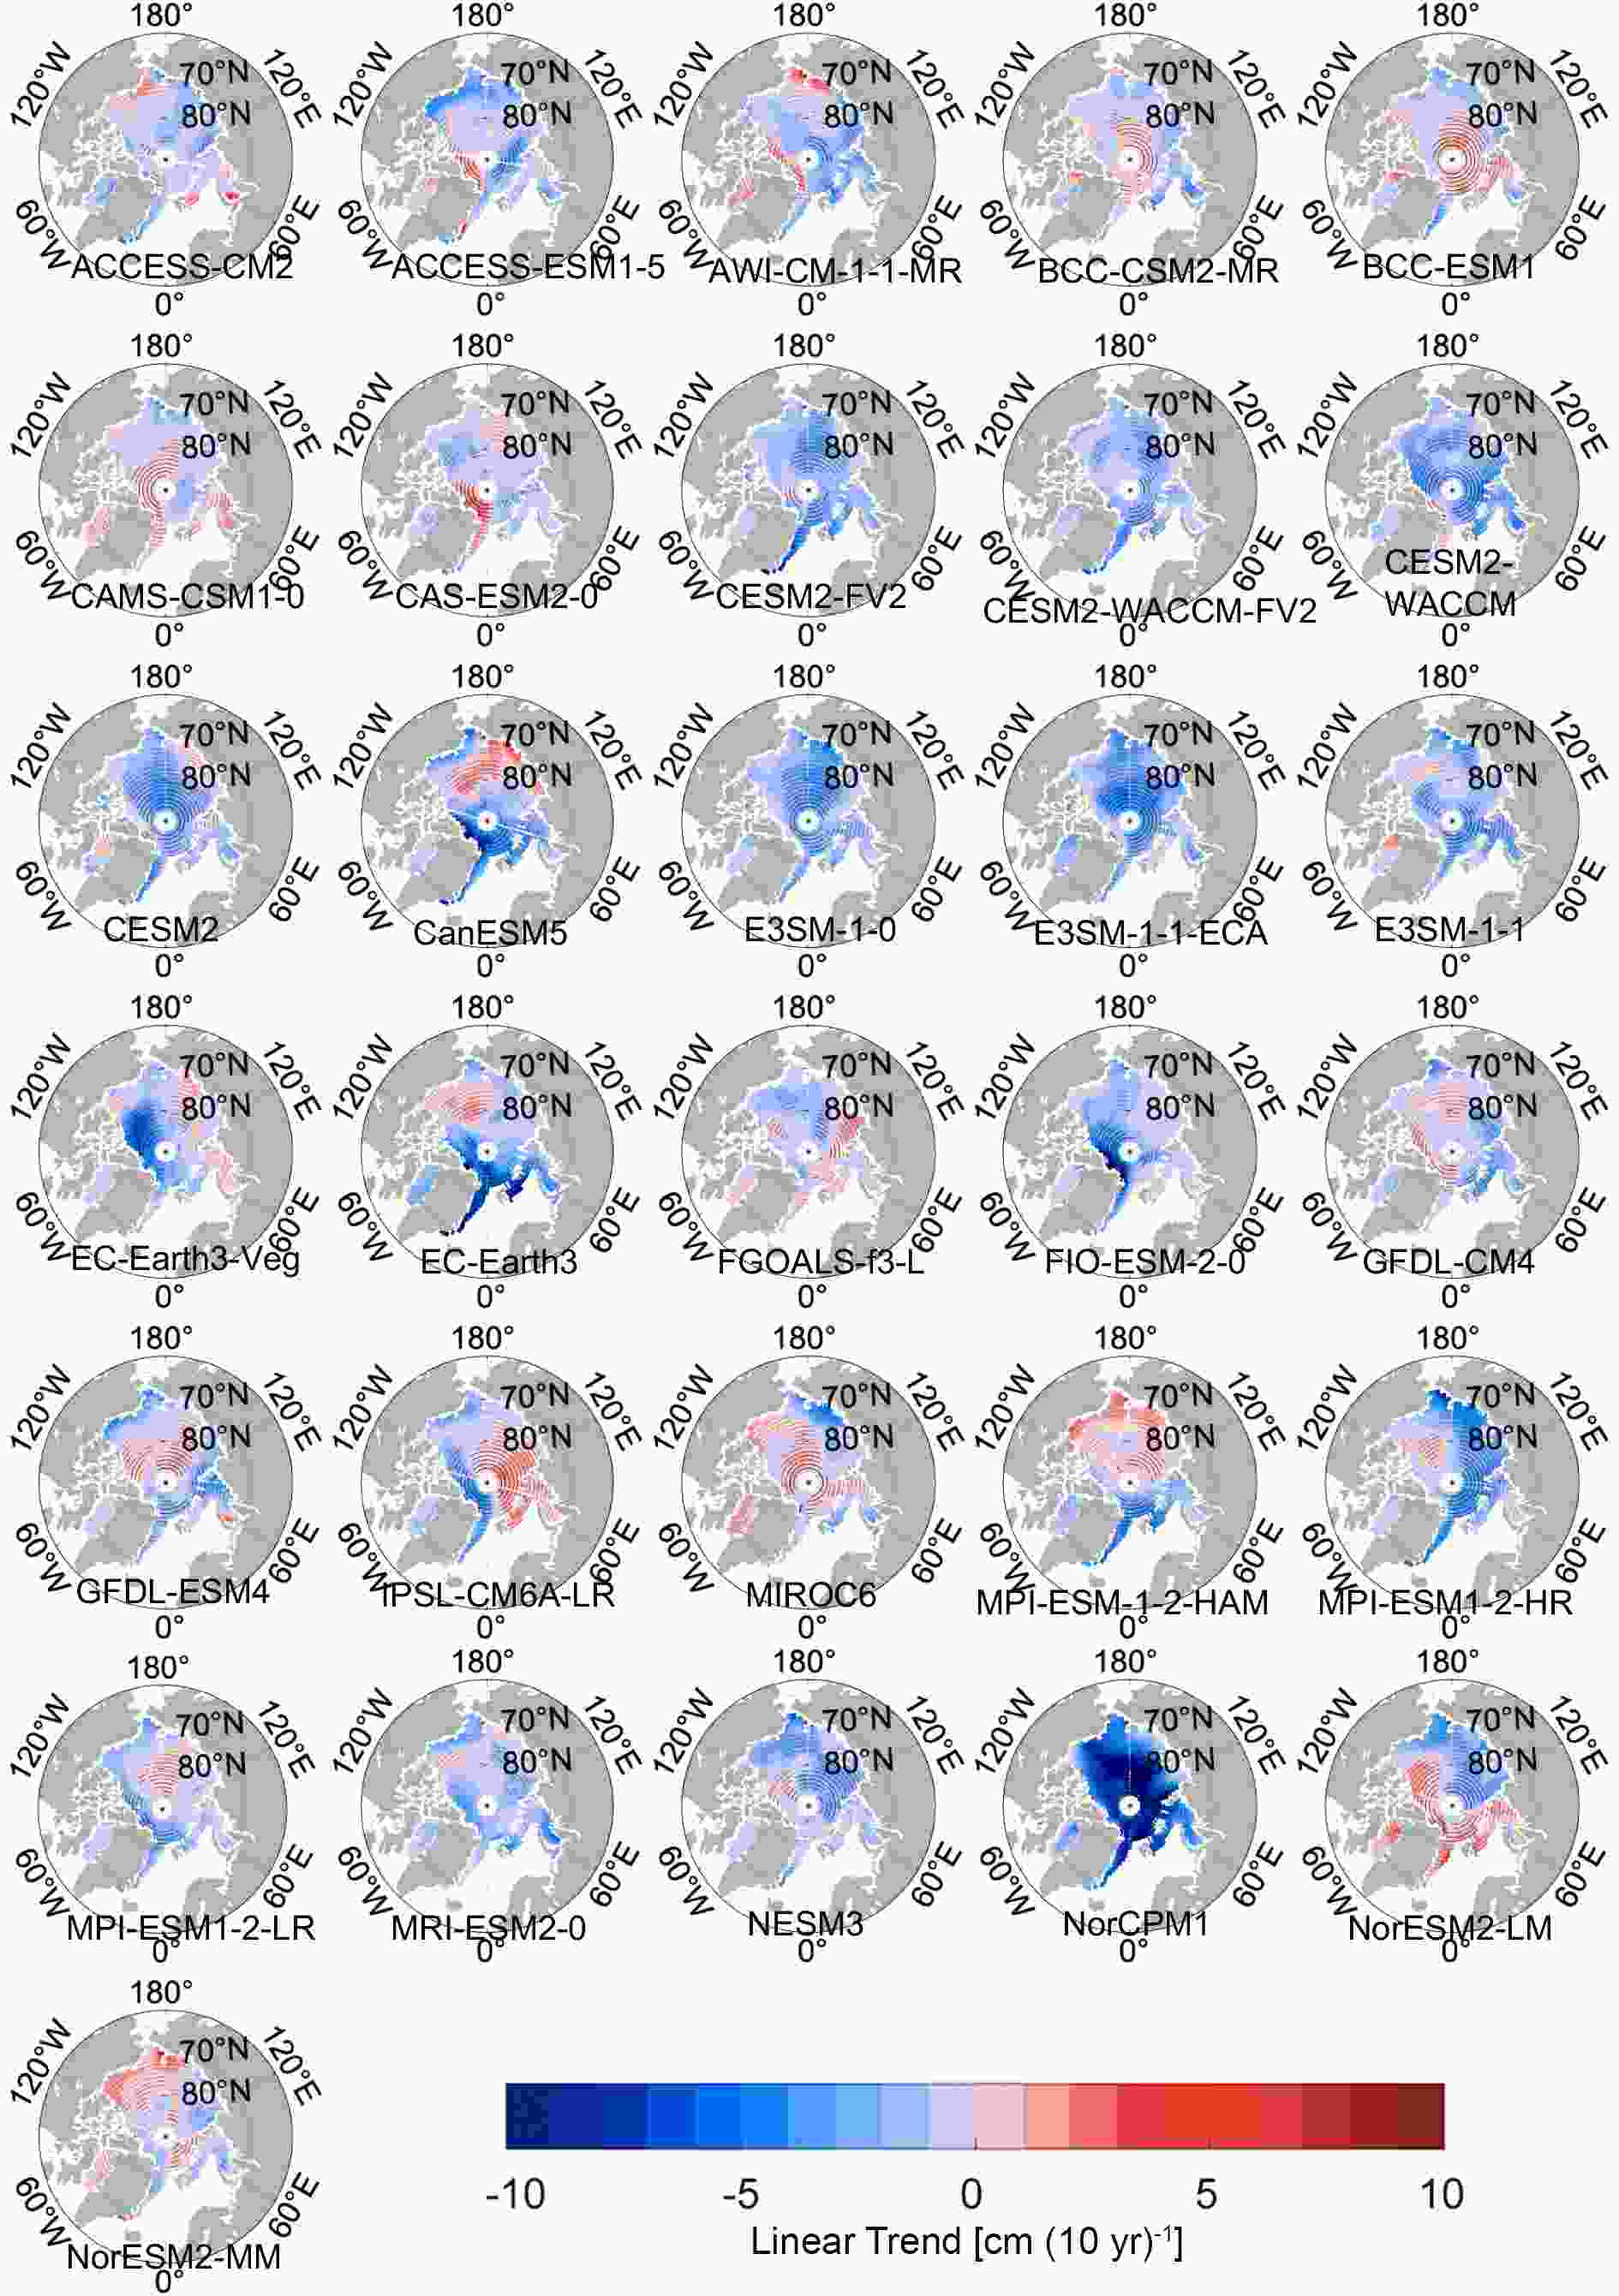 Figure10. Spatial pattern of the snow depth linear trend for 1993–2014 derived from each individual model.
2
3.3. Future change
Next, we examine how snow depth over Arctic sea ice may change under the SSP2-4.5 and SSP5-8.5 scenarios. For the seasonal cycle, we focus on two periods, 2030–49 and 2080–99, that represent the early-to-middle and late 21st century. The seasonal cycle of snow depth of the MMM and model spread during 2030–49 under SSP2-4.5 scenario resemble those under SSP5-8.5 scenario (Figs. 11a and b). Compared to the historical run (1993–2014), snow depth decreases by 3–4 cm during 2030–49 under the SSP2-4.5 and SSP5-8.5 scenarios, respectively. However, large differences are found during 2080–99 between SSP2-4.5 and SSP5-8.5. First, during winter and spring, snow depth is reduced much more from 2030–49 to 2080–99 under SSP5-8.5 (8.8 cm) than that of SSP2-4.5 (4.1 cm). The model spread is enlarged under SSP5-8.5 relative to that of SSP2-4.5. Second, under the SSP5-8.5 scenario, little snow is shown in the Arctic during summer and fall and snow accumulation starts from January. However, under the SSP2-4.5 scenario, a moderate amount of snow still exists in June and the accumulation starts from November, which is two months earlier than that of SSP5-8.5.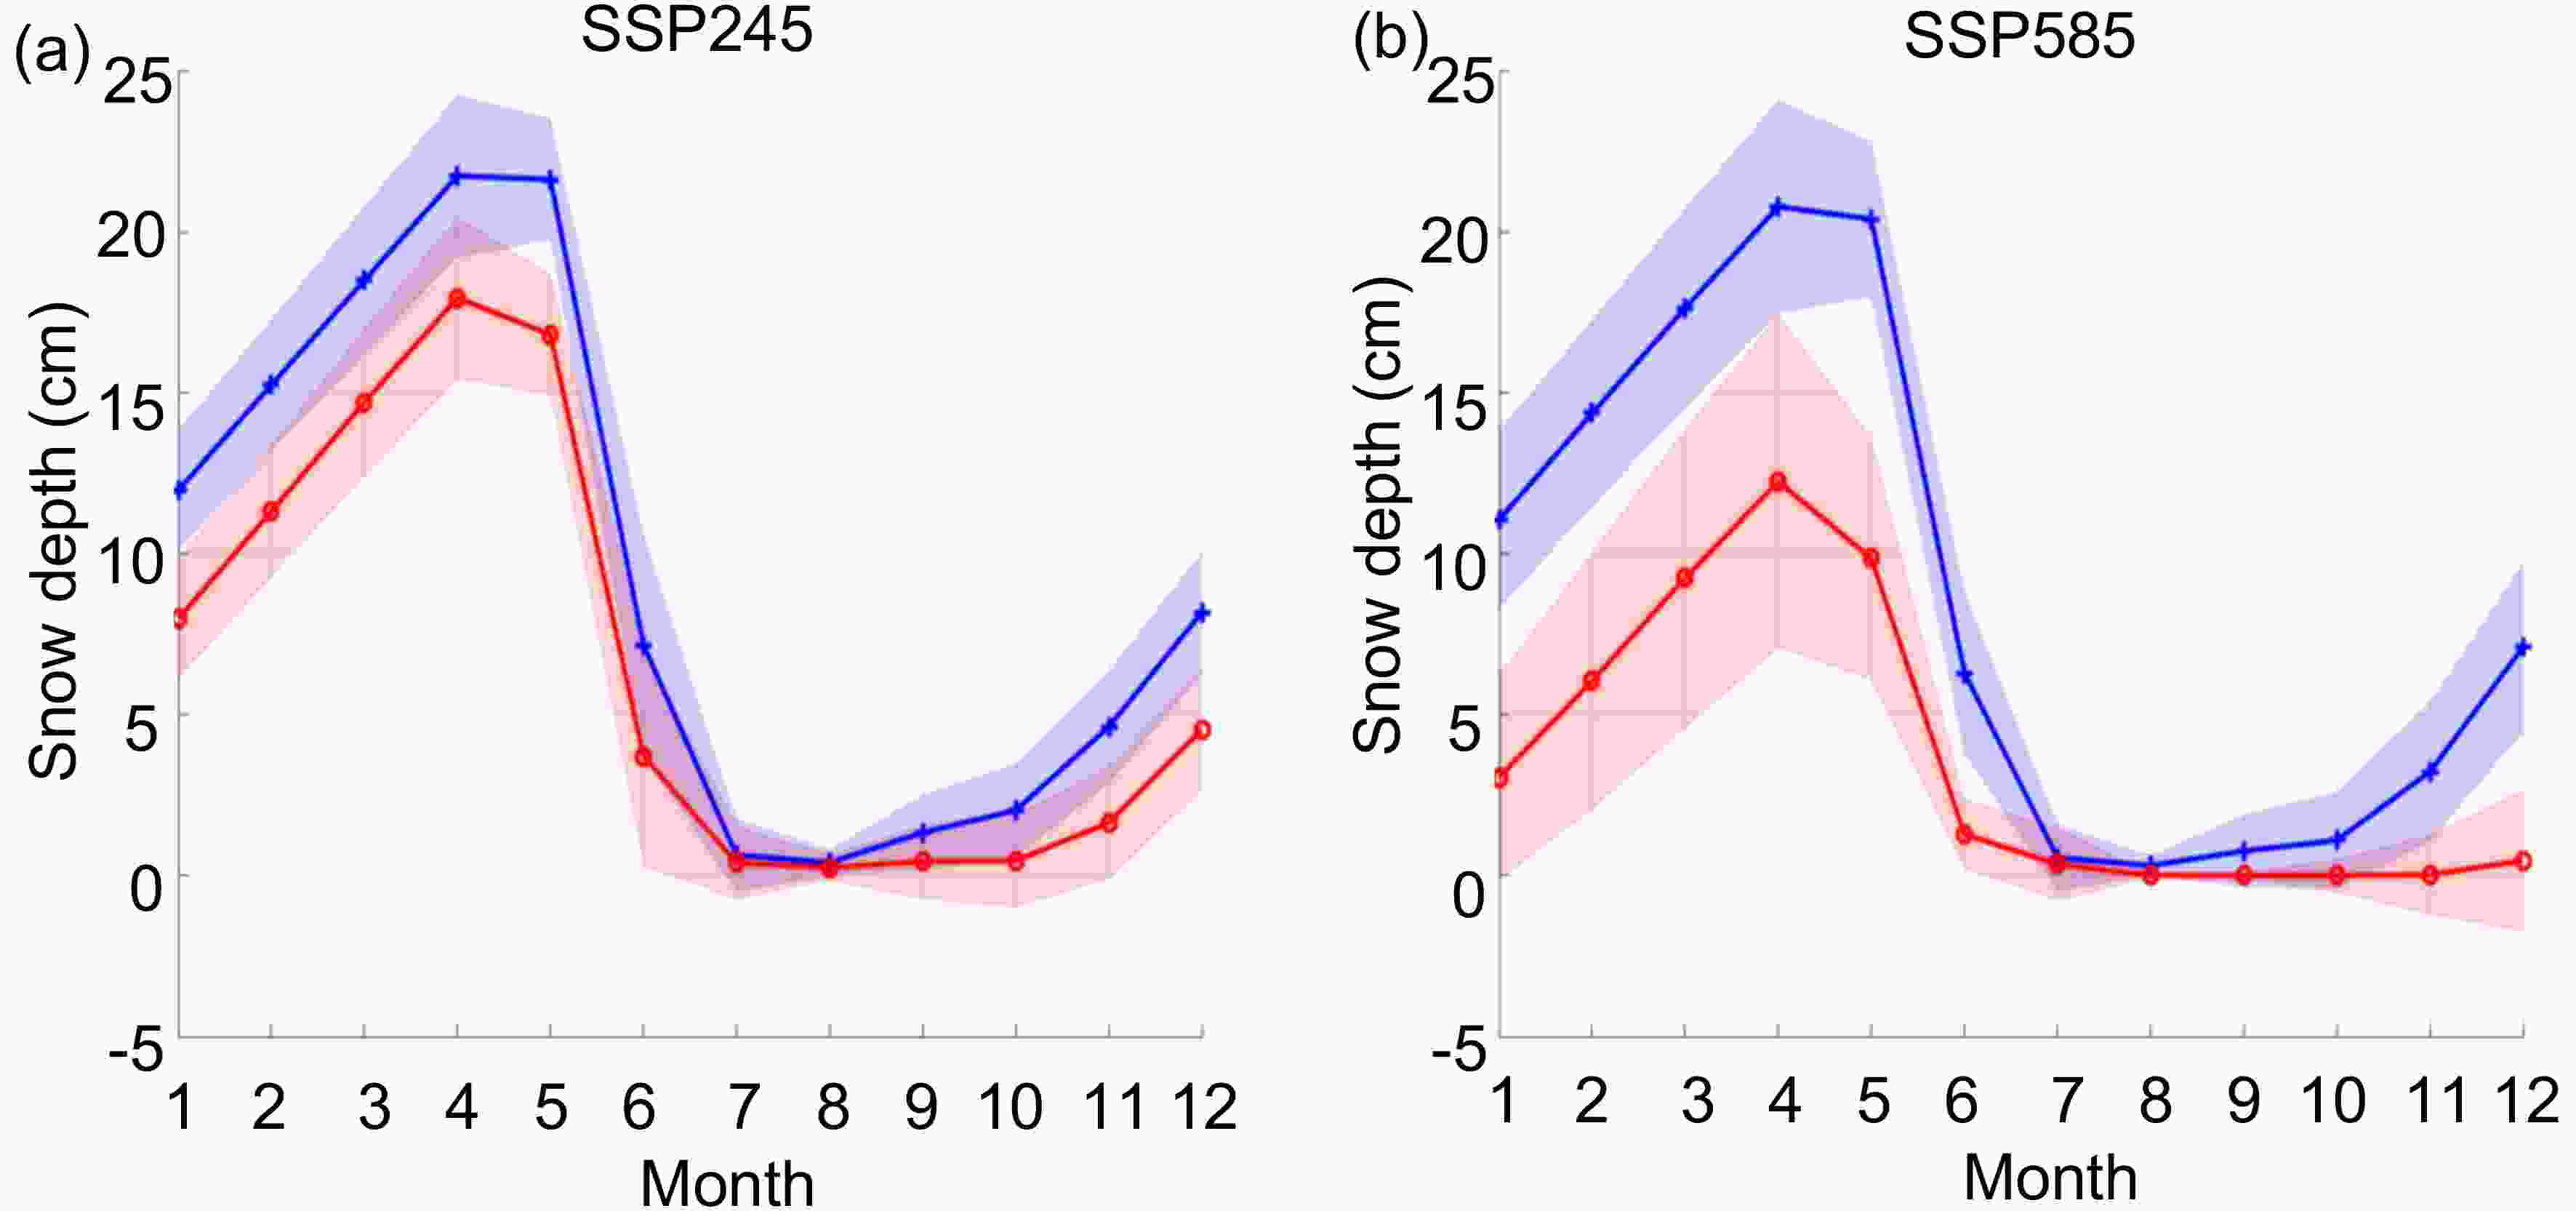 Figure11. Seasonal cycle of snow depth over Arctic sea ice under the (a) SSP2-4.5 and (b) SSP5-8.5 scenario. The thick blue and red lines represent the seasonal cycle of snow depth for the MMM during 2030–49 and 2080–99, respectively. The shaded areas represent the uncertainty in the future projections as quantified by 1 std of the seasonal cycle among the projections produced by 21 CMIP6 models.
As shown in the time-varying snow depth averaged for the Arctic basin (Fig. 12), the SSP2-4.5 scenario leads to a decrease in snow depth at a rate of ?0.6 cm (10 yr)?1, which is nearly a factor of 2 smaller than that of the SSP5-8.5 scenario [?1.1 cm (10 yr)?1]. Besides, it is suggested that the snow depth stops declining in the mid-2080s under the SSP2-4.5 scenario—the annual mean snow depth is 6.7 cm during 2080–99. However, under the SSP5-8.5 scenario, the negative trend maintains until the end of the 21st century and the annual mean snow depth drops to 3.5 cm.
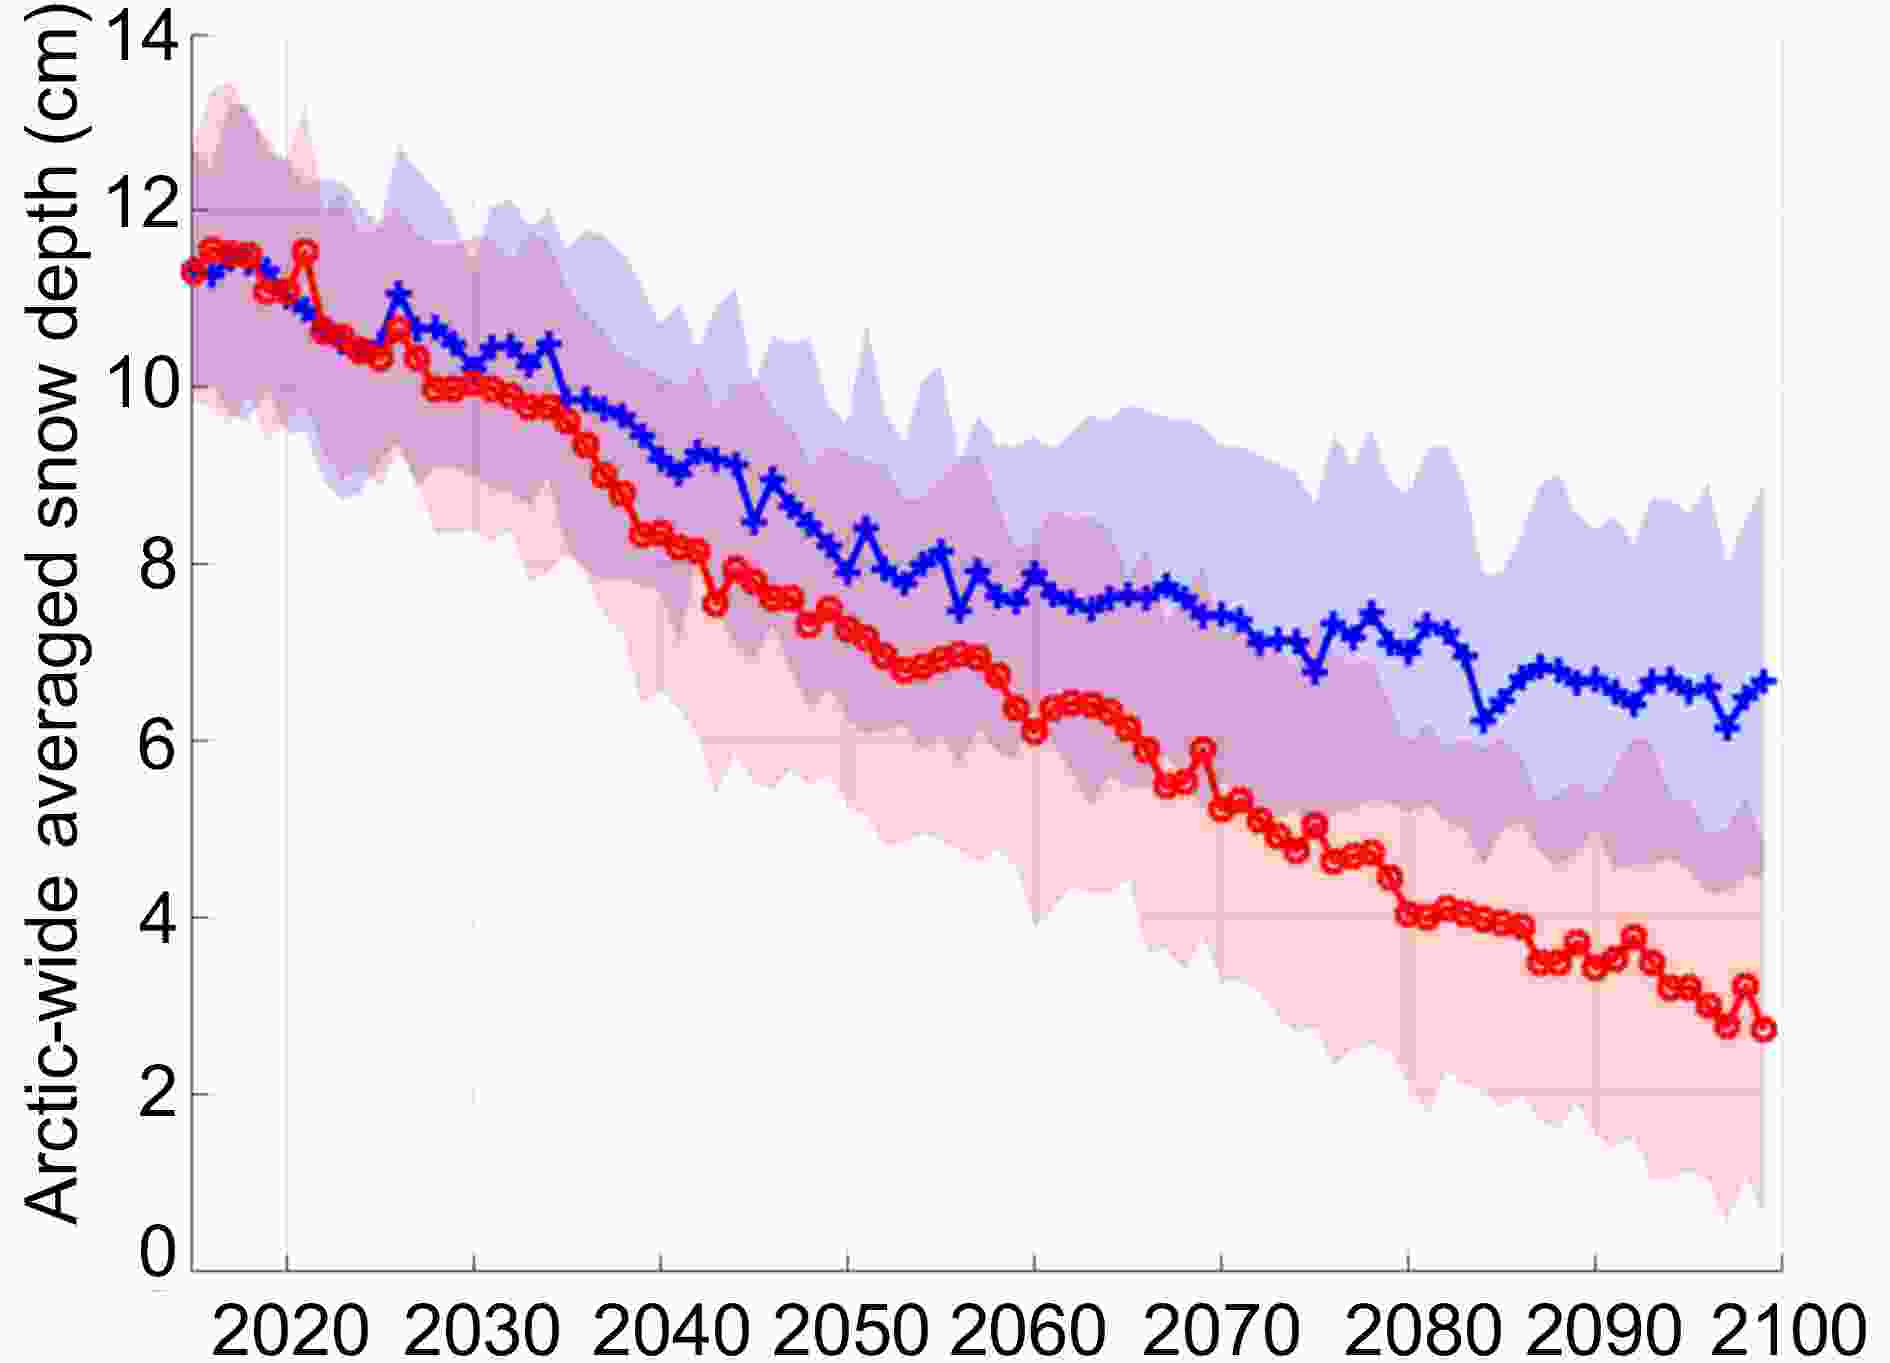 Figure12. Time series of annual mean snow depth over Arctic sea ice for the MMM from 2015 to 2099 under the SSP2-4.5 (blue) and SSP5-8.5 (red) scenarios. The shaded areas represent the uncertainty in the future projections as quantified by 1 std of the time series projections produced by 21 CMIP6 models.
Spatially, the areas with a relatively large reduction in snow depth from the historical period of 1993–2014 to 2030–49 under the SSP5-8.5 scenario are broader than those of SSP2-4.5, with a decrease of 4–6 cm distributed over the entire central Arctic and the western Beaufort, Chukchi and East Siberian seas (Fig. 13c). On the contrary, the areas with a decrease of 4–6 cm only occur in a smaller area over the central Arctic (10°W–60°E and 150°E–150°W; Fig. 13a) under the SSP2-4.5 scenario. The differences between SSP2-4.5 and SSP5-8.5 become more apparent for snow depth during 2080–99. A greater amount of snow depth reduction (more than 10 cm) occurs in the central Arctic under the SSP5-8.5 scenario (Fig. 13d) than that of SSP2-4.5 (< 8 cm; Fig. 13b) relative to the historical period, especially for the areas north of Greenland and the Canadian Arctic, and the east coastal areas of Greenland.
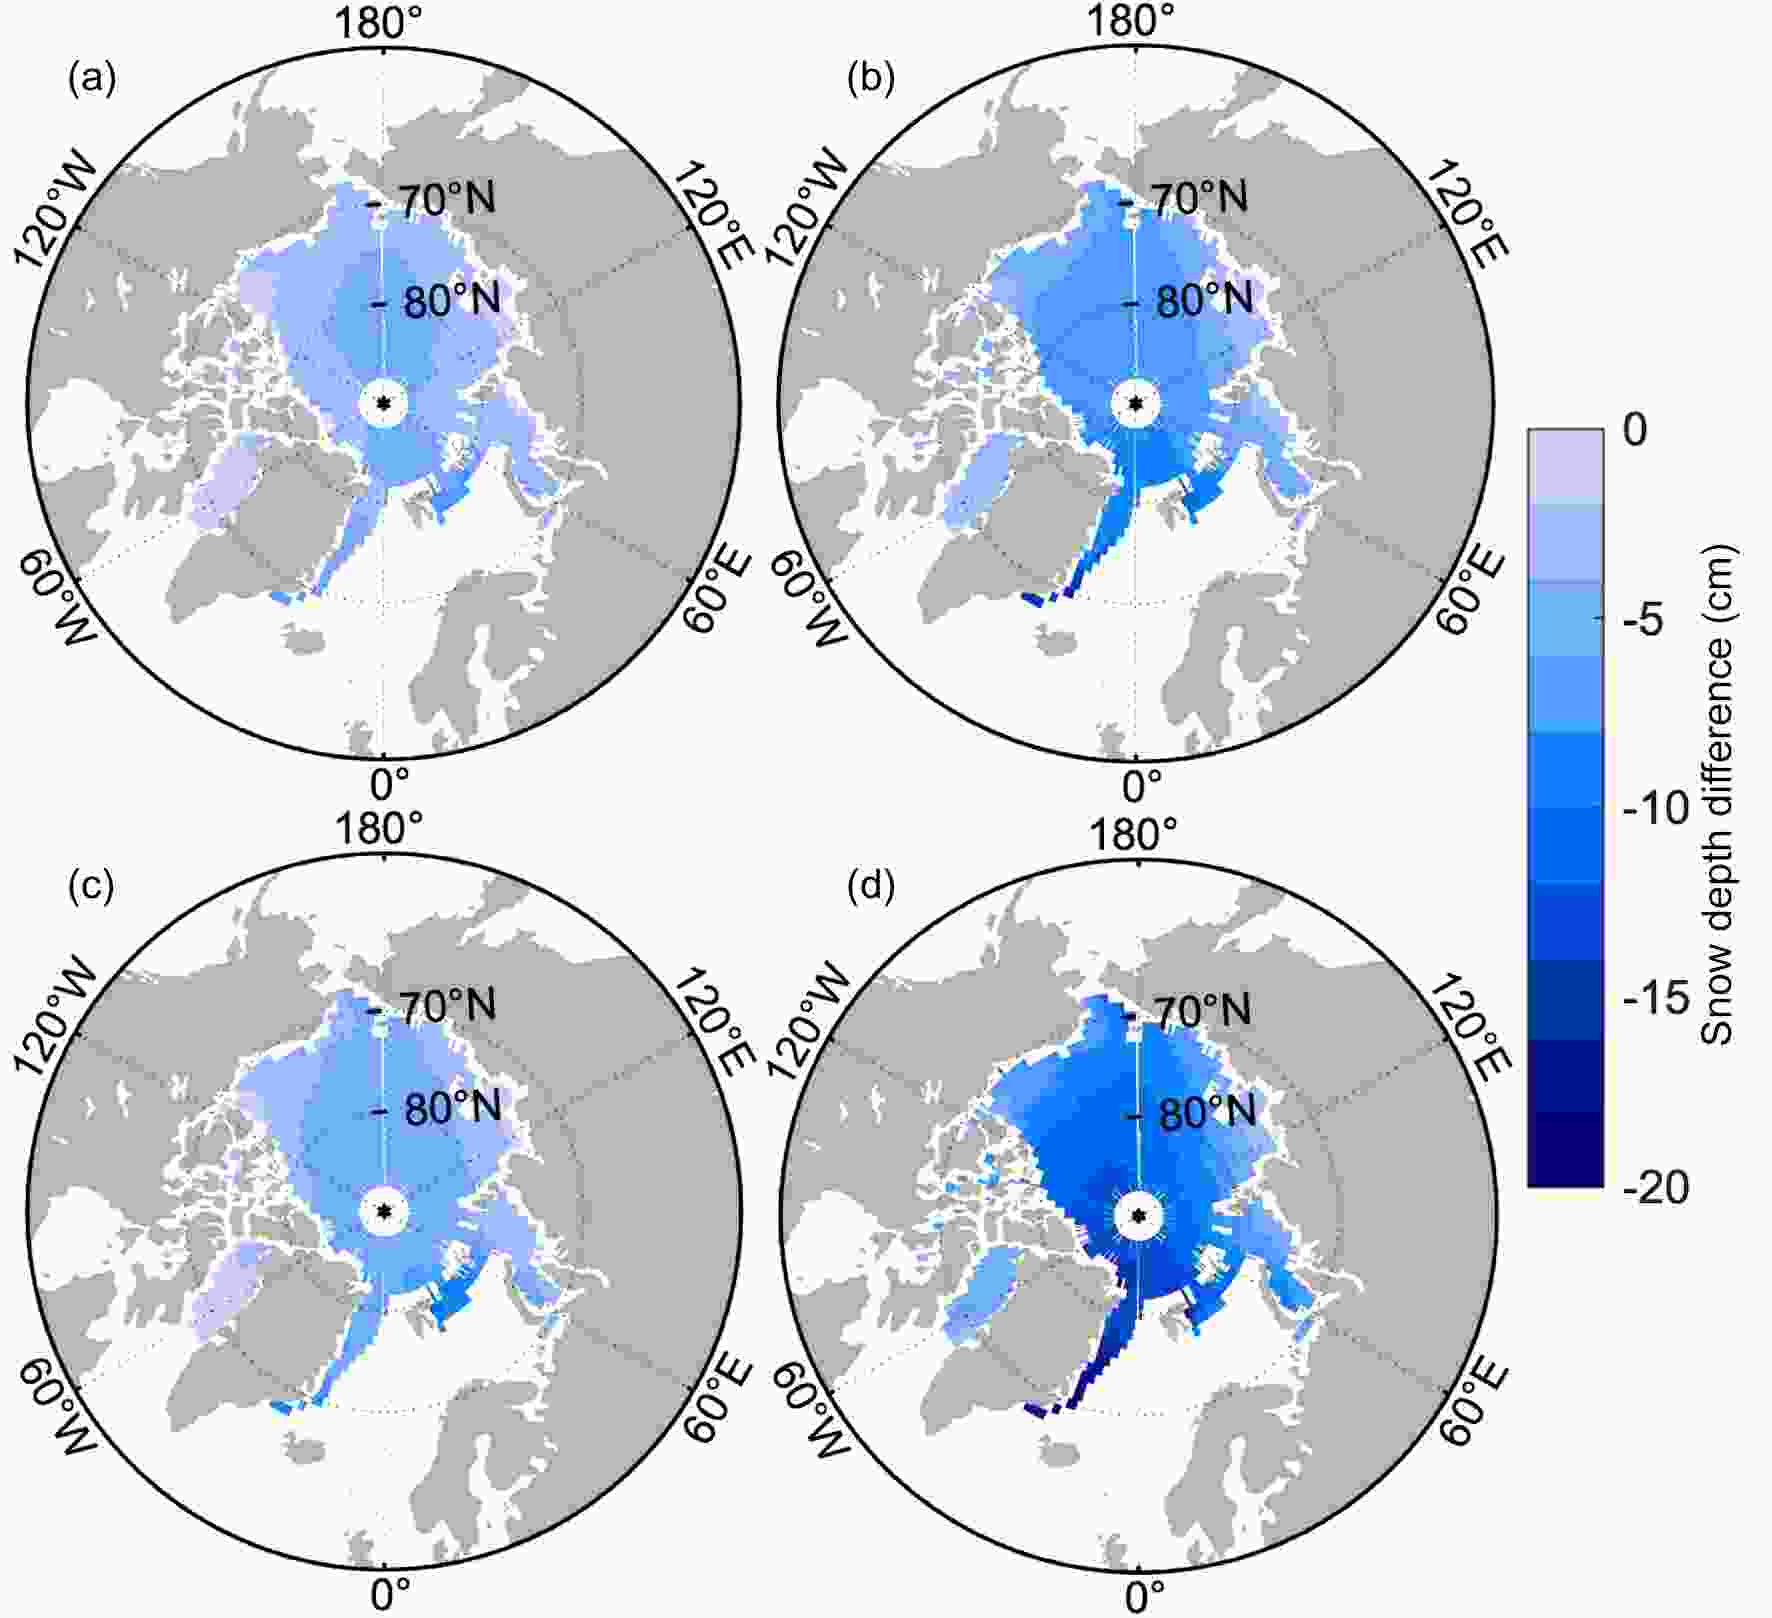 Figure13. Changes in the climatology of annual mean snow depth (cm) for the MMM under the (a, b) SSP2-4.5 and (c, d) SSP5-8.5 scenario during (a, c) 2030–49 and (b, d) 2080–99 compared to the historical simulation during 1993–2014.
| Model family | Name | Differences in model components |
| BCC | BCC-CSM2-MR | Atmos: BCC_AGCM3_MR (T106; 320 × 160 lon/lat; 46 levels; top level 1.46 hPa) |
| BCC-ESM1 | Atmos: BCC_AGCM3_LR (T42; 128 × 64 lon/lat; 26 levels; top level 2.19 hPa); AtmosChem: BCC-AGCM3-Chem | |
| CESM2 | CESM2 | Atmos: CAM6 (0.9 × 1.25 finite volume grid; 288 × 192 lon/lat; 32 levels; top level 2.25 hPa) |
| CESM2-FV2 | Atmos: CAM6 (1.9 × 2.5 finite volume grid; 144 × 96 lon/lat; 32 levels; top level 2.25 hPa) | |
| CESM2-WACCM | Atmos: WACCM6 (0.9 × 1.25 finite volume grid; 288 × 192 lon/lat; 70 levels; top level 4.5e-06 hPa); | |
| CESM2-WACCM-FV2 | Atmos: WACCM6 (1.9 × 2.5 finite volume grid; 144 × 96 lon/lat; 70 levels; top level 4.5e-06 hPa) | |
| E3SM | E3SM-1-0 | Atmos: EAM (v1.0); Land: ELM (v1.0), MOSART (v1.0) |
| E3SM-1-1 | Atmos: EAM (V1.1); Land: ELM (V1.1) with active biogeochemistry using the Converging Trophic Cascade plant; ocnBgchem: BEC (biogeochemical Elemental Cycling model) | |
| E3SM-1-1-ECA | Atmos: EAM (V1.1); Land: ELM (V1.1) with active biogeochemistry using the Equilibrium Chemistry Approximation to represent plant; ocnBgchem: BEC | |
| EC-Earth | EC-Earth3 | Land: HTESSEL |
| EC-Earth3-Veg | Land: HTESSEL and LPJ-GUESS v4 | |
| GFDL | GFDL-CM4 | Atmos: GFDL-AM4.0.1 (33 levels; top level 1 hPa); AtmosChem: Fast chemistry, aerosol only; Land: GFDL-LM4.0.1; OcnBgchem: GFDL-BLINGv2; Resolution: ocean: 25 km; sea ice: 25 km |
| GFDL-ESM4 | Atmos: GFDL-AM4.1 (49 levels; top level 1 hPa); AtmosChem: GFDL-ATMCHEM4.1 (full atmospheric chemistry); Land: GFDL-LM4.1; OcnBgchem: GFDL-COBALTv2; Resolution: ocean: 50 km; sea ice: 50 km. | |
| MPI-ESM | MPI-ESM1-2-LR | Aerosol: none, prescribed MACv2-SP; Atmos: ECHAM6.3 (spectral T63; 192 × 96 lon/lat; 47 levels; top level 0.01 hPa); Ocean: MPIOM1.63 (bipolar GR1.5, approximately 1.5°; 256 × 220 lon/lat) |
| MPI-ESM1-2-HR | Aerosol: none, prescribed MACv2-SP; Atmos: ECHAM6.3 (spectral T127; 384 × 192 lon/lat; 95 levels; top level 0.01 hPa); Ocean: MPIOM1.63 (tripolar TP04, approximately 0.4°; 802 × 404 lon/lat) | |
| MPI-ESM-1-2-HAM | Aerosol: HAM2.3; Atmos: ECHAM6.3 (spectral T63; 192 × 96 lon/lat; 47 levels; top level 0.01 hPa); AtmosChem: Sulfur chemistry; Ocean: MPIOM1.63 (bipolar GR1.5, approximately 1.5°; 256 × 220 lon/lat) | |
| NorESM | NorESM2-LM | Atmos: CAM-OSLO6 (2° resolution; 144 × 96 lon/lat; 32 levels; top level 3 hPa); Land: CLM5; Ocean: updated MICOM (1° resolution; 360 × 384 lon/lat; 70 levels; top grid cell minimum 0–2.5 m); Sea ice: CICE5 |
| NorESM2-MM | Atmos: CAM-OSLO6 (1° resolution; 288 × 192 lon/lat; 32 levels; top level 3 hPa); Land: CLM5; Ocean: updated MICOM (1° resolution; 360 × 384 lon/lat; 70 levels; top grid cell minimum 0–2.5 m); Sea ice: CICE5 | |
| NorCPM1 | Atmos: CAM-OSLO4.1 (2° resolution; 144 × 96 lon/lat; 26 levels; top level ~2 hPa); Land: CLM4; Ocean: MICOM1.1 (1° resolution; 320 × 384 lon/lat; 53 levels; top grid cell 0-2.5 m); Sea ice: CICE4 | |
| Notes: Atmos, AtmosChem and OcnBgchem represent the atmospheric model, atmospheric chemistry model, and oceanographic biogeochemistry model, respectively. | ||
Table3. Different configurations of model components for selected CMIP6 models in the same family.
(a) The BCC model family includes BCC-CSM2-MR and BCC-ESM1. The major differences between the two models include that (1) BCC-CSM2-MR has a higher spatial and vertical resolution for the atmospheric and land surface model components than those of BCC-ESM1, and (2) BCC-ESM1 includes an atmospheric chemistry model of BCC-AGCM3-Chem while BCC-CSM2-MR does not (Table 3). Both models greatly underestimate the Arctic-wide averaged snow depth against SD-LZ19, although BCC-CSM2-MR has thicker snow than that of BCC-ESM1 (Table 2). BCC-CSM2-MR produces interannual variability that is similar to the observation, whereas BCC-ESM1 shows weaker interannual variability. Both models greatly underestimate the observed decreasing rate of snow depth, although BCC-CSM2-MR has a greater negative trend than that of BCC-ESM1 (Table 2). Thus, the utilization of fine resolution in the atmospheric and land surface model might be helpful for reducing the thin snow bias, strengthening the interannual variability, and enhancing the decline of snow depth for the BCC model, although more investigation is needed to understand the effect of the inclusion of the atmospheric chemistry model on snow depth simulation by the BCC models.
(b) The CESM2 model family includes CESM2, CESM2-FV2, CESM2-WACCM, and CESM2-WACCM-FV2, with the same spatial resolution for the ocean and sea-ice model components. Here, we consider the simulation by CESM2 as the benchmark and compare the other three versions against CESM2. For the Arctic-wide averaged snow depth, as shown in Table 2, CEMS2 simulates substantially thinner snow, weaker interannual variability, and a relatively larger decreasing trend than those of the observation. CESM2-FV2 uses a coarser resolution for the atmospheric and land surface model components relative to CESM2. This change leads to increased Arctic-wide averaged snow depth, enhanced interannual variability, and a slightly greater decreasing trend. Compared to CESM2, CESM2-WACCM has enhanced vertical resolution in the stratosphere and mesosphere and incorporates interactive stratospheric chemistry, and gravity wave parameterizations in the upper atmosphere. These features give this model a much-improved representation of the stratosphere than low-top models. These changes also lead to increased Arctic-wide averaged snow depth and a much greater decreasing trend, but no change in interannual variability. Together, CESM2-WACCM-FV2 leads to the largest increase in snow depth, no change in interannual variability, and a slightly reduced decreasing trend. Thus, both the coarser resolution in the atmospheric model and the high-top atmosphere model help reduce the thin snow bias. The coarser atmospheric resolution tends to enhance the interannual variability of snow depth, whereas the high-top atmosphere model tends to accelerate the decrease in snow depth.
(c) The E3SM model family consists of E3SM-1-0, E3SM-1-1, and E3SM-1-1-ECA. We consider E3SM-1-0 as the benchmark and compare the other two against it. Besides the newer version of model components used by E3SM-1-1 compared to E3SM-1-0 (see details in Table 3), E3SM-1-1 adds active biogeochemistry in the land surface model component and oceanographic biogeochemistry model component. All these changes result in thicker snow depth than that of E3SM-1-0, which substantially underestimates the Arctic-wide averaged snow depth compared to the observation. However, E3SM-1-1 leads to a reduced interannual variability and slower thinning rate than those of E3SM-1-0. Therefore, the inclusion of biogeochemistry processes in both the ocean and land surface model components can reduce the thin snow bias, and it tends to diminish the interannual variability and decelerate the reductions in snow depth. Regarding E3SM-1-1-ECA, its active biogeochemistry scheme uses the Equilibrium Chemistry Approximation (ECA) to represent carbon, nitrogen, and phosphorus cycles in the land surface model component, while E3SM-1-1 uses the Converging Trophic Cascade. E3SM-1-1-ECA has thicker snow, a slightly larger interannual variability, and a faster thinning rate than E3SM-1-1 as well as E3SM-1-0. Therefore, the employment of ECA tends to reduce the thin snow bias, enhance interannual variability, and accelerate the decrease in snow depth. Note that the effects of enhancement of interannual variability and the acceleration of the thinning snow brought by the application of ECA in E3SM-1-1-ECA are stronger than those opposite effects brought by the inclusion of biogeochemistry processes in both the ocean and land surface model components in E3SM-1-1.
(d) The EC-Earth model family consists of EC-Earth3 and EC-Earth3-Veg. The only difference between the two models is that EC-Earth3-Veg adds a dynamic vegetation model (LPJ-GUESS version 4) in the land surface model component (Table 3). Both models underestimate the Arctic-wide averaged snow depth against SD-LZ19, although EC-Earth3 has larger snow depth than that of EC-Earth3-Veg. EC-Earth3-Veg also has a smaller interannual variability and slower decreasing trend than those of EC-Earth3. Therefore, the dynamic vegetation model used by EC-Earth3-Veg tends to worsen the thin snow bias, decrease the interannual variability, and improve the trend by substantially slowing the decrease. It also changes the spatial pattern of the snow depth trend. EC-Earth3-Veg shows that snow depth with a statistically significant decreasing trend mainly concentrates in the north of the Beaufort Sea and the Canadian Arctic, while EC-Earth3 showing the thinning snow in the north of Greenland and the Barents Sea, and east coastal areas of Greenland (Fig. 10).
(e) The GFDL model family consists of GFDL-CM4 and GFDL-ESM4. GFDL-CM4 has 33 levels in the atmosphere, fast chemistry for aerosol only with 21 tracers, and BLINGv2 oceanographic biogeochemistry with 6 tracers, whereas GFDL-ESM4 has 49 levels, full atmospheric chemistry with 103 tracers, and COBOLTv2 oceanographic biogeochemistry with 30 tracers. Additionally, GFDL-CM4 has a higher resolution for the ocean and sea-ice models than GFDL-ESM4 (see Table 3 for details). They both underestimate the Arctic-wide averaged snow depth against the observation. However, GFDL-CM4 has thicker snow depth than GFDL-ESM4. Also, GFDL-CM4 simulates higher interannual variability than GFDL-ESM4. It suggests that the application of a finer resolution of 25 km by GFDL-CM4 can possibly reduce the thin snow bias and enhance the interannual variability. It is worth noting that GFDL-CM4 reproduces more features of the spatial pattern of the trend recorded by SD-LZ19 than GFDL-ESM4, even though they have the same values of the trend for Arctic-wide averaged snow. The belt area over the Beaufort Sea with thickening snow and the eastern central Arctic that is dominated by thinning snow from 1993 to 2014 are reproduced by GFDL-CM4 (Fig. 10).
(f) The MPI-ESM model family consists of MPI-ESM1-2-LR, MPI-ESM1-2-HR, and MPI-ESM-1-2-HAM. We consider MPI-ESM1-2-LR as the benchmark and compare the other two against it. MPI-ESM1-2-HR has a finer resolution of 100 km for the atmospheric and land surface model components and 50 km for the ocean and sea-ice model components, while MPI-ESM1-2-LR uses 250 km consistently (see details in Tables 2 and 3). MPI-ESM1-2-LR and MPI-ESM1-2-HR have similar Arctic-wide averaged snow depths, which are substantially smaller than those of SD-LZ19. They also have the same interannual variability, which is much smaller than that of SD-LZ19. However, the trend simulated by MPI-ESM1-2-HR is much larger than that of MPI-ESM1-2-LR as well as SD-LZ19. It suggests that the application of the finer resolution by MPI-ESM1-2-HR tends to accelerate the decreases of snow substantially while showing small effects on snow depth and interannual variability. MPI-ESM-1-2-HAM uses the same resolution as MPI-ESM1-2-LR. However, MPI-ESM-1-2-HAM includes the sulfur chemistry processes in the atmosphere and adds HAM2.3 as the aerosol scheme. Compared to MPI-ESM1-2-LR, MPI-ESM-1-2-HAM has larger snow depth, a higher interannual variability, and a slower thinning rate. However, as shown in Fig. 10, the smaller thinning rate is mainly due to the cancellation effect of the large increasing trend extending from the Beaufort Sea to the East Siberian Sea, which is not recorded by SD-LZ19. Therefore, it suggests that the inclusion of the aerosol and sulfur chemistry processes in the atmospheric model can possibly reduce the thin snow bias and enhance the interannual variability.
(g) The NorESM model family consists of NorESM2-LM, NorESM2-MM, and NorCPM1. We consider NorESM2-LM as the benchmark. NorESM2-MM has much thicker Arctic-wide averaged snow than NorESM2-LM, even though they both underestimate the snow depth against SD-LZ19. NorESM2-MM has similar interannual variability and a much smaller thinning rate compared to NorESM2-LM. It suggests that the application of the fine resolution in the atmospheric and land surface model components by NorESM2-MM tends to reduce the thin snow bias and decelerate the reductions in snow depth. Note that, as shown in Fig. 10, NorESM2-LM and NorESM2-MM have distinct spatial patterns of the trend, especially for the areas around the periphery of the Arctic Basin extending from the east coastal areas of Greenland to the East Siberian Sea. Regarding NorCPM1, which is built on the previous version of NorESM (NorESM1) employed by CMIP5 with some modifications and updates, it is apparent that NorCPM1 highly overestimates the snow depth, interannual variability and thinning trend of snow. From the other perspective, the differences between NorCPM1 and NorESM2-LM, i.e., more realistic simulations of snow depth, interannual variability, and trend by NorESM2-LM, can be considered as the improvements made by the latest NorESM employed by CMIP6 against the previous version of NorESM.
Although models may have biases in snow depth simulations, they all seem to have similar seasonal cycles in terms of the shape, which is different from the one reflected by SD-LZ19 and SD-UB AMSR2, especially for the period of January–May (Fig. 2). Given these consistent snow depth biases in the seasonal cycle simulated by all the model candidates, a coordinated climate model experiment might help to understand the causes of this issue. Some possible causes include microphysics parameterizations, heat transport processes between the ocean, ice, snow and atmosphere, and dynamics processes associated with the changes in snow depth.
Our results show that, overall, the CMIP6 models can reproduce some aspects of the observed snow depth climatology and variability: (1) No single model simulates an interannual variability exceeding the 1.5 interquartile range and the observed interannual variability, which is 1.2 cm, is within the range of the simulations by the CMIP6 models. A total of 13 out of 31 models have an interannual variability within 1 std of the observed one. (2) All the models show negative trends of snow depth during 1993–2014 and the observed trend [?1.3 cm (10 yr)?1] is within the range of the simulations. The MMM shows a similar thinning rate of ?1.2 cm (10 yr)?1. A total of 27 out of 31 models have an Arctic-wide averaged annual mean snow depth linear trend within 1 std of the observed one. (3) Both the observed and simulated snow depth minimum occurs in August. (5) Similar to the spatial distribution of the observed snow depth trend, the MMM shows that snow depth in the Arctic is dominated by a negative tendency and the thinning is strongest in the central Arctic.
However, substantial spatiotemporal discrepancies are identified: (1) SD-LZ19 indicates that the thickest snow occurs in March, while in the MMM it occurs in May, suggesting a late seasonal maximum snow depth by two months in the models. (2) The observed snow depth minimum (SD-LZ19) is 7.3 cm, while in the MMM it is only 1 cm, suggesting a remarkable thin bias for seasonal snow minimum simulation, and an incorrect transition from the growth to decay period. (3) SD-LZ19 shows that the accumulation of snow is from August to December and tends to grow very slowly to the succeeding March. After that, it decreases until August. However, the MMM shows that the snow continues to accumulate until the succeeding May, suggesting a two-month longer growth period in CMIP6. (4) Most models greatly underestimate the interannual variability for snow depth over HF-MYI while overestimating it over HF-FYI. (5) The observed thinning snow tendency over HF-MYI is underestimated by most models. (6) Most models cannot reproduce the observed snow depth gradient from the north of Greenland and the Canadian Arctic to the central Arctic and the outer areas due to the great underestimation of thick snow over HF-MYI. (7) Most models cannot reproduce the largest thinning rate in the central Arctic. Compared to the observed trend, the thinning rate indicated by the MMM is smaller, and only scattered areas are considered as statistically significant and in agreement across the models in terms of the direction of changes.
Future projections suggest that snow in the Arctic is dominated by a negative tendency from 2015 to 2099. The declining rate of snow depth is larger [?1.1 cm (10 yr)?1] under the SSP5-8.5 scenario, which maintains until the end of the 21st century, than that of the SSP2-4.5 scenario [?0.6 cm (10 yr)?1], in which snow stops thinning in the mid-2080s. Compared to the historical period of 1993–2014, snow depth during 2080–99 decreases by 12.7 cm under the SSP5-8.5 scenario, and the Arctic becomes nearly snow-free during the summer and fall and the accumulation of snow only starts from January. Under the SSP2-4.5 scenario, the decrease in snow is smaller (7.4 cm), and snow can still exist in early summer (June) and starts to accumulate from November, which is two months earlier than in the SSP5-8.5 scenario.
Given the substantial spatiotemporal discrepancies in simulating snow depth over Arctic sea ice during 1993–2014, further efforts are needed to improve the associated capabilities of the CMIP6 models. To facilitate this effort, in this study, we briefly discuss possible causes of the issues of the simulated snow depth for some models based on the same family of models, which may provide useful information to the modelers. In this way, we can be confident in our conclusions as to whether or not greenhouse gas forcing is the dominant player in recent amplified warming in the Arctic. Likewise, the uncertainties in the projections of future climate change can be greatly reduced.
Acknowledgements. This research was supported by the NOAA Climate Program Office (Grant No. NA15OAR4310163), the National Key R&D Program of China (Grant Nos. 2018YFA0605904 and 2018YFA0605901), and the National Natural Science Foundation of China (Grant No. 41676185). We thank the two anonymous reviewers for their comments, which helped improve and clarify this manuscript.
