HTML
--> --> -->The Taklimakan Desert (TD) is located in Xinjiang (XJ) (Fig. 1), in the continental interior of Asia, far from the ocean, and has a typical dry continental climate (Zhang et al., 2017). Precipitation in XJ is dominant during the warm season (Dong et al., 2018). Precipitation here tends to increase with warming (Li et al., 2015), leading to a wetter regional climate and promoting the growth of vegetation, especially in summer. The Normalized Difference Vegetation Index (NDVI) has shown obvious increases around the TD, most of which are related to human irrigation. For example, the irrigated area in XJ has been increased from 1.2 × 10⁶ ha in 1949 to 4.6 × 10⁶ ha in 2004 (Zhong et al., 2009), which leads to increased local recycled vapor and vegetation growth (Ornstein et al., 2009; Bowring et al., 2014). So far, most studies in XJ investigated the impacts of precipitation on vegetation and found a positive correlation between the two in addition to a wetting and greening tendency over XJ in recent years (Ding et al., 2007; Qiu et al., 2014; Lamchin et al., 2018; Yao et al., 2018). However, the impacts of increased irrigation and vegetation on the local hydrological cycle remain uncertain.
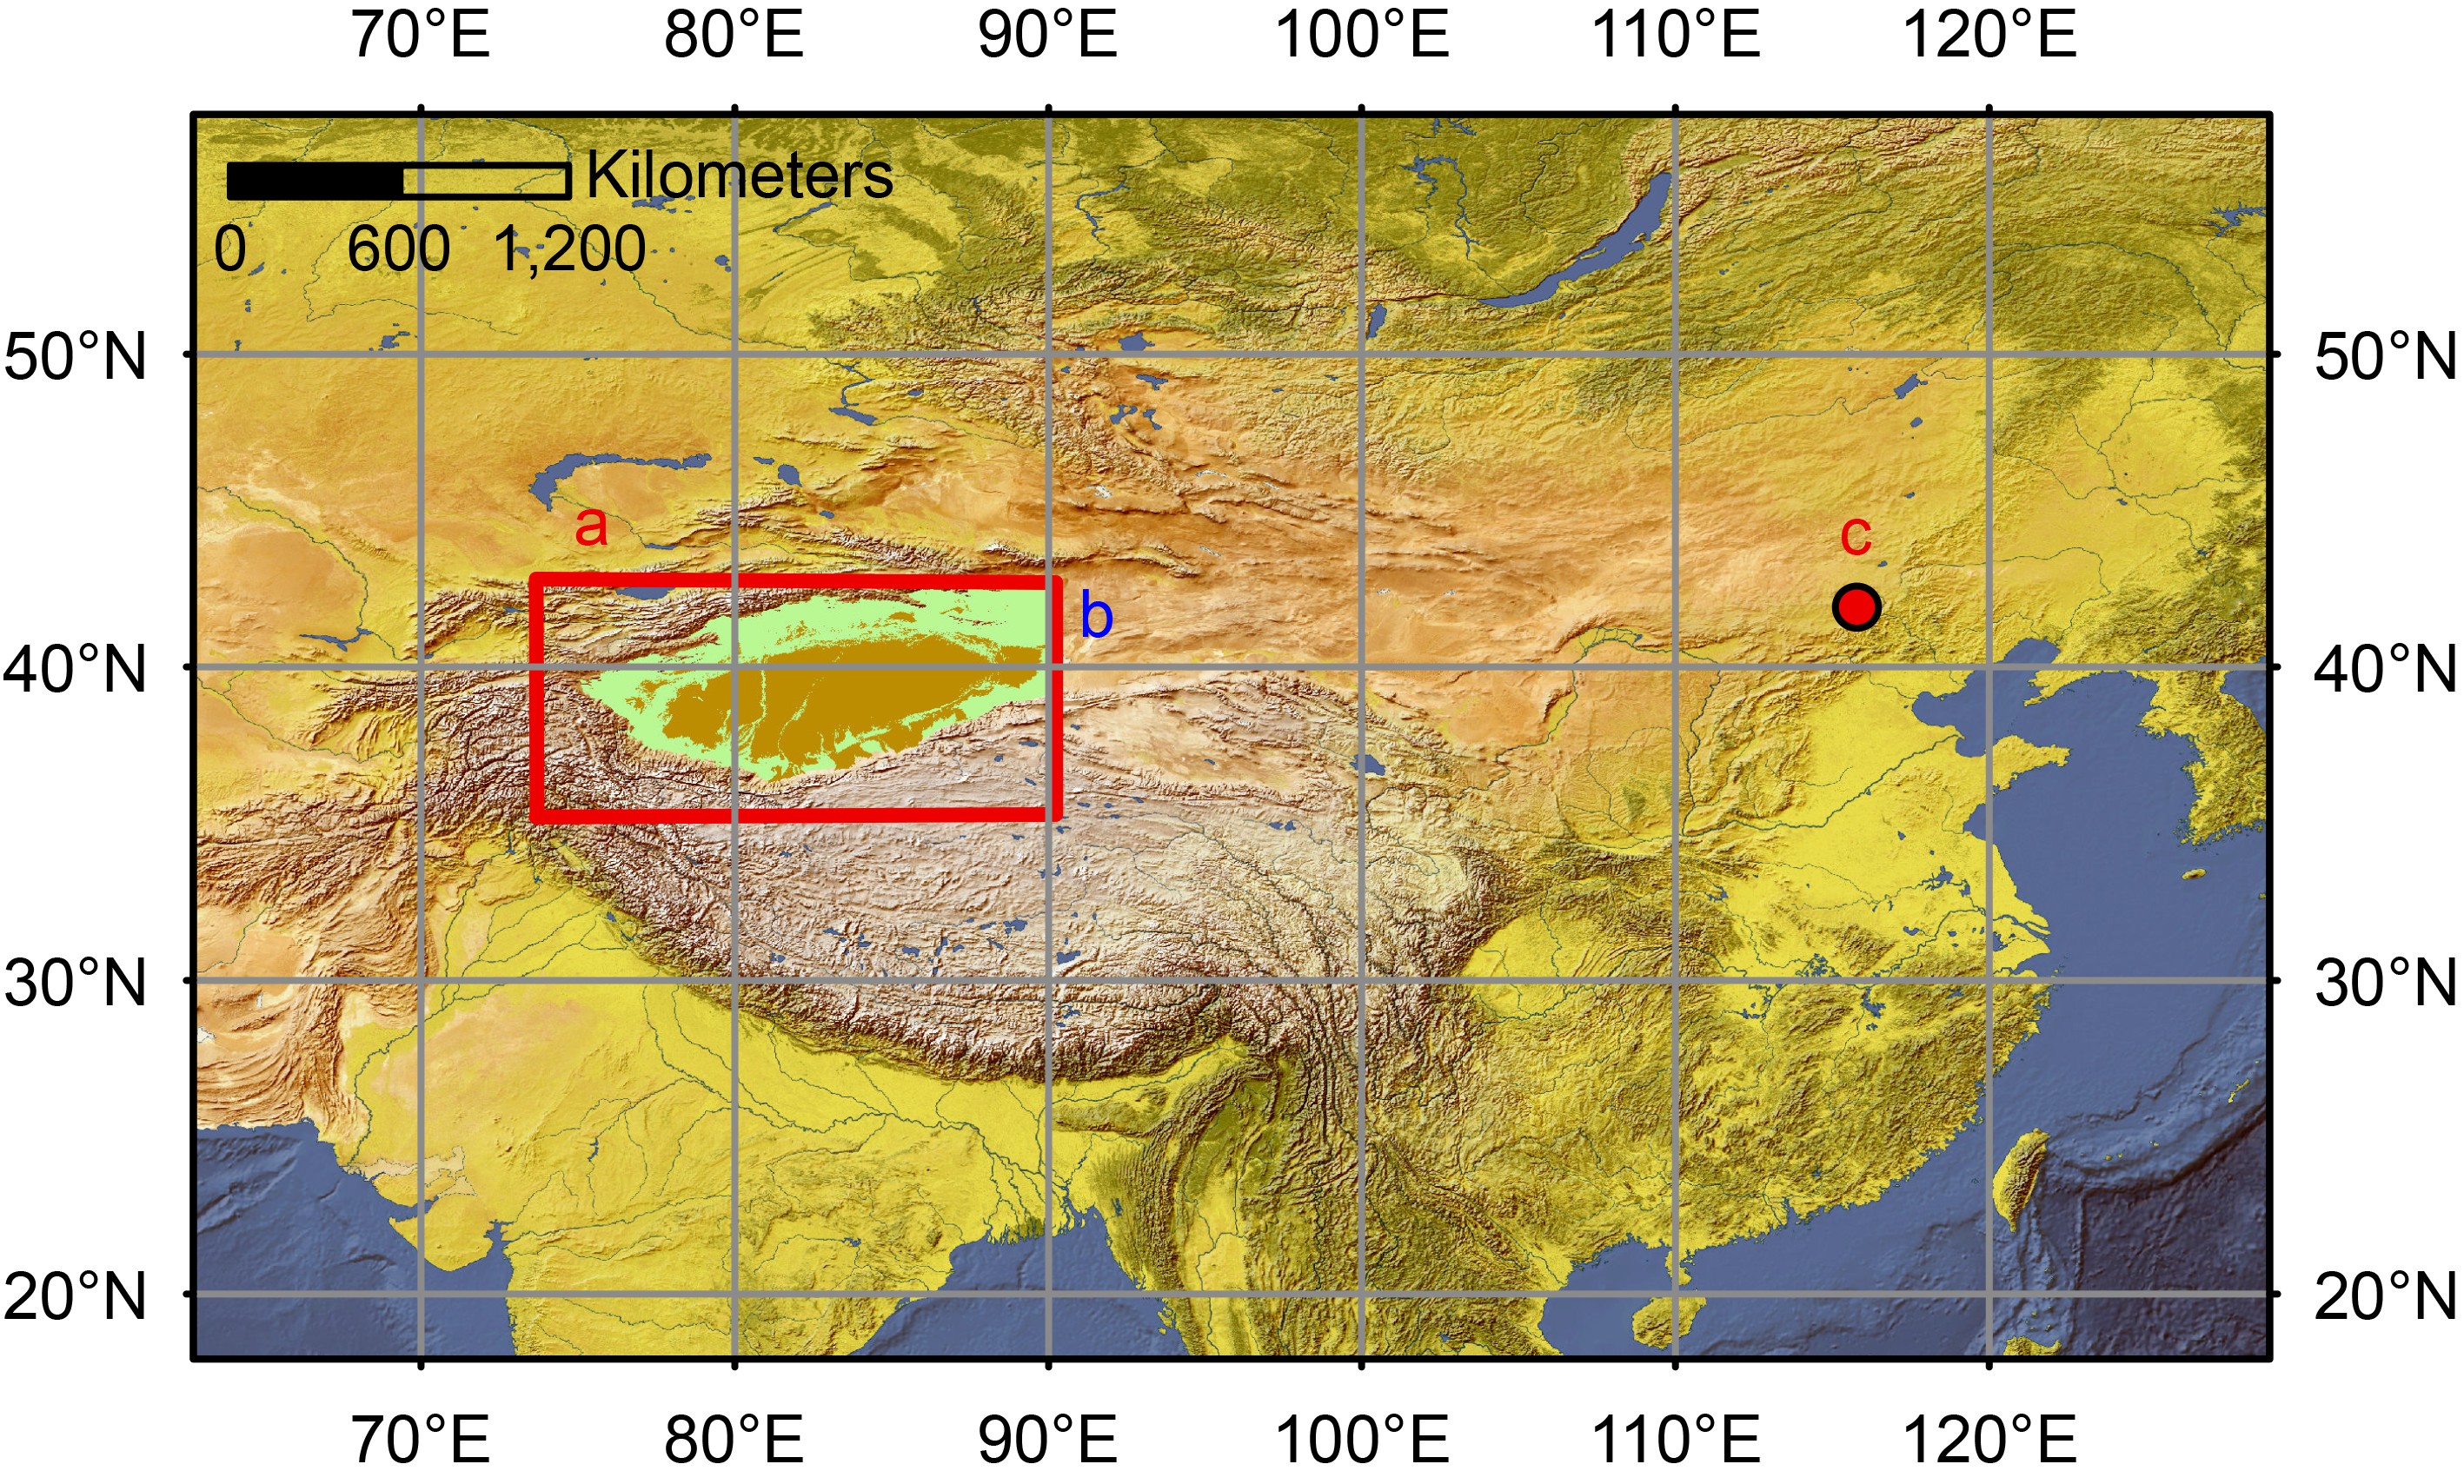 Figure1. Map showing the combination of shaded relief and landcover color, data are acquired from Natural Earth (
Vegetation changes the properties of the land surface and mediates moisture and energy exchange between the surface and the atmosphere (Spracklen et al., 2018). The impacts of vegetation on energy and moisture fluxes are known as biophysical effects (Bonan, 2008; Yu et al., 2016). These biophysical effects exert great impacts on land and atmosphere fluxes (Heald and Spracklen, 2015) which further influence local, regional, and global climate. Generally, the surface albedo of vegetation is lower than that of bare ground, and thus vegetative cover influences the surface energy budget by changing the sensible heat flux (SH) and latent heat flux (LH). Meanwhile, irrigation also leads to a net cooling effect and changes the exchange of energy and moisture, subsequently impacting temperature, precipitation, and local circulations (Koster et al., 2004; Diffenbaugh, 2009).
Precipitation change due to vegetative growth and irrigation change is mainly attributed to water vapor convergence, evaporation, and vegetation transpiration. Evaporation and vegetation transpiration together are referred to as evapotranspiration (ET), representing the locally recycled water vapor. Based on an isotopic model, Wang et al. (2016) illustrated that the contribution of recycled vapor to precipitation in XJ can be up to 16%. ET was strongly regulated by soil moisture through evaporation and the availability of moisture for vegetation (Spracklen et al., 2018). Therefore, the water exchange is also driven by irrigation, which provides moisture for vegetation to grow. In general, vegetation has higher ET compared to bare ground due to greater rainfall interception, evaporation, and transpiration (Zhang et al., 2001). Roots are also important by providing a pathway for subsurface water to reach the atmosphere (Kemena et al., 2018).
Overall, there is a trend towards warmer and wetter conditions and continuously expanding vegetation and irrigation activity in XJ (Shan et al., 2018). Although it is well known that vegetation growth and irrigation have great impacts on energy and water vapor exchange between land surface and atmosphere, their impacts on precipitation are more elusive, especially in the XJ (Han et al., 2017). Besides, a detailed analysis of the atmospheric response induced by growing vegetation in XJ is still lacking. In addition, self-sustainability, i.e., whether increased precipitation due to vegetation is large enough to maintain the vegetation growth (Kemena et al., 2018), is a key issue for vegetation growth (Smith and Torn, 2013; Smith et al., 2015). If we plant vegetation in the largest desert in XJ, whether the increased precipitation due to vegetation growth can maintain the vegetation there is unclear. In this study, we simulate vegetation growth in the TD using irrigation in a global climate model and investigate its local and regional impact. Since most precipitation in XJ occurs during the warm season (Dong et al., 2018), we focused on the vegetation impact in the summer months (JJA). We focus on: (1) local and nonlocal circulation and precipitation changes induced by vegetation growth in the TD, (2) whether the vegetation can maintain itself without irrigation, and (3) if not, how much irrigation water is needed to maintain the vegetation growth.
This paper is organized as follows. Section 2 includes the model description and experimental design. Section 3 shows the climate effects of vegetation and irrigation, and section 4 provides a discussion and summary of the results.
Since the growing speed of vegetation is fastest at the edges of the TD (not shown), we chose an area larger than the TD [region (b) in Fig. 1] as the vegetation growth region. In CLM4, each land grid cell is composed of land units, which are further divided into columns having multiple plant functional types (PFTs). Biogeophysical processes, like SH and LH, are calculated separately for each land unit, column, and PFT, and then averaged over the grid cell and passed to the atmosphere (Oleson et al., 2010). Vegetation in each grid consists of several PFTs, the sum of which is 100% (Hu et al., 2019). The simulation is conducted using an atmosphere-land coupled model with prescribed climatological SST and sea ice without interannual variations. In this sense, each year of simulation can be treated as an independent realization.
An interactive irrigation scheme in CLM4 was adopted, in which a check is made once per day to determine whether irrigation is required. The need for daily irrigation is determined at 6 AM by computing the deficit between the current soil water content and a target soil water content:
where wo is the minimum soil water content that results in no water stress (soil water potential when stomata are fully open), and wsat is the soil water content at saturation. A default value of 0.7 is used for the irrigation weight factor, which was determined empirically to give global, annual irrigation amounts that approximately match observed gross irrigation water use around the year 2000. This parameterization is designed to approximate human behavior—that is, enough water is added in order to avoid water stress in crops, but not so much that the soil is completely saturated. The scheme guarantees the normal growth of crops and calculates the amount of irrigation to allow crops to grow normally, that is, irrigation is turned on when there is a soil moisture deficit. More details about the irrigation scheme can be found in Huang and Ullrich (2016).
Two experiments were performed in this study. A control simulation (P1) is conducted using present-day vegetation and CO2 concentration. An irrigation simulation (P2), identical to the control simulation except that the bare ground in region (b) is converted into irrigable crops with the irrigation scheme turned on (Fig. 2a). Soil texture, soil water, and soil color in region (a), which have been shown to change by vegetation (Ran et al. 2013), are replaced by those at point (c) (Fig. 2b), where the soil texture is loam and the soil properties have been adapted to the growth of crops (Lawrence and Chase 2007). The spatial resolution of atmosphere and land is around one degree. Each simulation was integrated for 130 years. The first 30 years were regarded as a “spin-up” (cold spin-up), consistent with previous studies (Yu et al., 2018; Zeng et al., 2018a) and the remaining 100 years of simulations are used for statistical significance testing. The difference between the two simulations represents the impacts of vegetation growth and irrigation in the TD on the local and global climate.
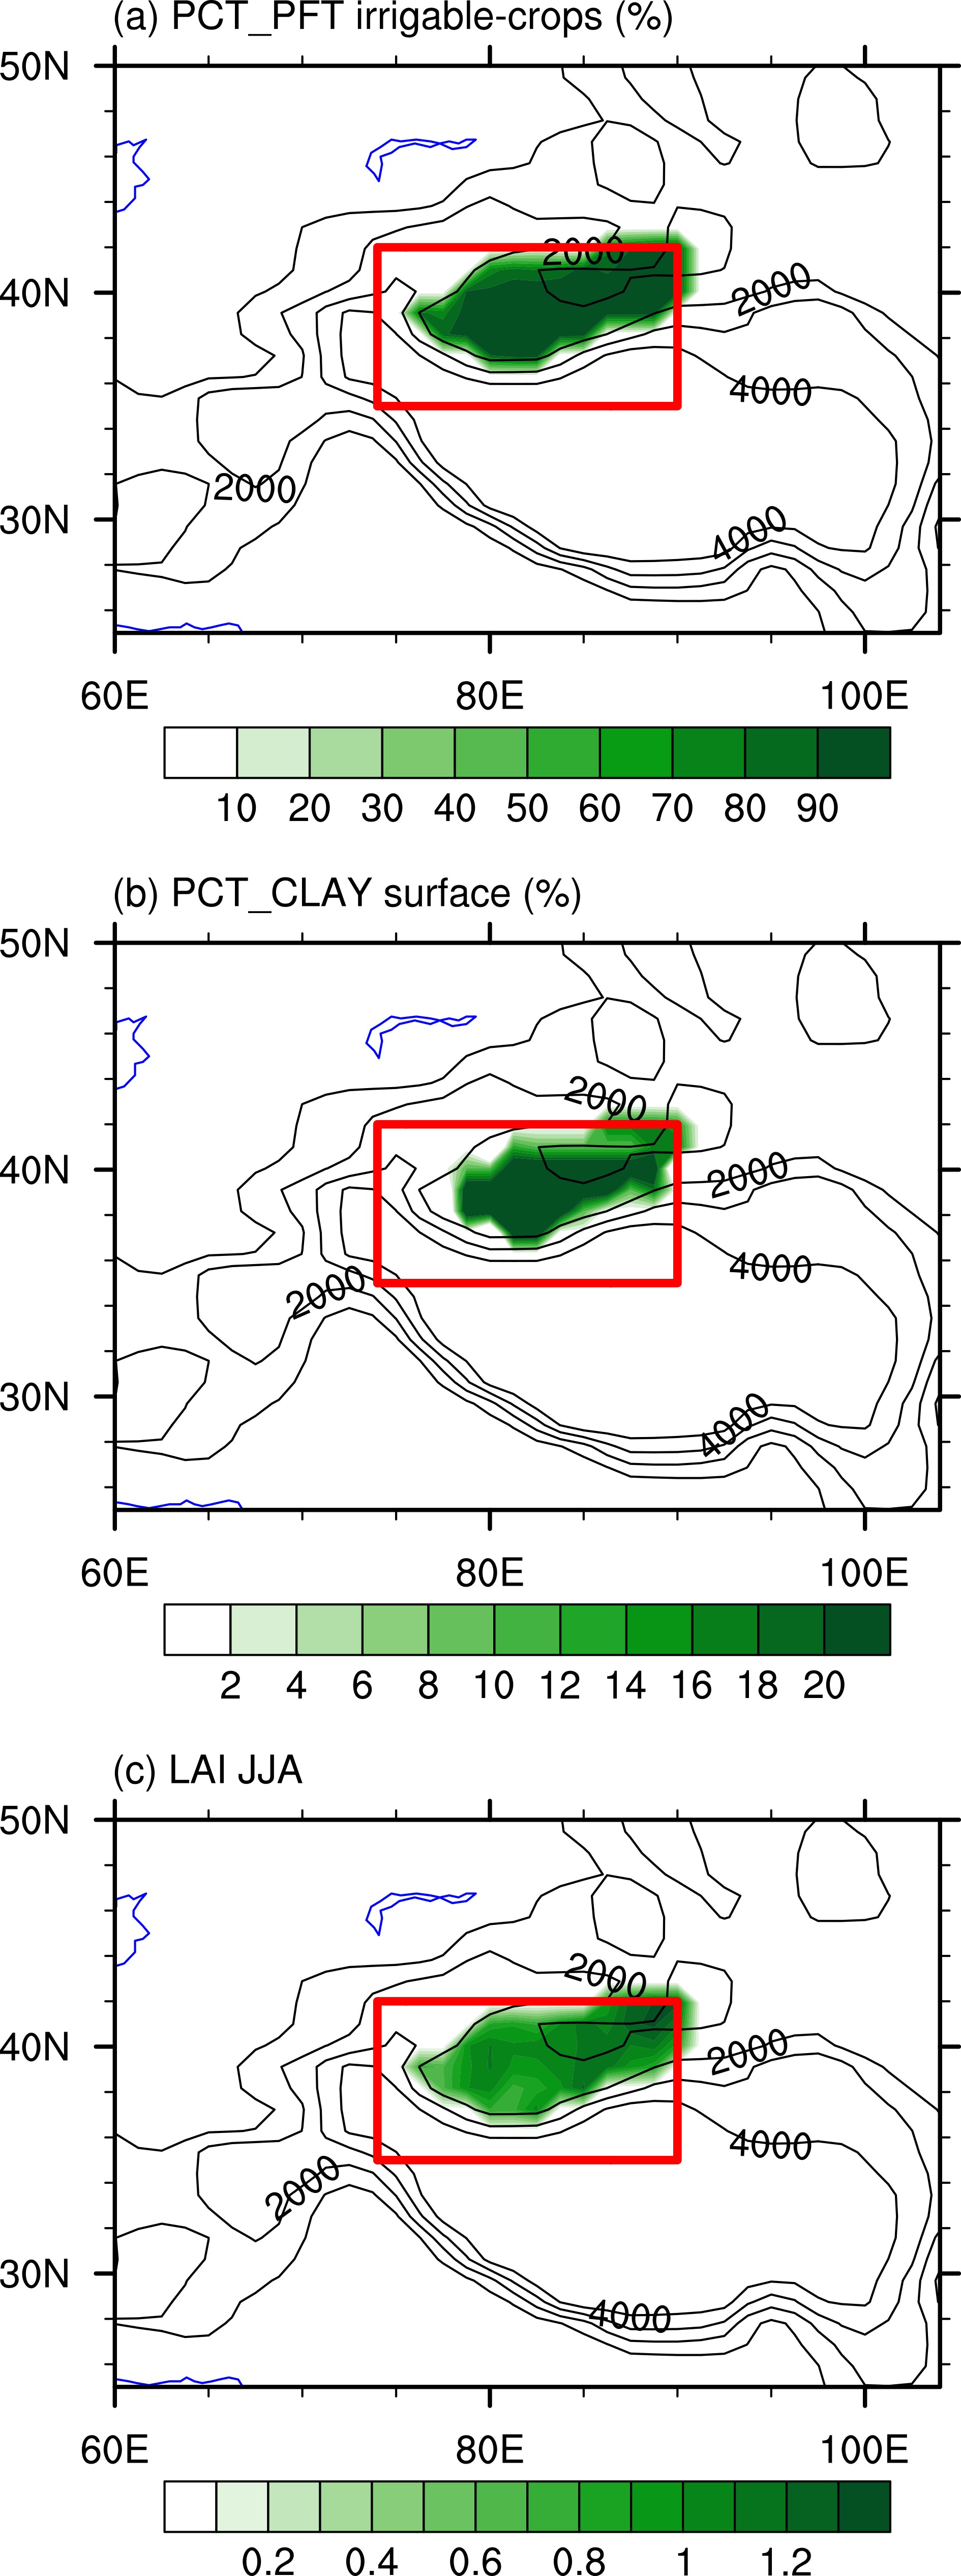 Figure2. Model setting differences between the P1 and the P2 experiments. (a) Distribution of irrigable crops, (b) surface clay, and (c) JJA long-term (100-year) mean leaf area index (LAI) differences between the P1 and the P2 experiment. Other changes of soil property settings are similar to (b) (not shown). Red boxes indicate the study area. Black lines indicate the terrain height, which is given in m.
Since vegetative growth will change ET, we evaluated the simulated response of ET to vegetation first. We interpolated observations to the same resolution as simulations (about one degree) and used data from all the grids in the study area to show the response of ET to vegetation change. There is a good correspondence between ET and leaf area index (LAI) in the study area from observations (Fig. 3a). The modeled ET response is greater than what is observed. The stronger ET response is mainly due to increased soil evaporation from irrigation. With soil evaporation excluded in ET, the model demonstrates better agreement with the observations in terms of the response (Fig. 3b). The comparison suggests that the model can well simulate the response of ET to the increase of vegetation in the study area. Next, we focus on the climate effects due to irrigation and vegetation growth over the TD.
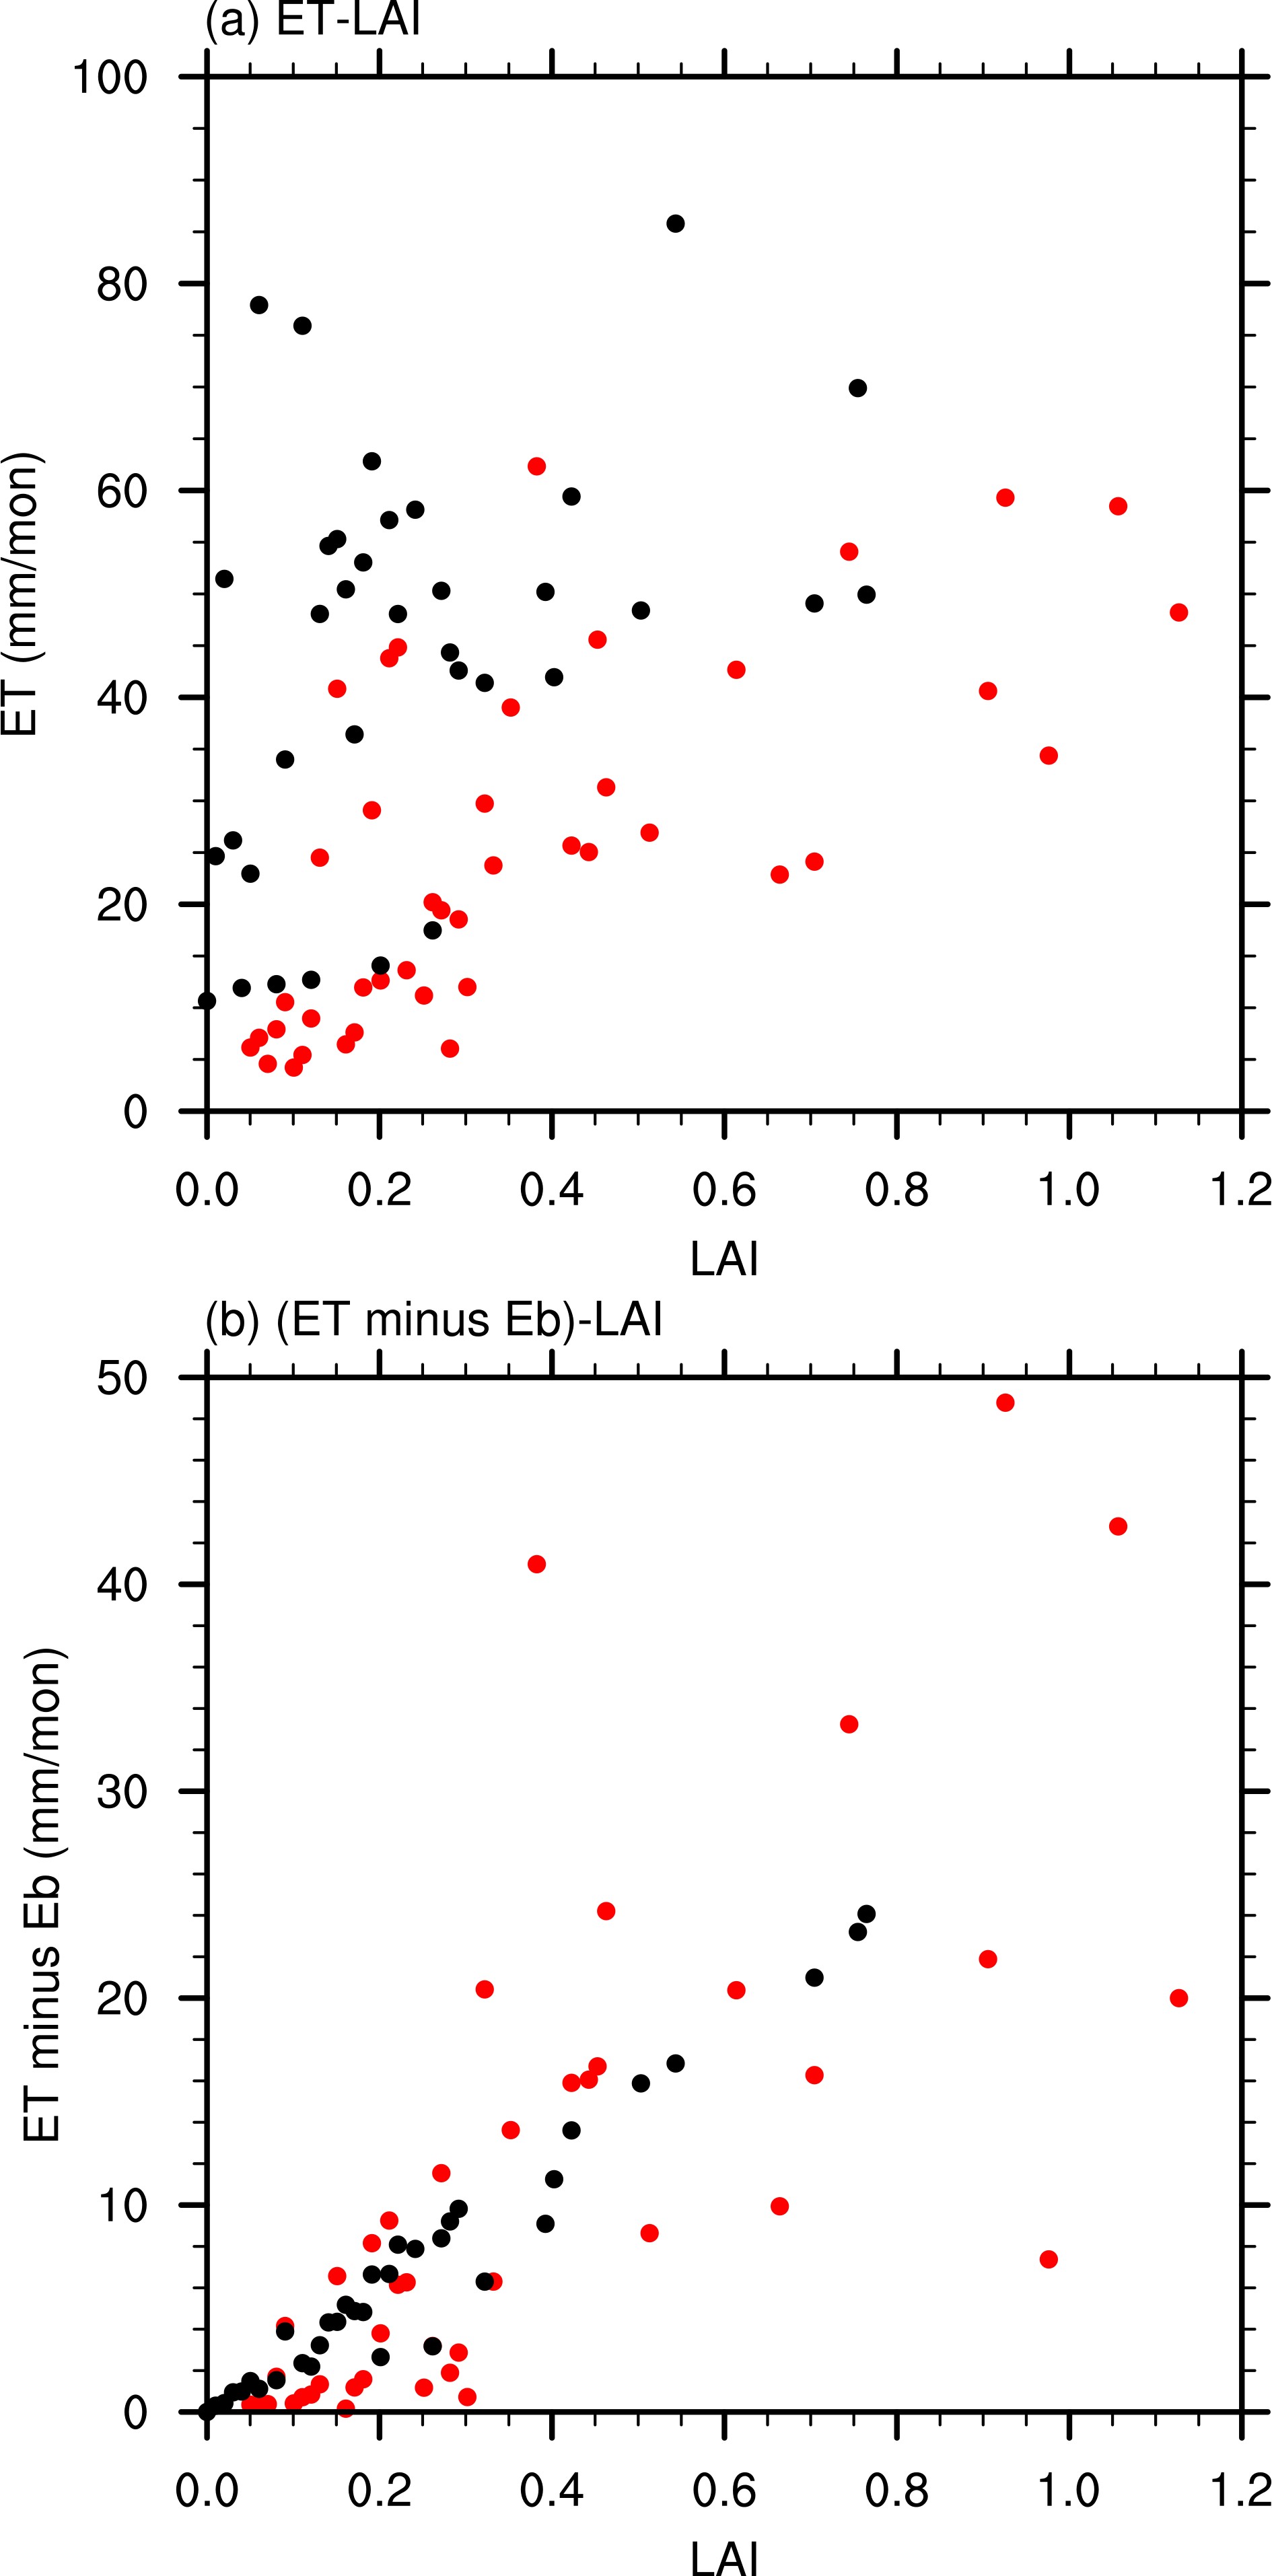 Figure3. The response of (a) ET and (b) ET minus soil evaporation (from the Global Land Evaporation Amsterdam Model, version 3.5 (GLEAM_v3.5), Miralles et al. 2011; Martens et al. 2017,
 3.1. Effects on precipitation and surface temperature
The JJA mean precipitation from Global Precipitation Climatology Project version 2.3 (GPCP_v2.3, Adler et al., 2018) and P1 experiment is shown in Fig. 4. Overall, the simulation performed well in capturing the observed precipitation pattern with large precipitation over the southeastern Tibetan Plateau (TP) and small precipitation over the TD. The largest rainfall amounts occurred in the southern foothills of the TP. Mountain ranges northwest of the TD received more precipitation than the interior of the TD. The JJA mean precipitation in region (b) is only about 0.53 mm d?1, suggesting that the region where we grow vegetation has less precipitation than surrounding regions. Crop growth and irrigation significantly (p < 0.05) increases precipitation by 119% to 1.16 mm d?1 in region (b) (Fig. 4c), especially at the edges of the TD, highlighting the importance of vegetation and irrigation to increased precipitation. Complete deforestation of the Amazon may lead to only a 16% reduction of local precipitation (Spracklen and Garcia-Carreras, 2015), and Kemena et al. (2018) found that the irrigation of the Sahara leads to larger increases in precipitation (267 mm yr?1). These results are different from our estimates, partly due to the different climate regimes and surrounding regions. Typical drier climatological conditions over a relatively smaller area of vegetation growth may explain the small changes found in this study. On the other hand, the decrease of surface temperature induced by vegetation and irrigation is mainly concentrated in the study area, up to 4°C in the eastern TD (Fig. 4d). Although some significant (p < 0.05) changes (generally less than 1°C) also occur downstream, they are generally much smaller than those over the study area.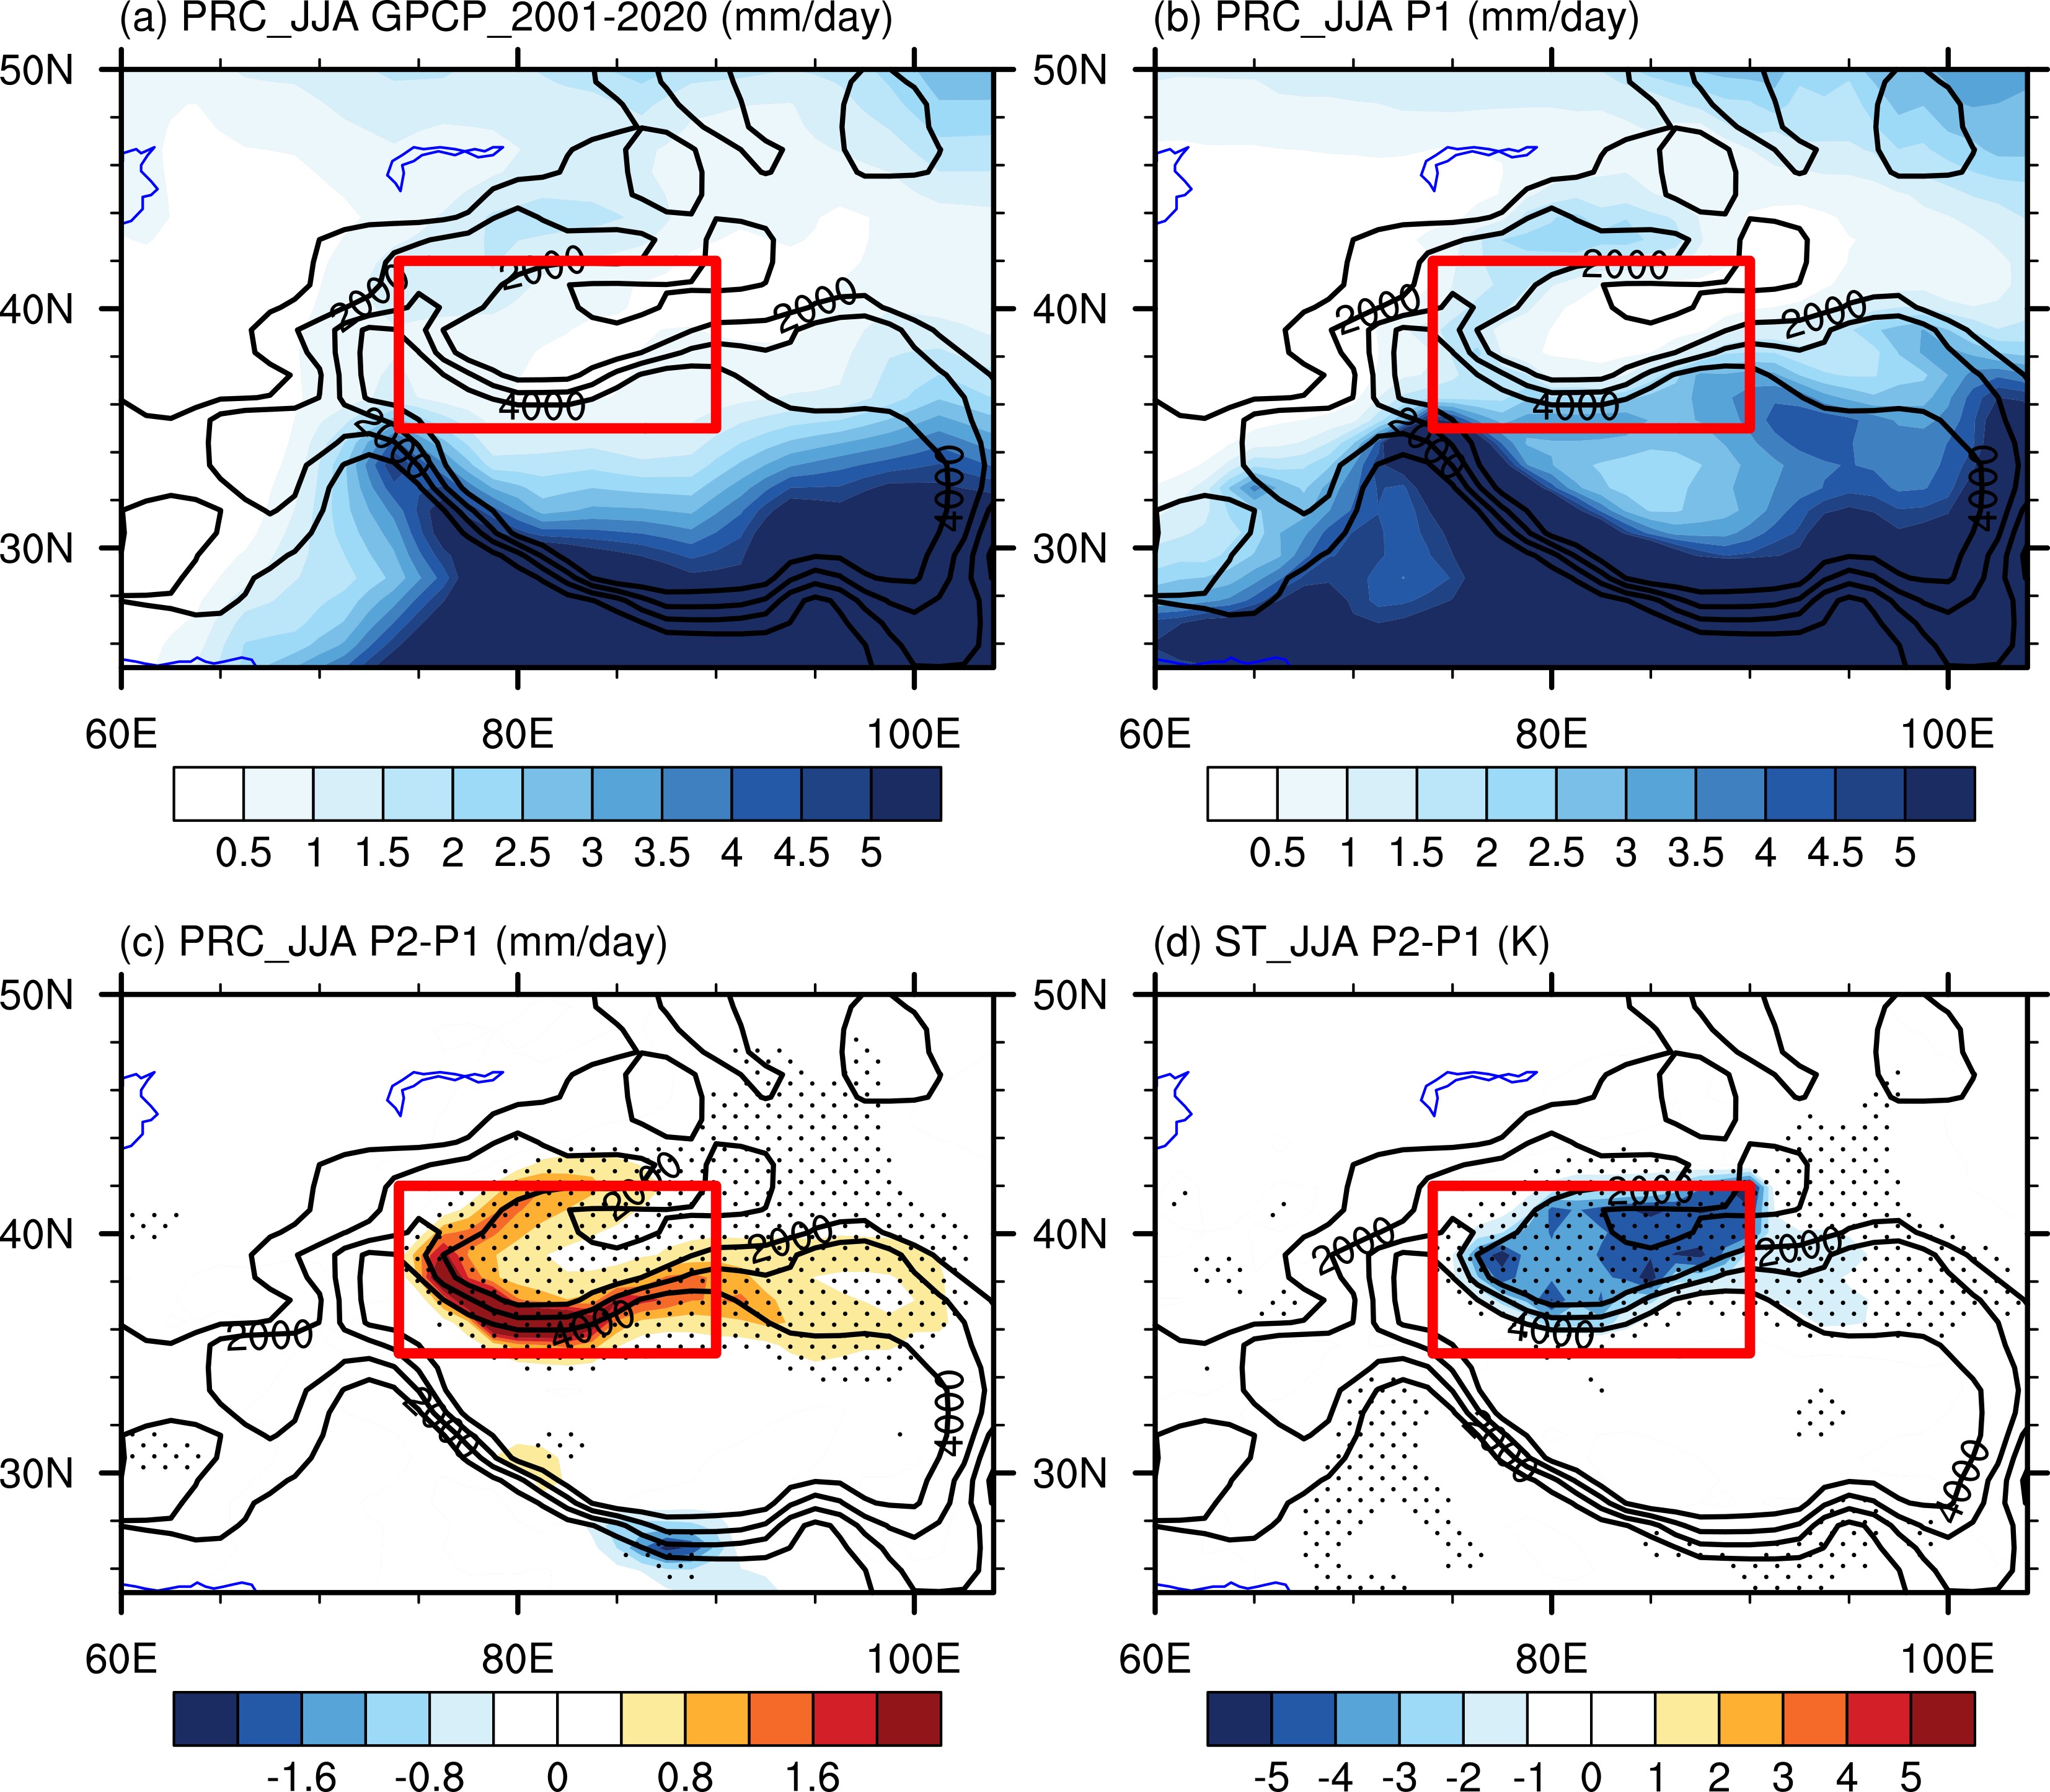 Figure4. The JJA mean precipitation of (a) GPCP_v2.3 (
Precipitation also changes non-locally. A slight extension of increased precipitation was noted downstream of the TD. In the southern periphery of the TP, precipitation decreases by ~2 mm d?1. There are also precipitation changes over the Indian and the Pacific Oceans, but they are generally small and insignificant (not shown). It is surmised that such a small area of vegetation growth might not be able to affect large-scale circulation and precipitation, an aspect that is discussed later.
2
3.2. Water budget
Following Wang et al. (2015), the surface water budget can be expressed as:where W is soil water, P is precipitation, E is evaporation, R is runoff and Rg is groundwater runoff. In P1, the averaged evaporation in region (b) is 0.56 mm d?1, which is greater than the precipitation, and water vapor diverges in the atmosphere. In P2, the large increase of precipitation is mostly due to increased ground evaporation and canopy transpiration, which is due to irrigation and increased vegetation, respectively. Overall, the larger increase of ET (523%) is the direct cause for the increase of local precipitation (Fig. 5).
In the irrigation scheme, the soil cannot take up all of the irrigation water immediately, which leads to a large amount of surface runoff. If the runoff water can be somehow diverted back to the desert, the only way for the moisture to escape from the desert is by moisture divergence, which is increased in an irrigated situation. The total loss rate of irrigation is about 85%, indicating that the irrigation water here is difficult to be efficiently recycled and utilized. Here we only consider effective irrigation, which is irrigation minus surface runoff. Effective irrigation of 3.46 mm d?1 is required to keep the crops growing normally, however, a large part of the effective irrigation (30%) is lost to drainage. Such a large amount of loss is also found in Kemena et al. (2018), who found that dense vegetative growth required large amounts of irrigation to maintain. In this study, whenever photosynthesis is limited by a water deficit, irrigation is applied until a target soil moisture level is reached. The balance between precipitation and ET is an important indicator of self-sustainability. In P2, a regionally averaged ET of 3.49 mm d?1 only resulted in precipitation of 1.16 mm d?1, i.e., only 33% of the deployed water is effectively “recycled” locally. This is one of the major reasons that such a large amount of irrigation is required for vegetation growth.
2
3.3. Energy budget
The surface energy budget equation is applied to land surface (Cuxart et al., 2015), which can be expressed as (arrows indicate the direction):where net radiation (Rn, surface absorbed solar radiation minus surface net longwave emission) is the main input of surface energy; soil heat flux (G) is related to the soil temperature gradient; SH indicates sensible heat flux and LH indicates latent heat flux.
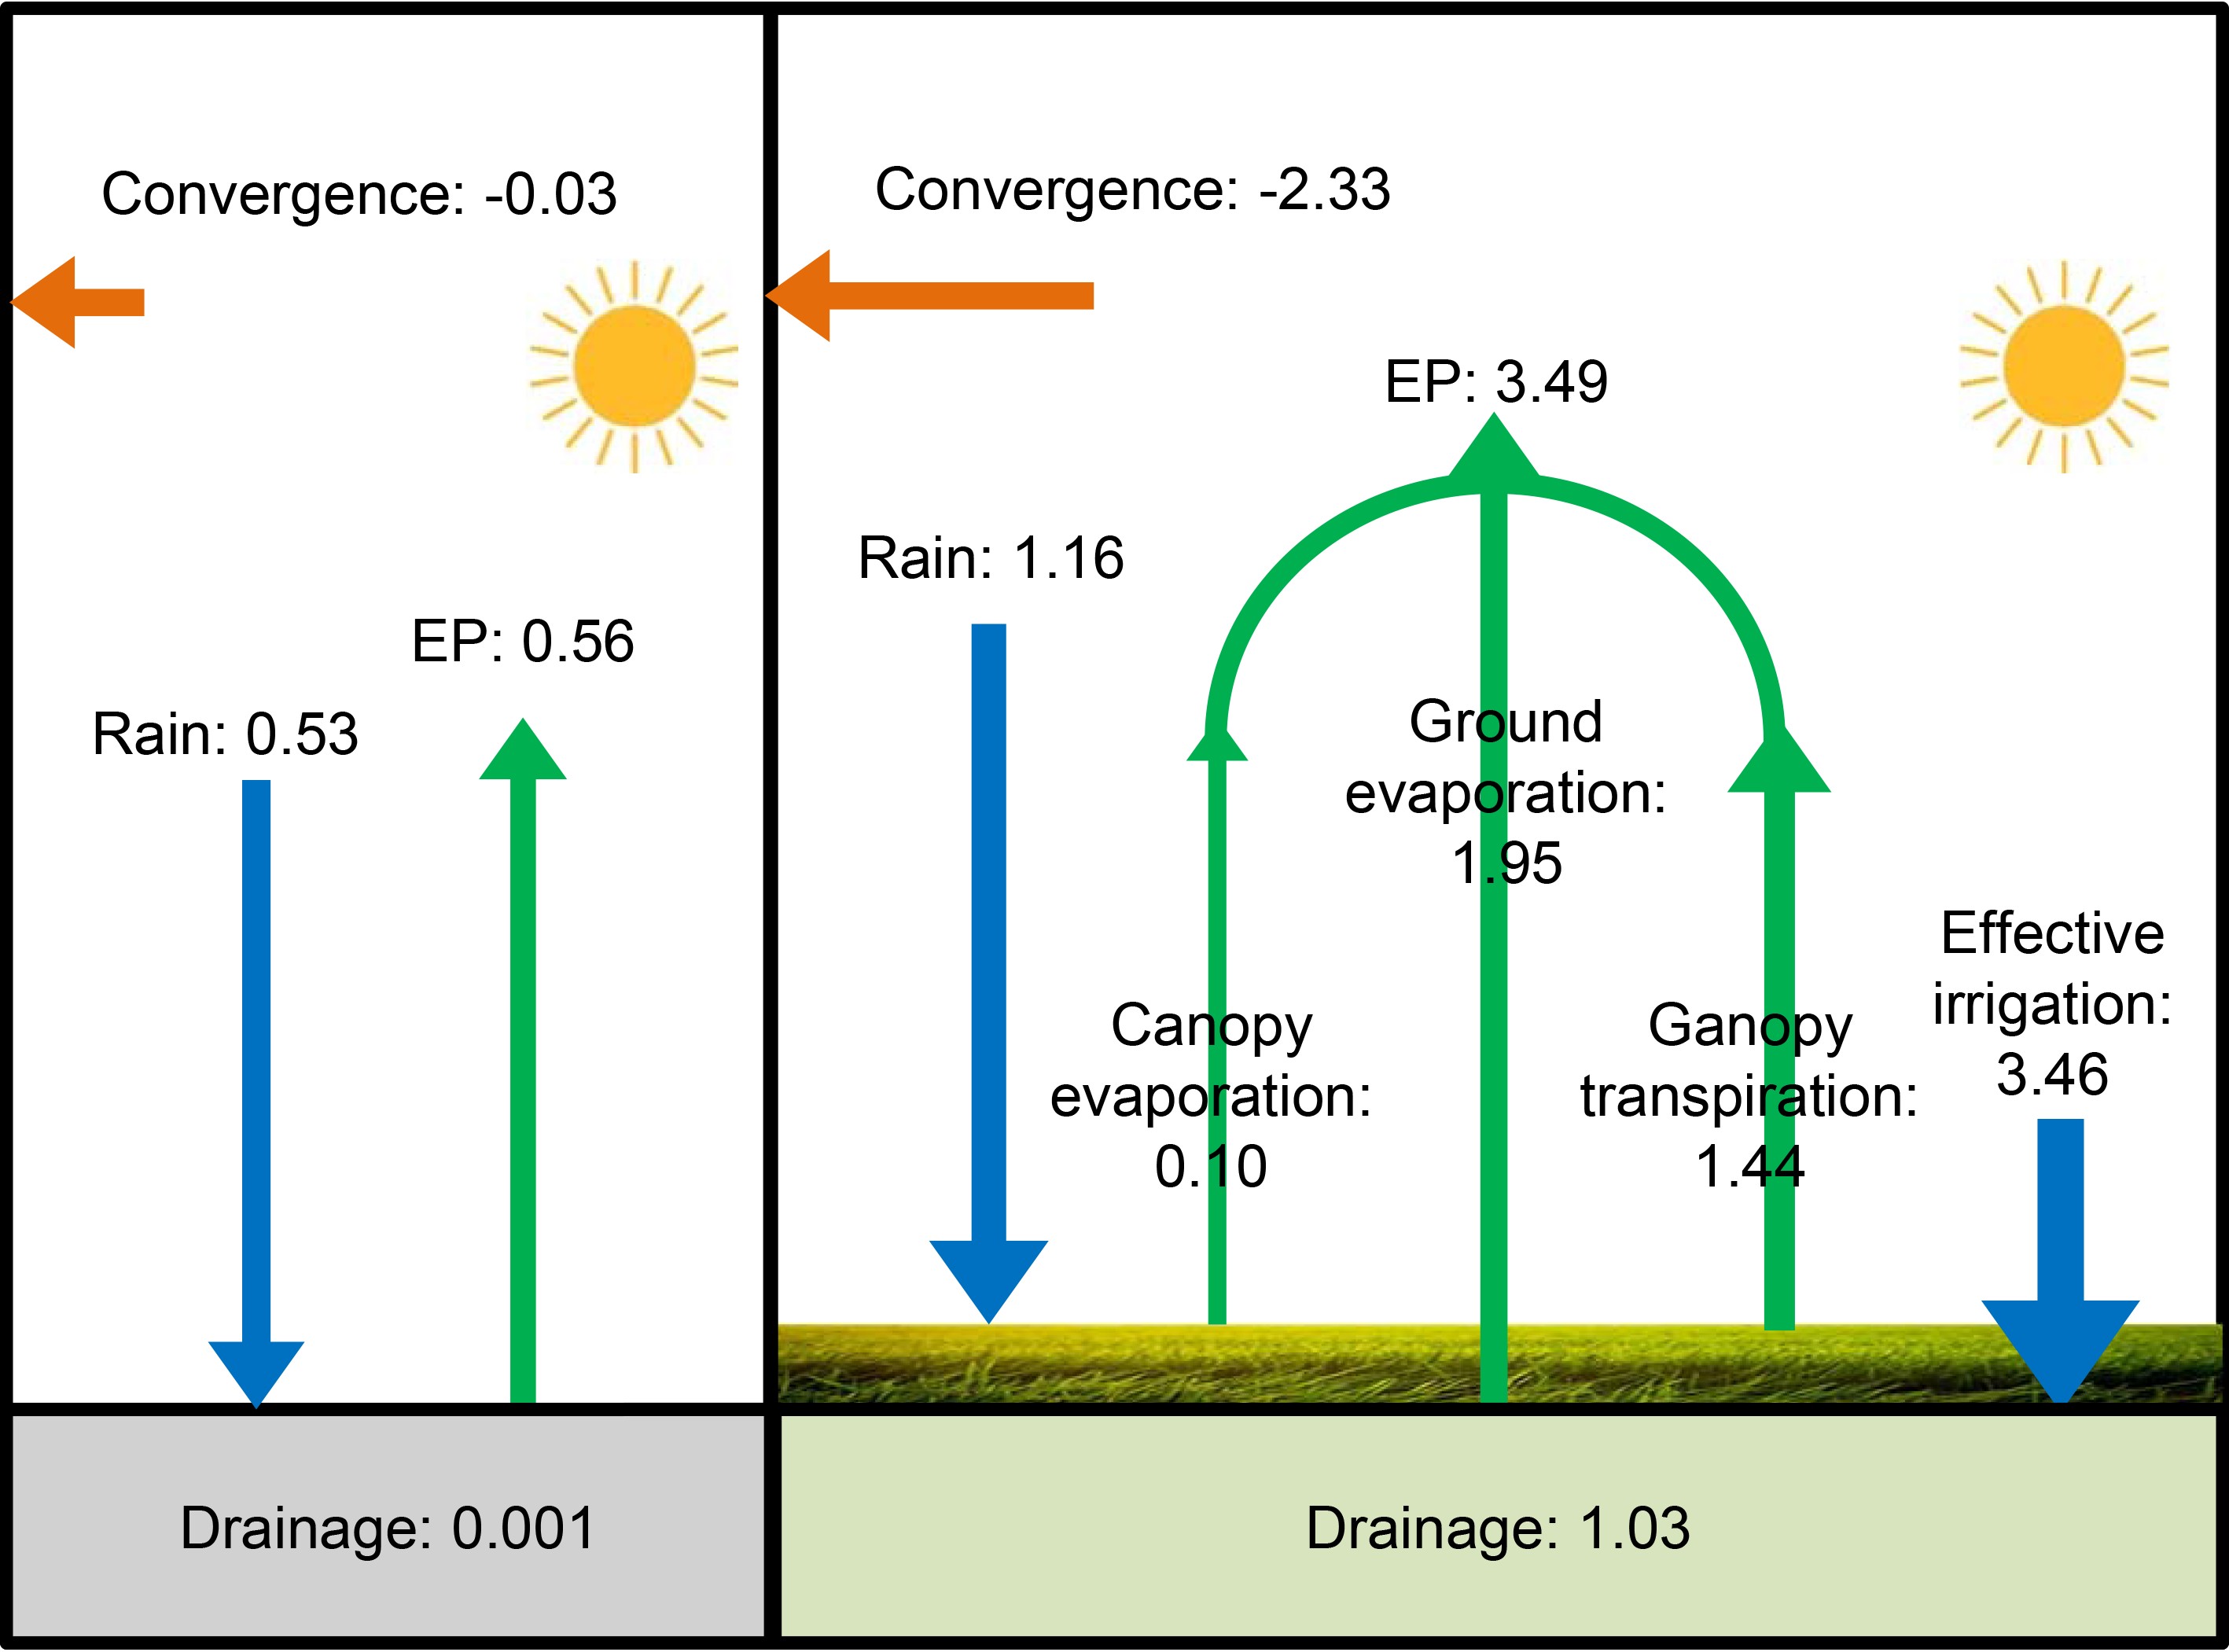 Figure5. The JJA water budget in region (b) for the P1 (left) and P2 (right) as a 100-year time average. Fluxes are in mm d?1. Convergence is calculated by “precipitation minus ET” according to Shi et al. (2019). All changes are significant above the 95% confidence level using the Student’s t-test.
Energy budget changes between the two experiments mainly occur locally in JJA (Fig. 6). Compared to P1, increased crops resulted in a decreased surface albedo of 0.14 in P2, corresponding to an increase of surface shortwave absorption by 29 W m?2. The increase of ET is accompanied by large increases of LH, from 16 W m?2 in P1 to 101 W m?2 in P2 (Spracklen et al., 2018). Accordingly, the surface temperature is reduced by 4.3°C and is furthermore associated with reduced SH and surface longwave cooling (Hu et al. 2015). Besides, the air in the TD acts as a heat source, and the heat flux divergence of 48 W m?2 in P1 increased to 80 W m?2 in P2.
 Figure6. The 100-year time-average JJA surface energy budget in the region (b) for the P1 (left) and P2 (right) experiments [refer to Kemena et al. (2018)]. Fluxes are given in W m?2. Yellow (purple) arrows represent the budget for shortwave (longwave) radiation. Green (blue) arrows represent the SH (LH). The surface albedo (α), net solar radiation at the surface (SWnet), net longwave flux at the surface (LWnet), surface temperature (ST), and soil heat flux (G) are also shown. All changes except incoming solar radiation and soil heat flux are significant above the 95% confidence level using a Student’s t-test.
On the other hand, increased ET increases low-level atmosphere moisture and thus cloud amount, which also promotes precipitation to a certain extent (not shown). According to Eq. (3), due to an almost unchanged soil temperature gradient (not shown), G in the P2 experiment does not change much compared with P1, indicating that the energy absorption by the soil does not change much. In general, irrigation leads to enhanced ET, LH, and reduced surface temperatures which serve to change the local energy budget. However, similar to the water vapor budget, these changes are too spatially confined to affect the climate of surrounding areas.
2
3.4. Circulation change
Low-level circulation in the study area is greatly influenced by the topography. In the lower atmosphere at 850 hPa (Fig. 7a), air enters the study area between the Tianshan mountains and the Altai Mountains. Due to the saddle topography between the two mountains, two subsidence areas are formed (and another subsidence area near Balkhash Lake). Due to another saddle topography between the Tianshan mountains and TP, the northeasterly airflow sinks when it enters the desert. Afterward, the incoming air tends to accumulate and move upwards at the edges of the mountains. Similar patterns extend to the upper troposphere (not shown), above 500 hPa, as westerlies predominate over this region. Wind speeds decrease near the surface due to the increased roughness by vegetation, and thus the upward movement near the edge of the mountains and the downward movement around the saddle are weakened (Fig. 7b). On the other hand, at 500 hPa, a cyclonic anomaly is present over the study area associated with decreased geopotential height in the P2 experiment (Fig. 7c).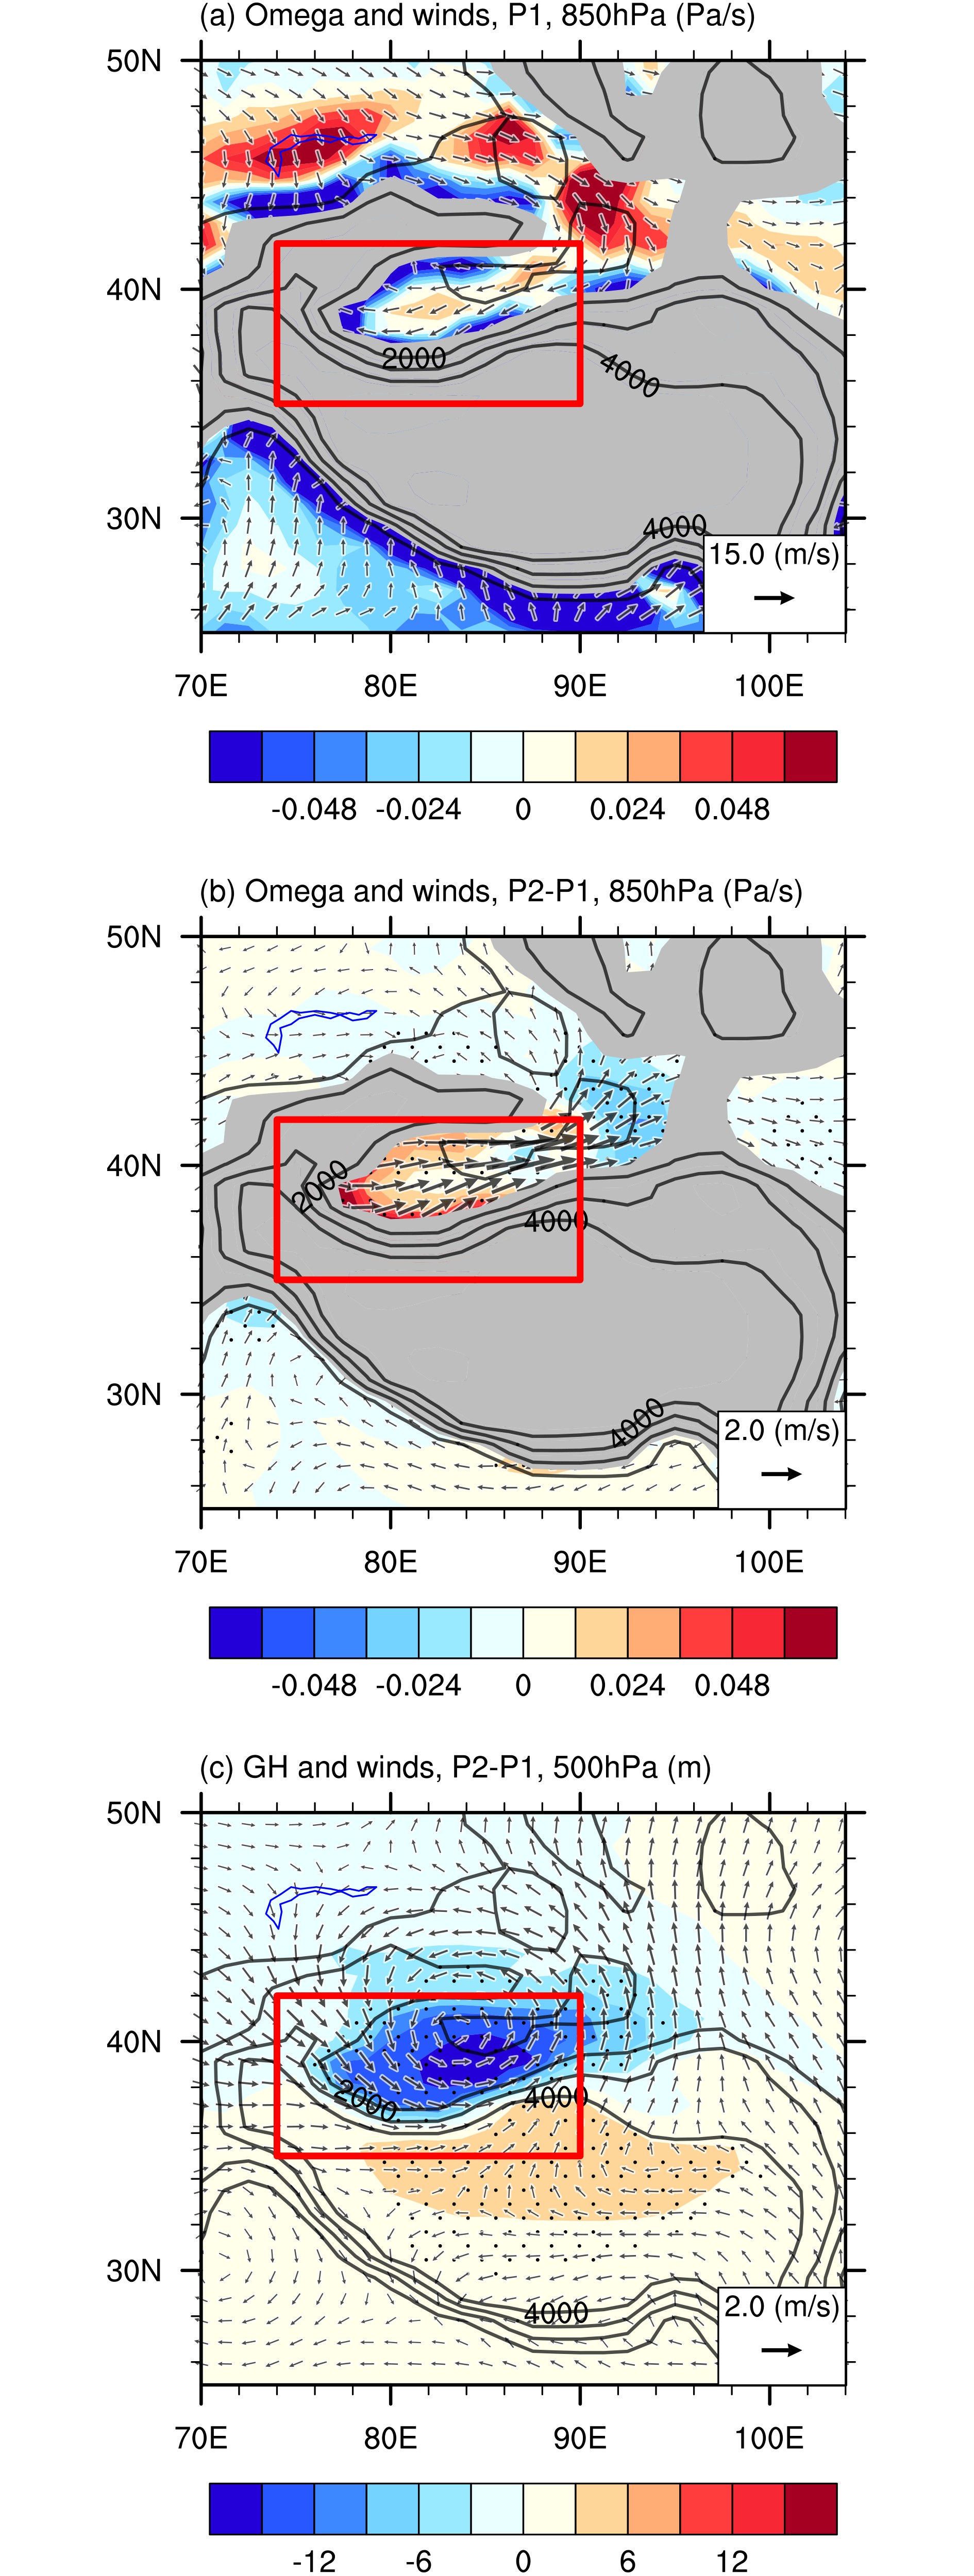 Figure7. (a) The JJA mean vertical motion (shaded) and horizontal circulation (vector) at 850 hPa for P1; (b) same as (a) but shows the difference between P2 and P1. (c) The difference of JJA mean geopotential height (shaded) and horizontal circulation (vector) at 500 hPa between P2 and P1. Stippling in (b) and (c) indicates statistical significance at the 95% confidence level using the Student’s t-test. Red boxes indicate the study area. Black lines indicate the terrain height, which is given in m.
Vegetation growth and irrigation in the study area have little effect on the global circulation (not shown). This is different from other studies of the Sahel region (Kemena et al., 2018). The reason may be that the area of the vegetation growth in the Sahel region is large enough to change global circulation. But the area in this study is small, low-lying, and surrounded by mountains, thus its impact is strongly confined locally.
(1) Increased vegetation and irrigation in the Taklimakan Desert leads to a significant (p < 0.05) increase (119%) of local precipitation.
(2) Irrigation enhances ET and LH but reduces the net surface energy and thus surface temperature. Vegetation also influences ET in addition to increasing roughness, reducing surface wind speed, and influencing local circulation patterns coordinated with the terrain. Nonetheless, irrigation and vegetation growth in the low-lying desert have negligible impacts on the large-scale circulation.
(3) With a large amount of effective irrigation (3.46 mm d-1), soil water can be maintained at a stable level to ensure the normal growth of the vegetation, although a lot of irrigation is lost to runoff. However, such a large amount of water is difficult to provide in practice. This indicates that the irrigation water needs to somehow be retained in the region by using some new technology, otherwise the crops will wither.
(4) With irrigation and vegetation growth, there is a significant (p < 0.05) increase in local water recycling (2.93 mm d?1) and an increase of local moisture flux divergence (2.30 mm d?1), indicating that the increase of local precipitation mainly results from increased local water recycling.
This study suggests that the large-scale impacts associated with a greening TD are small. This is different from other studies, such as those over the Sahel region (Bowring et al., 2014; Kemena et al., 2018). The reason for this may reflect the fact that that the oasis is in a low-lying desert, and the modified SH and LH cannot be effectively propagated to other regions. The unique terrain may also be one of the reasons why the impacts of vegetation and irrigation in the TD are different from other regions. In this sense, a wet XJ might be related to large-scale circulation changes, such as a change in the East Asian monsoon as has been recorded in paleoclimate records (Harrison et al., 2015).
Note that different models might yield different results, but probably would not change the overall themes or conclusions of this study. Higher resolution simulations are also needed to provide more detailed impacts (such as rainfall, surface temperature, etc.) over the TD and its surrounding regions in the future. We choose the TD for our study area because it has a profound impact on the climate of XJ, but the actual area of vegetation growth in this study is larger than the desert. Additionally, the type of vegetation is set to be crops, whether the results would be different if it was replaced by other types of vegetation needs further study.
The main reason why the greening project cannot be implemented in the TD is that vegetation cannot be maintained without such a large amount of irrigation. Similar results were also found in other studies (Ornstein et al., 2009; Bowring et al., 2014). Another experiment (not shown) indicated that the large amount of irrigation lost to runoff is related to the soil texture. If the soil in the study area is more permeable, such as light sandy soil, the amount of irrigation can be greatly reduced by about 2 mm d?1 in the study area. However, this is still a large amount of irrigation to provide because of the large study area (about 2 ×10⁹ m3 d?1). In addition, precipitation increases are relatively small and soil moisture would quickly drop to the wilting point for vegetation growth in a simulation without irrigation. The main reason is that vegetation alone cannot increase ET significantly, leading to reduced moisture recycling and surface temperature change. Therefore, irrigation is an indispensable requirement for vegetation growth in the TD (Keller et al. 2014).
Note that the TD is a major source of dust emission for the world. A greening TD will inhibit dust emission and thus its loading and radiative effects (e.g., Tanaka and Chiba, 2006; Yu et al., 2019). Dust emission and its radiative impact have been included in CESM1.2.1, and it would be interesting to investigate such an indirect effect of vegetation growth in more detail in the future.
Overall, we attempted to quantify the climate effects of a green TD using global climate model simulations and found that the oasis in the TD is not self-sustainable. Since plantation is the only available engineering method to encounter climate change at present (Kemena et al., 2018), the study provides a reference for the implementation of the project in the TD. Novel technologies to keep the water recycled in the area are a prerequisite. Although it is not advisable to grow vegetation directly in the desert, some other methods can be considered, like building greenhouses in the desert. Abundant sunshine and water retention in the greenhouses may ensure the normal growth of vegetation and better recycling of irrigated water.
Acknowledgements. This work was supported by the National Key Research Project of China (Grant No. 2018YFC1507001).
