HTML
--> --> -->China is a drought-prone country that is sensitive to global warming (Yang et al., 2012; Feng et al., 2014; Wang et al., 2015; Li et al., 2018; Zhang et al., 2018; Zeng et al., 2019). Droughts in China have occurred more frequently and severely, with longer durations and larger affected areas, under global warming (Yu et al., 2014). Most areas of the country are projected to become drier as a consequence of increasing evaporation, and extreme droughts will increase dramatically in the future warming climate (Wang and Chen, 2014). The occurrence of droughts in China is also closely linked to other factors. It has been demonstrated that the decline in Barents Sea ice in spring can enhance hot drought events in summer over northeastern China (Li et al., 2018). The atmospheric circulation anomalies induced by remote forcing from the tropical Pacific and North Atlantic oceans provide important contributions to severe droughts in China (Zhang et al., 2013; Feng et al., 2014; Wang et al., 2015). ENSO, one of the most powerful modes of climate variability that influence the world climate, has been extensively demonstrated to exert significant impacts on climate over China (e.g., Ashok et al., 2007; Feng et al., 2016; Yu et al., 2017; Ren et al., 2018; Li et al., 2019; Gao et al., 2020; Wang et al., 2020). Different ENSO phases yield pronounced anomalous patterns of seasonal precipitation and circulation in China, and the relationship between ENSO and precipitation in China is strongly dependent on the type of ENSO event (Ashok et al., 2007; Feng and Li, 2011; Zhang et al., 2011; 2013; 2014; Yuan and Yang, 2012; Feng et al., 2016; 2017; Li et al., 2019). Additionally, the phase transition from La Ni?a to El Ni?o is one of the important precursors of prolonged spring?summer droughts in northern China (Zhang et al., 2018). Moreover, the upstream quasi-stationary wave pattern strengthened by land?atmosphere coupling provided an important contribution to the persistent drought in Northeast China from spring to summer of 2017 (Zeng et al., 2019).
The middle and lower reaches of the Yangtze River constitute a developed economic zone in East China (EC), where frequent droughts have occurred in recent decades (Wu et al., 2006; Yang et al., 2013; Zhang et al., 2014, 2016). Considerable effort has been made to understand the factors influencing EC droughts (e.g., Wu et al., 2006; Sun and Yang, 2012; Jin et al., 2013; Lu et al., 2014; Feng et al., 2016 Huang et al., 2019). Droughts in EC are likely triggered by El Ni?o Modoki-like sea surface temperature (SST) anomalies (Dai, 2011; Feng and Li, 2011; Zhang et al., 2011; 2013; 2014; Feng et al., 2016; Zhang and Zhou, 2015; Li et al., 2019) and by a positive NAO phase (Sun and Yang, 2012). Drought magnitudes in this region are anticipated to shift from moderate and severe in the past to extreme and exceptional in the future (Sun et al., 2019). Previous studies have significantly improved our understanding of EC droughts. However, few attribution studies have been conducted with respect to extreme drought events in EC.
In August?October 2019, this region experienced the most severe meteorological drought of the past four decades, characterized by a long duration and persistent high temperatures. This drought devastated crops across more than 2.3 million hectares of farmland and caused direct economic damage that amounted to greater than US$ 2.1 billion (
2.1. Data description
A total of 2474 in-situ daily precipitation and surface air temperature (SAT) datasets covering the period 1960?2019 were collected from the National Meteorological Information Center of the China Meteorological Administration (To understand the potential contribution of anthropogenic forcing to seasonal extreme EC droughts, simulations from the Community Earth System Model Large Ensemble (CESM-LE) datasets were used. By simulating climate trajectories over the period 1920?2100 multiple times with small atmospheric initialization differences, but using the same model and external forcing, the CESM-LE project provides a comprehensive resource for studying climate change in the presence of internal climate variability (Kay et al., 2015). There are 40-member ensembles of fully coupled simulations for the period 1920?2100 included in the CESM-LE project. All CESM-LE simulations use the Community Earth System Model, version 1, with the Community Atmosphere Model, version 5 (CESM1-CAM5). CESM1-CAM5 consists of coupled atmosphere, ocean, land, and sea-ice component models. Here, the outputs from fully coupled preindustrial control (PIC) simulations over 1800 years and historical climate simulations (hereafter “All-forcing”) over the period 1920?2019 were used. The All-forcing simulations include both anthropogenic and natural forcing agents from approximately 1850 to the present. The PIC run has constant forcing, set at 1850 levels, and thus enables assessment of internal climate variabilities in the absence of climate change.
2
2.2. Methods
We adopted the generalized extreme value (GEV) distribution to fit the August?October distributions of climate variables and to estimate the corresponding return periods exceeding the year 2019. The least-squares linear regression method was used to estimate the linear trends in climate variables. The climatological base period was defined as 1960?2019. The statistical signi?cances of the trends and the correlation coef?cients were calculated using a two-tailed Student’s t-test.To quantify the contribution of anthropogenic global warming to the frequency of extreme EC droughts, based on the method of Swain et al. (2018), we calculated percentage changes in the frequency F of extreme EC drought events with the return intervals for the observed 2019 August?October drought in the All-forcing simulations relative to the PIC simulations:
Corresponding significances were examined by comparing the frequencies of the extreme EC drought events in the All-forcing simulations with the resampled (bootstrapped) frequencies in the PIC simulations. An FAll value falling outside the sampled range of FPIC variability with 90% confidence indicated that an anthropogenic climate change signal was statistically significant. Meanwhile, the 5%?95% uncertainty range of ΔFAll was also estimated using the bootstrap resampling method, and the corresponding best estimates were approximated based on the median.
3.1. Characteristics of the drought event over EC in 2019
The spatial pattern of anomalous precipitation and SATs from August to October in 2019 over EC (Fig. 1) shows a rainfall anomaly of less than ?180 mm and a warm SAT anomaly of 1.8°C (Figs. 1a and b), indicating the concurrence of a strong precipitation de?ciency and a high-temperature event in 2019. Most stations over the middle and lower reaches of the Yangtze River experienced extremely low precipitation and high temperatures, which broke records since 1960 at many stations. To understand the general variability in SATs and precipitation in EC, the time series of EC area-averaged precipitation and SAT anomalies from 1960 to 2019 were calculated, and they are shown in Figs. 1c and d. EC precipitation and SATs showed substantial interannual variability. In terms of the area-mean precipitation deficit, it was clear that the EC drought from August to October in 2019 was unprecedently severe, with 144 mm less precipitation than normal and a return period of 94 years (Fig. 1c). The concurrent high temperature was ranked the highest since at least 1960, with a warm anomaly of 1.8°C and a return period of 65 years. Although the EC area-mean August?October precipitation levels showed a slight decreasing trend from 1960 to 2019, this trend was not statistically significant and was considered negligible. At the same time, the EC area-mean August?October SAT exhibited a significant warming trend of 0.86°C (60 yr)?1.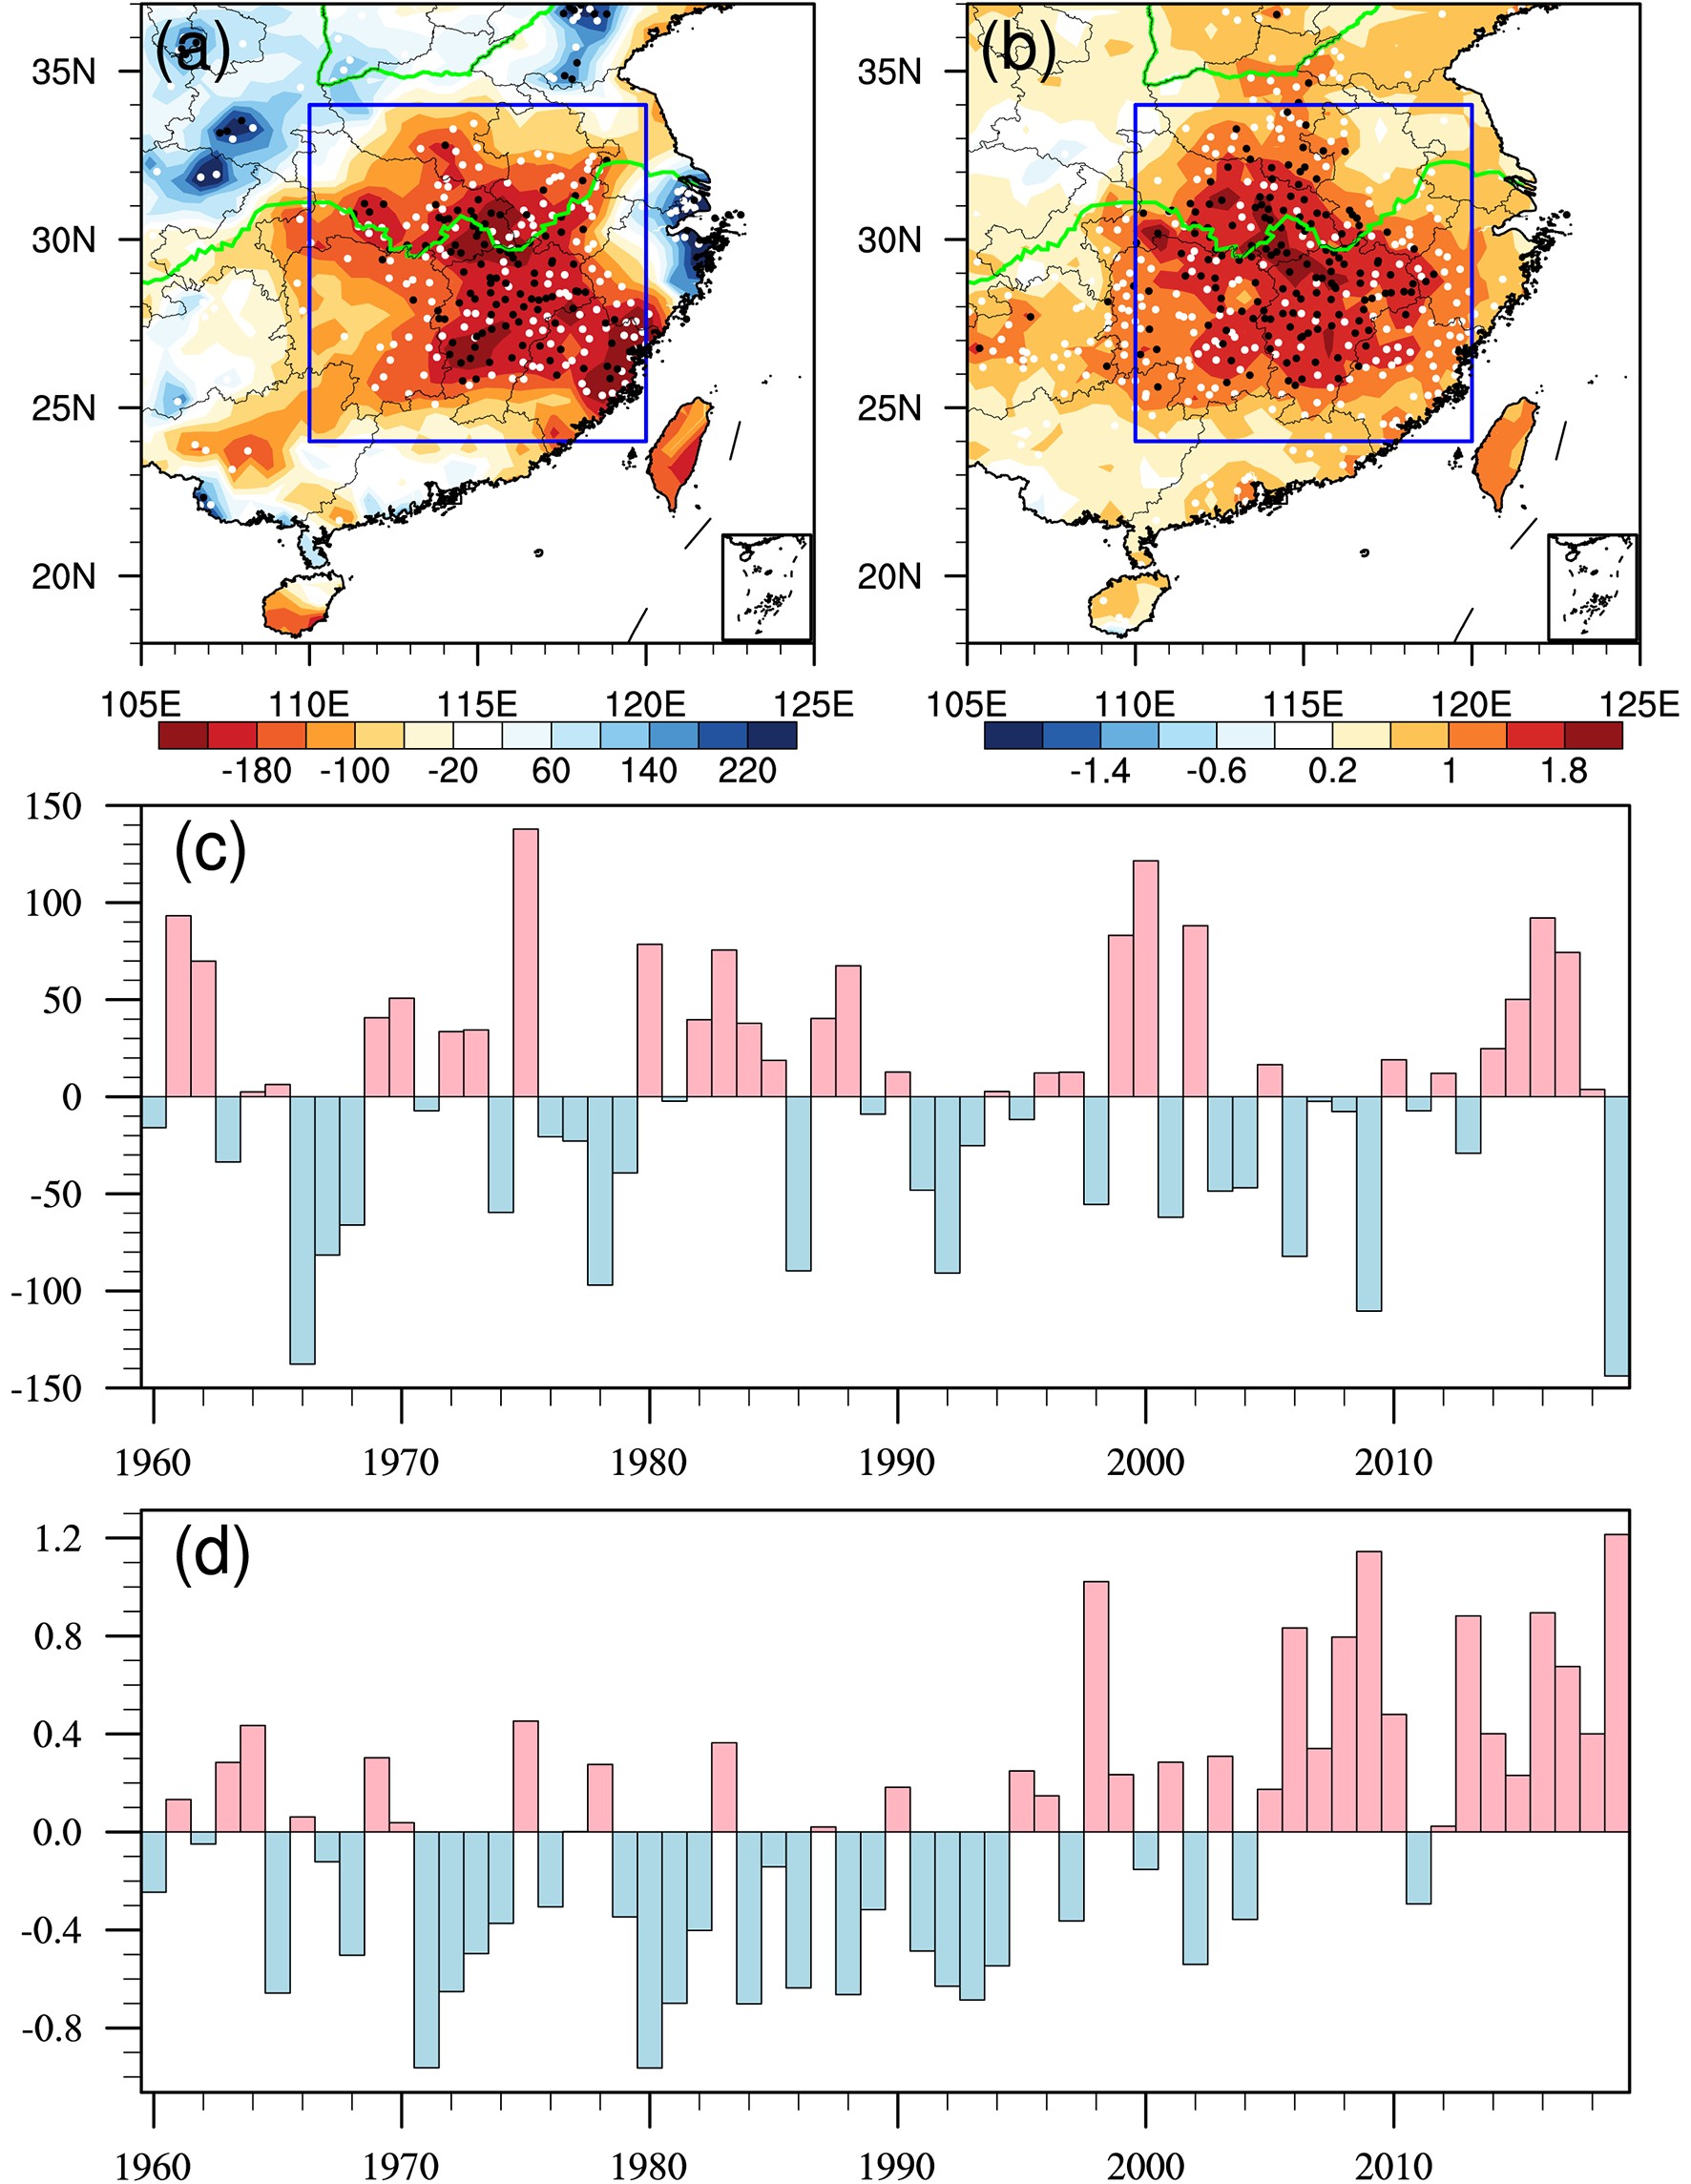 Figure1. (a) Precipitation anomalies (unit: mm) and (b) SAT anomalies (unit: °C) from August to October of 2019 compared to those from 1960 to 2019. White and black dots identify stations where August?October precipitation (SAT) anomalies in 2019 were below (exceeded) the 5th (95th) percentile threshold and broke the lowest precipitation (highest SAT) record since 1960, respectively. (c, d) Time series of August?October (c) precipitation anomalies (unit: mm) and (d) SAT anomalies (unit: °C) averaged over EC [indicated by the blue rectangular box bounded by (24°?34°N, 110°?120°E) in (a, b)].
To document the atmospheric circulation patterns related to the EC drought from August to October in 2019, the corresponding anomalous circulations are illustrated in Fig. 2 and Fig. 3. In the climatological August?October period, a moisture transport branch from the South China Sea, carried by southeasterly winds, supplied precipitation over EC (Fig. 2a). However, in August?October 2019, a strong cyclonic anomaly occurred over the western North Pacific (WNP), and two strong anticyclonic anomalies appeared over the regions to the east of Japan and in the Bay of Bengal (Fig. 2b). The northeasterly wind anomalies on the northwestern side of the anomalous WNP cyclone occurred over EC, and southwestward moisture transport anomalies prevailed over EC (Fig. 2c). These simultaneous anomalous circulation patterns from the 2019 EC drought were similar to the composite structures associated with the El Ni?o Modoki, also known as the central Pacific El Ni?o (Zhang et al. 2011, 2014). Consequently, the precipitable water levels in EC were much lower than normal and were not favorable for producing precipitation in EC. The anomalous water vapor transport partly contributed to the EC precipitation deficiency from August to October 2019.
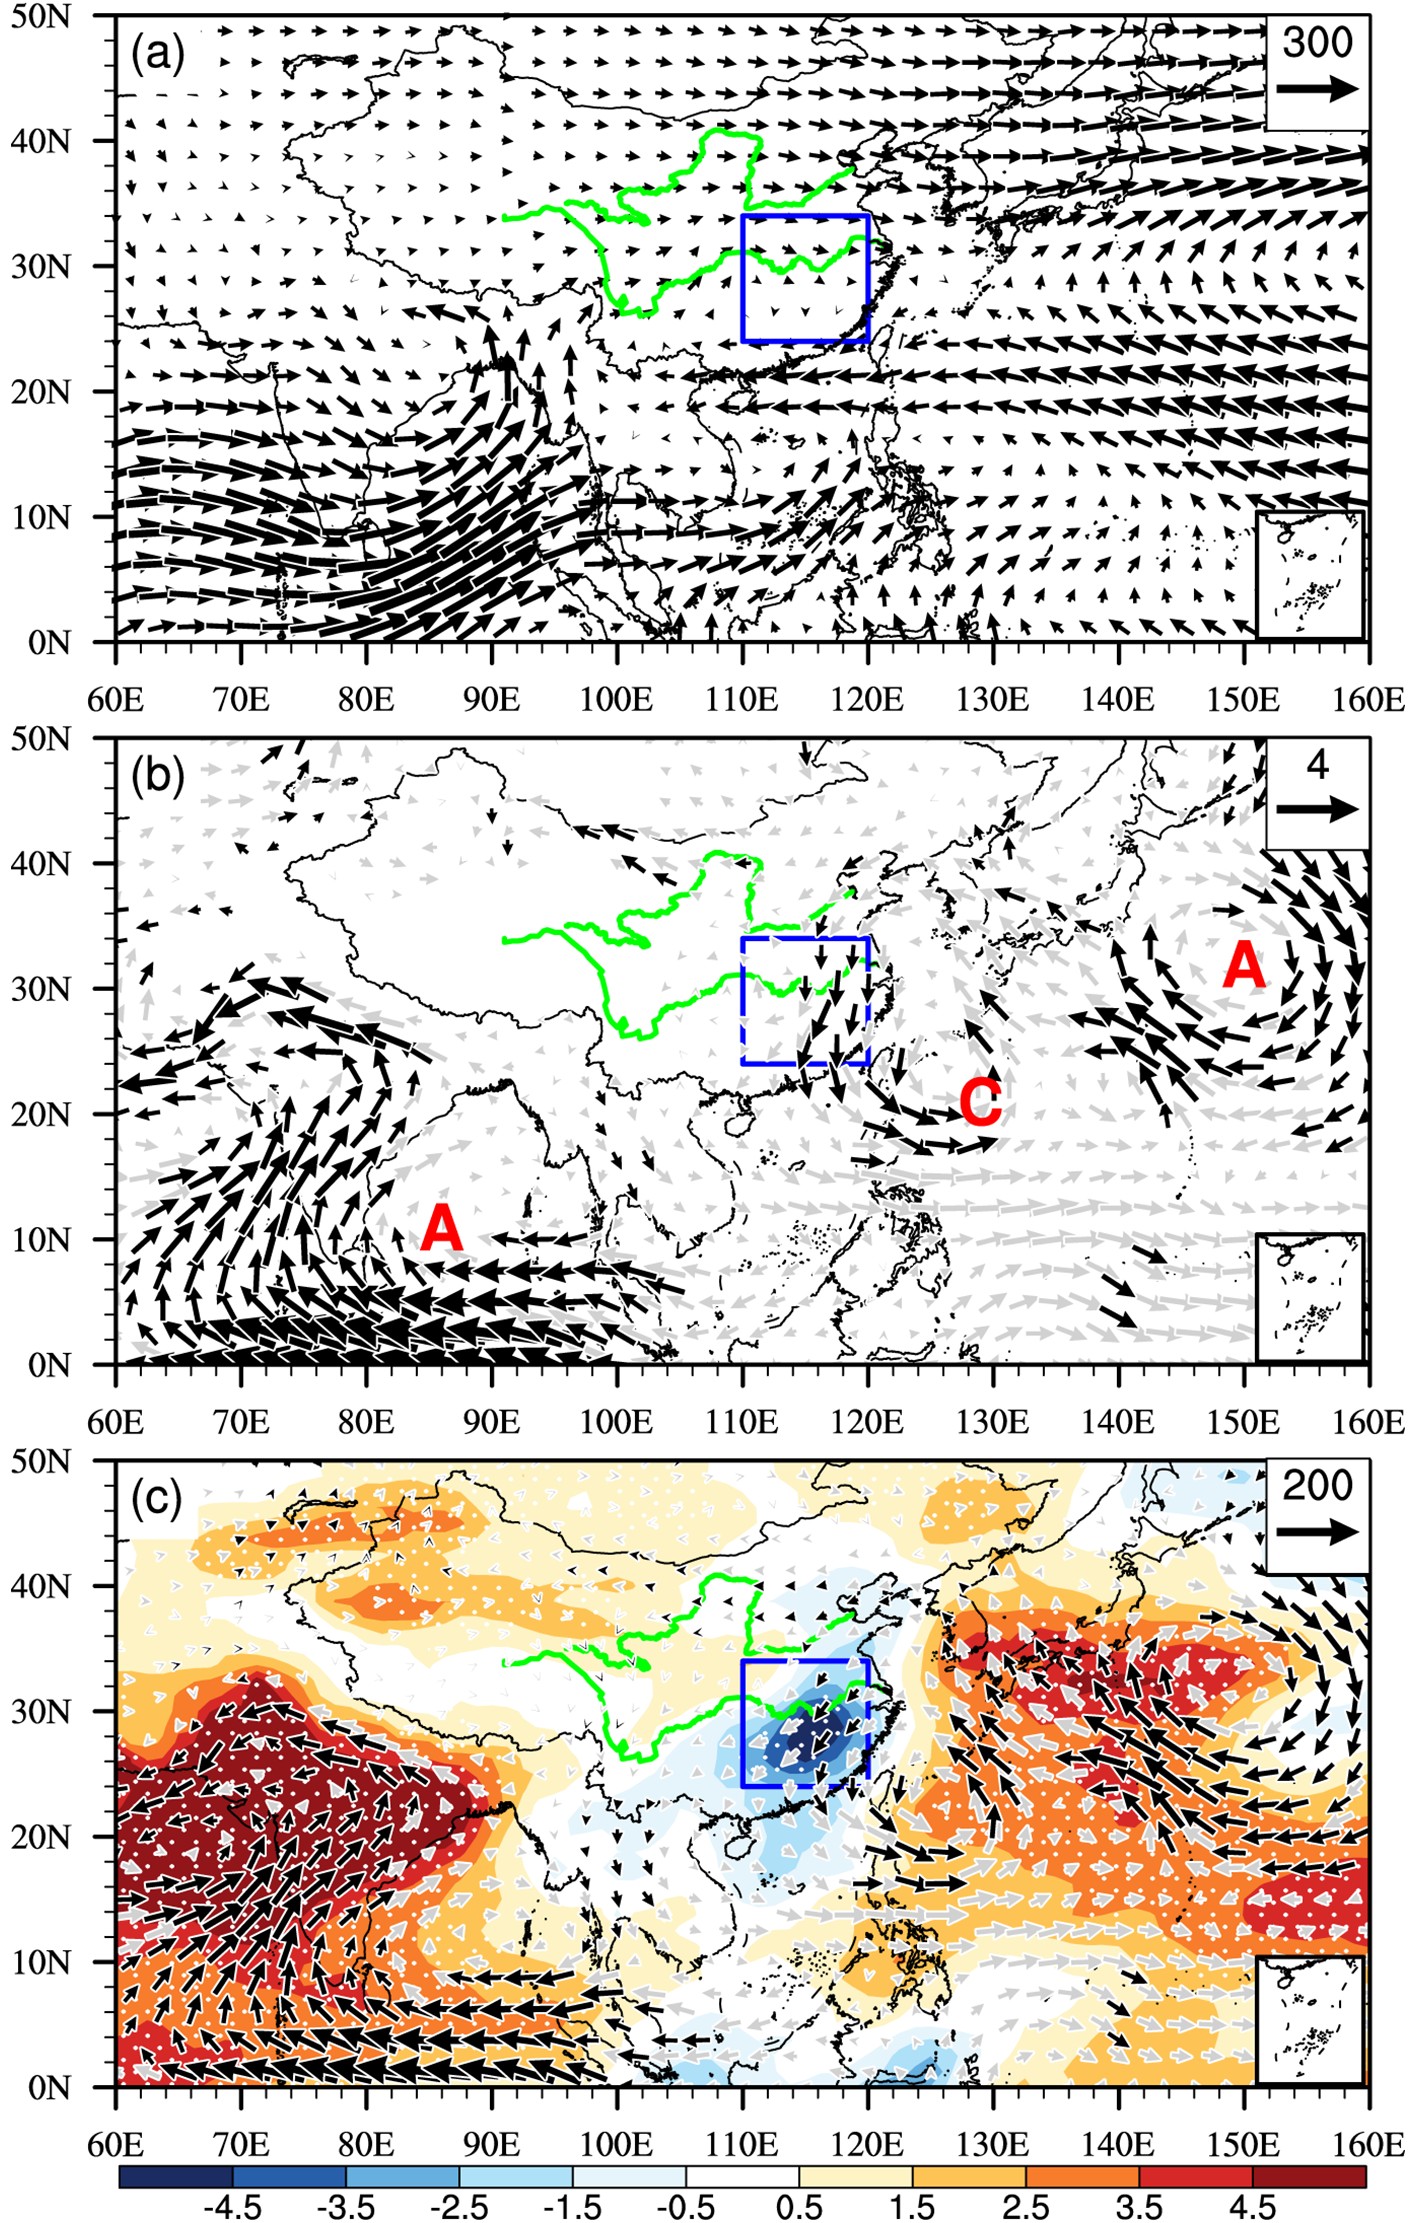 Figure2. (a) August?October mean climatology of vertically integrated water vapor transport (units: kg m?1 s?1), (b) wind anomalies at 850 hPa (units: m s?1) and (c) vertically integrated water vapor transport anomalies (vectors; units: kg m?1 s?1) and water vapor anomalies (shading; units: kg m?2) from August to October of 2019. The letters A and C in (b) mark the centers of anomalous anticyclones and cyclones, respectively. The blue boxes indicate the EC region. Vectors in (b, c) are shown in black where the values fall outside the 5th?95th percentile range in at least one direction. Shading in (c) is stippled by white dots where the values fall outside the 5th?95th percentile range.
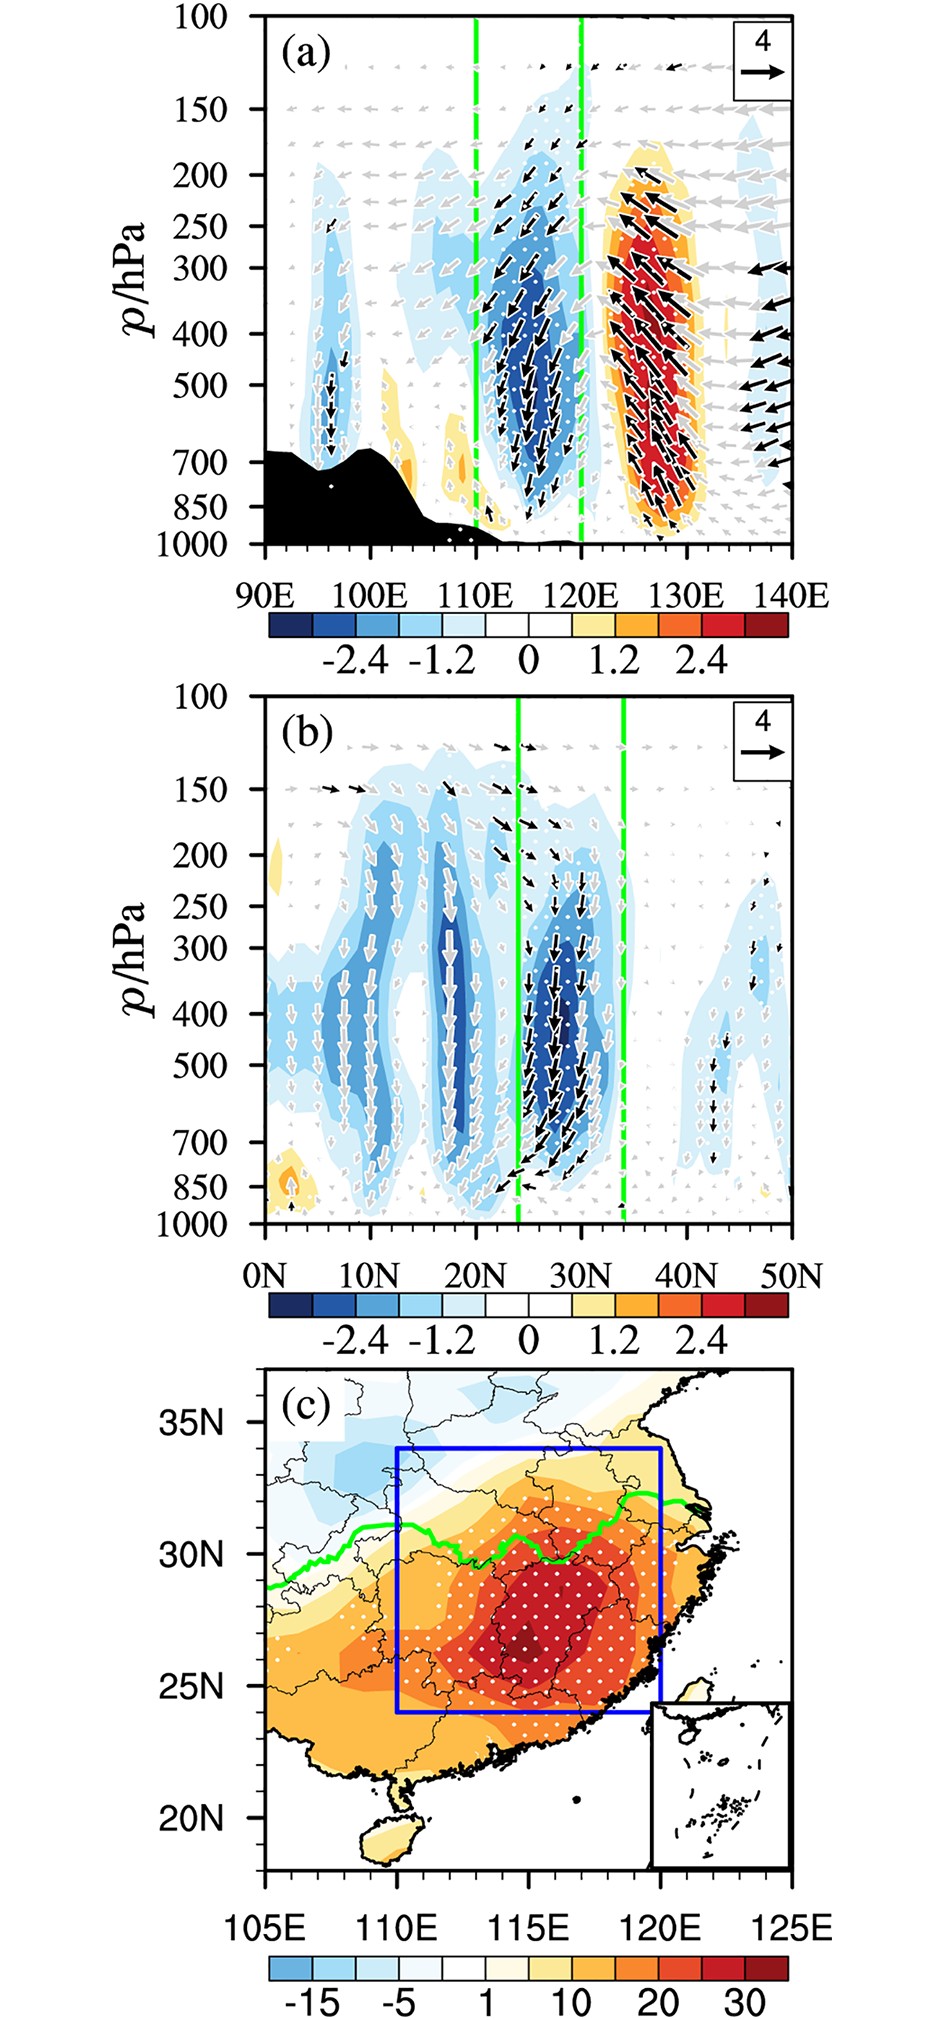 Figure3. August?October 2019 anomalies of (a) zonal?vertical circulation [vectors indicate a composite of zonal winds (units: m s?1) and sign-reversed pressure velocities (units: 10?2 Pa s?1)] averaged over 24°?34°N, and (b) meridional?vertical circulation [vectors indicate a composite of meridional winds (units: m s?1) and sign-reversed pressure velocities (units: 10?2 Pa s?1)] averaged over 110°?120°E. Shading indicates the sign-reversed pressure velocity (units: 10?2 Pa s?1) and is stippled by white dots when the values fall outside the 5th?95th percentile range. Vectors are shown in black when they fall outside of the 5th?95th percentile range in at least one direction. The green lines indicate the EC region, while the black filled areas denote topography. (c) August?October 2019 anomalies (units: W m?2) in the downward solar radiation flux reaching the Earth’s surface, shown stippled by white dots when anomalies fall outside the 5th?95th percentile range.
Vertical motion is another important factor affecting the precipitation and SAT anomalies. Figure 3 shows the zonal? and meridional?vertical circulation composite of anomalous winds and pressure velocities in 2019 averaged over EC from August to October. It is noted that, as a result of cold?dry moist enthalpy advection associated with the northerly component of the western ?ank of the WNP cyclonic anomalies (Ham et al., 2007; Wu et al., 2017), extremely anomalous downdrafts predominated in the troposphere over EC. The enhanced descending motion prevented convection and precipitation and increased solar radiation heating at the surface (Fig. 3c); its associated adiabatic warming facilitated higher surface temperatures and maintained a local anticyclone. Therefore, the co-occurrence of severe drought and high temperature in EC from August to October 2019 was directly caused by strengthened air descent and reduced moisture transport from the South China Sea, induced by the anomalous NWP cyclone.
2
3.2. Linkage with El Ni?o Modoki-like SST anomalies
The previous results imply that the local factors that facilitated the severe drought in EC from August to October 2019 were associated with an extensively anomalous cyclone over the NWP. However, the atmospheric circulation regime responsible for the local circulation anomalies over EC deserves further investigation. A number of studies have demonstrated that the atmospheric circulation anomaly responsible for drought in EC is possibly a response to the SST anomalies in tropical oceans, especially those strongly linked to the ENSO phenomenon (Dai, 2011, 2013; Feng and Li, 2011; Zhang et al., 2011, 2013, 2014, 2015, 2018; Jin et al., 2013; Wang et al., 2015; Feng et al., 2014, 2016; Ma et al., 2017). To investigate the connection between SST anomalies and EC droughts, we calculated the August?October SST anomalies that were linearly congruent with the interannual variability of EC precipitation by regressing the SST anomalies onto the sign-reversed detrended EC area-mean precipitation from 1960 to 2019. The regression map between EC area-mean precipitation and SST revealed that the most obvious SST anomalies closely linked to EC precipitation variability were mainly centered on the tropical Pacific. A decrease in August?October EC area-mean precipitation corresponded to a tripole pattern of SST anomalies over the tropical Pacific. The significant warm anomalies in the central equatorial Pacific (CEP) were flanked by cold anomalies in the western and eastern equatorial Pacific and extended northeastward to the eastern extratropical Pacific (Fig. 4a), resembling the anomalous SST pattern during El Ni?o Modoki (Ashok et al., 2007). This indicates that when the tropical Pacific SST exhibits an El Ni?o Modoki-like anomaly, EC experiences a precipitation deficit, consistent with previous studies (Feng and Li, 2011; Zhang et al., 2011, 2014; Feng et al., 2016). During the severe drought in August?October 2019, extremely warm SST anomalies prevailed over the CEP, while cold SST anomalies appeared over the western and eastern equatorial Pacific (Fig. 4b). This implies that the warm CEP SST anomaly may have played an important role in the anomalous circulation associated with the severe EC drought from August to October 2019.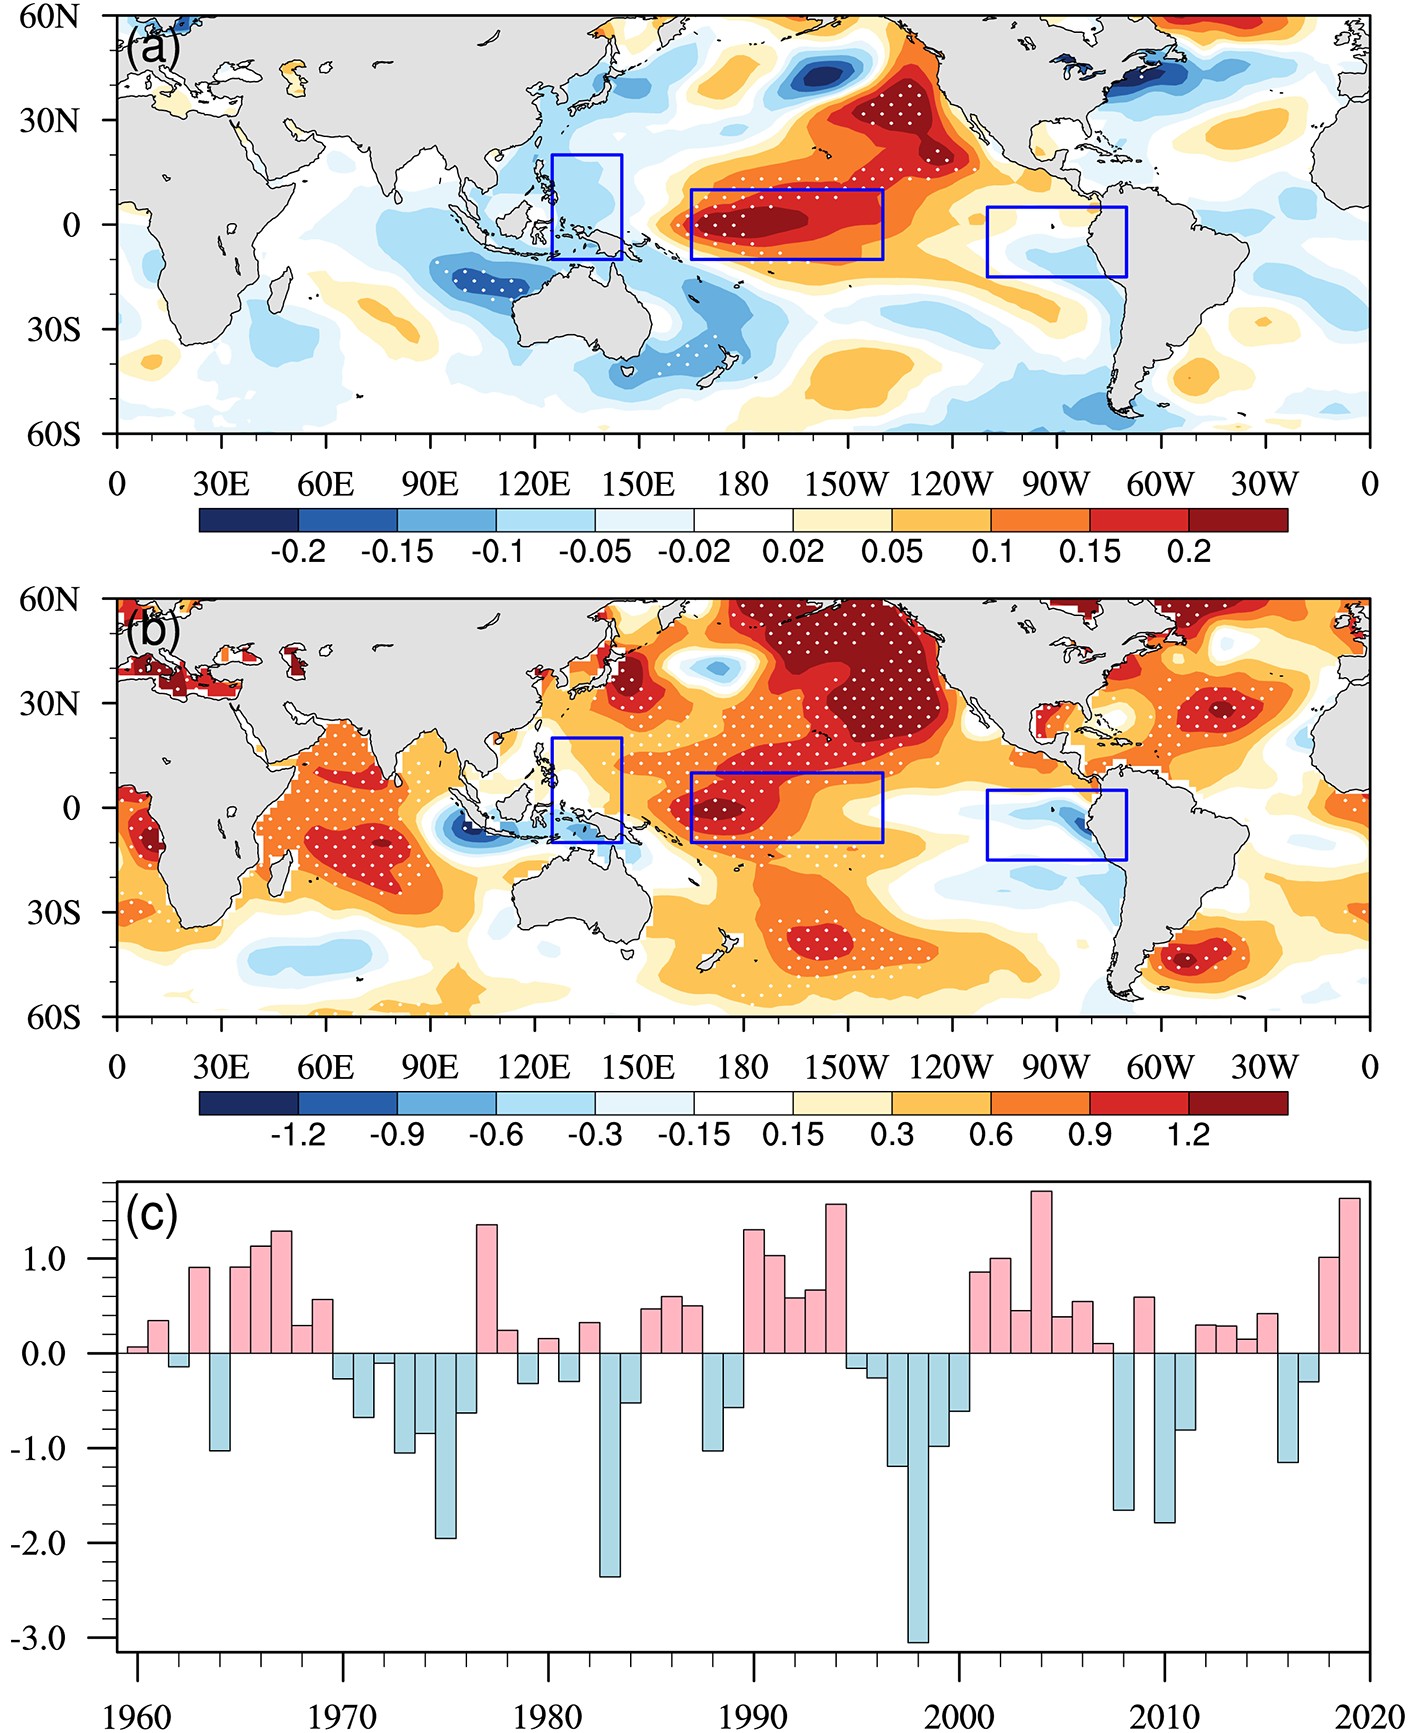 Figure4. (a) Linear regression of SST anomalies on the standardized anomalies of the sign-reversed detrended EC area-mean precipitation from August to October of 1960?2019. Stippling indicates signi?cance at the 99% confidence. (b) August?October mean SST anomalies for 2019. Stippling indicates anomalies falling outside the 5th?95th percentile range. The blue rectangular boxes in (a, b) indicate the areas used to calculate the EMI. (c) Time series of the standardized anomalies of August?October mean EMI from 1960 to 2019.
To explore the possible effects of the El Ni?o Modoki-like SST anomaly on the EC drought, regression maps of the atmospheric circulation patterns in August?October against the standardized El Ni?o Modoki Index [EMI, shown in Fig. 4c and defined using the method of Ashok et al. (2007)] from 1960 to 2019 are shown in Fig. 5. Warm conditions over the CEP are associated with significant cyclonic circulation anomalies in the lower troposphere over the WNP (Fig. 5a). The significant northerly wind anomalies on the west side of the anomalous cyclone over the WNP reduce the northward water vapor transport from the South China Sea to EC, leading to an apparent anomalous southward integrated vapor transport and significant negative integrated moisture in EC. The anomalous cyclone over the WNP is not favorable for the accumulation of moisture in EC and thus plays an important role in the induction of precipitation deficiencies in EC, which is followed by drought initiation. Furthermore, a well-organized anomalous local Hadley circulation exists, with a significant anomalous ascent over the CEP and a significant anomalous descent in EC stretching from the South China Sea to North China. This anomalous meridional circulation strengthens the local Hadley circulation over East Asia, and the resulting strongly descending anomalies in EC favor precipitation deficiencies, thus intensifying the severity of EC droughts. These anomalous atmospheric circulations associated with El Ni?o Modoki-like SST anomalies were in good agreement with those observed in 2019 (Fig. 2 and Fig. 3). These similarities suggest that the El Ni?o Modoki-like tropical Pacific SST anomaly may have been a key external forcing responsible for the severe drought over EC in 2019.
 Figure5. Atmospheric circulation anomalies linked to the EMI. Linear regression of August?October mean (a) sign-reversed pressure velocity at 500 hPa (shading; units: 10?2 Pa s?1) and horizonal wind at 850 hPa (vectors; units: m s?1), and (b) vertically integrated water vapor (shading; units: kg m?2) and water vapor transport (vectors; units: kg m?1 s?1) with respect to the detrended standardized EMI from 1960 to 2019. Shading is stippled by white dots when they are signi?cant at the 99% con?dence level, and vectors are shown as black when they are signi?cant at the 99% con?dence level in at least one direction.
A scatter diagram further confirms the linear linkage between the drought in EC and the El Ni?o Modoki-like SST anomaly (Fig. 6). As a response to the El Ni?o Modoki-like SST anomaly, the EC area-mean northerly wind at 850 hPa and the descent at 500 hPa strengthened significantly, while precipitable water and precipitation decreased significantly. The EMI anomaly in 2019 was ranked the second highest since 1960, occurring synchronously with the fourth strongest northerly wind anomaly at 850 hPa, the fifth lowest precipitable water and second strongest descending anomaly at 500 hPa, and the lowest precipitation in EC since 1960. Therefore, the El Ni?o Modoki-like SST anomaly can be regarded as an important external forcing responsible for the EC drought and its relevant atmospheric circulation anomalies. The strong warm CEP SST anomaly in 2019 was favorable for the occurrence of the most severe precipitation deficiency event in EC.
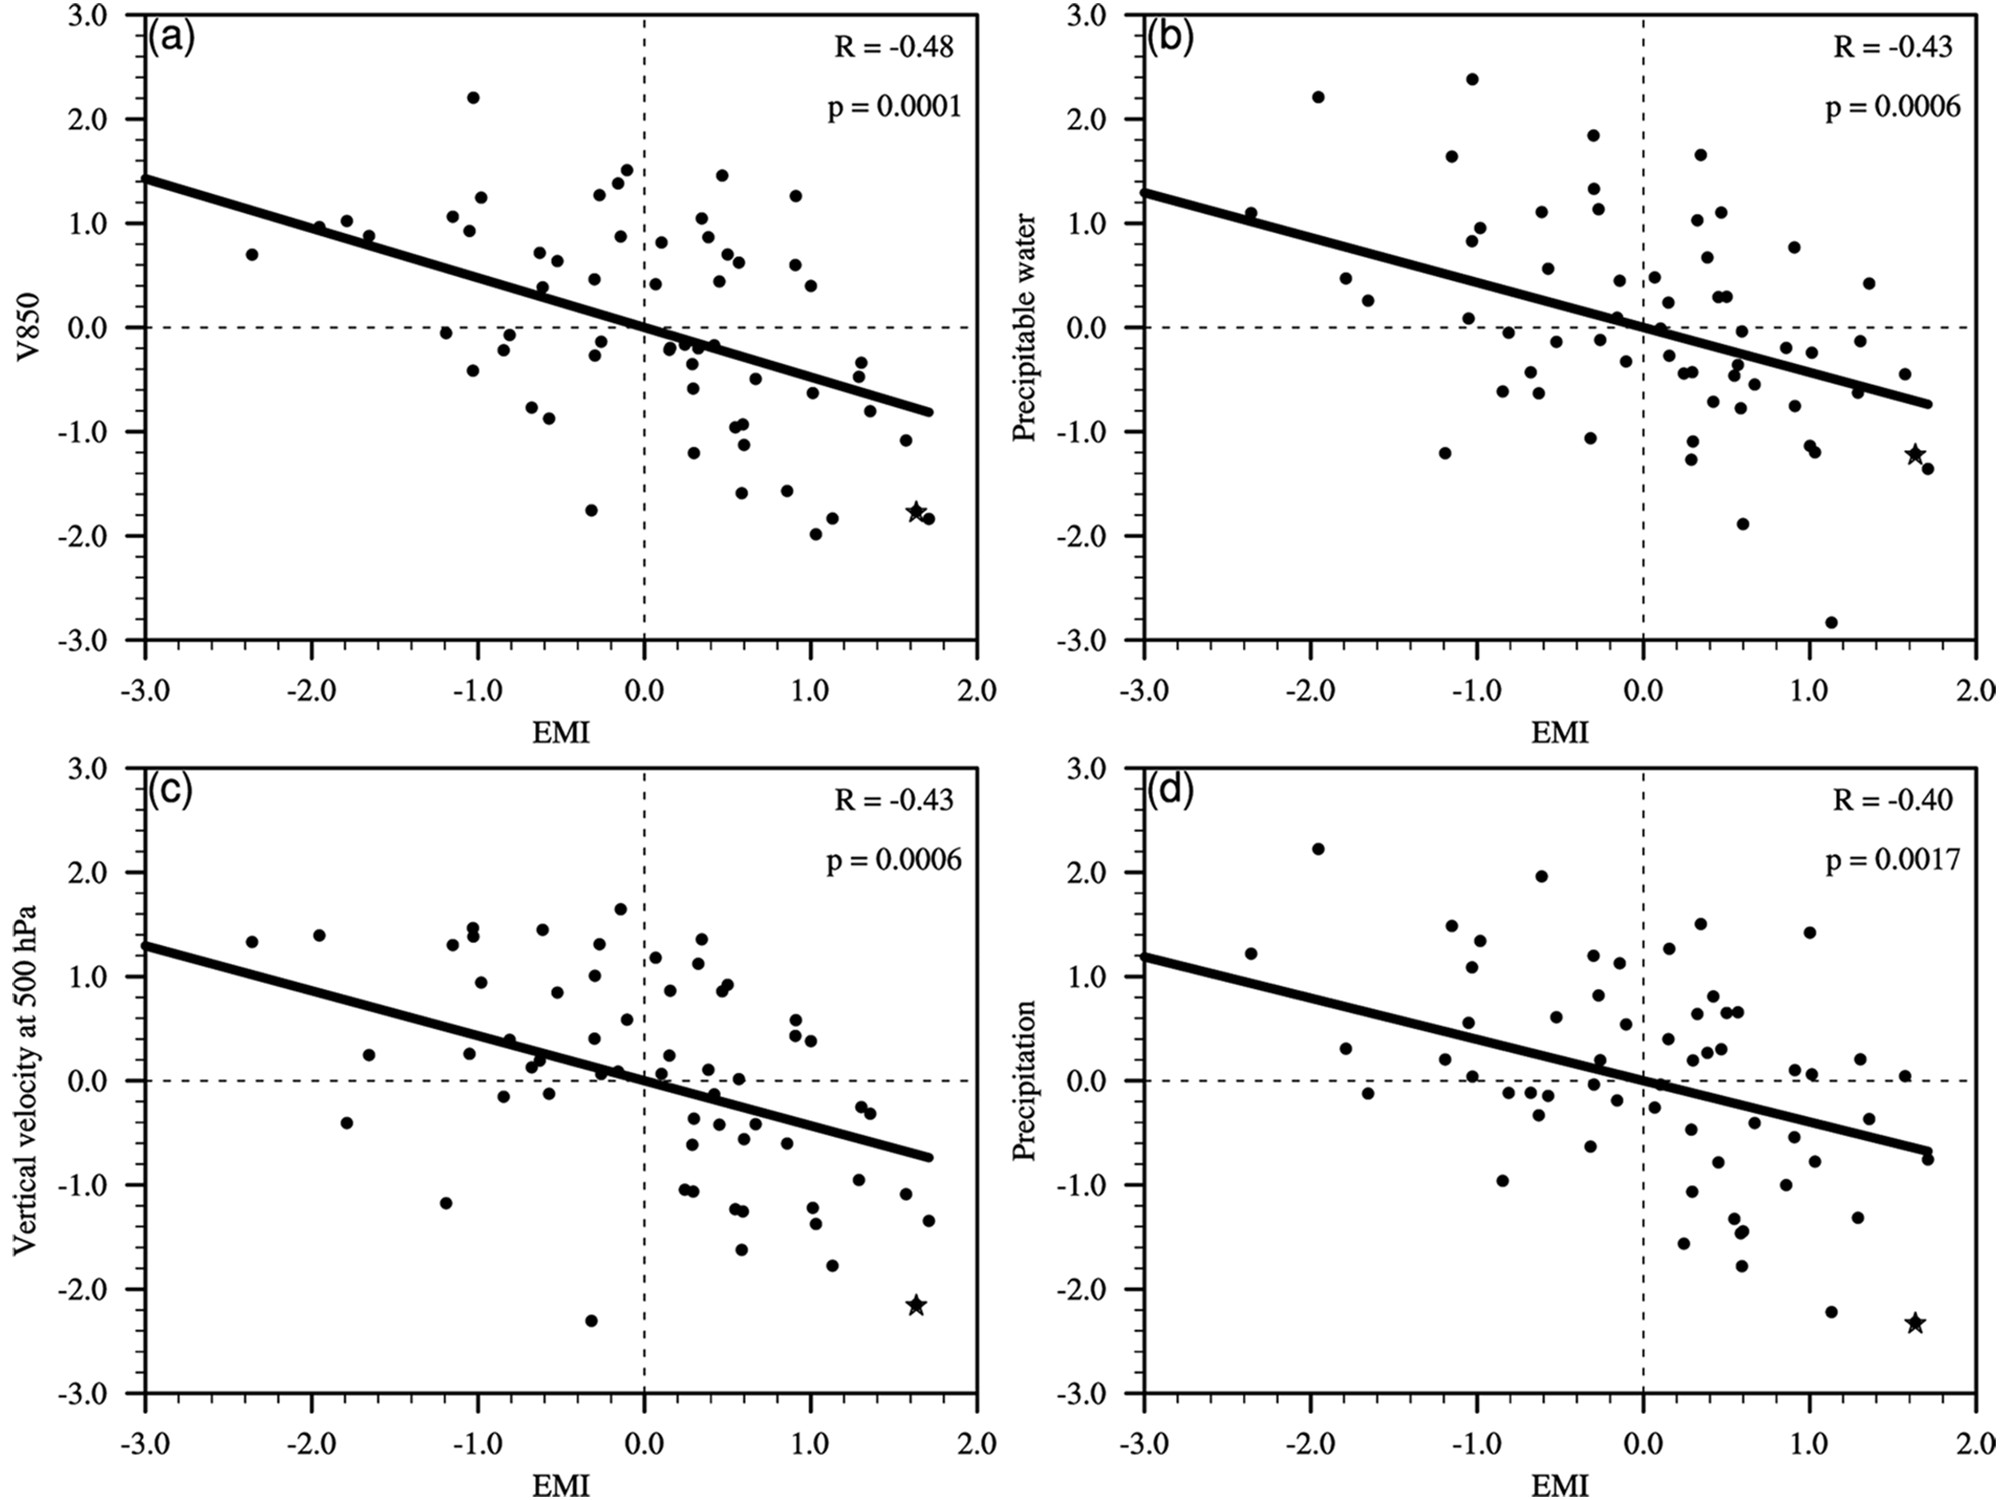 Figure6. Relationships between the EMI and observed variables related to the EC drought. Scatterplots between the standardized August?October mean EMI and (a) EC meridional wind at 850 hPa, (b) EC precipitable water, (c) EC sign-reversed pressure velocity at 500 hPa, and (d) EC precipitation from 1960 to 2019. Stars denote values for 2019. The least-squares regression lines are drawn in black, and the corresponding regression coef?cients (R) are indicated in the top-right corner of the plots. The p value is the signi?cance of R.
The above results clearly indicate that the El Ni?o Modoki-like SST anomaly can affect EC climate by inducing a cyclonic circulation over the NWP. To substantiate the physical connection between El Ni?o Modoki-like SST anomalies and EC droughts, the anomalous SSTs and atmospheric circulations during extreme EC drought years, with a 94-year return interval analogous to that of the observed 2019 event, in the fully coupled PIC simulations of the CESM-LE projection were analyzed (Fig. 7). In general, the PIC simulations reproduced the observed circulation anomalies of EC precipitation deficiency connected to the El Ni?o Modoki-like SST anomaly over the tropical Pacific. During extreme EC drought years, the model-simulated SSTs showed statistically significant warm anomalies over the CEP with an anomalous warm center near the International Date Line and exhibited an El Ni?o Modoki-like pattern. Furthermore, a strong cyclonic anomaly occupied the WNP and brought significant northerly winds to EC. In the PIC simulations, the medians of 60-year sliding time window correlations of EMI with the EC area-mean meridional wind at 850 hPa and with precipitation were ?0.45 and ?0.32, respectively, and both were statistically signi?cant at the 1% level. The agreement between the PIC simulations and observations further consolidates the connection between the El Ni?o Modoki-like SST anomaly and EC drought.
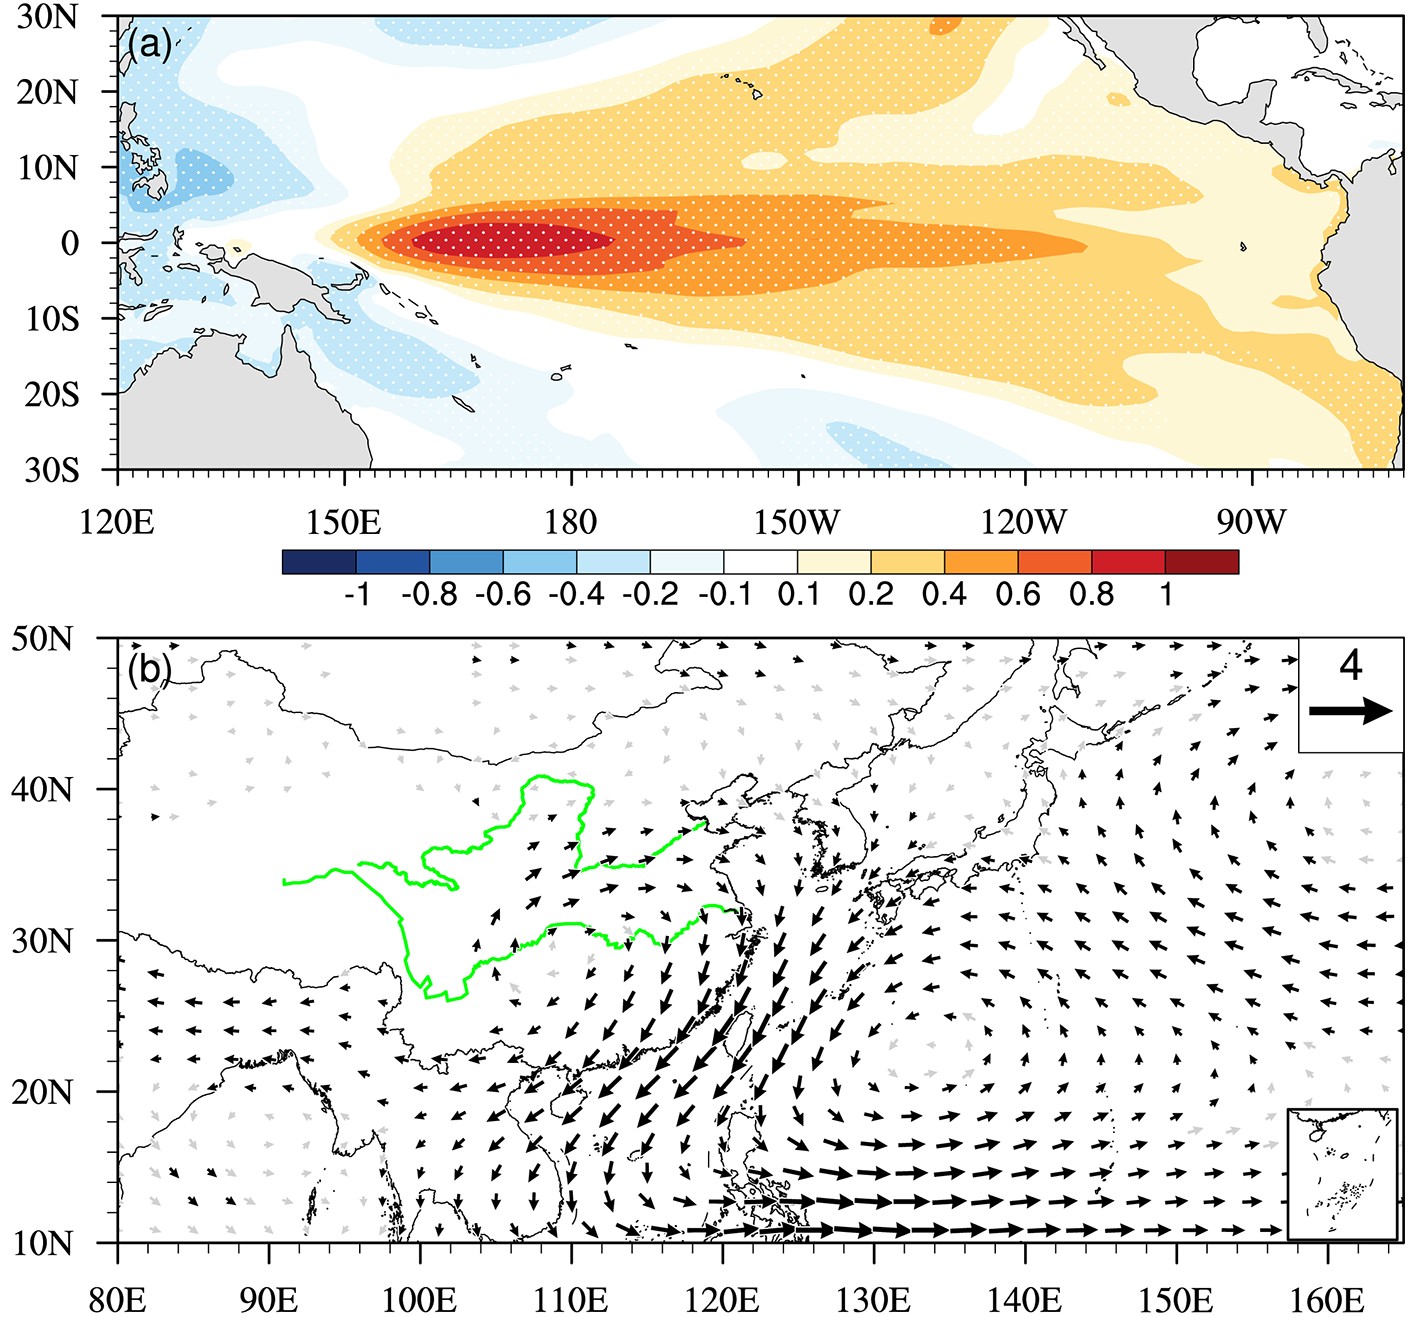 Figure7. Composite anomalies of (a) SST (units: °C) and (b) horizonal wind (units: m s?1) at 850 hPa during EC extreme drought years (August?October precipitation meeting or falling below the 94-year return interval) in the PIC simulations of CESM1. Shading is stippled by white dots when they are signi?cant at the 99% con?dence level, and vectors are shown in black when they are signi?cant at the 99% con?dence level in at least one direction.
2
3.3. Impact of anthropogenic warming
Notably, the strongest EC precipitation deficiency in 2019 occurred simultaneously with the record-breaking high SATs (Fig. 1). Although extreme precipitation deficiencies and high temperature events do not necessarily occur at the same time (Sun and Yang, 2012; Lu et al., 2014), the concurrence of abnormally high temperatures with severe precipitation deficiencies might exacerbate local drought conditions due to the positive relationship between these factors (Lu et al., 2011; Li et al., 2018). Global warming and the associated increase in extreme temperatures substantially increase the chances of concurrent droughts and heat waves (AghaKouchak et al., 2014; Diffenbaugh et al., 2015; Williams et al., 2015; Ma et al., 2017). Thus, to understand the potential contribution of anthropogenic warming to the extreme EC drought in 2019, we compared the observed EMI, EC area-mean SAT and precipitation with CESM-LE simulations with only natural internal variability included and with simulations in which both climate change and natural internal variability were included.Figure 8 shows the time series and 60-year sliding time window trends of the observed and model-simulated EMI, EC area-mean rainfall and SAT anomalies from August to October of 1920?2019. Here, the model ensemble mean highlights the externally forced signal, whereas the spread among the ensemble members reflects the unforced anomaly generated by the natural internal variability. The 2019 drought in EC occurred against a background of significant local warming. The observed EMI and EC area-mean rainfall anomalies show no significant trend from 1960?2019, but corresponding values in 2019 exhibit the second highest index value and lowest precipitation since 1960. The ensemble means of model simulated EMI and EC area-mean precipitation anomalies were small in contrast to the observation in 2019. The observed EMI and EC area-mean precipitation anomalies in 2019 fell within the large spread among the 40 CESM-LE members, and some individual members reproduced the amplitude of the observed high EMI value and precipitation deficiency percentage in EC. The observed EC area-mean SAT showed a significant warming trend of 0.86°C (60 yr)?1, with a distinctive warm anomaly of 1.21°C in 2019 (Fig. 8e). The observed SAT anomaly in 2019 was within the range of the 40 CESM-LE ensemble members but was higher than the ensemble mean (an anomaly of 0.77°C). These results suggest that the external forcing encouraged surface warming from August to October of 2019 in EC, while the natural internal variability explains much of the high EMI and the precipitation deficit in EC.
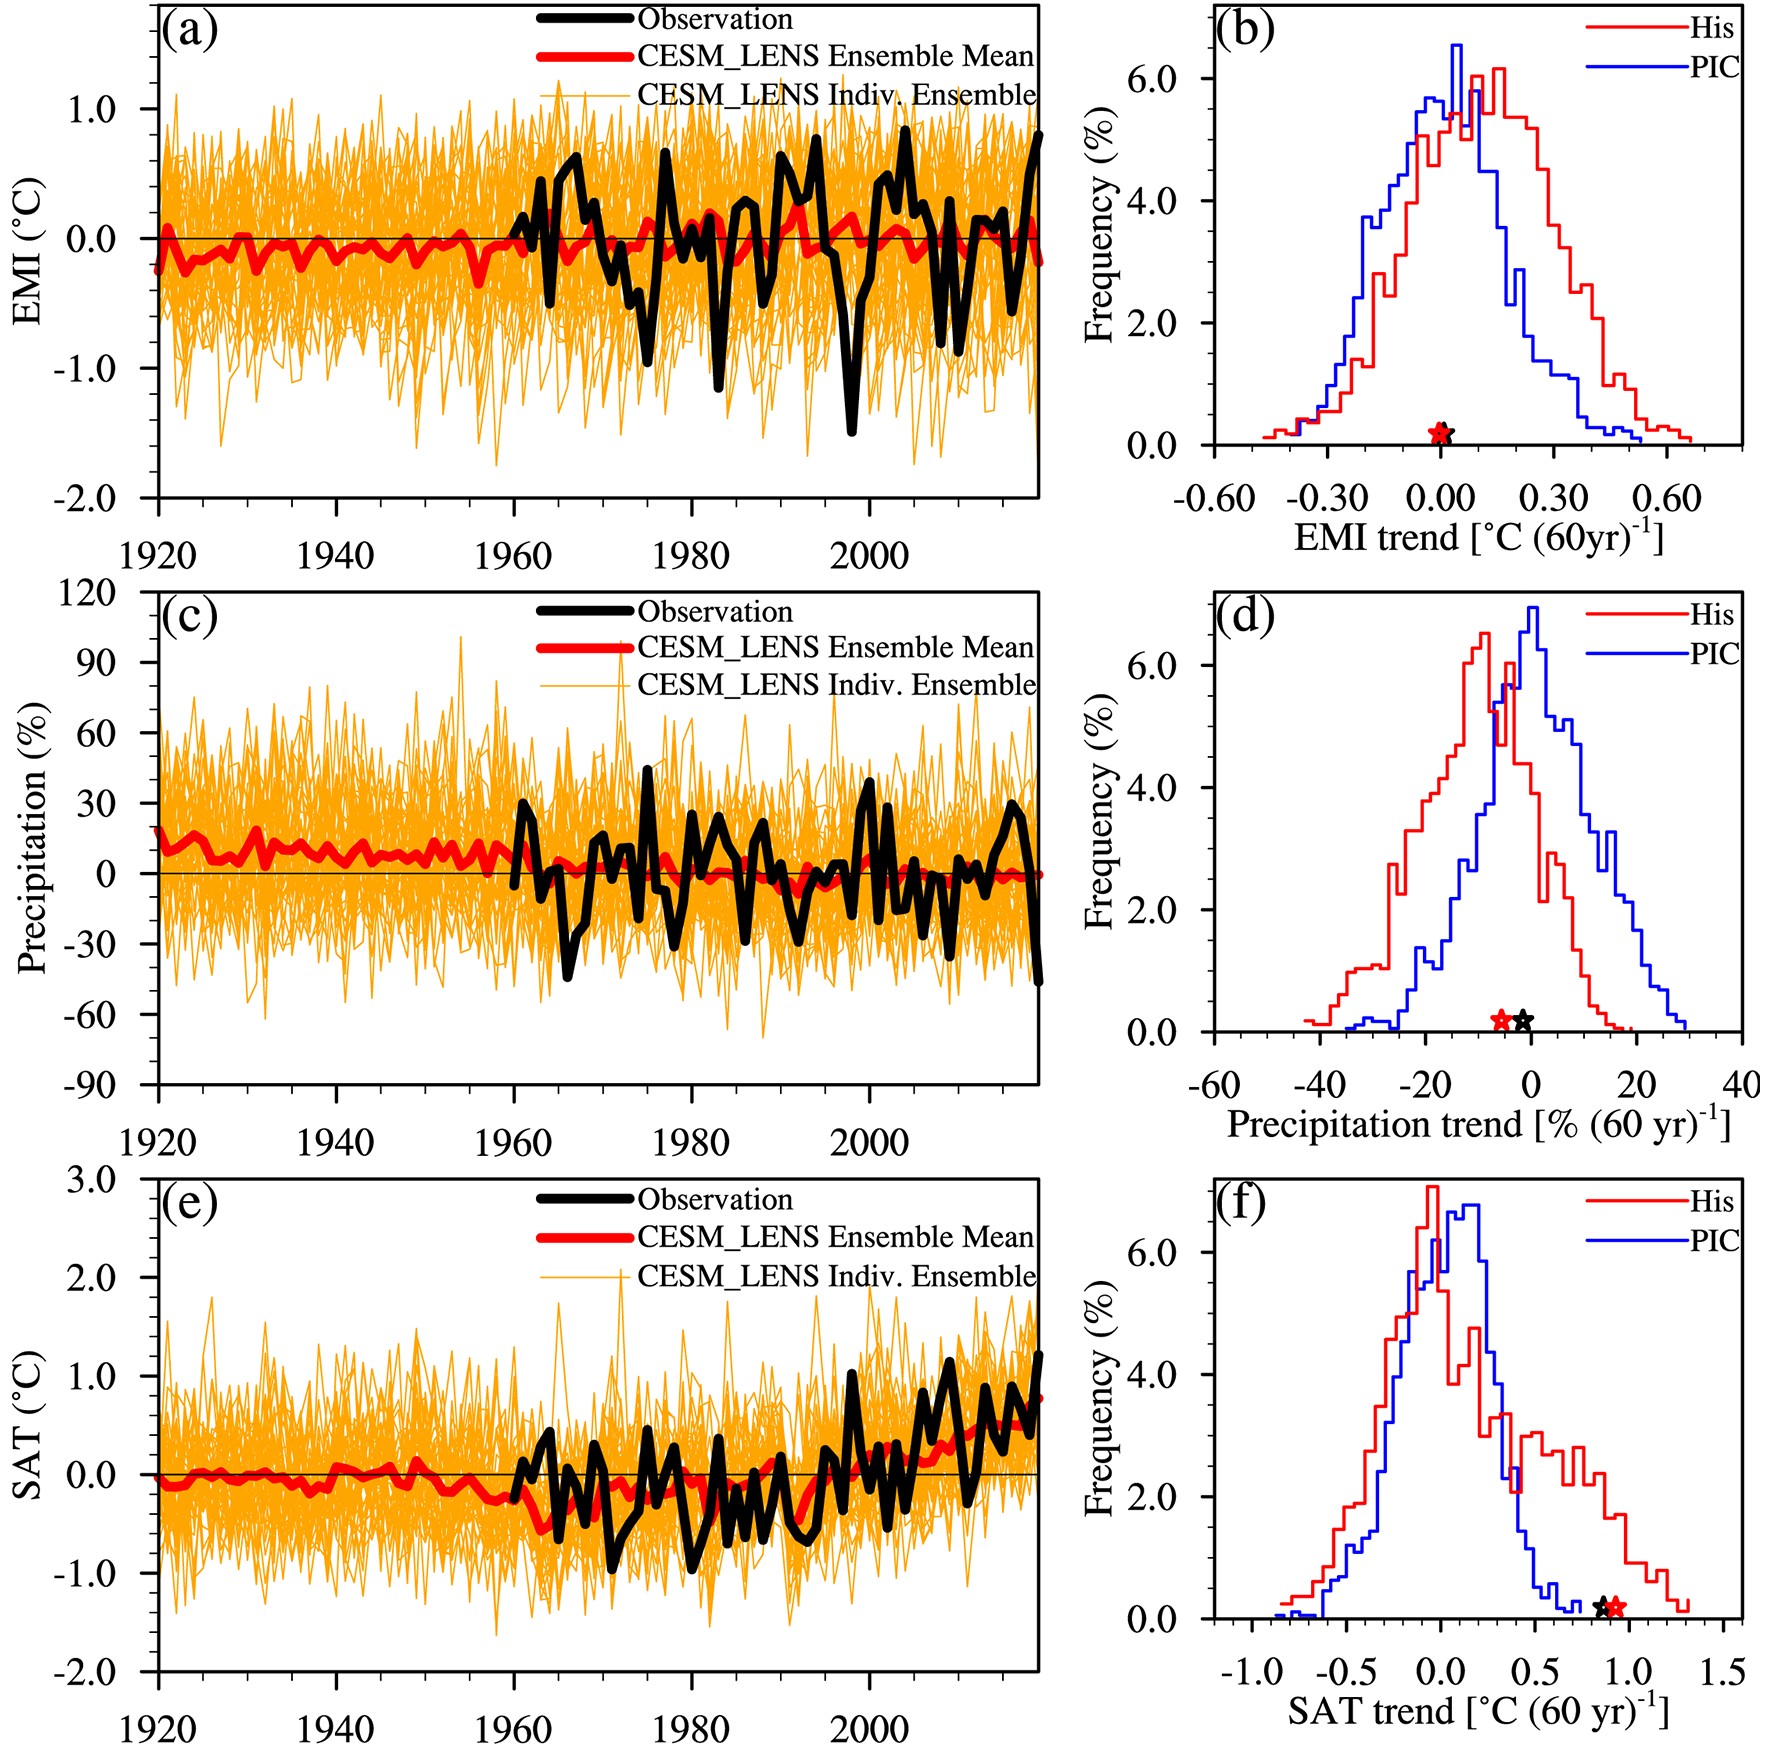 Figure8. Time series of August?October (a) EMI anomalies, (c) EC area-averaged SAT anomalies (unit: °C) and (e) EC area-averaged precipitation percentage anomalies (%) from 1920 to 2019. The black line depicts the observed anomalies, the dark red line depicts the ensemble mean anomalies from the 40-member CESM-LE runs, and the orange lines are individual ensemble members. Histograms of 60-year sliding trends of August?October mean (b) EMI [units: °C (60 yr)?1], (d) EC area-averaged SAT [units: °C (60 yr)?1] and (f) EC area-averaged precipitation percentage [% (60 yr)?1]. The red curves show trends derived from the 40-member CESM-LE simulations from 1920 to 2019, the blue curves show trends derived from the PIC simulations, and the black (red) stars denote observed (40-member ensemble mean) trends from 1960 to 2019.
Taking the PIC simulated internal variability as a surrogate for the natural internal variability in the real world (Kay et al., 2015; Ma et al., 2017; Swain et al., 2018), the observed trends of EMI, EC area-mean SAT and precipitation were compared with those in the CESM-LE historical simulations and in the PIC simulations (Figs. 8b, d and f). This comparison shows that global warming favors the shifting of EMI long-term trends towards a warmer El Ni?o Modoki-like regime and the shifting of EC precipitation trends towards more severe precipitation deficiencies (Figs. 8b and d). However, no evidence suggests that it contributed to a significant increasing trend of EMI and a decreasing trend of rainfall in EC from 1960 to 2019. The observed trend in SAT from 1960 to 2019 was outside of the range of the 60-year sliding time window trend distribution in the PIC simulations, indicating that the warming SAT in EC cannot be explained by internal climate variability alone. Instead, the observed SAT trend [0.86°C (60 yr)?1] was comparable to the ensemble mean trend [0.93°C (60 yr)?1] from 1960?2019 and was within the range of the 60-year sliding time window trend distribution in the historical simulations. Such a result implies that the observed trend is consistent with the All-forcing simulations. Therefore, the significant warming trend in SAT over EC from 1960 to 2019 was very likely driven in part by anthropogenic forcing.
Did global warming contribute to the extreme EC drought in 2019? To reveal the impacts of global warming on the occurrence of severe drought events in EC like the 2019 drought, we compared the probability distribution functions (PDFs) of the simulated anomalies of EMI, EC area-mean precipitation and SAT from 1980 to 2019 with those in the PIC simulation. The period from 1980 to 2019 coincided with the start of a period of increased global warming, and since the 1980s, each successive decade has been warmer than any preceding decade since 1850 (WMO, 2020). There were clear indications of an increased probability of warmer El Ni?o Modoki-like regimes during the most recent four decades (Fig. 9a), which accompanied an increasing risk for more severe precipitation deficits in EC (Fig. 9c). There were also clear indications of an increased probability of warmer SAT in EC (Fig. 9e). In addition, in contrast to the PIC simulation, an increase in the occurrence frequency of concurrent dry and warm conditions from 1980 to 2019 was clear (Figs. 9b, d and f). There was no significant trend for the simulated August?October mean EMI and EC precipitation from 1960 to 2019, consistent with observations. However, the likelihood for high EMI and low EC precipitation extremes like that of 2019 significantly increased under anthropogenic warming. A mean of 2.56 (2.26?4.12) times and 2.22 (1.92?2.56) times increased frequency for high EMI and low EC precipitation extreme events analogous to that in 2019 can be attributed to anthropogenic forcing. EC high temperature events hotter than the observed 2019 event increased in frequency 2.14 (1.76?2.54) times under the influence of anthropogenic climate change. Meanwhile, the frequency of concurrent dry and hot extremes in EC analogous to the case in 2019 increased 2.34 (1.13?3.75) times due to anthropogenic climate forcing.
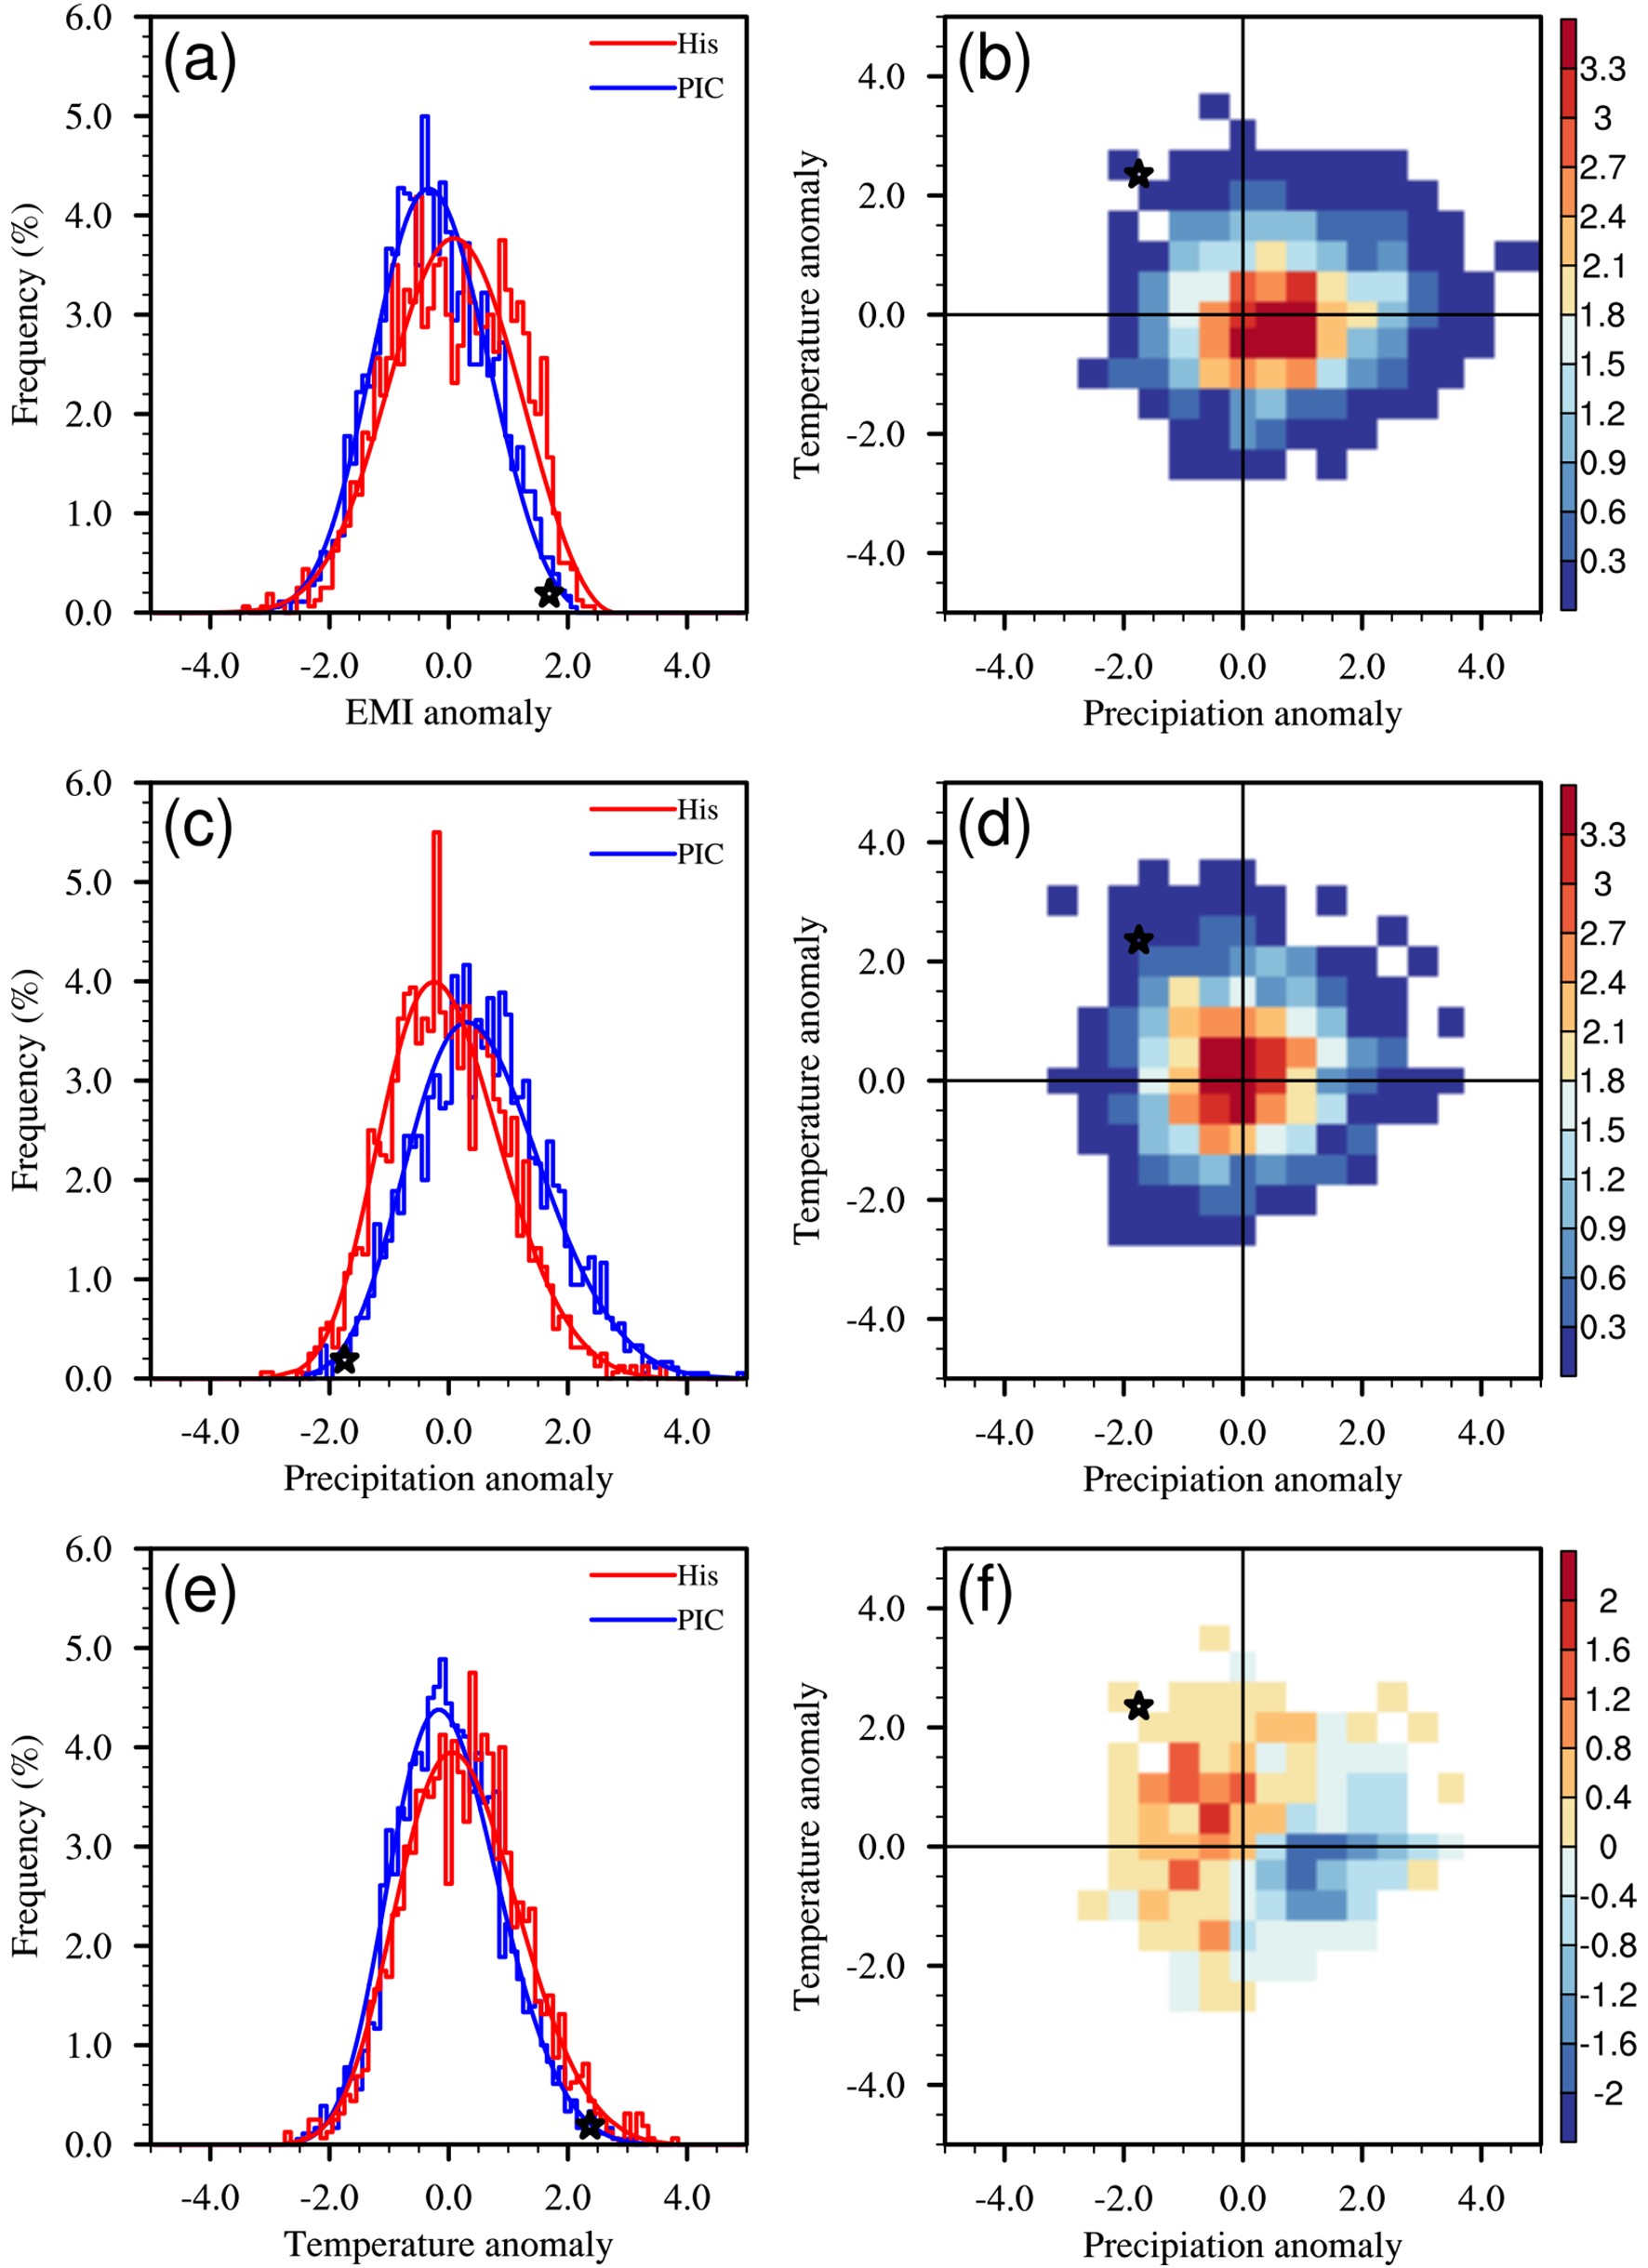 Figure9. Histograms (bars) and PDFs for the fitted GEV distribution of standardized August?October mean anomalies of the (a) EMI, (c) EC precipitation and (e) EC SAT derived from 40-member CESM-LE historical simulations from 1980 to 2019 (red) and the PIC simulations (blue). The joint PDF of the standardized August?October mean EC area-averaged anomalies of SAT and precipitation derived from (b) PIC simulations, (d) CESM-LE historical simulations from 1990 to 2019, and (f) the joint PDF difference between historical simulations from 1990 to 2019 and PIC simulations. Black stars denote the observed anomaly in 2019.
4.1. Summary
From August to October 2019, a particularly extreme drought event occurred in EC against a background of significant long-term warming. This study explored the mechanism that was probably responsible for the 2019 EC extreme drought, and the possible contributions from anthropogenic climate change, based on station precipitation and SAT data, JRA-55 reanalysis data and simulations provided by the CESM-LE projection. The results suggest that the naturally driven El Ni?o Modoki-like SST anomaly and anthropogenic warming strongly contributed to the 2019 EC drought and the concurrent high temperature.The El Ni?o Modoki-like SST anomaly over the tropical Pacific likely led to a distinguishable August?October drought over EC by exciting an anomalous cyclone in the lower troposphere over the WNP, resulting in anomalous northerly winds over EC, thus inducing insufficient moisture concentrations and anomalous downward motion over EC and subsequently favoring severe precipitation deficiency and surface warming. The second highest El Ni?o Modoki-like SST from August to October since 1960, occurring in 2019, might have been one of the contributing drivers for the simultaneous severe drought over EC.
Analysis of CESM-LE simulations showed that natural internal variability accounted for the observed 2019 extreme El Ni?o Modoki-like warm SSTs in the tropical Pacific and the extreme precipitation deficits in EC. Long-term anthropogenic warming in EC from 1960 to 2019 was detectable and played an important role in accounting for the 2019 record-breaking high temperature in EC. Anthropogenic warming was found to yield an approximate twofold increase in the likelihood of EC extreme drought events such as the 2019 event for events showing extremely high temperature alone, low precipitation alone, or both. Therefore, the severe concurrent drought and high temperature event over EC in 2019 may have been caused by the combined impacts of the naturally driven El Ni?o Modoki-like SST anomaly and anthropogenic warming.
2
4.2. Discussion
In this study, based on the linear relationship between EMI and EC drought, it was suggested that the extreme warm El Ni?o Modoki-like SST in the tropical Pacific in 2019 played a crucial role in the simultaneous severe drought in EC. Previous studies report that the influences of warm and cold ENSO Modoki events on climate over East Asia are asymmetric (Feng and Li, 2011; Zhang et al., 2014; Li et al., 2019; Wang et al., 2020). Therefore, the possible asymmetric influence of the ENSO Modoki-like SST on the August?October droughts over EC deserves further study.It has also been suggested that Indian Ocean Dipole (IOD) events have a close relationship with climate anomalies in East Asia (Zhang et al., 2017; Li and Zhao, 2019). The IOD has been shown to cause extremely hot and dry summers in South China by generating a Rossby wave train (Guan and Yamagata, 2003). An extreme positive IOD event occurred in 2019 and is linked with the pre-existing El Ni?o Modoki in the tropical Pacific (Doi et al., 2020). We examined the linear correlation of August?October EC precipitation with the IOD and found no significant linear correlation between them.
Acknowledgements. This study was jointly supported by the National Key R&D Program (Grant No. 2018YFC1505904), the National Natural Science Foundation of China (Grant Nos. 41830969 and 41705052) and the Basic Scientific Research and Operation Foundation of CAMS (Grant No. 2018Z006).
