HTML
--> --> -->Significant forecast skill has been demonstrated by dynamical seasonal prediction systems regarding the seasonal forecast of Yangtze River summer rainfall, (Li et al., 2016; Martin et al., 2020), with the predictable signals arising mainly from the variability associated with tropical air-sea interactions (Scaife et al., 2019). Focusing on the Yangtze River summer rainfall, using the Met Office’s seasonal forecasting system (GloSea5), operational forecasts have been successfully produced each year since 2016 (Golding et al., 2017; Bett et al., 2018, 2020). At lead times of one to four months since February, the summer 2020 forecasts from GloSea5 consistently predicted above-average Yangtze River rainfall (Bett et al., 2021). The high-confidence forecast for this above-average rainfall implies a positive contribution from predictable signals to the exceptional Yangtze River rainfall in summer 2020, which deserves further investigation and will be examined in this study.
Anomalous variation of the Yangtze River summer rainfall is directly affected by the surrounding large-scale circulations in the lower and upper troposphere (Tao and Chen, 1987). As the linkage between the deep tropics and the East Asian summer climate, location changes of the western North Pacific subtropical high (WNPSH) tie closely to the nature of the long-persisting mei-yu rainfall. An anomalous southwestward extension of the WNPSH prompts more moisture transport into the Yangtze River basin from the tropical oceans, and enhances the mei-yu rainfall amounts (e.g., Huang and Sun, 1992; Lu and Dong, 2001; Zhou and Yu, 2005; Li and Lu, 2018). In the summer of 2020, an anomalous westward extension of the WNPSH was also detected (Liu and Ding, 2020), but this did not follow a strong El Ni?o event in the previous winter, which is often the cause for an extreme WNPSH (Wang et al., 2000; Hu et al., 2014; Xie et al., 2016). Recent studies have pointed out that the basin-wide Indian Ocean warming in summer 2020 could have been induced by the exceptionally persistent simultaneous Madden-Julian Oscillation activity (Zhang et al., 2021) and the extreme positive Indian Ocean Dipole event in 2019 (Takaya et al., 2020; Zhou et al., 2021), which contributed to the anomalous WNPSH and enhanced the mei-yu rainfall.
In the upper troposphere, on the other hand, the East Asian upper-tropospheric westerly jet (EAJ) is significantly related to summer rainfall anomalies over East Asia (Lu, 2004; Kuang and Zhang, 2006; Li and Lu, 2017; Wang et al., 2018a). The EAJ is characterized by its meridional location and intensity changes on interannual timescales (Lin and Lu, 2005). It often varies in association with strong mid-latitude wave activities, induces anomalous temperature advection and convective instability around the Yangtze River basin, and further modulates the summer rainfall (Kuang and Zhang, 2006; Wang and Zuo, 2016; Wang et al., 2018a). Relative to the WNPSH, the predictive skill of the summertime EAJ is relatively low in dynamical models, only showing certain capability around the regions south of the EAJ axis (Li and Lin, 2015). The low predictability of the EAJ is mainly due to its large internal atmospheric variability from complex synoptic and intraseasonal variations (Lu et al., 2006; Kosaka et al., 2012; Lin et al., 2018). Liu et al. (2020) pointed out that anomalous mid-latitude circulations with clear sub-seasonal phase transition and wave train activities over Eurasia strongly affected the mei-yu rainfall in summer 2020. This may be a key challenge for seasonal forecasts and will be discussed below.
In this study, we focus on the dynamic drivers/predictability which underly the forecast of the exceptional summer rainfall event in 2020 over the Yangtze River basin, based on the operational seasonal forecast from GloSea5 (Bett et al., 2021). Performances on the key circulation systems, including the WNPSH and EAJ, are also investigated. The outline of this paper is as follows. Section 2 briefly describes the forecast system and datasets used in this study. Section 3 shows the performances of GloSea5 in reproducing the rainfall, and further explores the main drivers and limitations for the anomalous rainfall, before providing the summary and discussion in Section 4.
For the operational forecast, two initialized forecasts are produced by GloSea5 each day, extending out to seven months. A complete forecast ensemble for a given start date is produced by collecting the initialized forecasts for the preceding three weeks, with 42 members in total. In this work, we use the forecast from 1 May 2020 and focus on the 2020 early summer (June–July) with severe mei-yu rainfall. To calibrate the forecast, we also use a hindcast ensemble produced by GloSea5, which comprises four, seven-member hindcast runs (28 members) closest to the forecast start date that covers the 24-year period from 1993 to 2016 (MacLachlan et al., 2015).
The observed datasets used to validate the forecast include the monthly precipitation from the Global Precipitation Climatology Project (GPCP) (Adler et al., 2003), the monthly wind at the fixed pressure levels from ERA-5 reanalysis data (Hersbach et al., 2020) at a 2.5° × 2.5° horizontal resolution, and the SST from NOAA’s monthly mean Extended Reconstructed monthly mean SST V5 dataset (Huang et al., 2017) at a 2° × 2° horizontal resolution, from 1993 to the present. Upon comparing with the model forecast, the anomalies for each year are calculated relative to the period from 1993 to 2016.
3.1. Ensemble mean forecast of rainfall
Figure 1 shows the observed and deterministic forecast precipitation anomalies in summer 2020 (June–July mean). Excessive rainfall appears over the entire Yangtze River basin, exceeding 5 mm d?1 in most of the lower reaches in observations. The averaged anomaly over the Yangtze River basin (25°–35°N, 91°–122°E), following Li et al. (2016), reaches 2.93 mm d?1, which was around 5.7 standard deviations above normal. It overwhelms that of the same period in 1998 (2.9 standard deviations), when the Yangtze River experienced the most severe flooding in 60 years. The heavy mei-yu rainfall in early summer 2020 was almost twice as much as that in 1998.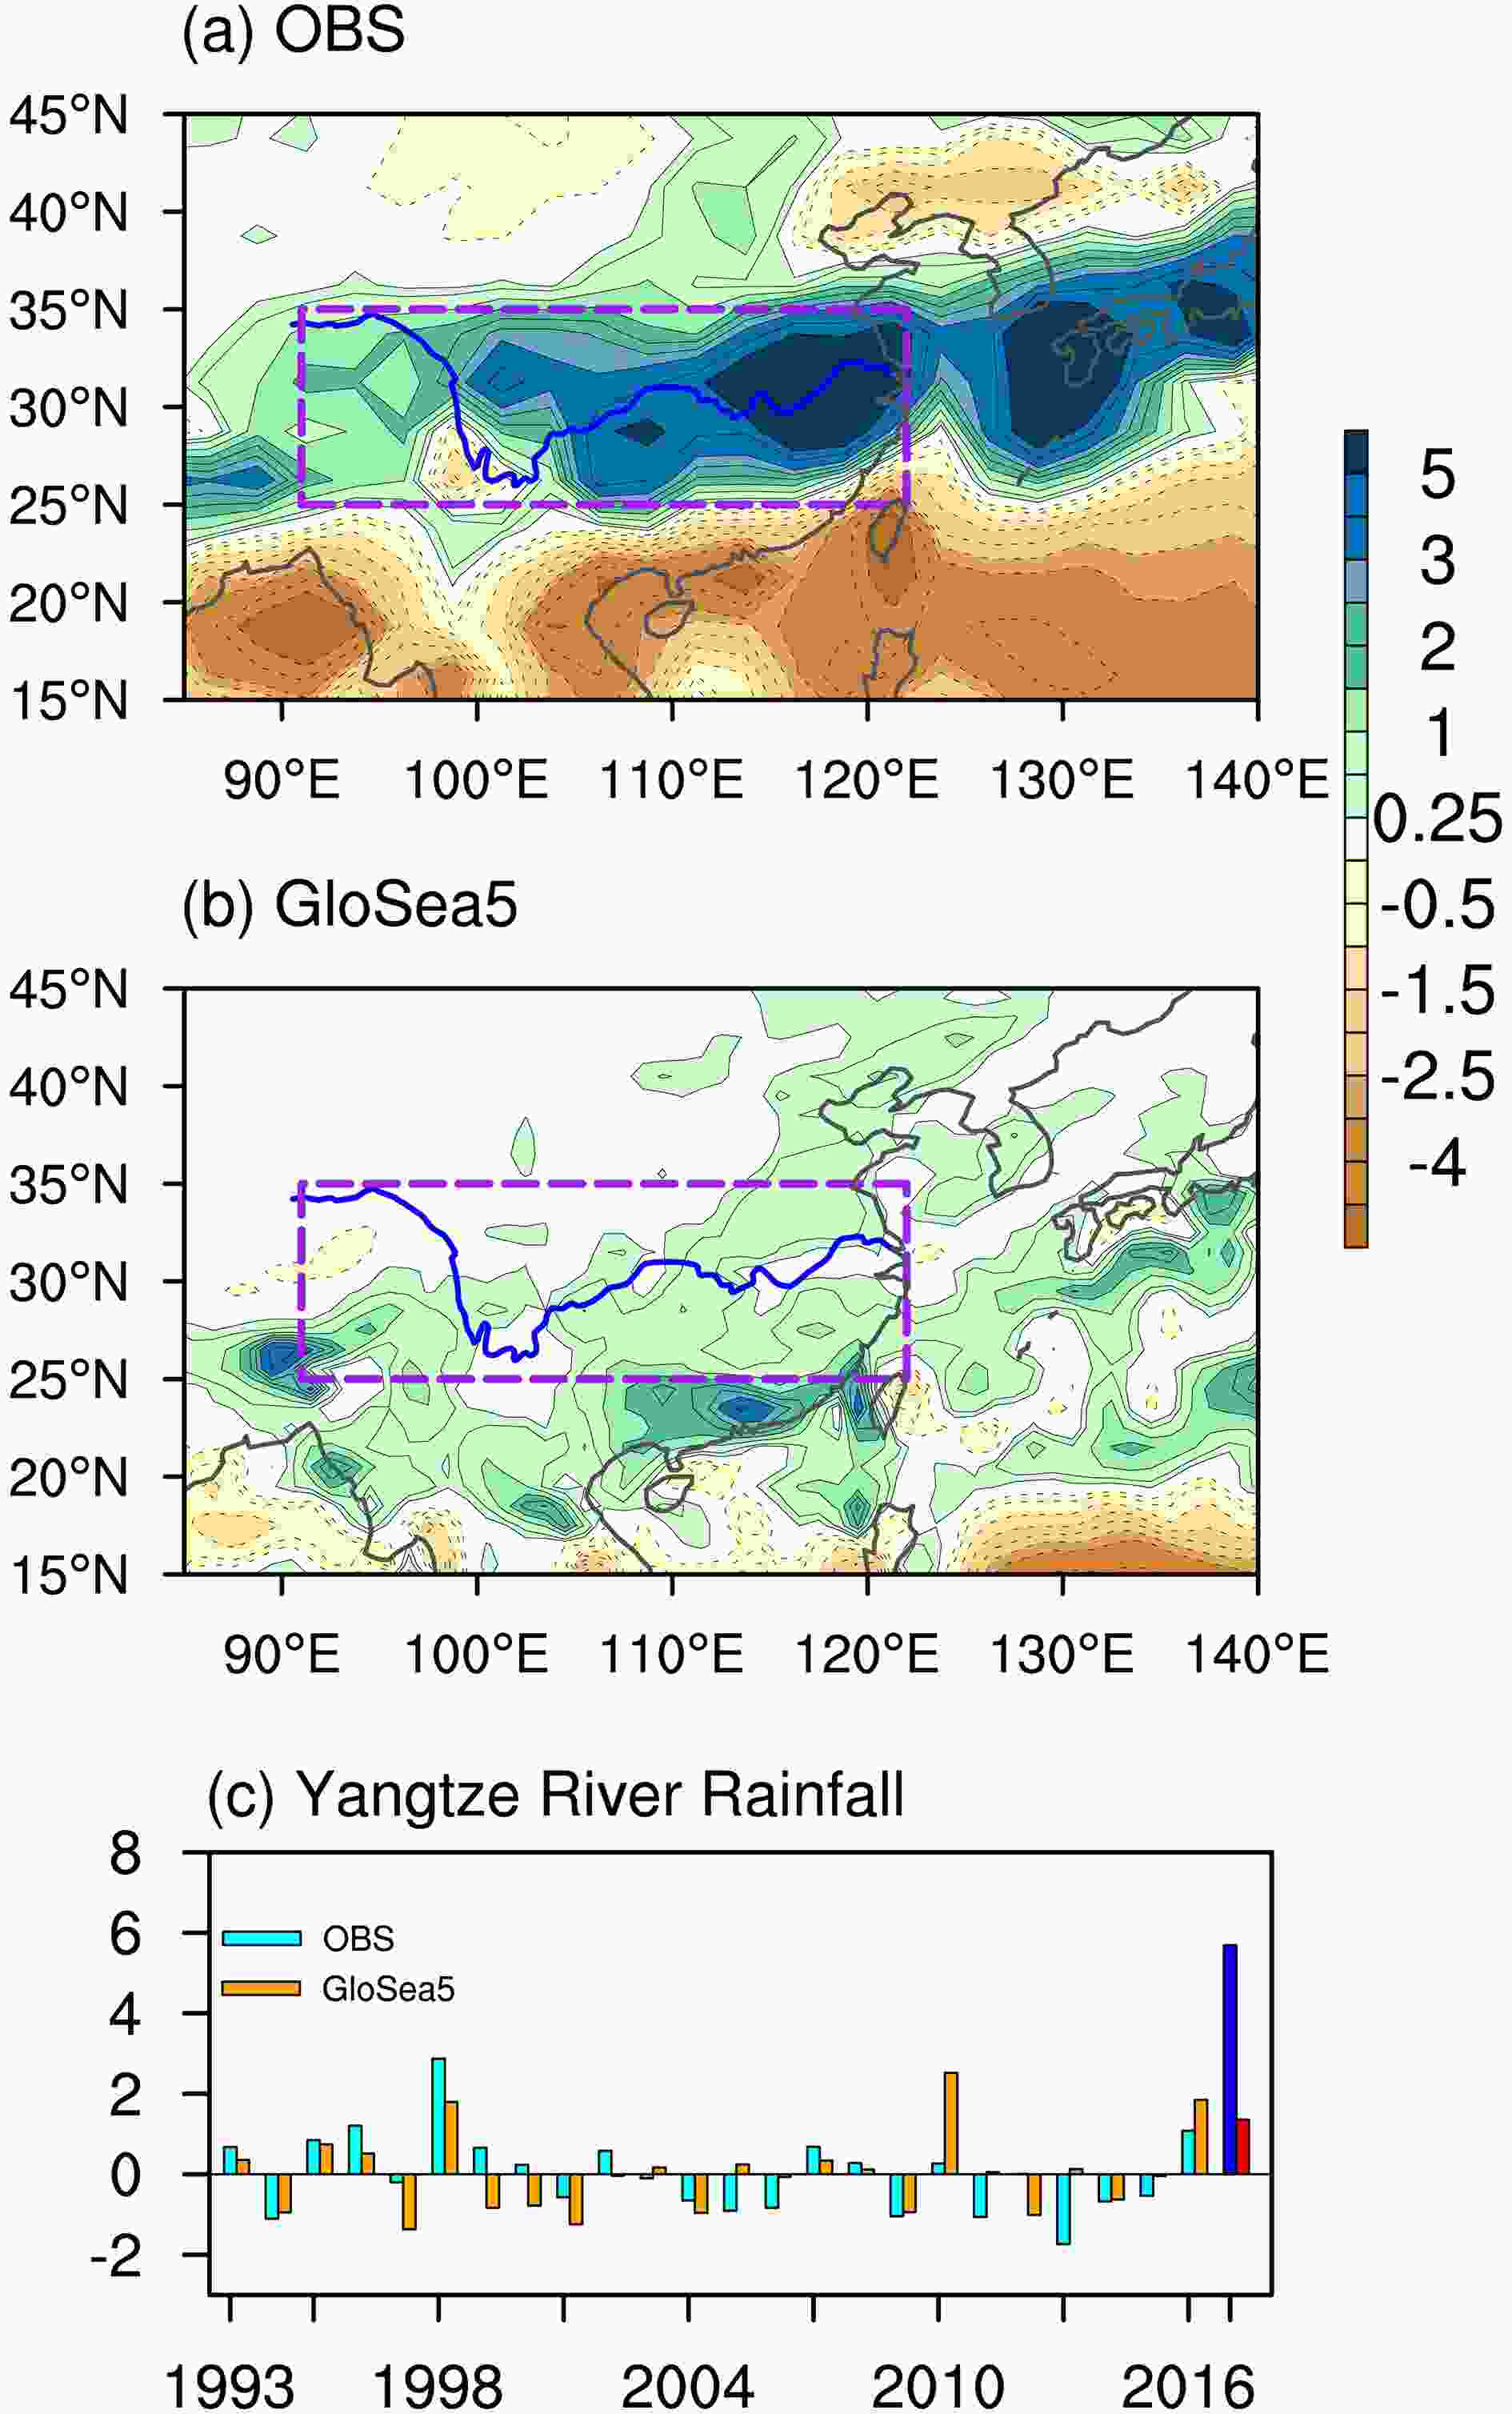 Figure1. Precipitation anomalies (units: mm d-1) in summer 2020 (June–July) for (a) observations, (b) forecast from GloSea5, and (c) the standardized year-by-year variation averaged over the Yangtze River basin. The Yangtze River is marked in blue and the domain of Yangtze River basin (25°–35°N, 91°–122°E) is indicated by the purple box. In (c), the observed (forecast) anomalies are represented by cyan (orange) bars for the hindcast years and blue (red) bars for 2020.
For the forecast from GloSea5, the rainfall is generally above normal over the Yangtze River basin (Fig. 1b). The averaged basin rainfall anomaly is about 1.4 standard deviations, referring to the ensemble mean hindcast from 1993 to 2016. It suggests that the forecasts successfully predicted the 2020 above-normal Yangtze summer rainfall, which was verified in Bett et al. (2021) with a consistent forecast at lead times of up to 3–4 months. The hindcast correlation skill for the early summer Yangtze rainfall is 0.54 in GloSea5 during 1993–2016 (Li et al., 2016). However, the ensemble mean forecast anomalies are generally lower than observations in summer 2020, with the main rainfall center southward around South China. The associated averaged Yangtze rainfall anomaly is also weaker than that in 1998, suggesting that there was an additional, unpredictable component in 2020 compared to 1998.
2
3.2. Forecast and causes of the anomalous WNPSH
Heavy mei-yu rainfall is often associated with warm moist air transported by the lower-tropospheric southwesterly wind along the westside of the WNPSH (Zhang et al., 1999; Lu and Dong, 2001; Zhou and Yu, 2005). In summer 2020, apparent anticyclonic wind anomalies appear over the WNP in the lower troposphere in observations (Fig. 2a), indicating a westward extension of the WNPSH with more water vapor transport to the Yangtze River basin. Here, we define the WNPSH index as the difference of averaged 850 hPa zonal wind anomalies between (5°–15°N, 100°–130°E) and (20°–30°N, 110°–140°E) (shown in Fig. 2a), following Wang and Fan (1999). The observed standardized WNPSH index in summer 2020 is 2.04 (standard deviations) below normal. The anomalous WNPSH gives a positive contribution to the extreme rainfall over the Yangtze River basin.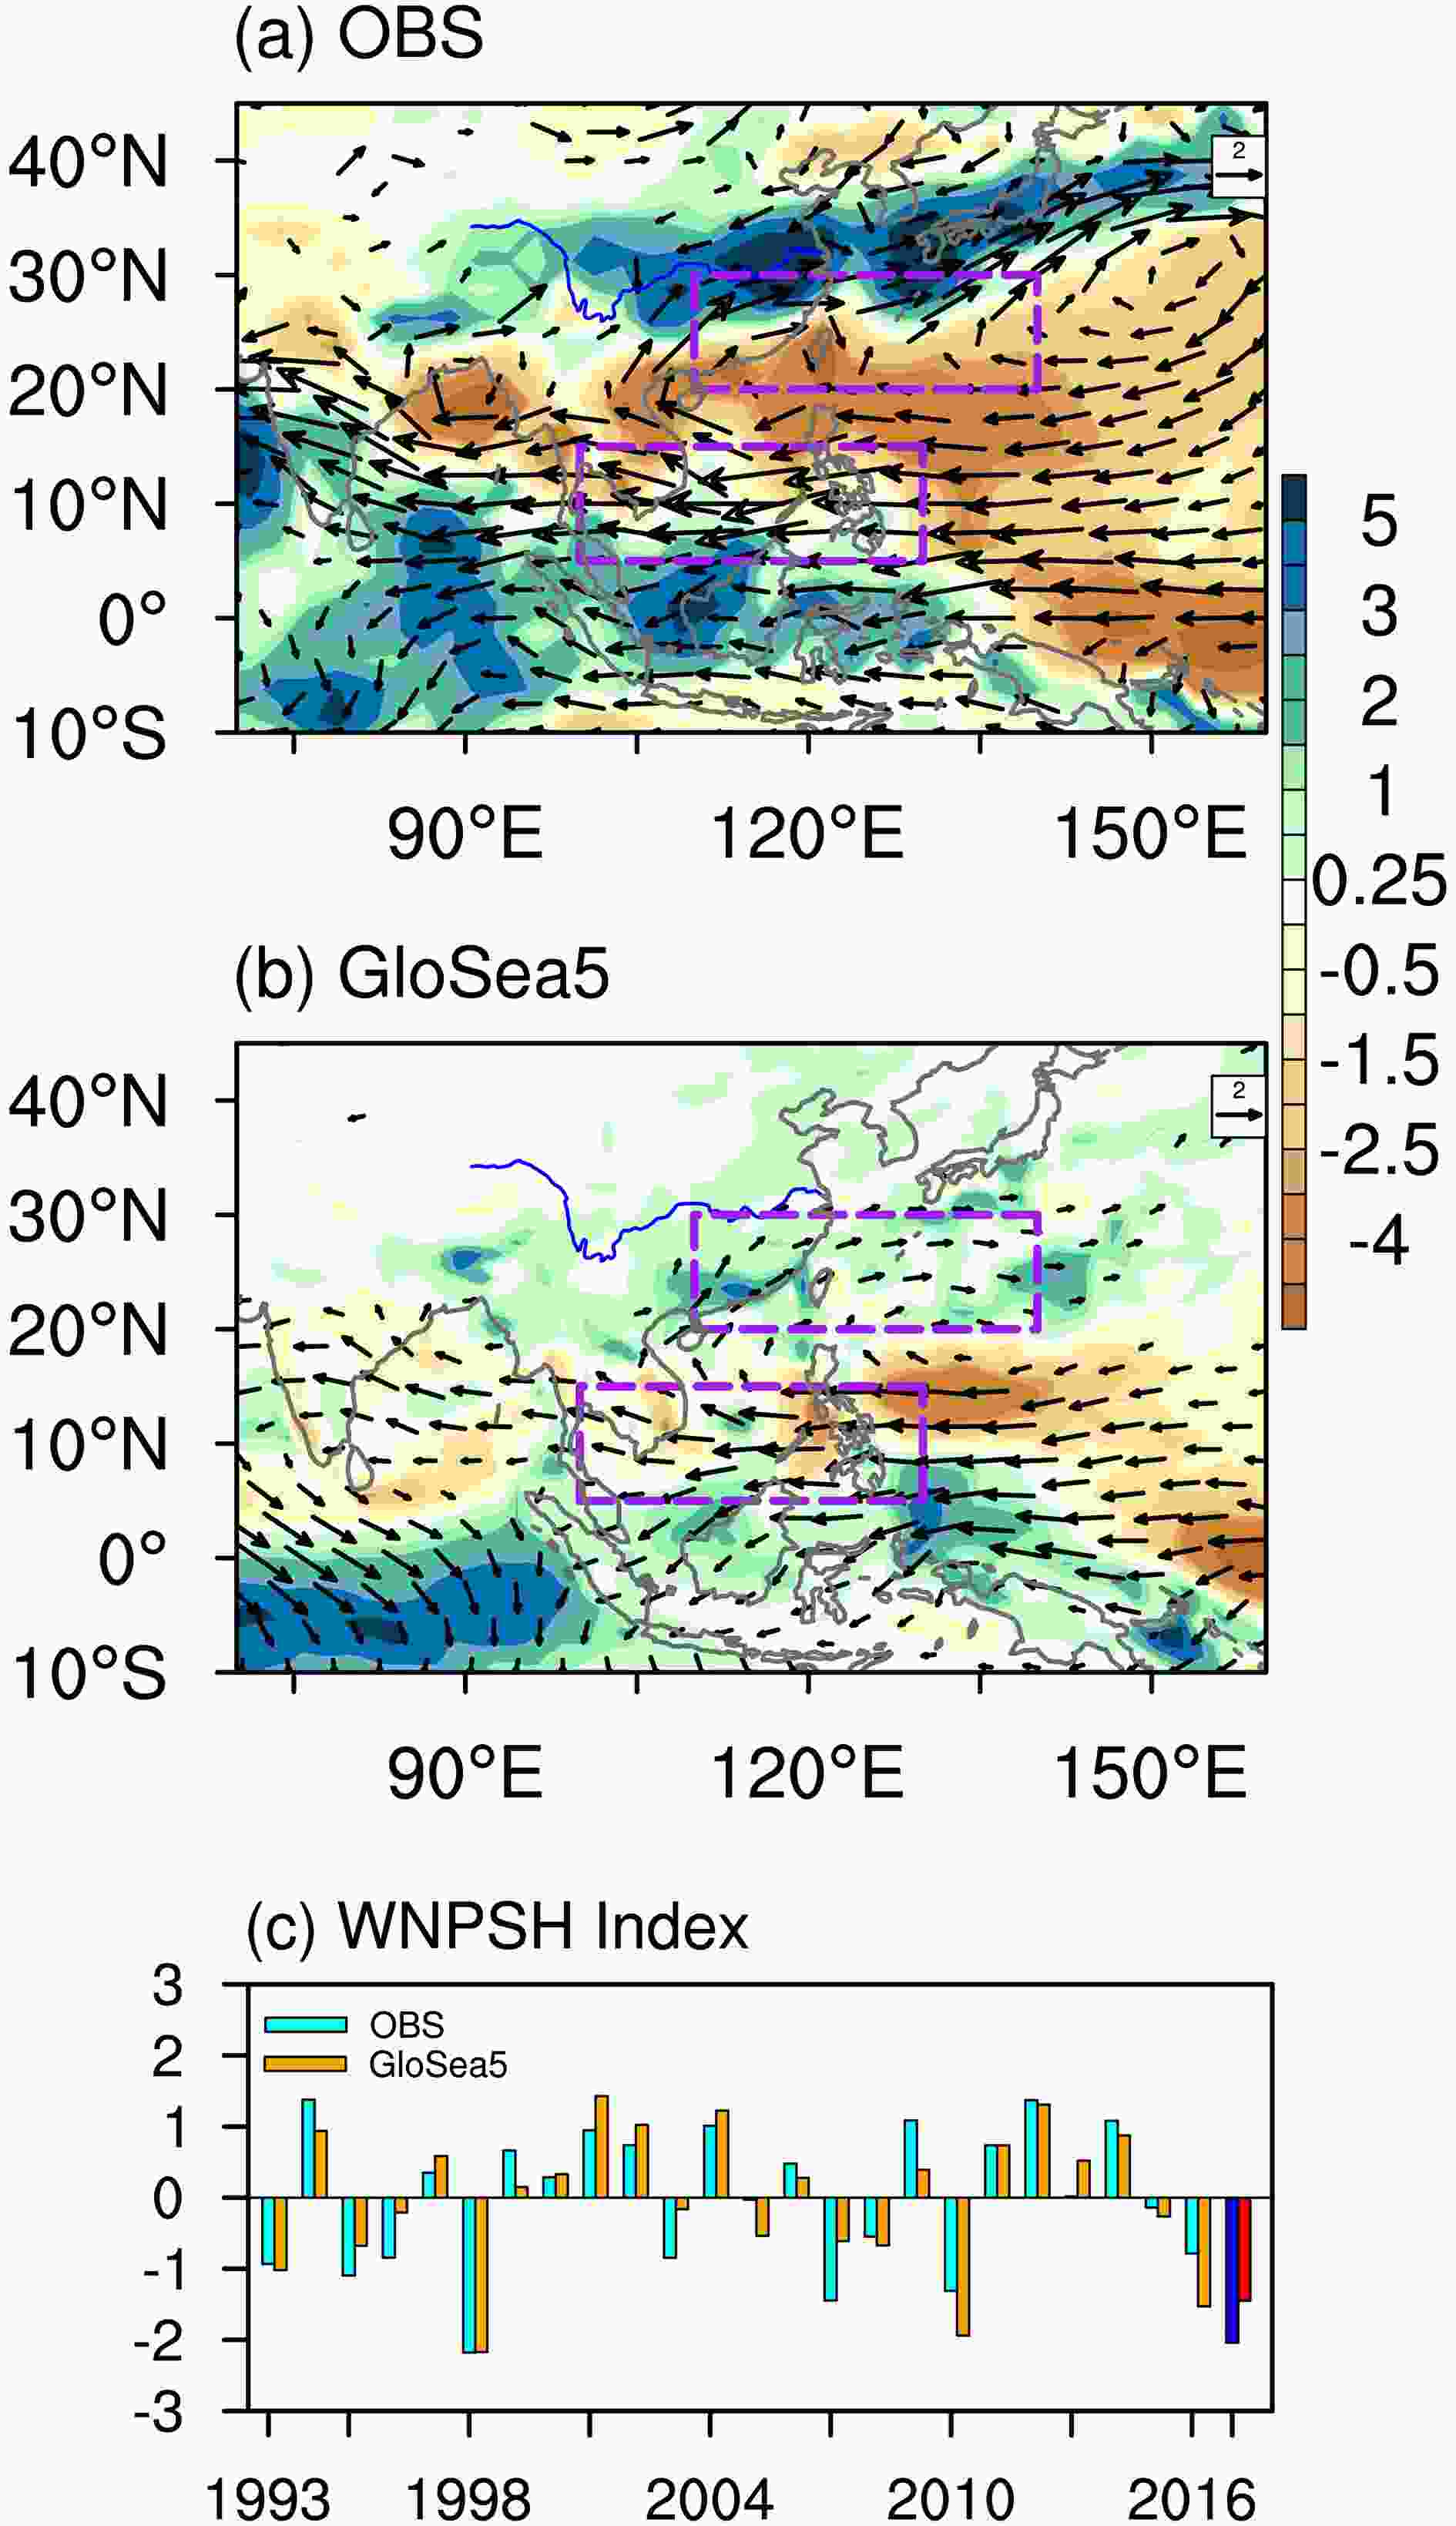 Figure2. As in Fig. 1, but for the 850 hPa wind (vector, units: m s?1) and precipitation (shading, units: mm d?1) anomalies for (a) the observations and (b) the forecast from GloSea5 and (c) the standardized year-by-year variation of the WNP subtropical high index. The purple boxes indicate the domains of the WNPSH index.
Current coupled models have demonstrated considerable capabilities in predicting the year-to-year change of the WNPSH in summer (Chowdary et al., 2011; Li et al., 2012, 2021; Kosaka et al., 2013; Camp et al., 2019). GloSea5 also shows a high correlation skill (0.90) of the WNPSH index during the hindcast years. In summer 2020, the model exhibits a successful forecast of the WNPSH, with a reasonable reproduction of the anomalous lower-tropospheric anticyclone over the WNP (Fig. 2b). The corresponding WNPSH index is ?1.45 (standard deviations) in the ensemble mean forecast (Fig. 2c), suggesting an important contribution to the correct forecast of the 2020 above-normal Yangtze rainfall from the WNPSH. Hence, the forecast intensity of the WNPSH is a little weaker than observations, especially for its subtropical component along 30°N. But this contrast is not so large as that for the exceptional Yangtze River rainfall (Fig. 1c), suggesting that other factors may also have been involved.
An anomalous westward extension of the WNPSH often appears following a strong El Ni?o during the previous winter (Wang et al., 2000; Xie et al., 2016). However, the climatic signature of the summer of 2020 did not follow this sequence of events, as no El Ni?o event occurred during the previous winter. Figure 3 shows the SST anomalies in summer 2020. Warm conditions were present over the Indian and the western Pacific Ocean, especially those around the South China Sea and Maritime Continent. Anomalously low SSTs are shown over the tropical eastern Pacific Ocean. The positive SST anomalies over the north Indian Ocean favor the maintenance of the WNP anomalous lower-tropospheric anticyclone, via an eastward propagating Kelvin wave (Xie et al., 2009, 2016). The local WNP SST anomalies are also coupled with the anomalous WNPSH, via local air-sea interactions (Wang and Zhang, 2002; Wu et al., 2009; Li et al., 2021). Recent studies have revealed that these coupled processes could exist without the impact of ENSO (Kosaka et al., 2013; Takaya et al., 2020; Li et al., 2021; Zhou et al., 2021). Takaya et al. (2020) and Zhou et al. (2021) pointed out that the strong positive Indian Ocean Dipole in the previous year contributed to the warm SSTs around the Indian Ocean in summer 2020, and Li et al. (2021) revealed that the local, east-west SST contrast over the tropical WNP played an active role in modulating the variation of the WNPSH in the absence of strong ENSO forcing.
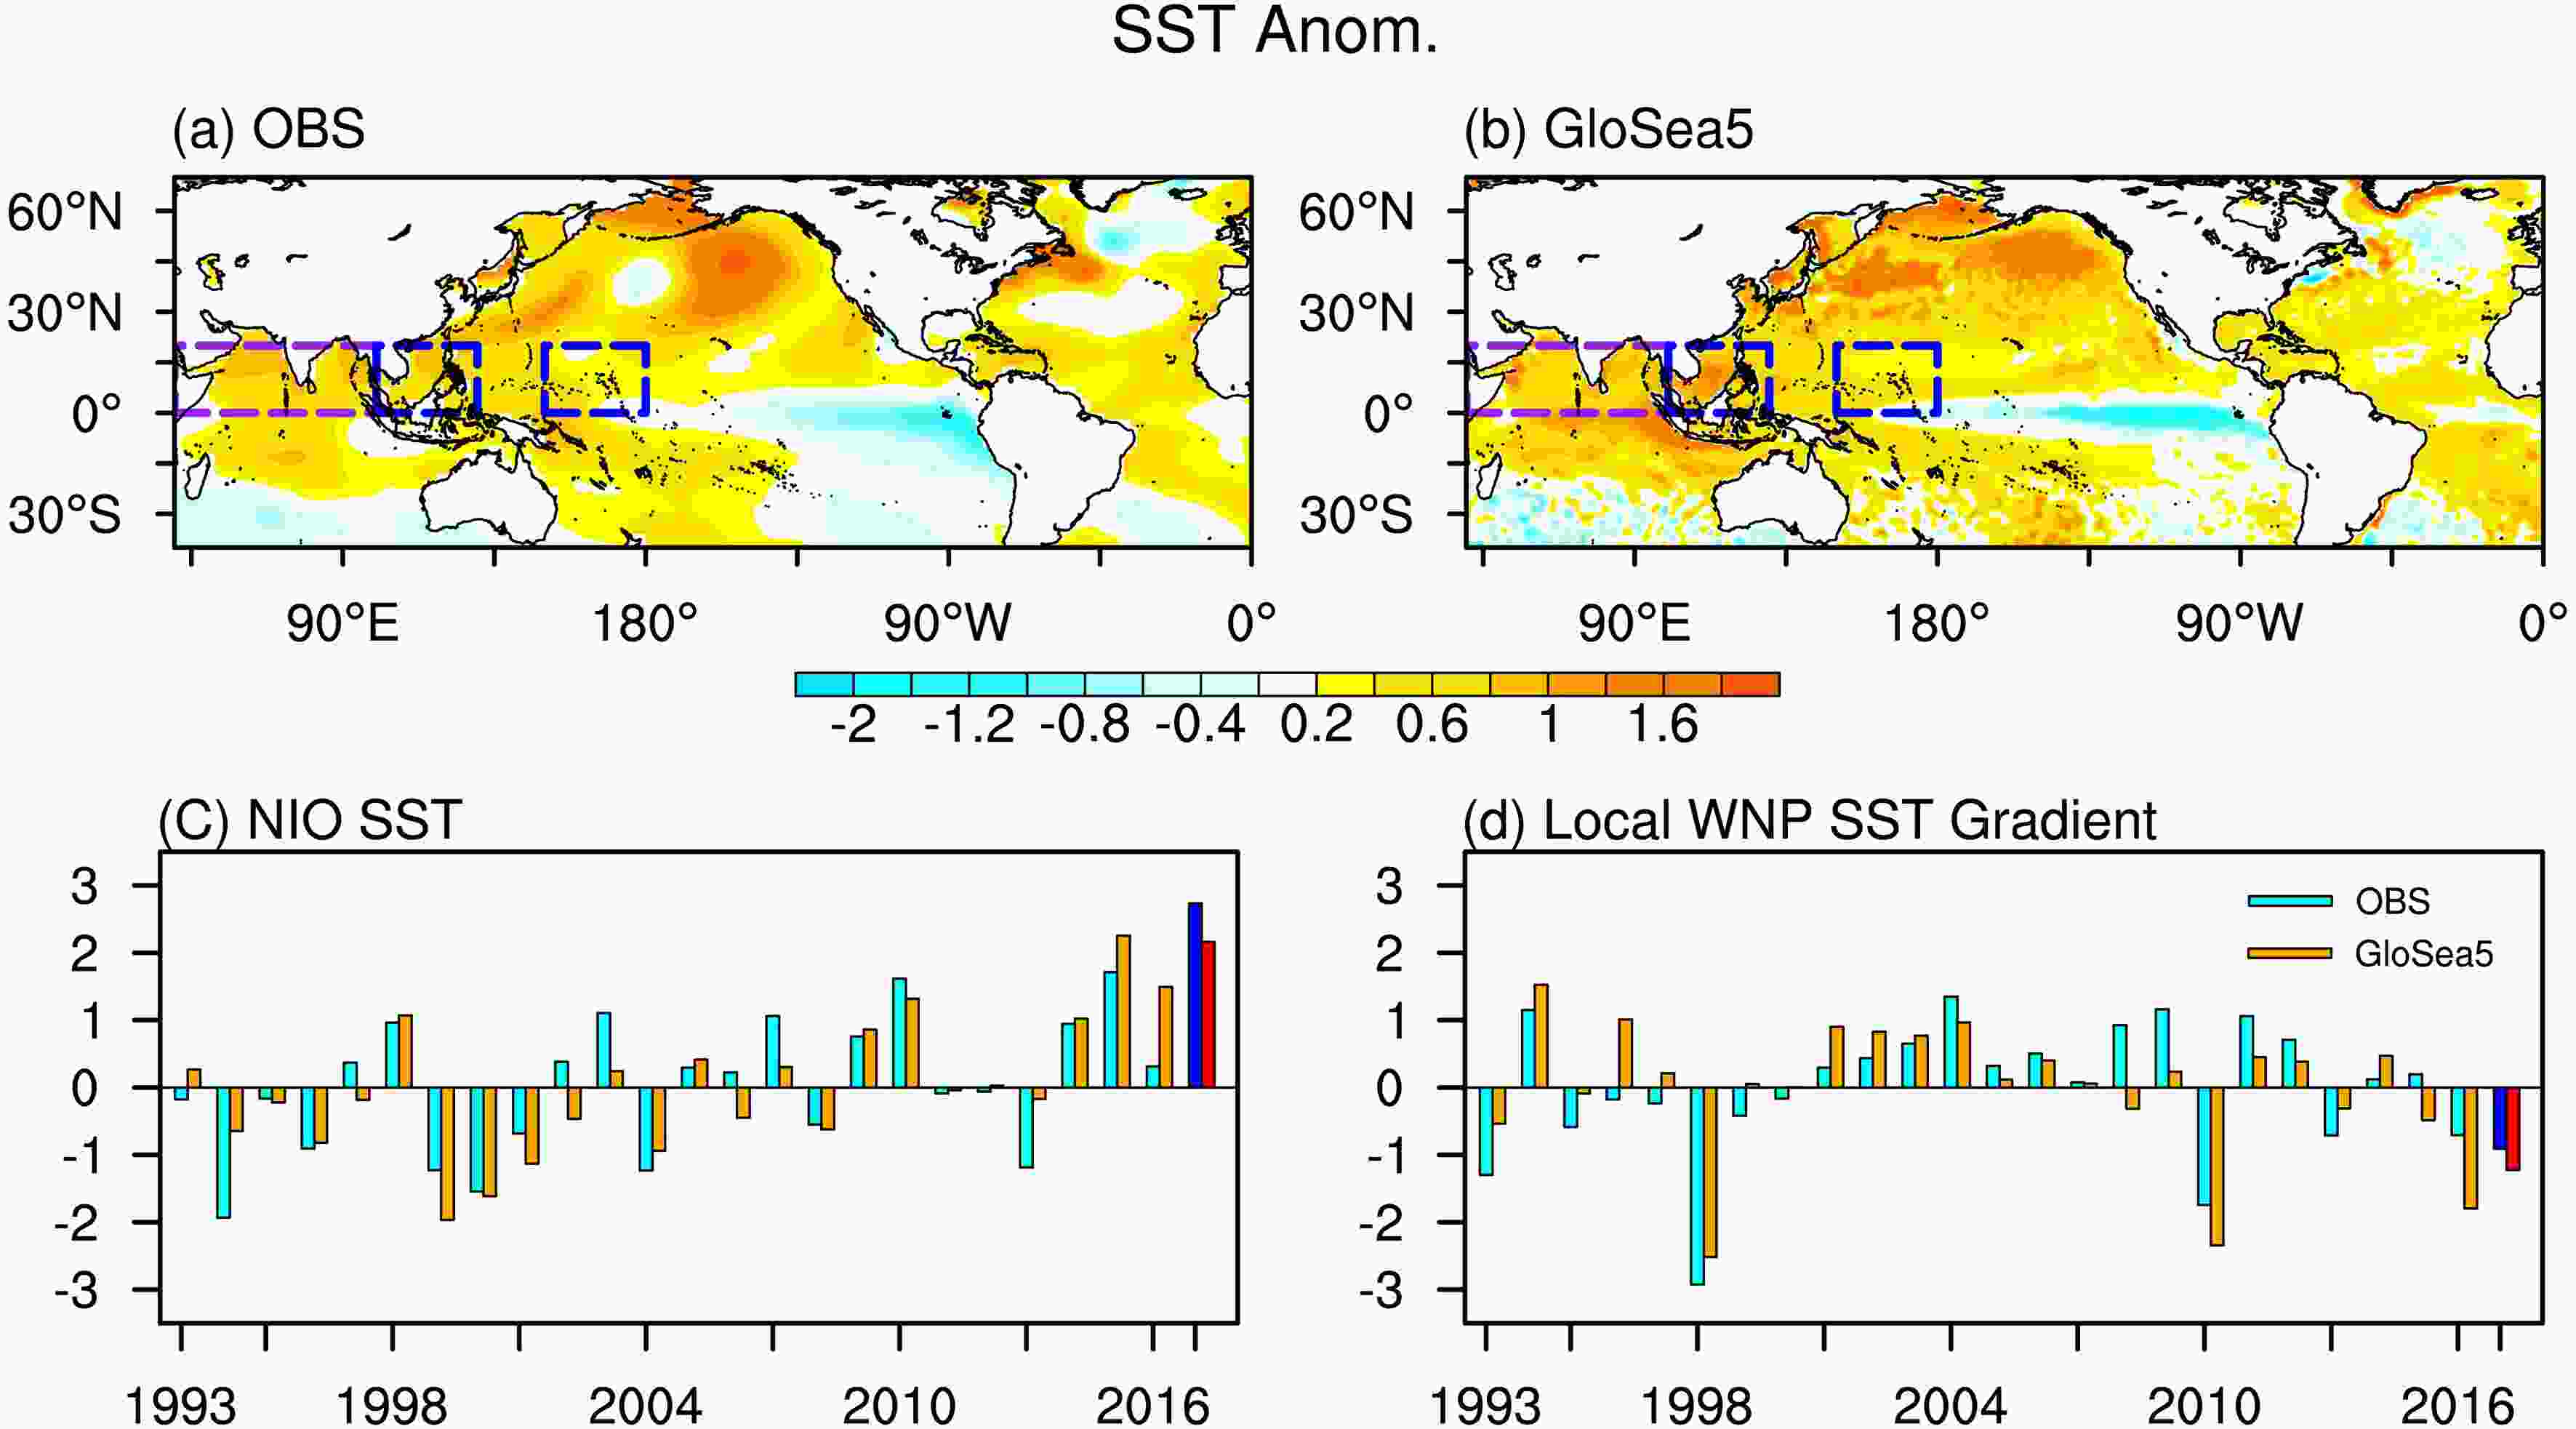 Figure3. SST anomalies (units: oC) in summer 2020 (June–July) for (a) observations and (b) forecast from GloSea5. Year-to-year variation for the (c) SST anomalies averaged over the north Indian Ocean (0°–20°N, 40°–100°E) and (d) local SST gradient over the WNP region (SST difference between (0°–20°N, 150°–180°E) and (0°–20°N, 100°–130°E)). The purple and blue boxes in (a) and (b) indicate the domains of the north Indian Ocean and local SST gradient over the WNP, respectively. The anomalies in (c) and (d) are standardized to the hindcast period of 1993–2016 and the observed (forecast) anomalies are represented by cyan (orange) bars for the hindcast years and blue (red) bars for 2020.
The model provided a good forecast for the SST anomalies in summer 2020 (Fig. 3b). We use the SST anomalies averaged over (0°–20°N, 40°–100°E) and SST difference between (0°–20°N, 150°–180°E) and (0°–20°N, 100°–130°E) to describe the warm Indian Ocean SST and local WNP SST gradient, respectively. GloSea5 shows a high prediction correlation skill for these two anomalous SST regions during the hindcast years (0.82 for the north Indian Ocean and 0.81 for the local WNP SST). Their relationship with the WNPSH is also well reproduced by the model hindcasts. The correlation coefficients between the north Indian ocean SST (local WNP SST gradient) and the WNPSH index during 1993–2016 are ?0.42 (0.70) in observations and ?0.42 (0.72) in the model outputs, exceeding the 95% confidence level according to the Student t-test. In summer 2020, the model ensemble mean skillfully forecasted the intensity of these SST indices (Figs. 3c, d).
Figure 4 shows the correspondence between the WNPSH and the tropical SST anomalies among all ensemble members for the summer of 2020. Close relationships are also found in association with the anomalous WNPSH among the members, both for the north Indian Ocean SST and local WNP SST gradient. The correlation coefficients are ?0.56 and 0.75 among the 42 members for the north Indian Ocean SST and local WNP SST gradient, respectively. These clear and significant relationships suggest that both regions contributed to the westward extension of the WNPSH in summer 2020. The observed anomalies are also within the spread of the ensemble members, suggesting a reasonable forecast of the WNPSH and tropical SSTs by the model. In addition, we also diagnosed the La Ni?a-like SST anomalies over the tropical eastern Pacific in summer 2020 (Fig. 3a) but found only a weak correlation with the WNPSH among all ensemble members (not shown). The correlation coefficient between the Ni?o-3.4 SST and WNPSH index among all members is ?0.29, implying a weak role in the anomalous WNPSH consistent with Hardiman et al. (2018) who also note a weak relationship between summer rainfall and the contemporaneous ENSO state.
 Figure4. Scatter diagrams of the summer 2020 anomalies (units: m s?1) for the WNPSH index with the (a) SST anomalies averaged over the north Indian Ocean (NIO) and (b) local SST gradient over the WNP region (units: oC). The black, red, and grey markers indicate observations, the GloSea5 forecast, and 42 ensemble members, respectively. The values on the top of the diagram indicate the correlation coefficient (r) of the indices among the 42 members.
We now further investigate the contributions from the local WNP SST variation to this exceptional summer, especially the warmer SST anomalies around the South China Sea and Maritime Continent. Compared with the north Indian Ocean SST, the local WNP SST gradient shows larger correlation coefficients with the change of WNPSH, for both all the hindcast years and ensemble members in 2020. The north Indian Ocean SST, which has exhibited an apparent warming trend, was observed to be the warmest in 2020 since 1993 (Fig. 3c). But, in some years like 1993 (a neutral summer without strong ENSO forcing), the WNPSH index and local SST WNP gradient were about one standard deviation below normal (Figs. 2c and 3d), while the SST anomalies around the north Indian Ocean were quite weak (Fig. 3c). The warmer SST around the western WNP could favor the maintenance of anticyclonic anomalies in the lower troposphere via modulating the in situ convection and local Walker circulation, acting as one of the primary predictable sources to the anomalous WNPSH (Wang et al., 2005; Li et al., 2021).
2
3.3. Forecast limitations of the unpredictable East Asian westerly jet
In contrast to the good forecast of the WNPSH, the ensemble forecast for the Yangtze River is much weaker than the observed rainfall anomaly (Fig. 1). We further diagnose the correspondence between the WNPSH and Yangtze River rainfall among the ensemble members in summer 2020 (Fig. 5). The forecast of the Yangtze River rainfall from the members shows substantial spread, albeit with most of the anomalies above normal. However, the anomalies of all members are considerably weaker than observations, suggesting that even the probabilistic forecast from GloSea5 likely underestimates the observed rainfall. In contrast, the WNPSH indices in the majority of the members are negative and the observed WNPSH is within the spread of forecast members (albeit on the edge of the distribution), consistent with the good WNPSH forecast described above. The correlation coefficient between the WNPSH and Yangtze River rainfall is only ?0.18 among the members. This weak correlation across the ensemble members suggests lower predictability of the Yangtze River summer rainfall compared to the WNPSH as evidenced by the individual model members, as described in previous studies (Kosaka et al., 2012; Li et al., 2012, 2016). It also suggests that the WNPSH does not entirely explain the prediction spread of the Yangtze River rainfall, nor its exceptional feature in 2020. Figure5. As in Fig. 4, but for the scatter diagrams of the Yangtze River basin rainfall (units: mm d?1) and the WNPSH index (m s?1). The eight best (worst) members are marked in green (brown).
To explore the forecast spread, we choose the eight best (worst) forecast members, which are among the closest (farthest) eight members to the observed Yangtze River basin rainfall. Figure 6 shows the composite of the precipitation, 850 hPa wind, and SST anomalies for these good and bad members. By design, the precipitation anomalies exhibit large contrast around the Yangtze River basin, which are positive (negative) for the good (bad) members. The intensity of the positive rainfall anomaly for the good members is still weaker than the observations (Fig. 1a). In contrast, the spatial distributions of the 850 hPa wind and SST anomalies are well-represented over the tropical Oceans and subtropical WNP. They both show an anomalous WNP lower-tropospheric anticyclone, but with a sharp contrast between the lower-tropospheric wind north of the Yangtze River basin. The good members correspond with anomalous northerly winds, but the bad members show anomalous southerly winds in North China (Figs. 6c and 6d). It implies that an anomalous WNP lower-tropospheric anticyclone does not always lead to more Yangtze River rainfall in the mei-yu season, and contributions from the lower-tropospheric northerly winds from mid-latitudes may also be important.
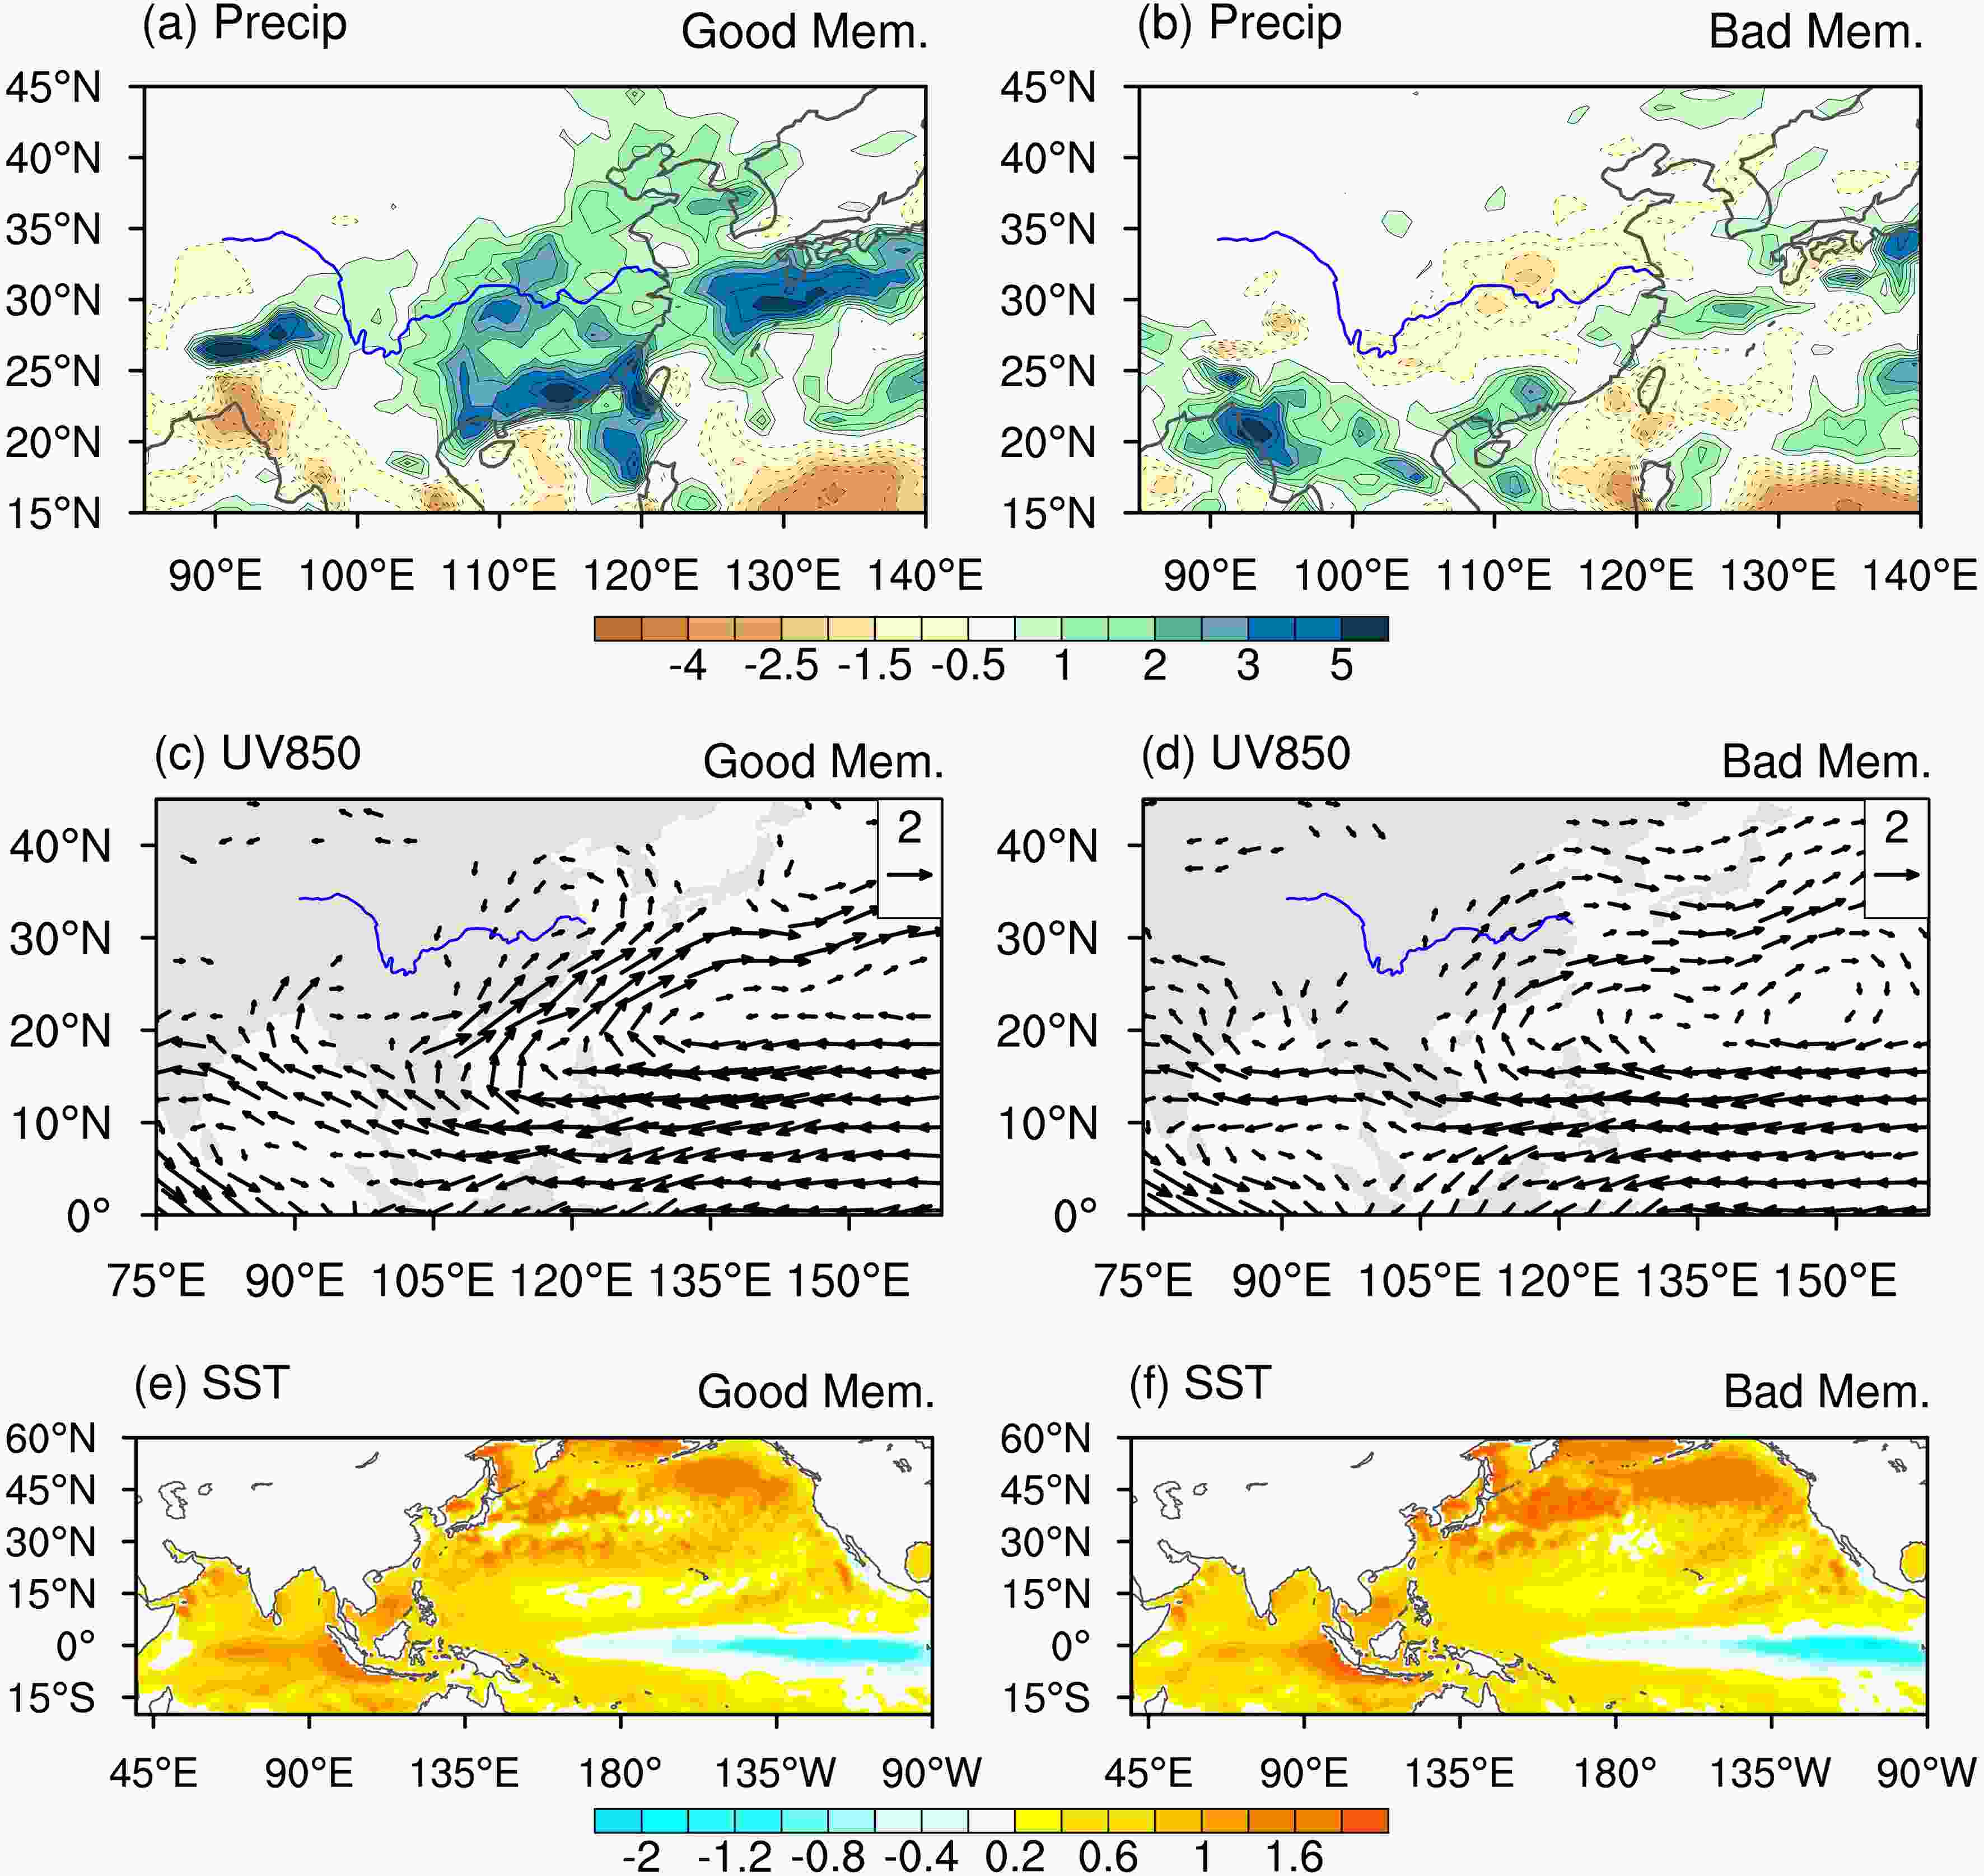 Figure6. Composite of the (a, b) precipitation (units: mm d?1), (c, d) 850 hPa wind (units: m s?1) and (e, f) SST anomalies (units: oC) in summer 2020 for the (left) good and (right) bad forecast members. The good (bad) members are the eight best (worst) members compared with the observed Yangtze River basin rainfall, as shown in Fig. 5.
Figure 7 shows the 200 hPa wind anomalies in summer 2020. In the observations, the most evident feature is a significant acceleration of the mid-latitude westerly jet across Eurasia, especially around Mongolia and north China. The wind anomalies along the EAJ axis exceed 6 m s-1, exiting near the anomalously strong anticyclone and divergence around East Asia in the upper troposphere. In comparison, the model ensemble mean fails to reproduce the intensity change of the westerly jet. As variability in the summer mid-latitude circulation is largely dominated by atmospheric internal variability (Lu et al., 2006), the anomalies of the ensemble mean are quite weak around the whole of Eurasia, just displaying a weak northward shift of the EAJ. Spread among the ensemble members, on the other hand, presents significant meridional displacement of the westerly jet. Forecasts from good members show a southward shift of the westerly jet in agreement with that observed, and the bad members present the opposite northward shift in the distribution, confirming the role of the EAJ in the Yangtze River rainfall.
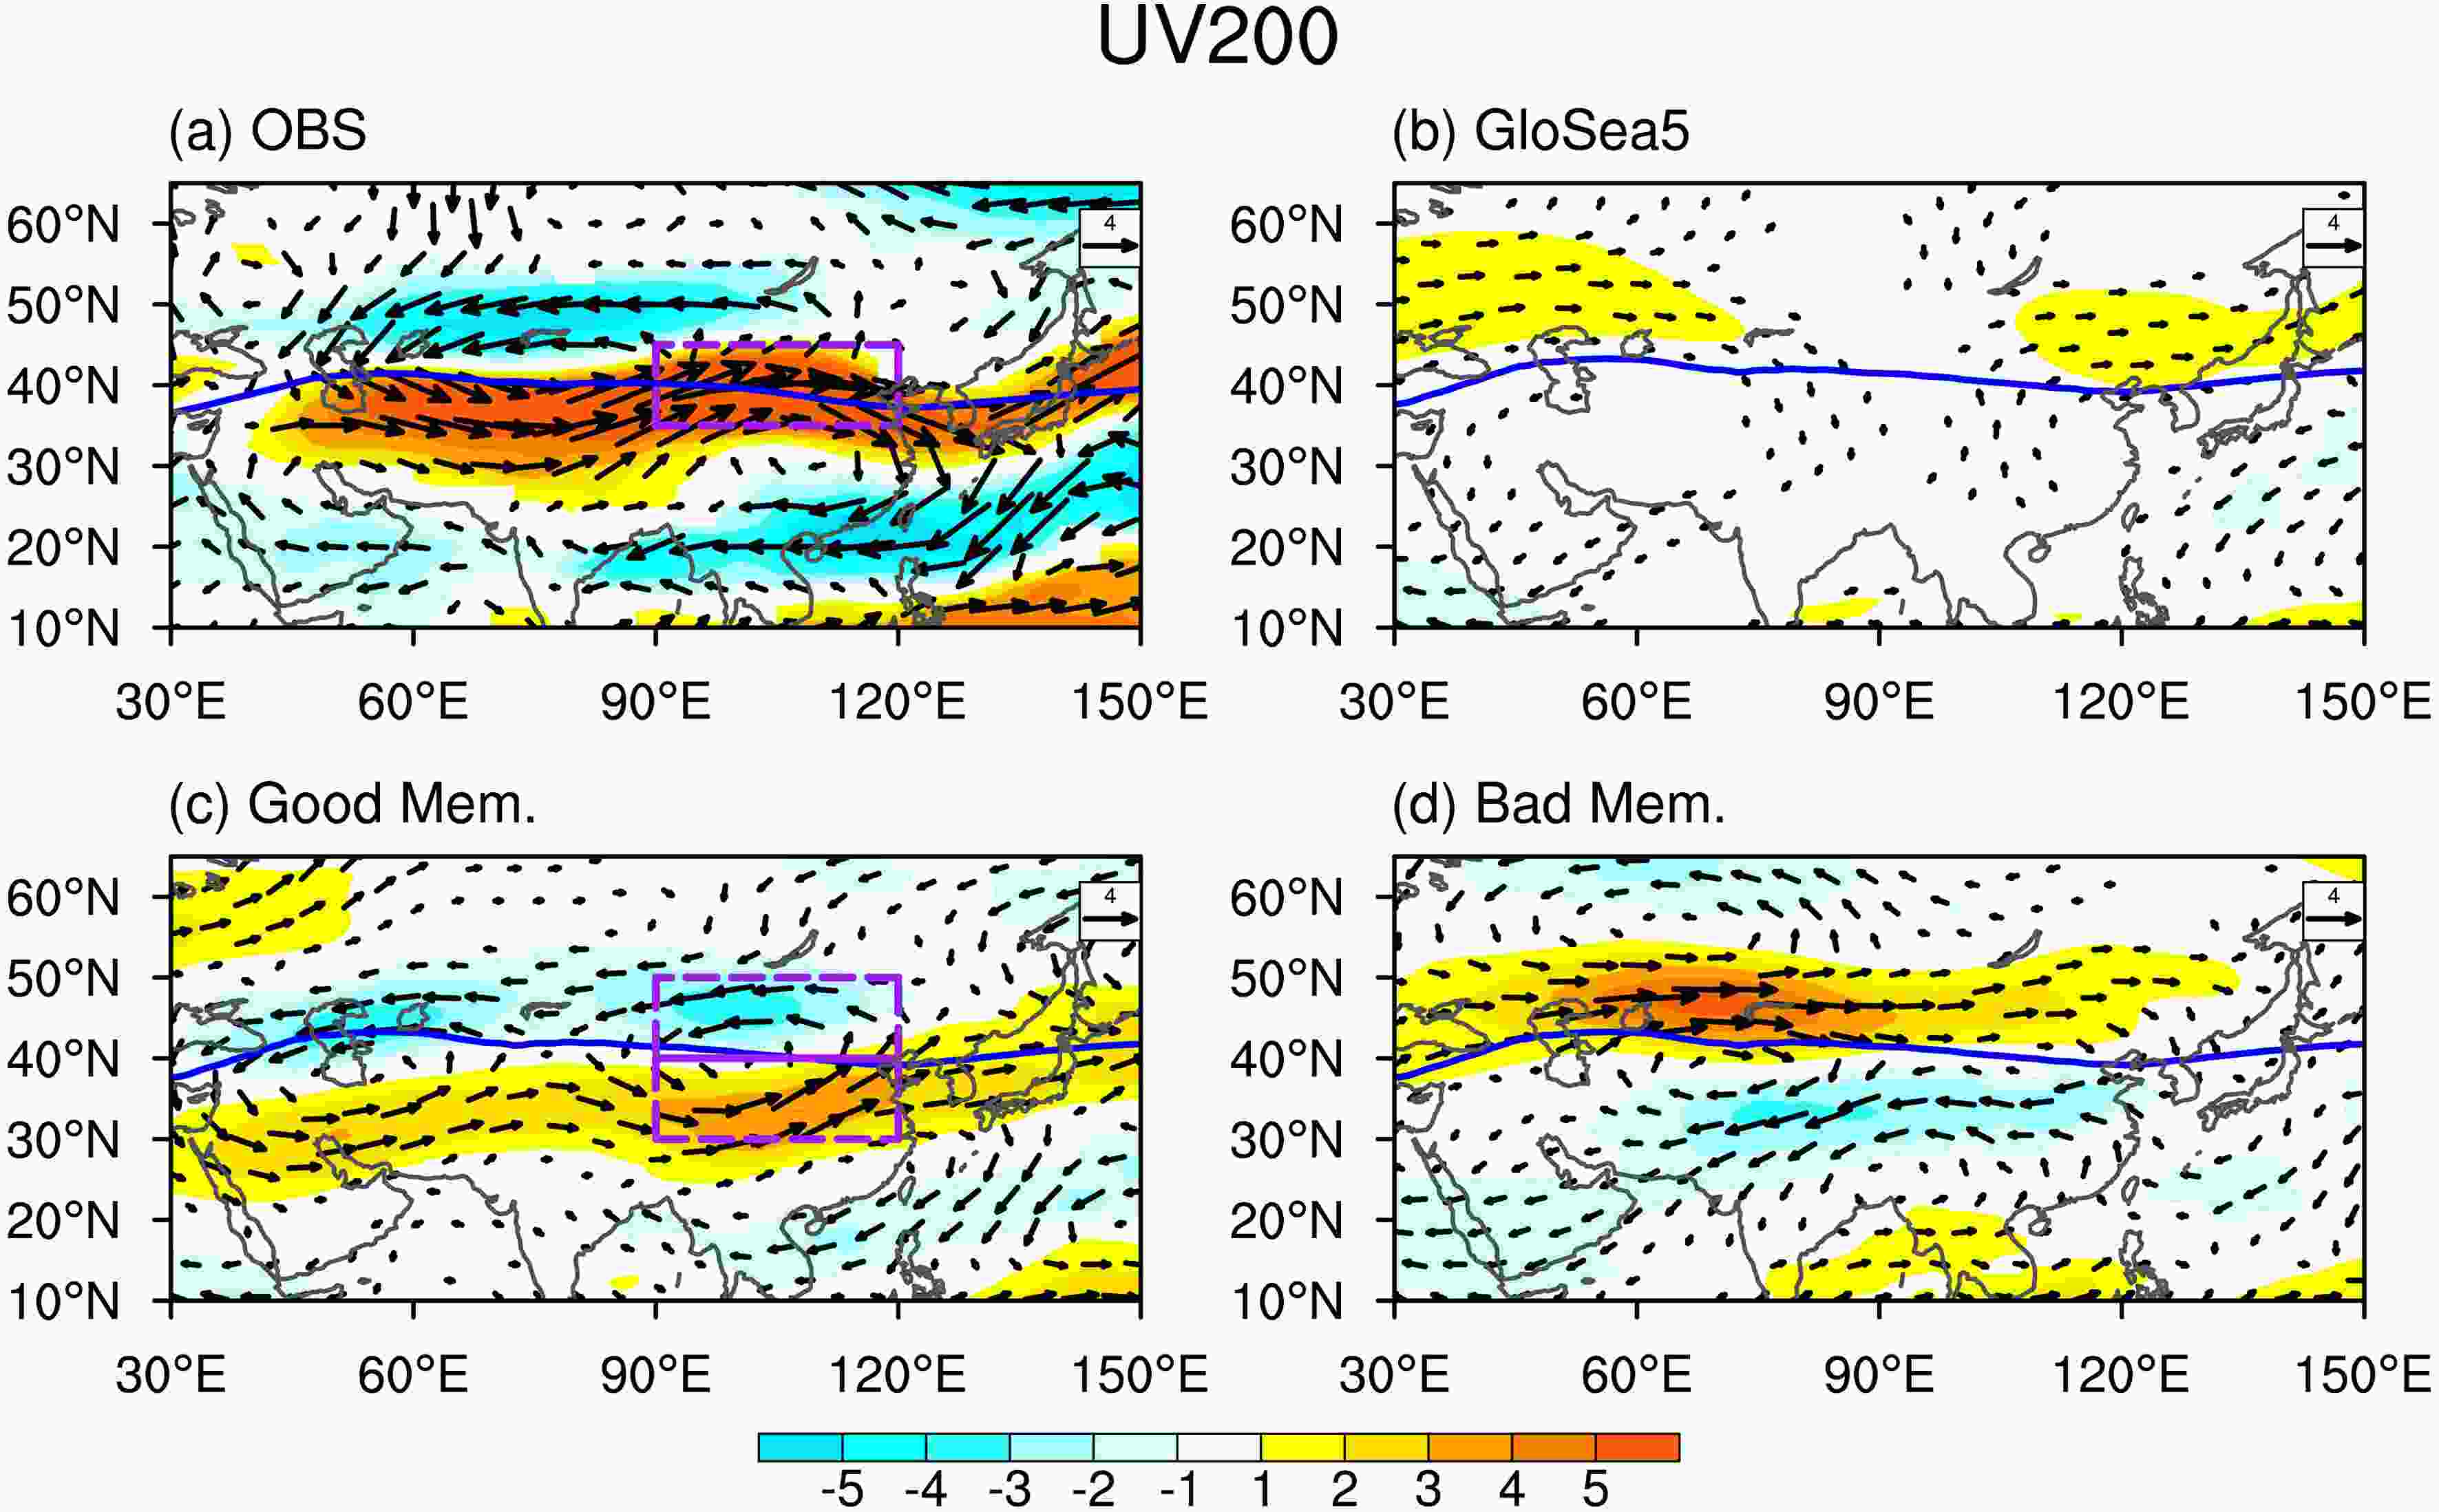 Figure7. The 200 hPa horizontal wind (vector, units: m s?1) and zonal wind (shading, units: m s?1) anomalies in summer 2020 for (a) the observations, (b) the forecast from GloSea5, and the composite of the (c) good and (d) bad members. The blue line indicates the climatological jet axis. The purple boxes in (a) and (c) indicate the domains of the jet intensity index and meridional displacement index (JMDI), respectively.
On the interannual time scale, intensity changes and meridional displacement of the EAJ dominate the mid-latitude circulation variations in the upper troposphere (Lin and Lu, 2005). We also performed an experience orthogonal function analysis on the 200 hPa zonal wind from 1993 to 2019 over the mid-latitudes of East Asia (25°–55°N, 90°–120°E) (not shown) and found that the first leading mode characterized as an intensity change of the EAJ, while the second mode is the meridional displacement. Variations of the westerly jet are often associated with mid-latitude wave activity, temperature advection, and adiabatic ascending motion, all of which could influence the lower troposphere with thermal and mechanical climate feedbacks (Chen et al., 2020). To further check the impacts from the anomalous EAJ, we defined two indices, the EAJ intensity index and the meridional displacement index (JMDI), following the method in Lin and Lu (2005). The EAJ intensity index is calculated as the averaged 200 hPa zonal wind anomalies over (35°–45°N, 90°–120°E), and the JMDI is defined as the wind differences between the southern (30°–40°N, 90°–120°E) and northern side (40°–50°N, 90°–120°E) of the jet axis (purple boxes in Figs. 7a and 7c).
Figure 8 shows the correspondence between the EAJ and the Yangtze River rainfall among all ensemble members in summer 2020. Consistent with the exceptional observed Yangtze River rainfall, the observed enhancement of the EAJ intensity is larger than those of all ensemble members. The ensemble members show only a weak non-significant correlation between the EAJ intensity and Yangtze River rainfall index. The JMDI, on the other hand, demonstrates a good relationship with the Yangtze River rainfall. The correlation coefficient among the 42 members is 0.59, supporting the premise that the model spread mainly represents the significant meridional displacement of the EAJ, as shown in Figs. 7c and 7d. Unlike Yangtze River rainfall, the observed anomaly of the JMDI is within the model ensemble member spread, implying that the meridional displacement of the EAJ is unlikely to act as one of the main causes for the observed excessive Yangtze rainfall in summer 2020.
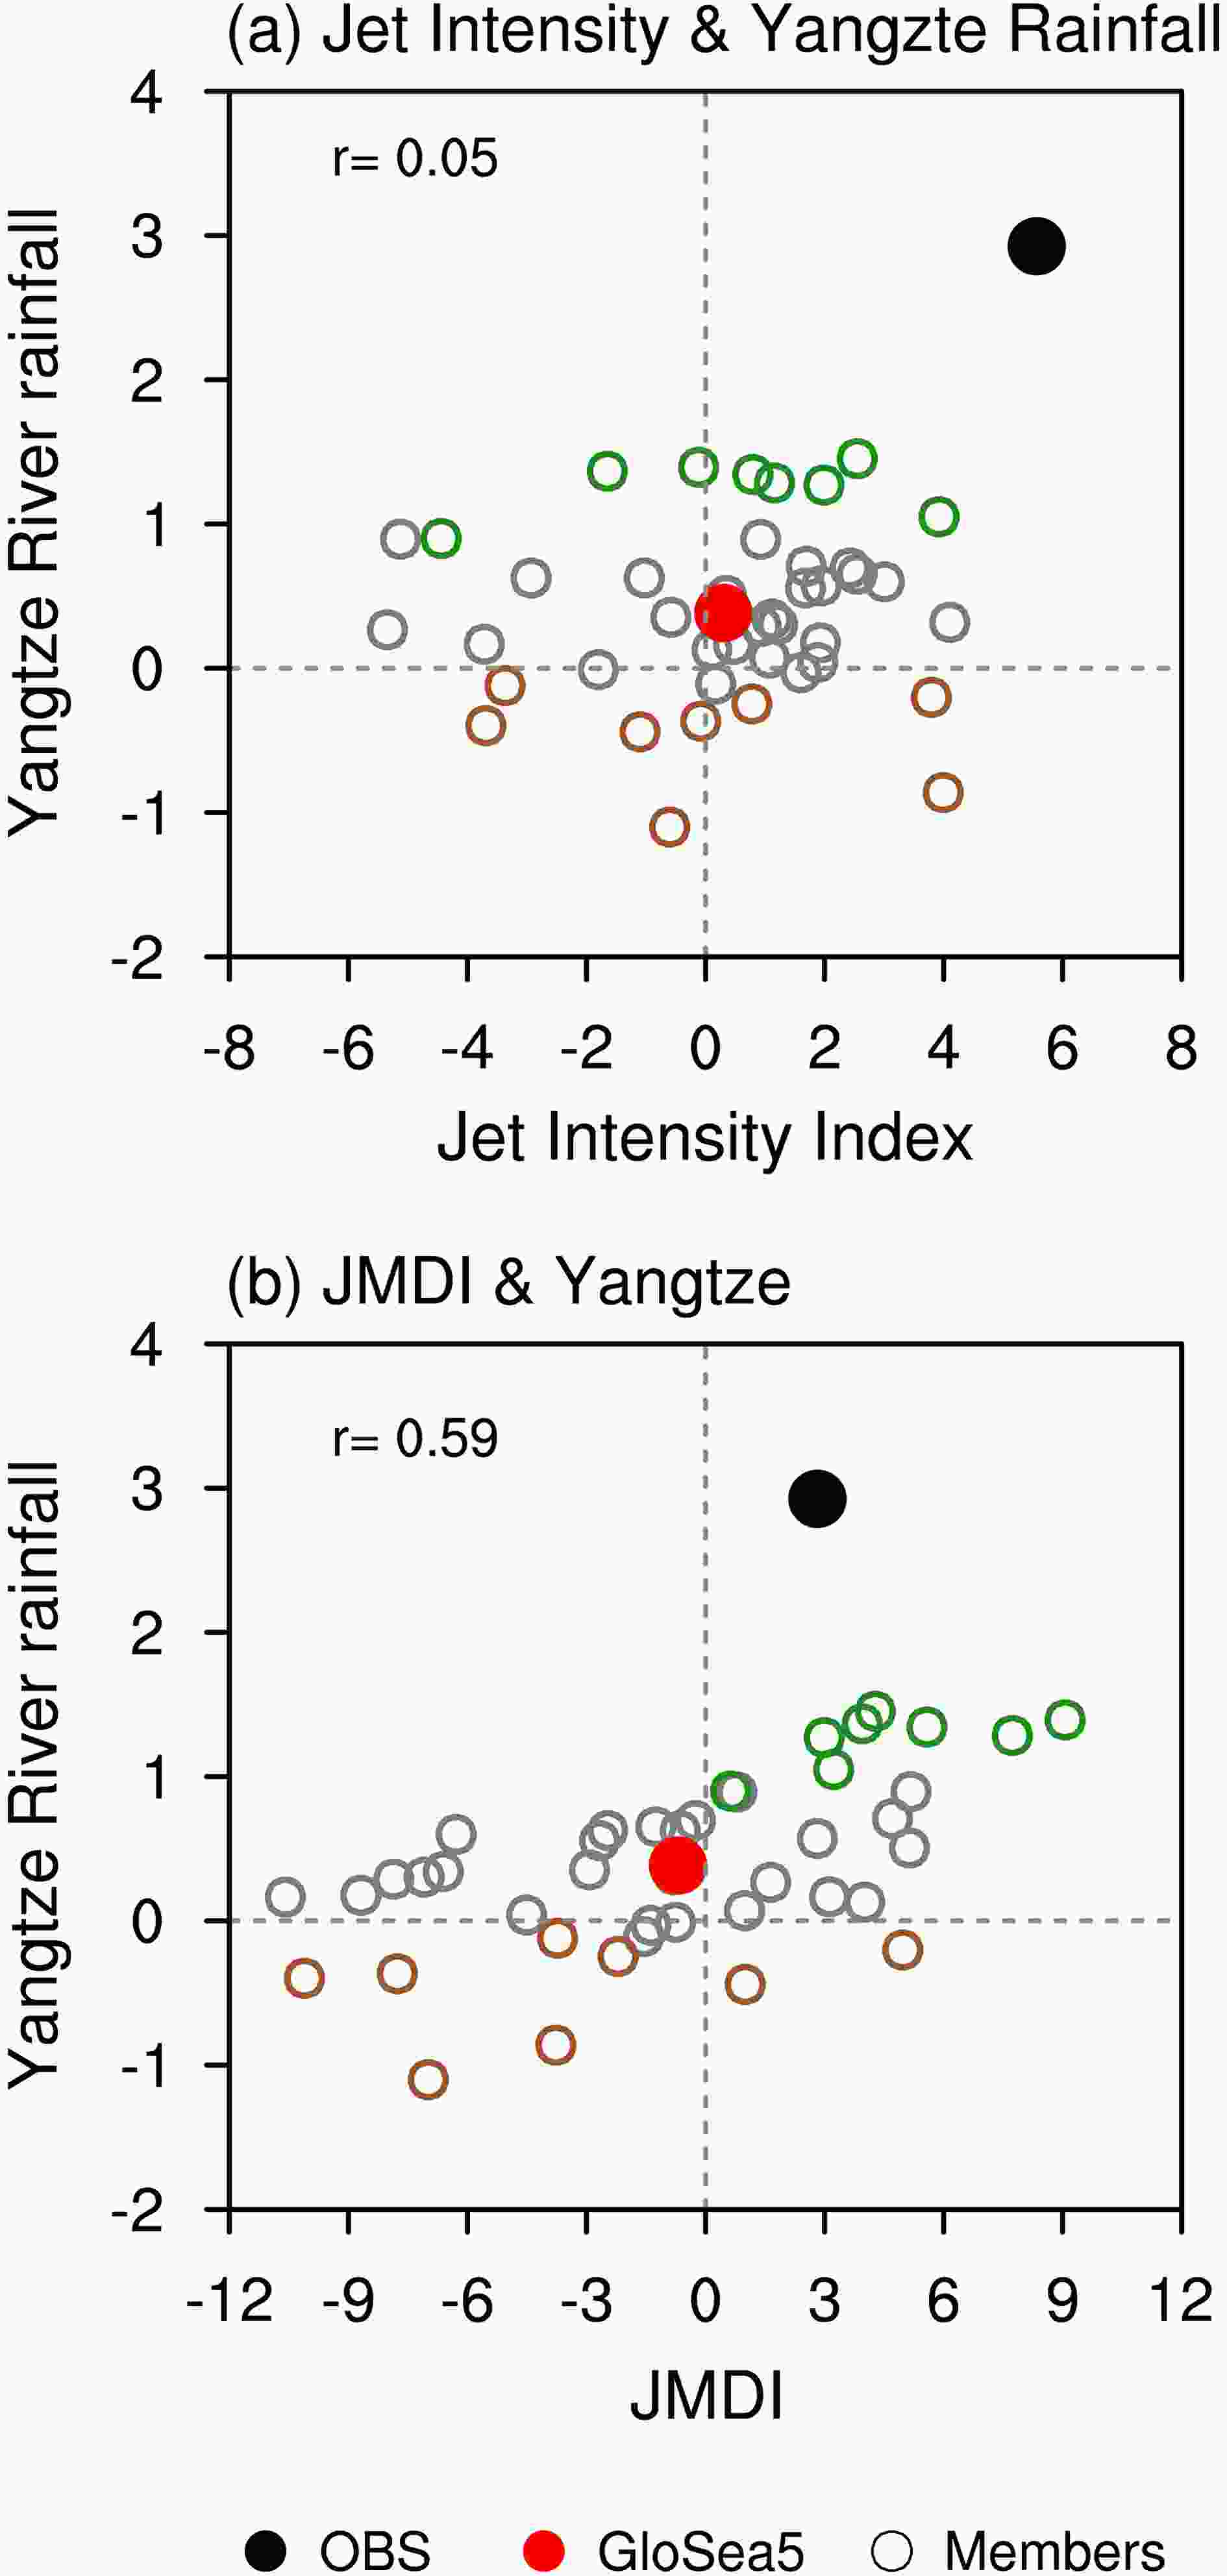 Figure8. As in Fig. 4, but for the scatter diagrams of the Yangtze River basin rainfall (units: mm d?1) with the (a) jet intensity index and (b) JMDI (units: m s?1). The eight best (worst) members are marked in green (brown).
Previous studies have revealed that both the intensity change and meridional displacement of the EAJ could affect the Yangtze River rainfall in summer (Kuang and Zhang, 2006; Wang and Zuo, 2016; Wang et al., 2018a; Xuan et al., 2018). A southwardly displaced EAJ favors more cold air transport from mid-latitudes, indicated by the lower-tropospheric northerly flow over north China. This process can be successfully described by the GloSea5, as shown by the different anomalies between the good and bad members (Figs. 6, 7c, and 7d). However, the enhanced EAJ intensity in observations which dominated the observed EAJ in 2020 summer, was not captured by the model forecast and thus is further explored.
The observed EAJ intensity in summer 2020 was about two standard deviations above normal (with respect to the summers after 1993), which was the second-largest observed after 1993 (Fig. 9a). In association with an enhancement of the EAJ intensity, significant northwesterly wind anomalies around Mongolia and North China and southerly wind anomalies around south China induced a convergent area of strengthened warm advection from the south and cold air from the north (Fig. 9b), further leading to increased rainfall around the Yangtze River basin (Fig. 9c). The positive rainfall anomalies related to the change of the EAJ intensity mainly appear over the regions north of the Yangtze River. In 2009, the EAJ intensity is the strongest, but the Yangtze River rainfall anomaly is only slightly below normal (Fig. 1c), which may be related to the deficient moisture transport caused by the cyclonic lower-tropospheric wind anomalies indicated by the positive WNPSH index in this year (Fig. 2c). This further implies that the exceptional Yangtze River rainfall in summer 2020 was caused by the combined effect of the anomalous westward extension of the WNPSH and an enhanced EAJ intensity.
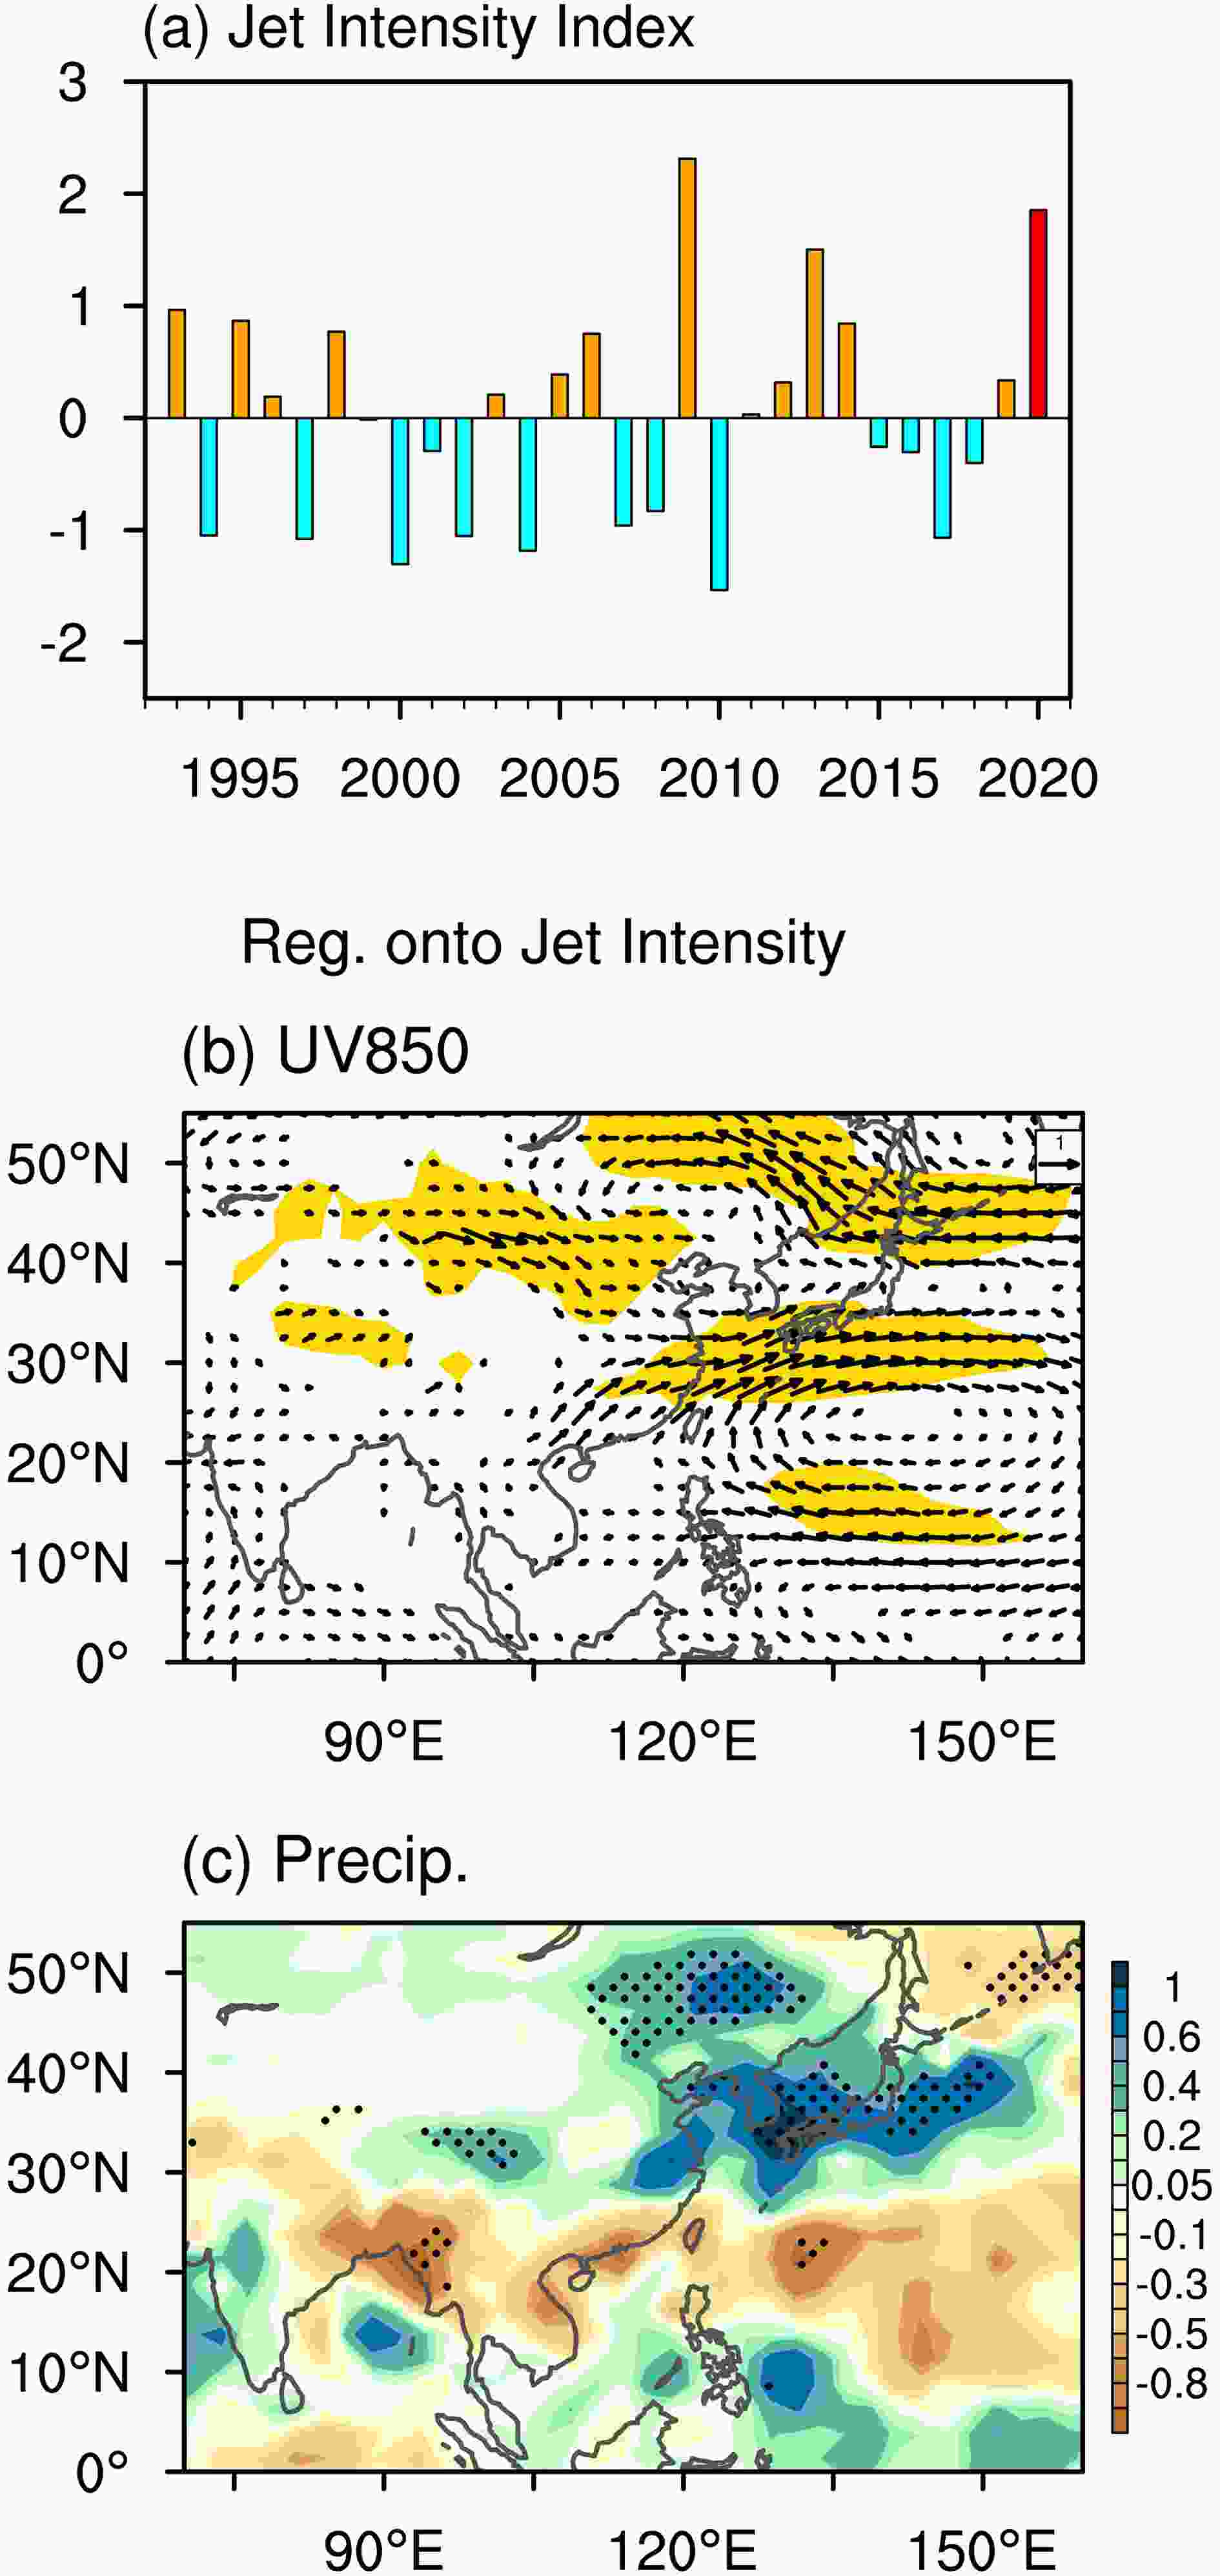 Figure9. (a) Standardized year-by-year variation of the westerly jet intensity index, and the regression of (b) 850 hPa wind (units: m s?1) and (c) precipitation (units: mm d?1) anomalies onto it based on 1993 to 2020 observations. Shading in (b) and stippling in (c) indicate regions where anomalies exceed the 95% confidence level.
Using the hindcasts from previous forecast systems, Li and Lin (2015) suggested that the models are deficient in describing the variation of the EAJ intensity and only show certain capability over the regions south of the EAJ axis. Glosea5 exhibits improvement, with a correlation coefficient for predicting the EAJ intensity index of 0.39 (significant at the 90% confidence level) during the hindcast period. But large skill still appears mainly over the regions south of the EAJ axis (not shown). Moreover, the observed impact from the enhanced EAJ intensity is lacking in the model forecast for the exceptional 2020 summer (Figs. 7b and 8a). This may also be the reason that the positive rainfall anomalies in the model forecast display a more southerly distribution compared with observations (Fig.1), considering the anomalous rainfall caused by the EAJ intensity was mainly over the regions to the north of the Yangtze River (Fig. 9c).
For the ensemble mean forecast of GloSea5 initialized around May, positive rainfall anomalies appear over the majority of regions of the Yangtze River basin, but with a weaker intensity than observed. The successful forecast of the above-normal Yangtze River rainfall lies in the predictable signals from the tropics. The model shows a good forecast of the anomalous WNPSH, exhibiting an anomalous lower-tropospheric anticyclone over the WNP and suggested a westward extension of the WNPSH in summer 2020, without a strong ENSO forcing from the previous winter. In the summer of 2020, the SSTs around the Indian Ocean, the South China Sea, and Maritime Continent were warmer than normal. These SST anomalies contributed to the good forecast of the anomalous WNPSH. The local WNP SST gradient, with a warmer condition around the South China Sea and Maritime Continent, displays a stronger relationship with the WNPSH, acting as one of the primary sources of predictability for the anomalous WNPSH during ENSO neutral years (Li et al., 2021). In addition, the above-normal Yangtze River rainfall was successfully delivered by GloSea5 3–4 months in advance (Bett et al., 2021), suggesting the potential for predictability using these signals at long lead times.
For the forecast spread among the model members, we revealed that the meridional displacement of the EAJ could modulate the forecast rainfall differences. The good-forecast members with more Yangtze River rainfall corresponded to a marked southward displacement of the mid-latitude westerly jet. An opposite pattern with a northward shift of the EAJ is shown by the bad-forecast members. However, the Yangtze River rainfall forecasted by the good members is still weaker than that in observations. Thus, another explanation is required for the exceptional Yangtze River rainfall in summer 2020.
Upon further analysis, we found that the model fails to capture the distinct faster EAJ in observations in summer 2020, which is beyond the scope of the forecast spread among the members. In association with the westward extension of the WNPSH, the enhanced intensity of the EAJ could favor the differential temperature advection and associated circulation convergence in the lower troposphere and induce more rainfall around the Yangtze River basin. The exceptional Yangtze River rainfall in summer 2020 is suggested to be a combined effect of the acceleration of the EAJ and westward extension of the WNPSH. Since intensity changes of the EAJ are not well simulated in this model forecast ensemble, weaker-than-observed Yangtze River rainfall is presented in the forecast, even for the good members.
This study emphasized the important contributions from the enhanced intensity of the EAJ, combining with the anomalous westward extension of the WNPSH. More remote drivers related to this anomalous change of the EAJ are not investigated and deserve further study. In addition, there exist certain interactions among the dynamic drivers in modulating the Yangtze River rainfall, like the local WNP SST and the Indian Ocean warming (Wang et al., 2000; Li et al., 2012; Xie et al., 2016). These interactions cannot be totally distinguished, nor quantitatively assessed for one single summer here. Besides, the Indian Ocean warming can impact the summer variation of the meridional displacement of the EAJ (Qu and Huang, 2012; Li and Lin, 2015), but this is not reflected by the model members in this summer (not shown).
This study focused on the seasonal forecast of the Yangtze River rainfall, but the Yangtze River rainfall also exhibits strong sub-seasonal variations. These have been associated with remote teleconnections from the summer North Atlantic Oscillation (Wang et al., 2018b; Liu et al., 2020), persistent Madden-Julian Oscillation activities (Zhang et al., 2021), and wave activities across Eurasia (Li et al., 2017). These factors should also be examined in our aim for the most skillful and reliable predictions of the Yangtze River summer rainfall.
Acknowledgments. This work was supported by the National Key Research and Development Program of China (Grant No. 2018YFC1506005) and the National Natural Science Foundation of China (Grant Nos. 41721004 and 41775083). This work and its contributors were also supported by the UK–China Research and Innovation Partnership Fund through the Met Office Climate Science for Service Partnership (CSSP) China as part of the Newton Fund.
