HTML
--> --> -->Enhanced observation networks and numerical weather prediction (NWP) models are two main approaches to generate the weather forecasts for the Olympic Games. With the support of the World Meteorological Organization (WMO), the Vancouver 2010, Sochi 2014, and Pyeongchang 2018 Winter Olympic and Paralympic Games were committed to the improvement of high-resolution numerical forecasts and construction of enhanced observation networks (e.g., Joe et al., 2010; Isaac et al., 2014; Vasil’ev and Dmitrieva, 2015; Han et al., 2016, 2018; Kiktev et al., 2017; Lee et al., 2018). An enhanced observation network promotes the improvement of weather nowcasting. Those short-term forecasts are based on NWP models. However, the performance of NWP models for the prediction of near-surface variables in complex terrains remains unsatisfactory.
Due to the influence of initial conditions, atmospheric physical process parameterizations, and numerical approximations, significant errors exist in forecasts of near-surface conditions (Hanna and Yang, 2001; Zhang and Zheng, 2004). This issue becomes more complicated in complex terrains due to the inability of models to finely differentiate the structure of the topography and to successfully reproduce turbulence effects, diurnal cycles, cold air pools in basins and valleys, nocturnal low-level jets, and boundary layer stability phenomena (Shafran et al., 2000; Whiteman et al., 2001; Zhong and Fast, 2003; Cheng and Steenburgh, 2005; Liu et al., 2019). These factors impose a major influence on the accuracy of surface wind speed forecasts. The model forecast errors of the surface wind speed have originally been attributed to the approximations of atmospheric physical processes in planetary boundary layer (PBL) and land surface model (LSM) parameterization schemes. By testing the performance of different PBL schemes in simulating near-surface variables, Zhang and Zheng (2004) found that all boundary layer schemes underestimated the wind speed during the daytime and overestimated it during the nighttime. Jiménez and Dudhia (2012) argued that the Weather Research and Forecasting (WRF) model overestimation of the surface wind speed was caused by the unresolved topography, which produced an additional drag to that generated by vegetation. They introduced a parameterization scheme that considered these unresolved topographic effects in the momentum flux. However, Frediani et al. (2016) reported that this parameterization scheme penalizes moderate and high winds. Duan et al. (2018) further investigated the WRF model performance in predicting surface variables in Northwest China, where the underlying surface is very complex. It was found that the 10-m wind speed forecast errors in June are strongly correlated with the terrain, but this correlation is not as apparent in December (winter).
To better discriminate complex terrains and associated vegetation, land use types, and subgrid physical processes, a practical solution to improve numerical forecasts is to increase the horizontal model resolution. Currently, many NWP systems are operated at the kilometer scale and are being developed to the subkilometer scale (e.g., Baldauf et al., 2011; Seity et al., 2011; Clark et al., 2012; Min, 2014; Huang et al., 2017). However, whether increasing the horizontal resolution can improve the surface variable prediction accuracy remains uncertain. Verification of the real-time forecasts from the fifth-generation Pennsylvania State University–National Center for Atmospheric Research mesoscale model (MM5) by Mass et al. (2002) suggested that these forecasts were notably improved when decreasing the grid spacing from 36 to 12 km, but little improvement was achieved with further reduction from 12 to 4 km. The verification of WRF model forecasts of surface variables by Zhang et al. (2013) also revealed that surface forecasts at a fine resolution (1.33 km) do not always outperform those at a coarse resolution. Leroyer et al. (2014) extended the NWP system in Meteorological Service of Canada (MSC) to a subkilometer grid spacing (0.25 km) but did not observe much improvement, although better sea-breeze flows were reproduced. However, the wind speed forecasts of Vionnet et al. (2015) exhibited notable improvements with decreasing grid spacing for high-altitude stations exposed to or sheltered from wind.
These studies further indicate the large uncertainty in surface wind speed forecasts. Although we expect the model surface wind speed forecast to improve with increasing model resolution and enhanced topography representation, the accuracy depends on many factors. Compared to increasing the horizontal resolution, a more effective way to reduce the model forecast error and to acquire more accurate forecasts may be the application of bias-correction methods to postprocess raw numerical forecasts.
The model errors that influence the forecast accuracy include random and systematic errors. Many studies have demonstrated that these errors, particularly the systematic errors, can be predicted with statistical methods, which can then be used to calibrate the numerical forecasts. Regarding the near-surface wind speed, the available methods that can be applied for calibration include the running mean method (e.g., Hacker and Rife, 2007), model output statistics (MOS, e.g., Gneiting et al., 2005), Kalman-filtering approach (e.g., Delle Monache et al., 2008), Bayesian model averaging (e.g., Raftery et al., 2005), gene-expression algorithms (e.g., Bakhshaii and Stull, 2009), decay-averaging adjustment method (e.g., Cui et al., 2012), analogy-based (AN) method (e.g., Delle Monache et al., 2011), etc. Several of these methods have been tested in wind speed forecasting during previous Winter Olympic Games. Frogner et al. (2016) compared and evaluated three ensemble prediction systems with different grid spacings to accurately predict wintertime weather conditions in complex terrains. The relative importance of the resolution and calibration was assessed. Han et al. (2018) evaluated six postprocessing methods and found that the Bayesian model averaging method was superior in calibrating near-surface wind speed ensemble forecasts. Zhang et al. (2020) applied the decay-averaging (DA) method to correct near-surface condition forecasts from the GRAPES_3 km model, which was employed during the Pyeongchang 2018 Winter Olympic Games.
In different regions, the model performance is different, and the effectiveness of different bias-correction methods is also different. Although certain model assessment results have been obtained under complex terrain conditions in the past and comparisons of different bias-correction methods have been conducted to calibrate model forecasts, there is no assessment or bias-correction research for the Chongli area. As the Winter Olympic Games approach, it is imperative to determine whether numerical modeling and associated bias-correction methods can provide suitable near-surface wind speed forecasts in the competition venues in Chongli. For this purpose, this paper evaluates the near-surface (10 m) wind speed forecast from the WRF model in the competition venues in Chongli during the wintertime through a comparison to enhanced surface observations along the race tracks (RTs). The ability of two postprocessing methods to calibrate near-surface wind speed forecasts is simultaneously examined. Here, the two evaluated calibration methods include a first-order adaptive Kalman-filtering method, namely, the DA method and the AN method. The AN method is based on the principle that similar forecasts tend to have similar errors. With the use of several statistical parameters, all the wind speed forecasts from the model or from the postprocessing methods are evaluated in the following aspects: 1) the effect of horizontal model resolution refinement from the kilometer to subkilometer scale on improving the near-surface wind speed forecasts in the competition venues in Chongli; 2) the performance of the postprocessing methods in generating better near-surface wind forecasts in Chongli; 3) the influence of the complex terrain, diurnal cycle, and wind intensity on the performance of the model and postprocessing methods.
The paper is arranged as follows: section 2 presents the details of the evaluation, including the near-surface wind speed forecast experiments with the WRF model, the observation dataset for verification, the postprocessing methods, and the evaluation parameters. Section 3 analyzes the verification results, focusing on the above three aspects, and a summary is provided in section 4.
2.1. Numerical model and experimental configuration
The WRF v4.1.3 model was applied to forecast the near-surface wind speed in Chongli. Three one-way nested domains were employed with horizontal resolutions of 4.05, 1.35 and 0.45 km. These forecasts were conducted for the period from 1 January to 16 February 2019, which is the wintertime in Chongli (Fig. 1). The horizontal grid of each domain has dimensions of 361×361. The orography for the 4.05- and 1.35-km grids was obtained from the U.S. Geological Survey (USGS) 30-arc-s (approximately 0.9 km) orography dataset. The 0.45-grid topography is from Shuttle Radar Topography Mission (SRTM) data which has 3-arc-s resolution. There are 51 vertical levels in each domain.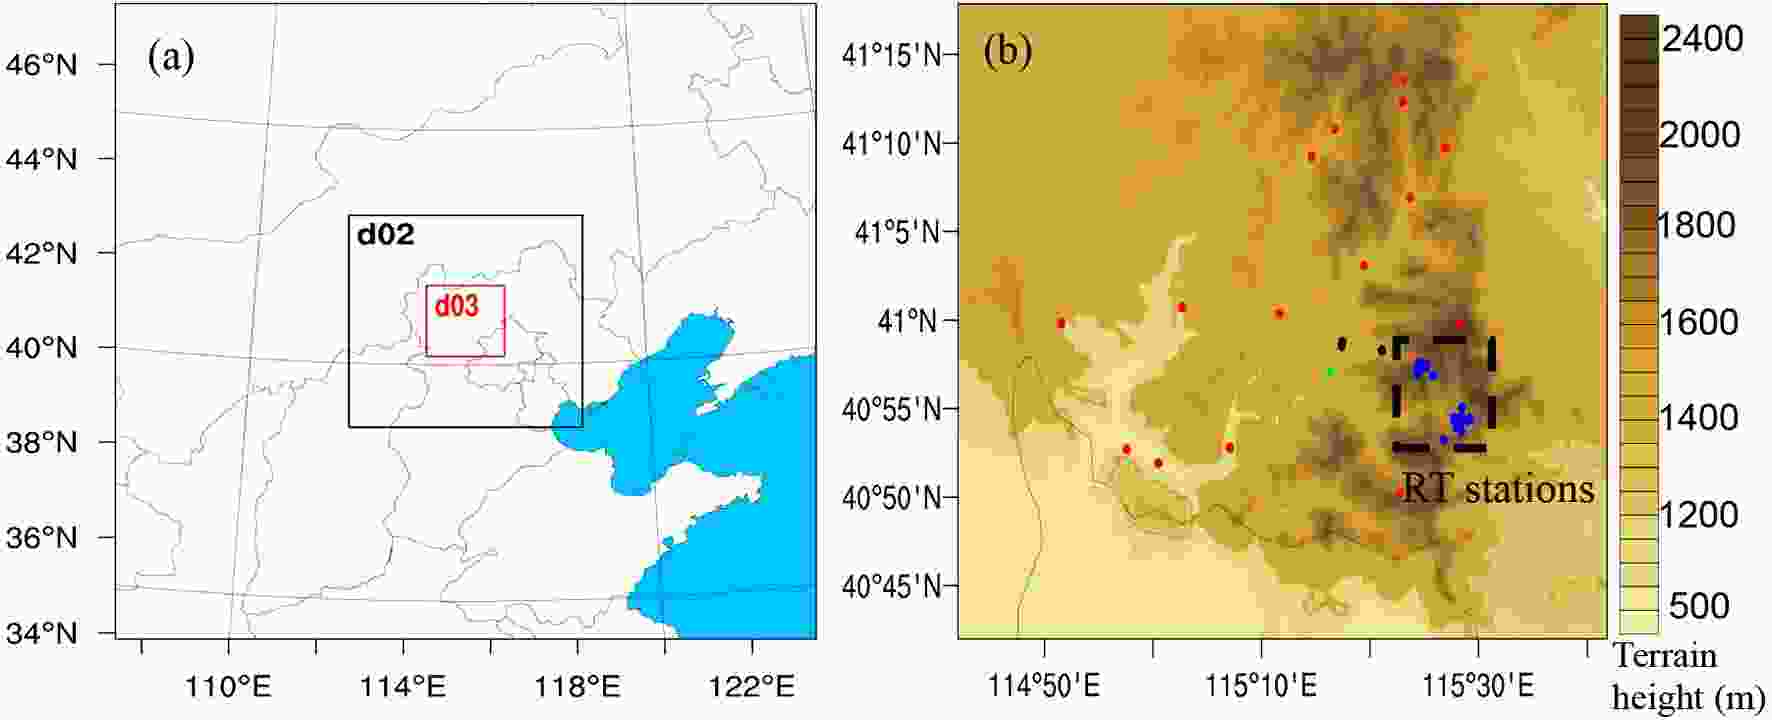 Figure1. Model domains for the numerical experiments: (a) the 4.05-, 1.35- and 0.45-km domains, (b) distribution of the available observation stations (solid points) superimposed on the 0.45-km-grid orography of Chongli. The solid points in (a) include 1 national station (green), 17 regional stations (red), 3 test stations (black) and 23 race track stations (blue). Apart from the single national station, the other stations are all automatic stations.
The physical parameterization schemes employed in this study include the Thompson aerosol-aware microphysics scheme (a bulk microphysical parameterization for winter precipitation forecasts considering aerosol impacts, Thompson et al., 2008; Thompson and Eidhammer, 2014), the new version of the Rapid Radiative Transfer Model (RRTMG) radiation scheme (a radiation model by Iacono et al., 2008 considering long-lived greenhouse gases), the Noah land surface model (LSM; the most widely used land surface model with new modifications to better represent processes over ice sheets and snow covered area, Alapaty et al., 2008), and the YSU planetary boundary layer (PBL) parameterization scheme (non-local-K scheme with explicit entrainment layer, parabolic K profile in unstable mixed layer, terrain variance-related correction, and top-down mixing driven by radiative cooling, Hong et al., 2006).
The initial and lateral boundary conditions of the 4.05-km experiment are derived from the analysis and forecast data provided by the National Centers for Environmental Prediction (NCEP) Global Forecasting System (NCEP/GFS). As an experiment, the current work used the GFS data with 0.5° horizontal resolution and 3-h temporal resolution, which permits us to obtain long-term history data. The use of the GFS data with 0.25° horizontal resolution for the wind forecast is in test.
The 4.05-km experiment was initialized at 0000 UTC and run for 48 h with 3-hourly lateral boundary conditions. Six-hour delays were applied to the initialization of the 1.35-km (0600 UTC) and 0.45-km (1200 UTC) domains. The initial and boundary conditions of the 1.35-km run are from the prediction fields of the 4.05-km run, which are downscaled to 1.35-km grid by ndown.exe in WRF. Then, when the 1.35-km run is completed, its prediction fields further provide the initial and boundary conditions for the 0.45-km run. Lateral boundary conditions of 1.35-km and 0.45-km runs are hourly updated. All the domains have the same ending time. Therefore, for each domain, the output period progressively decreases with increasing resolution, namely, 48 h for the 4.05-km domain, 42 h for the 1.35-km domain, and 36 h for the 0.45-km domain. The 4.05-, 1.35- and 0.45-km forecasts were started once each day over the entire experimental period from 1 January to 16 February 2019. The 10-m wind speed forecasts are output each hour and remapped to the observation stations from the nearest grid point for the following evaluation and calibration procedures. The distribution of the observation stations is presented in the next subsection.
2
2.2. Observation dataset in Chongli
As one district of Zhangjiakou to the northwest of Hebei Province, Chongli is located along the border areas of the Yanshan Mountain and the Yinshan Range, characterized by several northeast-southwest-oriented mountain ranges and many valleys (Fig. 1b). The complex terrain provides favorable natural conditions for winter snow sports but also causes great difficulties in weather forecasting.The distribution of the observation stations for the 10-m wind speed evaluation and calibration steps are shown in Fig. 1b. They include 1 national station (green), 17 regional stations (red), 3 test stations (black), and 23 stations along RTs (blue). These observation sites are separated into two groups, namely, the RT stations near the competition venues and other stations excluding the race-track (NRT) stations. The RT stations include all the stations along the RTs (the blue dots in Fig. 1b) and two regional stations (the red dots coinciding with the blue dots) near the race venues. The NRT stations include 1 national station, 15 regional stations, and 3 test stations (the other dots except for the RT stations in Fig. 1b). The performance of the WRF model and associated postprocessing methods is assessed between the RT and NRT stations. As shown in Fig. 1b, the RT stations are mainly distributed across the high-altitude area in Chongli, while the NRT stations mostly occur in valleys. The different distributions of the RT and NRT stations are defined to enable a comparison of them, considering the performance of the numerical model in the valleys and high-altitude sites (Zhang et al., 2013; Vionnet et al., 2015; Duan et al., 2018).
2
2.3. Postprocessing methods for calibration
32.3.1. The DA method
As a relatively easy and flexible postprocessing method, the DA method has been applied to reduce the bias of the global ensemble forecast by NCEP operation. The algorithm is mostly the same as that described in Cui et al. (2012), except that it was applied to the station sites, and the bias was estimated with the aid of available observations at each station site instead of with the analysis grid data. The same method was adopted by Zhang et al. (2020) to correct the 2-m temperature, 2-m relative humidity and 10-m wind speed forecasts from the GRAPES model during the Pyeongchang Winter Olympic Games. The two steps of this adaptive algorithm for a given station can be described as follows:where t is the current forecast time and


3
2.3.2. The AN method
The DA method utilizes all the available past errors to estimate the current bias with the latest errors assigned higher weights. In comparison, the AN method applies a sorting process to the past predictions and selects certain members with similar features to those of the current forecast [called analogs by Delle Monache et al. (2011)]. It is assumed that for a given location, analogous forecasts have similar forecast errors. Therefore, the current forecast error can be inferred from the errors of past analogous forecasts. Delle Monache et al. (2011) defined a metric to measure the similarity of past forecasts to current forecast as follows:where


With the above metric, all the available past predictions are ranked from small matric value to higher, and the best


where


The above equation implies that the observations of the more analogous members (lower analogy metric) have higher weights in

In this study, the DA and AN algorithms are applied to calibrate the model 10-m wind speed forecasts in Chongli at each of the observation sites. Calibrations were conducted for the 4.05-km/1.35-km/0.45-km domain of the 1–48-h/1–42-h/1–36-h (1-h intervals) forecasts from 1 January to 16 February 2019 at all station sites. During the application, many sensitivity tests are carried out to optimize the correction. Regarding the DA method, a test of the weight


Note that

2
2.4. Evaluation methods
BIAS, CRMSE, RMSE, Pearson correction coefficient (COR), and normalized standard deviation (NSD) are adopted to examine the performance of the WRF model and the three postprocessing methods in forecasting the 10-m wind speed. Their physical meanings have been introduced in detail in Taylor (2001), Delle Monache et al. (2011), and other papers on model evaluation (e.g., Vionnet et al., 2015). Their definitions in this study are as follows:where


BIAS measures the systematic errors of the forecast. CRMSE represents the random error other than the bias in RMSE. COR and NAD are used to plot Taylor diagrams, which reflect the correlation pattern of the predictions and observations.
3.1. Global evaluation
Here, the term global implies that the evaluation is conducted across all available stations and times (including the forecast times; Np = stations × forecast times × times) for each of the domains and each of the forecast methods. Through this global evaluation, the overall performance of the raw, DA, and AN 10-m wind speed forecasts in the different model domains can be evaluated.3
3.1.1. The refinement of the horizontal resolution from the kilometer to subkilometer scale
Figure 2 shows three Taylor diagrams plotted with the COR and NSD values for all stations, RT stations (only RT stations are included in the evaluation), and NRT stations (only NRT stations are included in the evaluation). To analyze the performance of the model with increasing horizontal resolution from the kilometer to subkilometer scale, the dots marked with number 1 in Fig. 2 are first explained.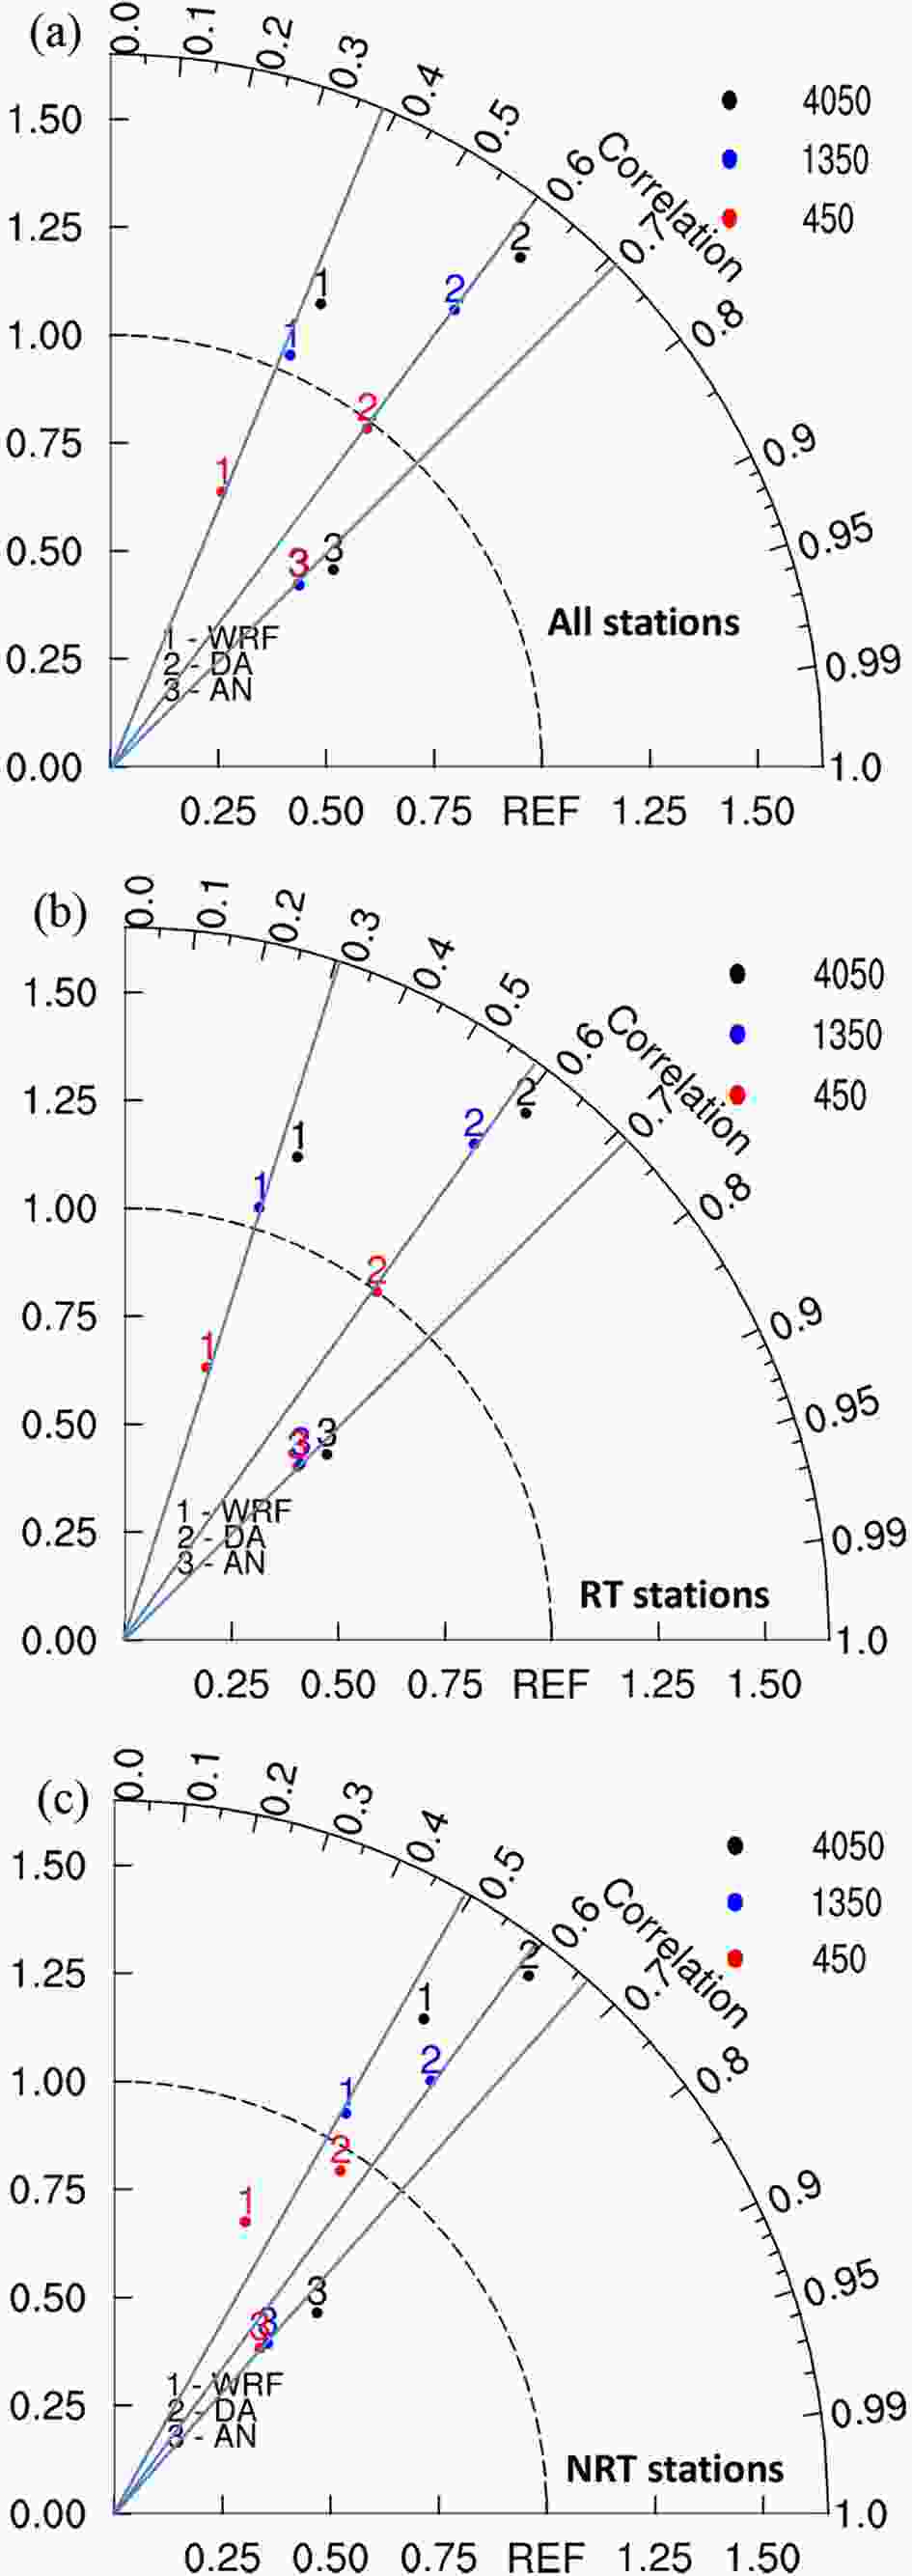 Figure2. Taylor diagrams based on COR and NSD of the raw WRF forecasts and the forecasts obtained with the DA, AN, and ANE methods of the 10-m wind speed for the different domains at (a) all stations; (b) RT stations; (c) NRT stations. The black dot indicates the 4.05-km domain, the blue dot indicates the 1.35-km domain, the red dot indicates the 0.45-km domain, 1 indicates the WRF raw forecast, 2 indicates the DA forecast, 3 indicates the AN forecast, and 4 indicates the ANE forecast.
In Fig. 2a, the change in COR with increasing model resolution refinement is slight. The COR values of all three domains are approximately 0.4, and the 0.45-km grid COR value is even slightly smaller than that of the 4.05-km grid, with that of the 1.35-km grid being an intermediate value. In contrast, the change in NSD is evident, with the 1.35-km grid exhibiting the best NSD approaching 1. The slightly smaller COR value of the 0.45-km grid probably occurs because this grid contains more details of the flow across the mountains and thus exhibits more disturbances in the near-surface wind speed (Raderschall et al., 2008; Vionnet et al., 2015). The circumstances at the RT and NRT stations are similar except that the COR value at the RT stations is smaller than 0.3 while the COR value at the NRT stations is larger than 0.5 (Figs. 2b–c). The relatively small COR value indicates an unsatisfactory performance of the WRF model in forecasting the 10-m wind speed at the RT stations.
BIAS and CRMSE for each of the domains and each of the forecasting methods are further calculated across all stations, RT stations, and NRT stations. Here, we still focus on the raw WRF forecasts first. As shown in Figs. 3a–b, at all stations, both BIAS and CRMSE decrease with increasing horizontal resolution down to the subkilometer scale. BIAS decreases from 0.696 m s–1 in the 4.05-km grid to 0.53 m s–1 in the 1.35-km grid and further to 0.068 m s–1 in the 0.45-km grid. The BIAS improvement reaches up to 90.2% from the 4.05-km grid to the 0.45-km grid.
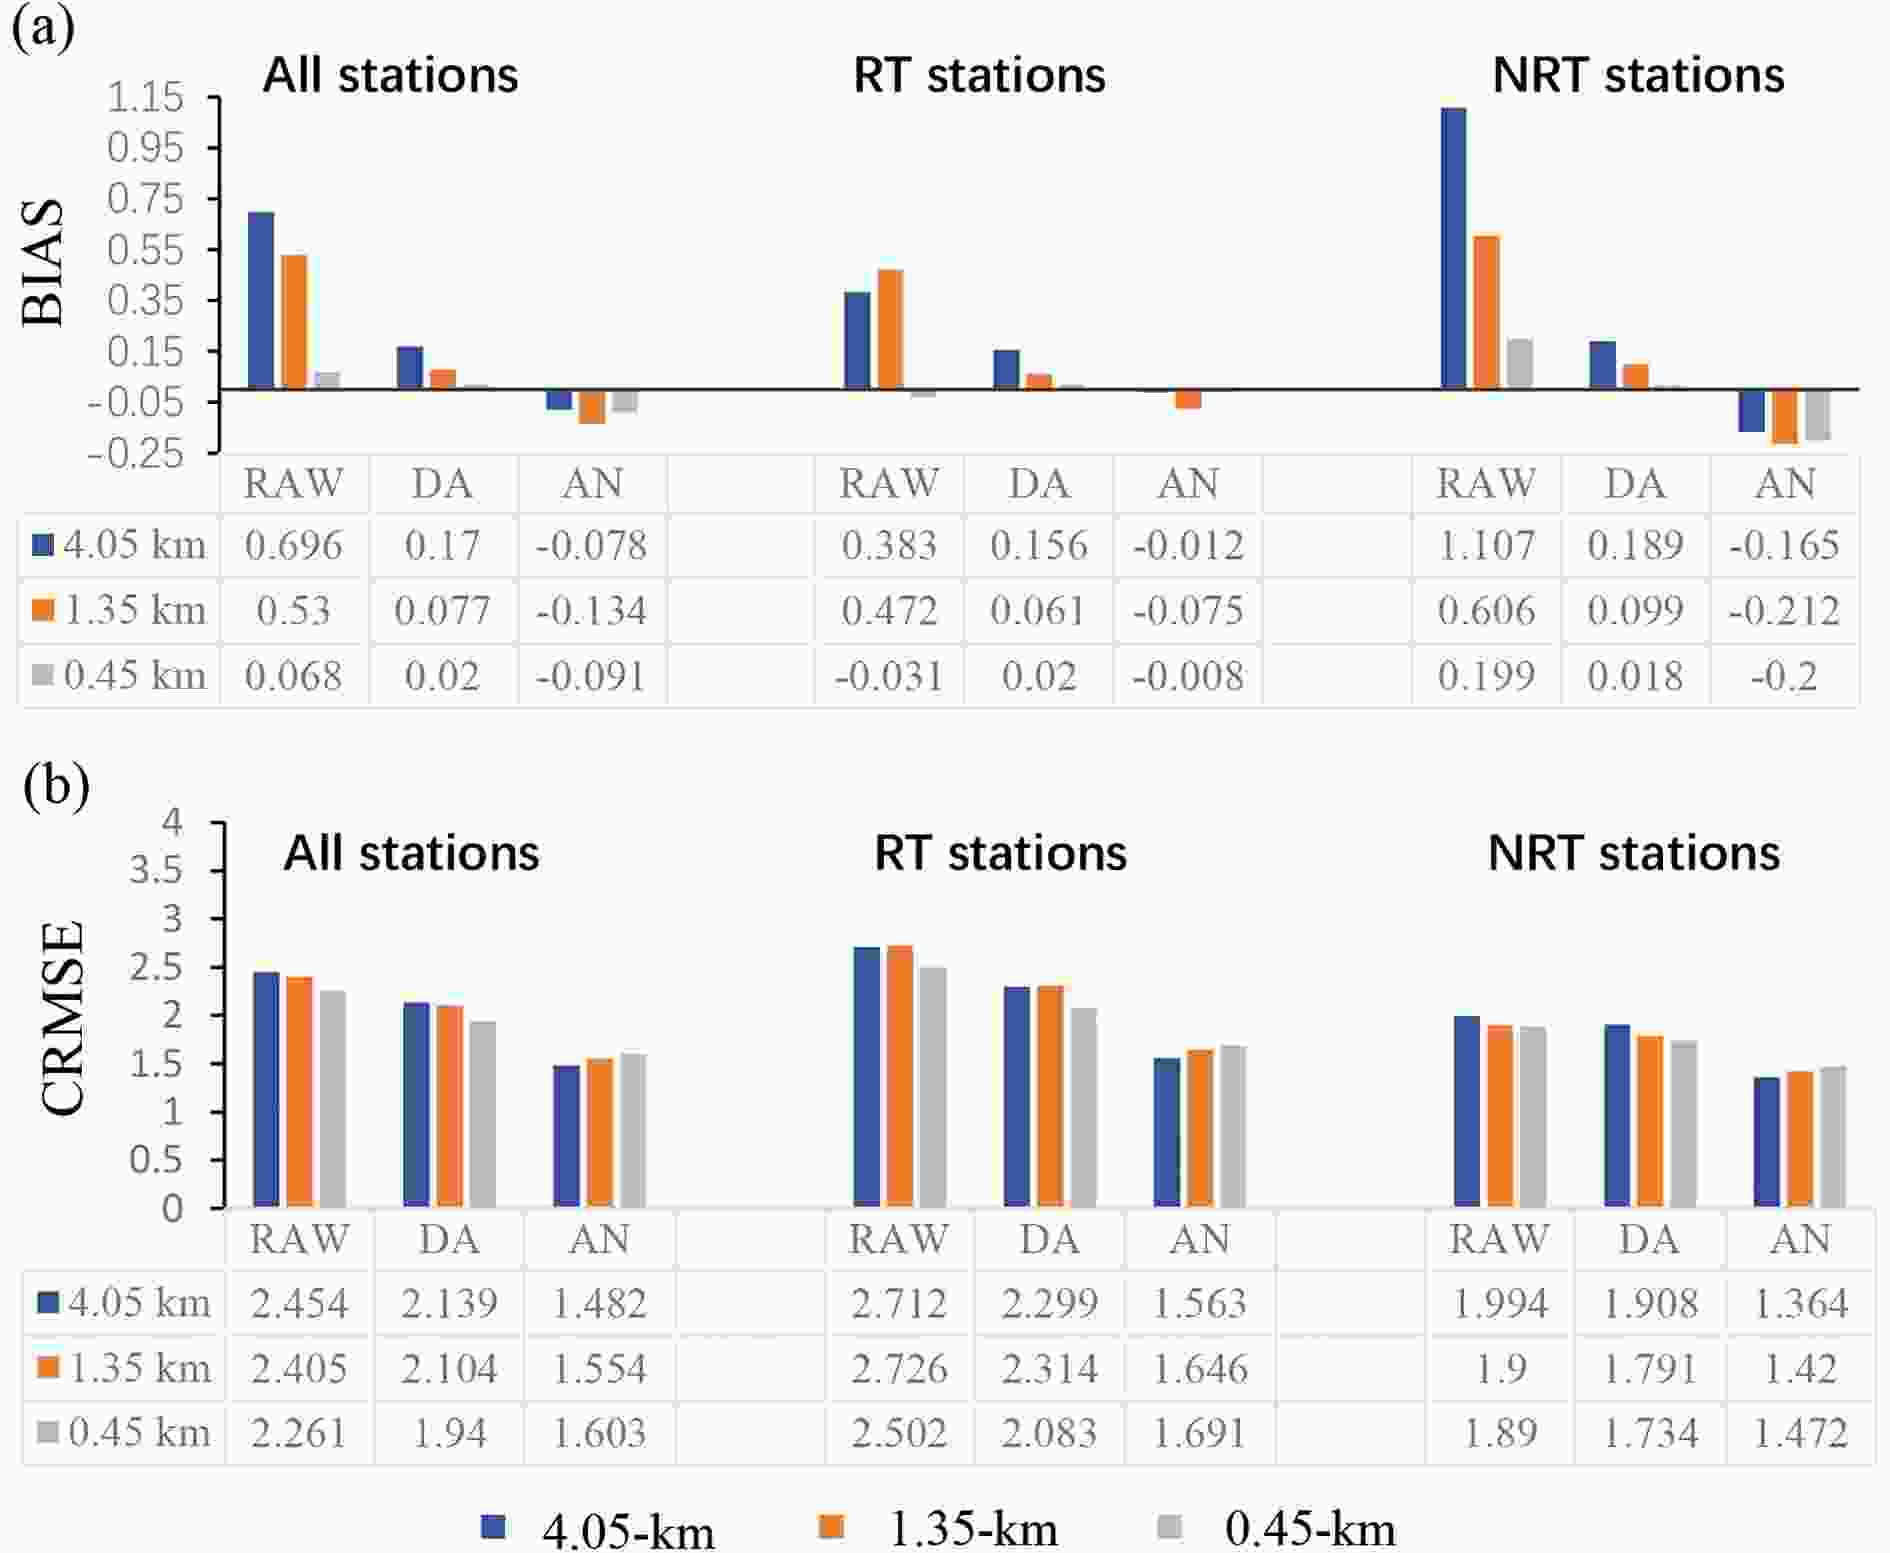 Figure3. Histogram of (a) BIAS and (b) CRMSE of the raw WRF forecasts and the forecasts with the DA, and AN methods of the 10-m wind speed for the different domains.
An improvement of the 10-m wind speed forecast with increasing horizontal resolution is also observed at the RT and NRT stations, with a slightly higher improvement at the RT stations. Figure 3a reveals that in contrast to what is observed for the COR values, BIAS at the RT stations is lower than that at the NRT stations at the same resolution. At the RT stations, BIAS is reduced by 92% when the resolution is refined down to the subkilometer scale, and this reduction is 82% at the NRT stations. However, confidence in this result is somewhat uncertain due to the possible canceling of the positive and negative BIAS, which can result in a lower BIAS value. In contrast to BIAS, CRMSE at the RT stations is larger than that at the NRT stations (Fig. 3b). However, the CRMSE improvement with increasing horizontal resolution refinement at the RT stations (7.8%) is still greater than that at the NRT stations (5.2%). This result is similar to that reported in Vionnet et al. (2015), in which a greater improvement of the near-surface wind speed forecasts at high-altitude stations is obtained with increasing horizontal resolution.
A preliminary result from the above global evaluations is that decreasing the model grid spacing does improve the near-surface wind speed forecasts, especially at the RT stations, although the model performance at the RT stations may not be better than that at the NRT stations (based on COR and CRMSE).
3
3.1.2. The performance of the postprocessing methods
Figures 2 and 3 are revisited here to examine the performance of the various postprocessing methods in the calibration of the 10-m wind speed forecasts via a comparison to the performance attained by refining the horizontal resolution of the WRF model. According to Fig. 2a, both postprocessing methods generate larger COR values than those of the raw WRF forecasts. Compared to the model raw forecasts, the DA method increases COR to approximately 0.6, and the AN method can improve this value to approximately 0.7, indicating a better performance of the AN method in forecasting the wind speed change pattern. This result is also applicable to the RT and NRT stations, as shown in Figs. 2b–c. However, a noteworthy point of the evaluations is that COR at the RT stations can be improved to approximately 0.7 after calibration with the AN method. This value is even larger than the COR value at the NRT stations, although the COR value of the raw forecasts at the RT stations is much smaller than that at the NRT stations. This indicates that calibration by the postprocessing methods is an effective way to generate more accurate near-surface wind speed forecasts in the competition areas in Chongli. This is also observed for BIAS and CRMSE, as shown in Fig. 3.Figure 3 shows that compared to the raw WRF forecasts, the postprocessing methods are able to reduce BIAS and CRMSE in each of the domains, except for the 0.45-km-grid BIAS values. Regarding the BIAS values in the 0.45-km domain, the raw WRF forecasts attain a lower BIAS value than that of the AN method. However, as indicated above, the BIAS results require further examination due to the possible canceling of any positive and negative BIAS values. The relative performance of the DA and AN methods in reducing the bias of the model raw forecasts is not systematic (Fig. 3a). For example, at the RT stations, the AN method attains better performance. At all stations, the DA method performs better than the AN method. However, in terms of reducing CRMSE (Fig. 3b), it is observed that the AN method performs better. This is consistent with the results of Delle Monache et al. (2011) whereby the AN method reduces the random model errors and thus improves the predictive skills on near-surface wind speed forecasts.
3
3.1.3. Evaluations according to the wind speed intensity at the RT stations
The evaluations in this subsection are similar to the above evaluations except that the wind speed intensity is considered. The wind speed is separated into three bins (0–5, 5–10, and >10 m s–1), and BIAS, CRMSE, and COR values are calculated for each of the bins across the available RT station observations and times (Fig. 4).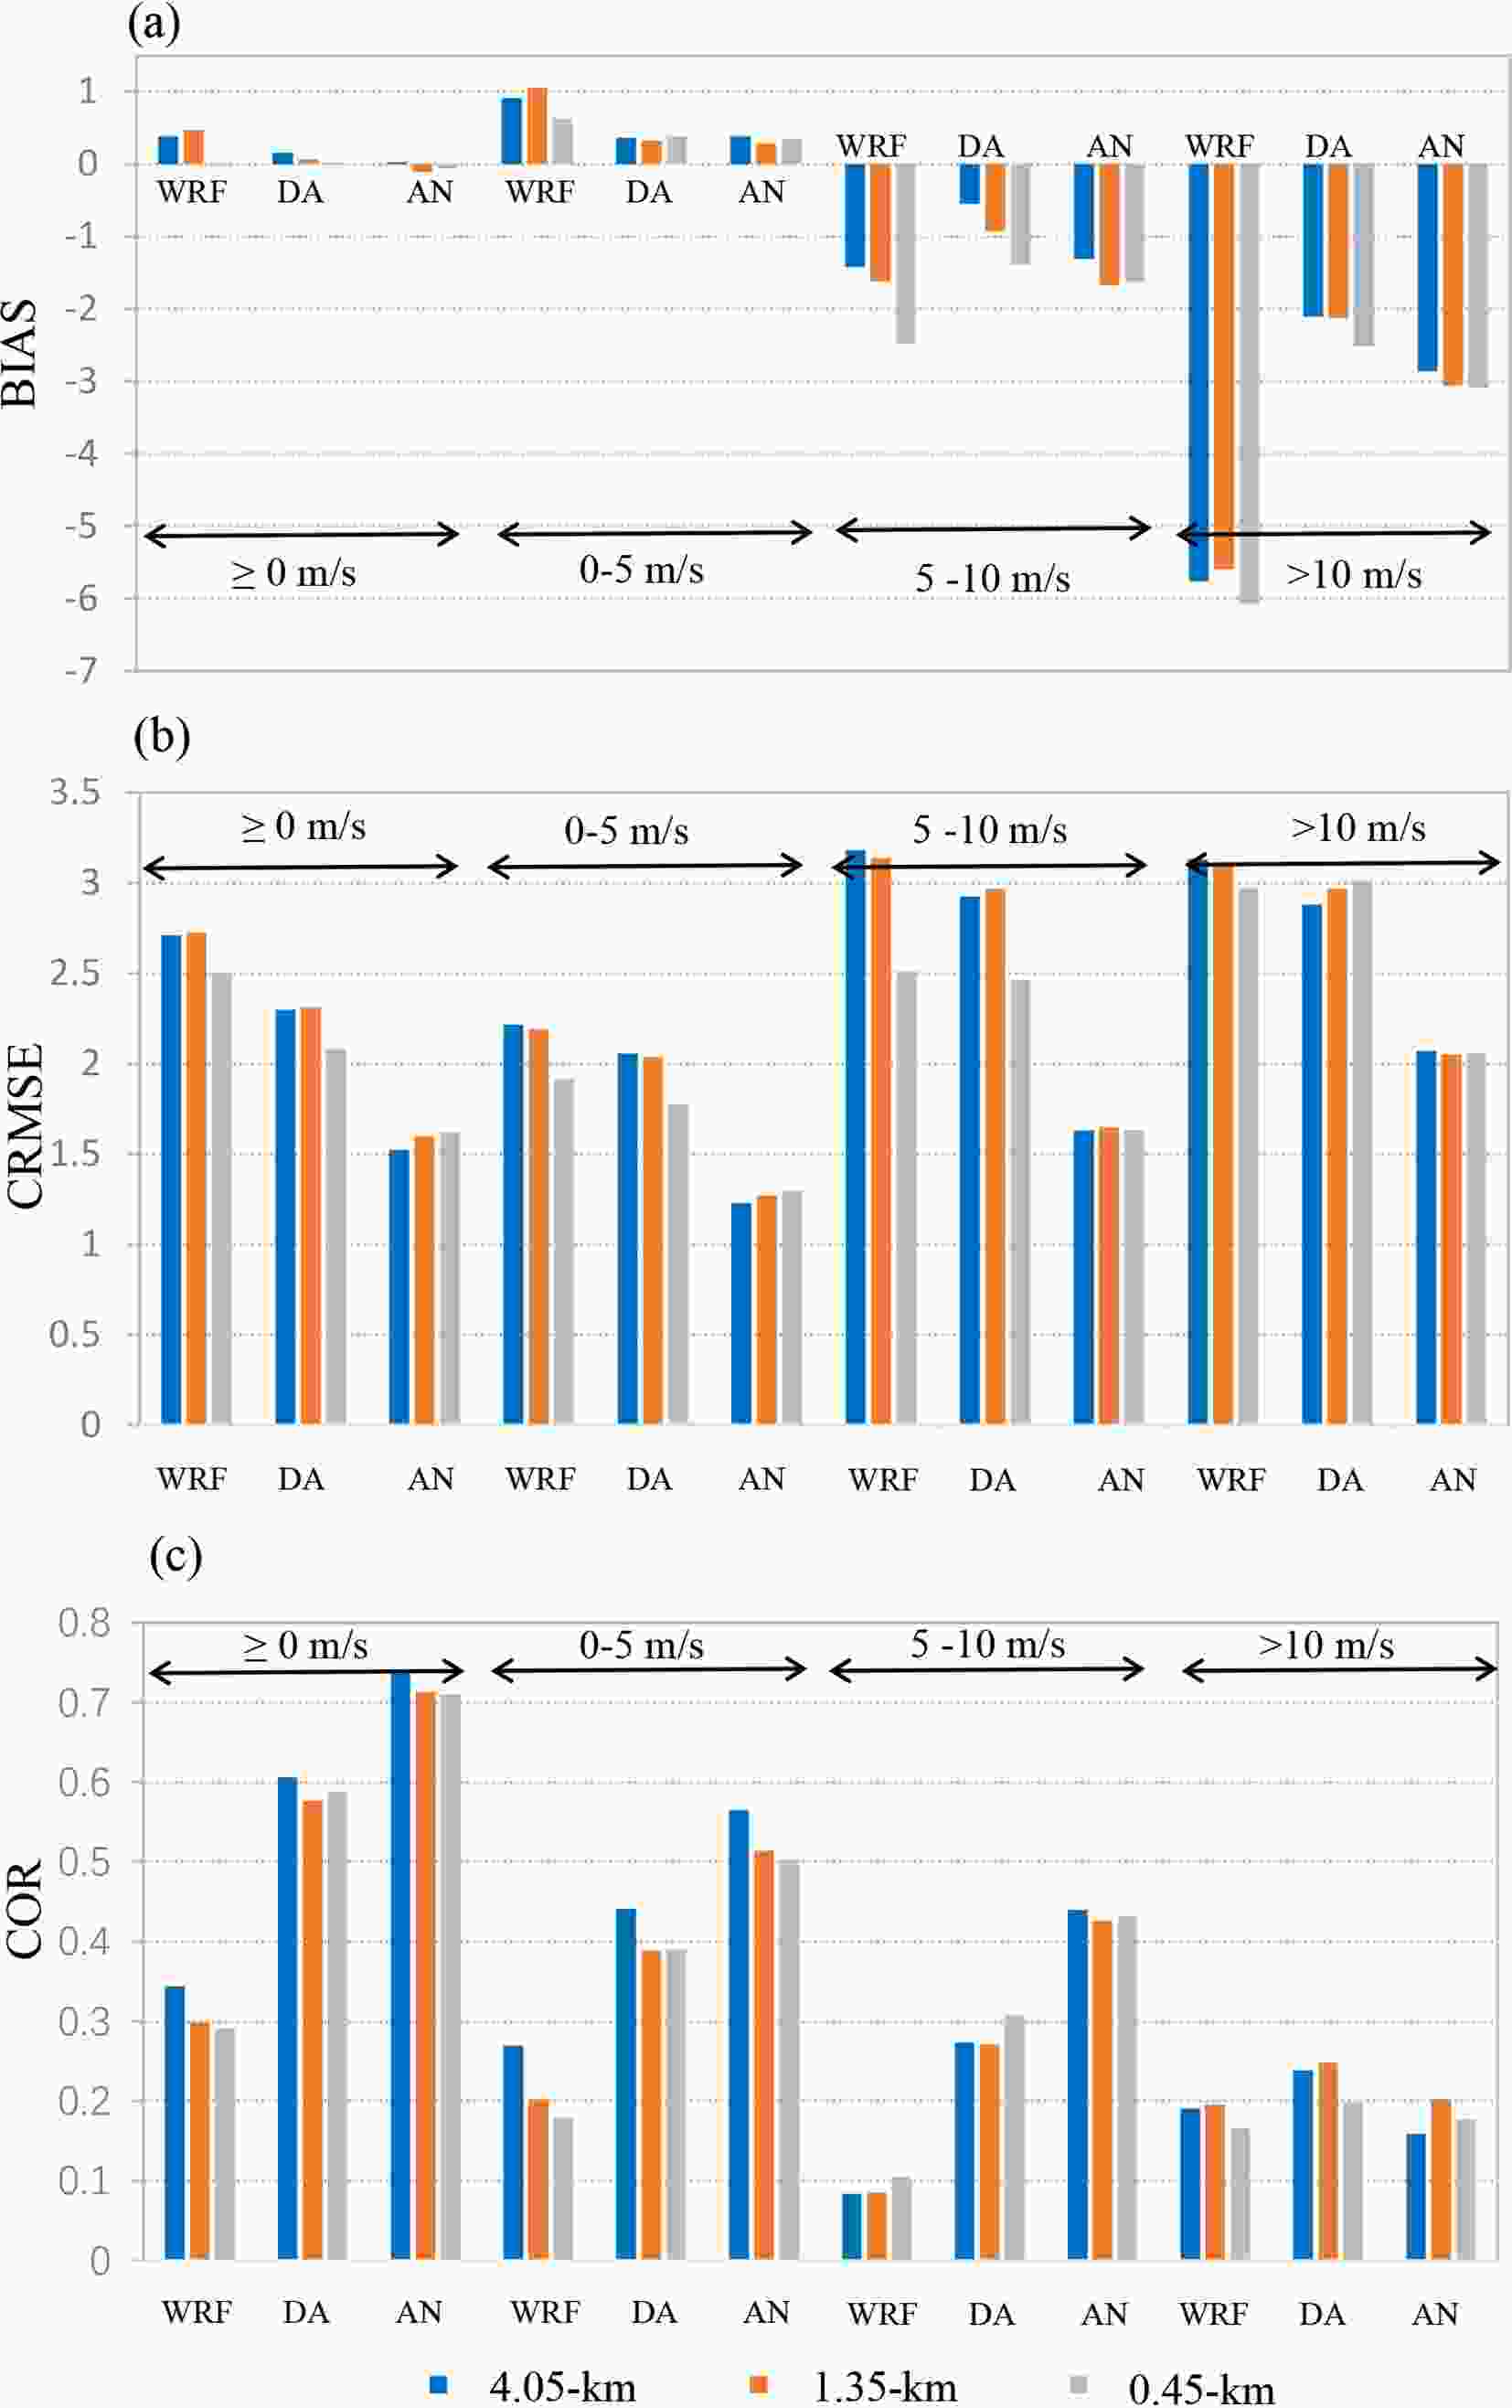 Figure4. (a) BIAS, (b) CRMSE and (c) COR of the raw WRF forecasts and the forecasts obtained with the DA and AN methods at the different wind speed intensities for the various model domains.
In Fig. 4a, at all model resolutions, a positive bias is observed at wind speeds below 5 m s–1, with the 0.45-km grid exhibiting the lowest bias. The bias is observed to decrease with increasing wind speed, resulting in a negative bias at high wind speeds. The negative bias at wind speeds of 5–10 m s–1 occurs at all resolutions, with a finer resolution resulting in a larger underestimation. At wind speeds higher than 10 m s-1, all model resolutions exhibit the highest negative bias, at approximately –5.5 m s–1, indicating the inability of the WRF model to forecast the high wind speeds along the tracks of the competition areas in Chongli. The relationship between the bias and wind speed is similar to that reported by Jiménez and Dudhia (2012) and Frediani et al. (2016) for the Yonsei University (YSU) PBL parameterization scheme, which has been applied in this study. In their study, it was argued that the high negative bias related to high wind speeds occurs due to the higher drag, which is described by the drag expression in the Monin-Obukhov similarity theory.
The random error component measured by CRMSE also exhibits an increase with increasing wind speed (Fig. 4b) for the WRF raw forecast. At wind speeds below 5 m s–1 and at a moderate wind speeds of 5–10 m s–1, the increase in horizontal resolution from the kilometer to subkilometer scale results in a decrease in CRMSE. However, at high wind speeds, i.e., higher than 10 m s-1, this decrease is not evident. The observed COR trend at each wind speed range is similar to that depicted in Fig. 2, which shows that COR does not change much with increasing horizontal resolution. Moreover, at each wind speed range, COR further decreases, with the moderate wind speed range attaining the smallest COR value.
These analyses indicate that increasing the horizontal resolution may generate better forecasts at low wind speeds, but at high wind speeds, retrogression may occur.
Figure 4 reveals that the postprocessing method plays an important role in reducing both (positive or negative) BIAS and CRMSE and improving COR, especially at high wind speeds. To reduce the high negative bias at wind speeds exceeding 5 m s–1, the DA method performs better than the AN method. At wind speeds higher than 10 m s–1, the DA method can reduce the negative bias by approximately 65%. The AN method yields better performance in reducing the random errors at both high and low wind speeds. However, it seems that the postprocessing method is not able to improve COR at wind speeds higher than 10 m s–1, with the COR values of the AN method even smaller than those of the raw forecasts.
2
3.2. Spatial analysis
In this subsection, we analyze how BIAS, CRMSE, and COR behave according to terrain variability. These parameters are computed with all available
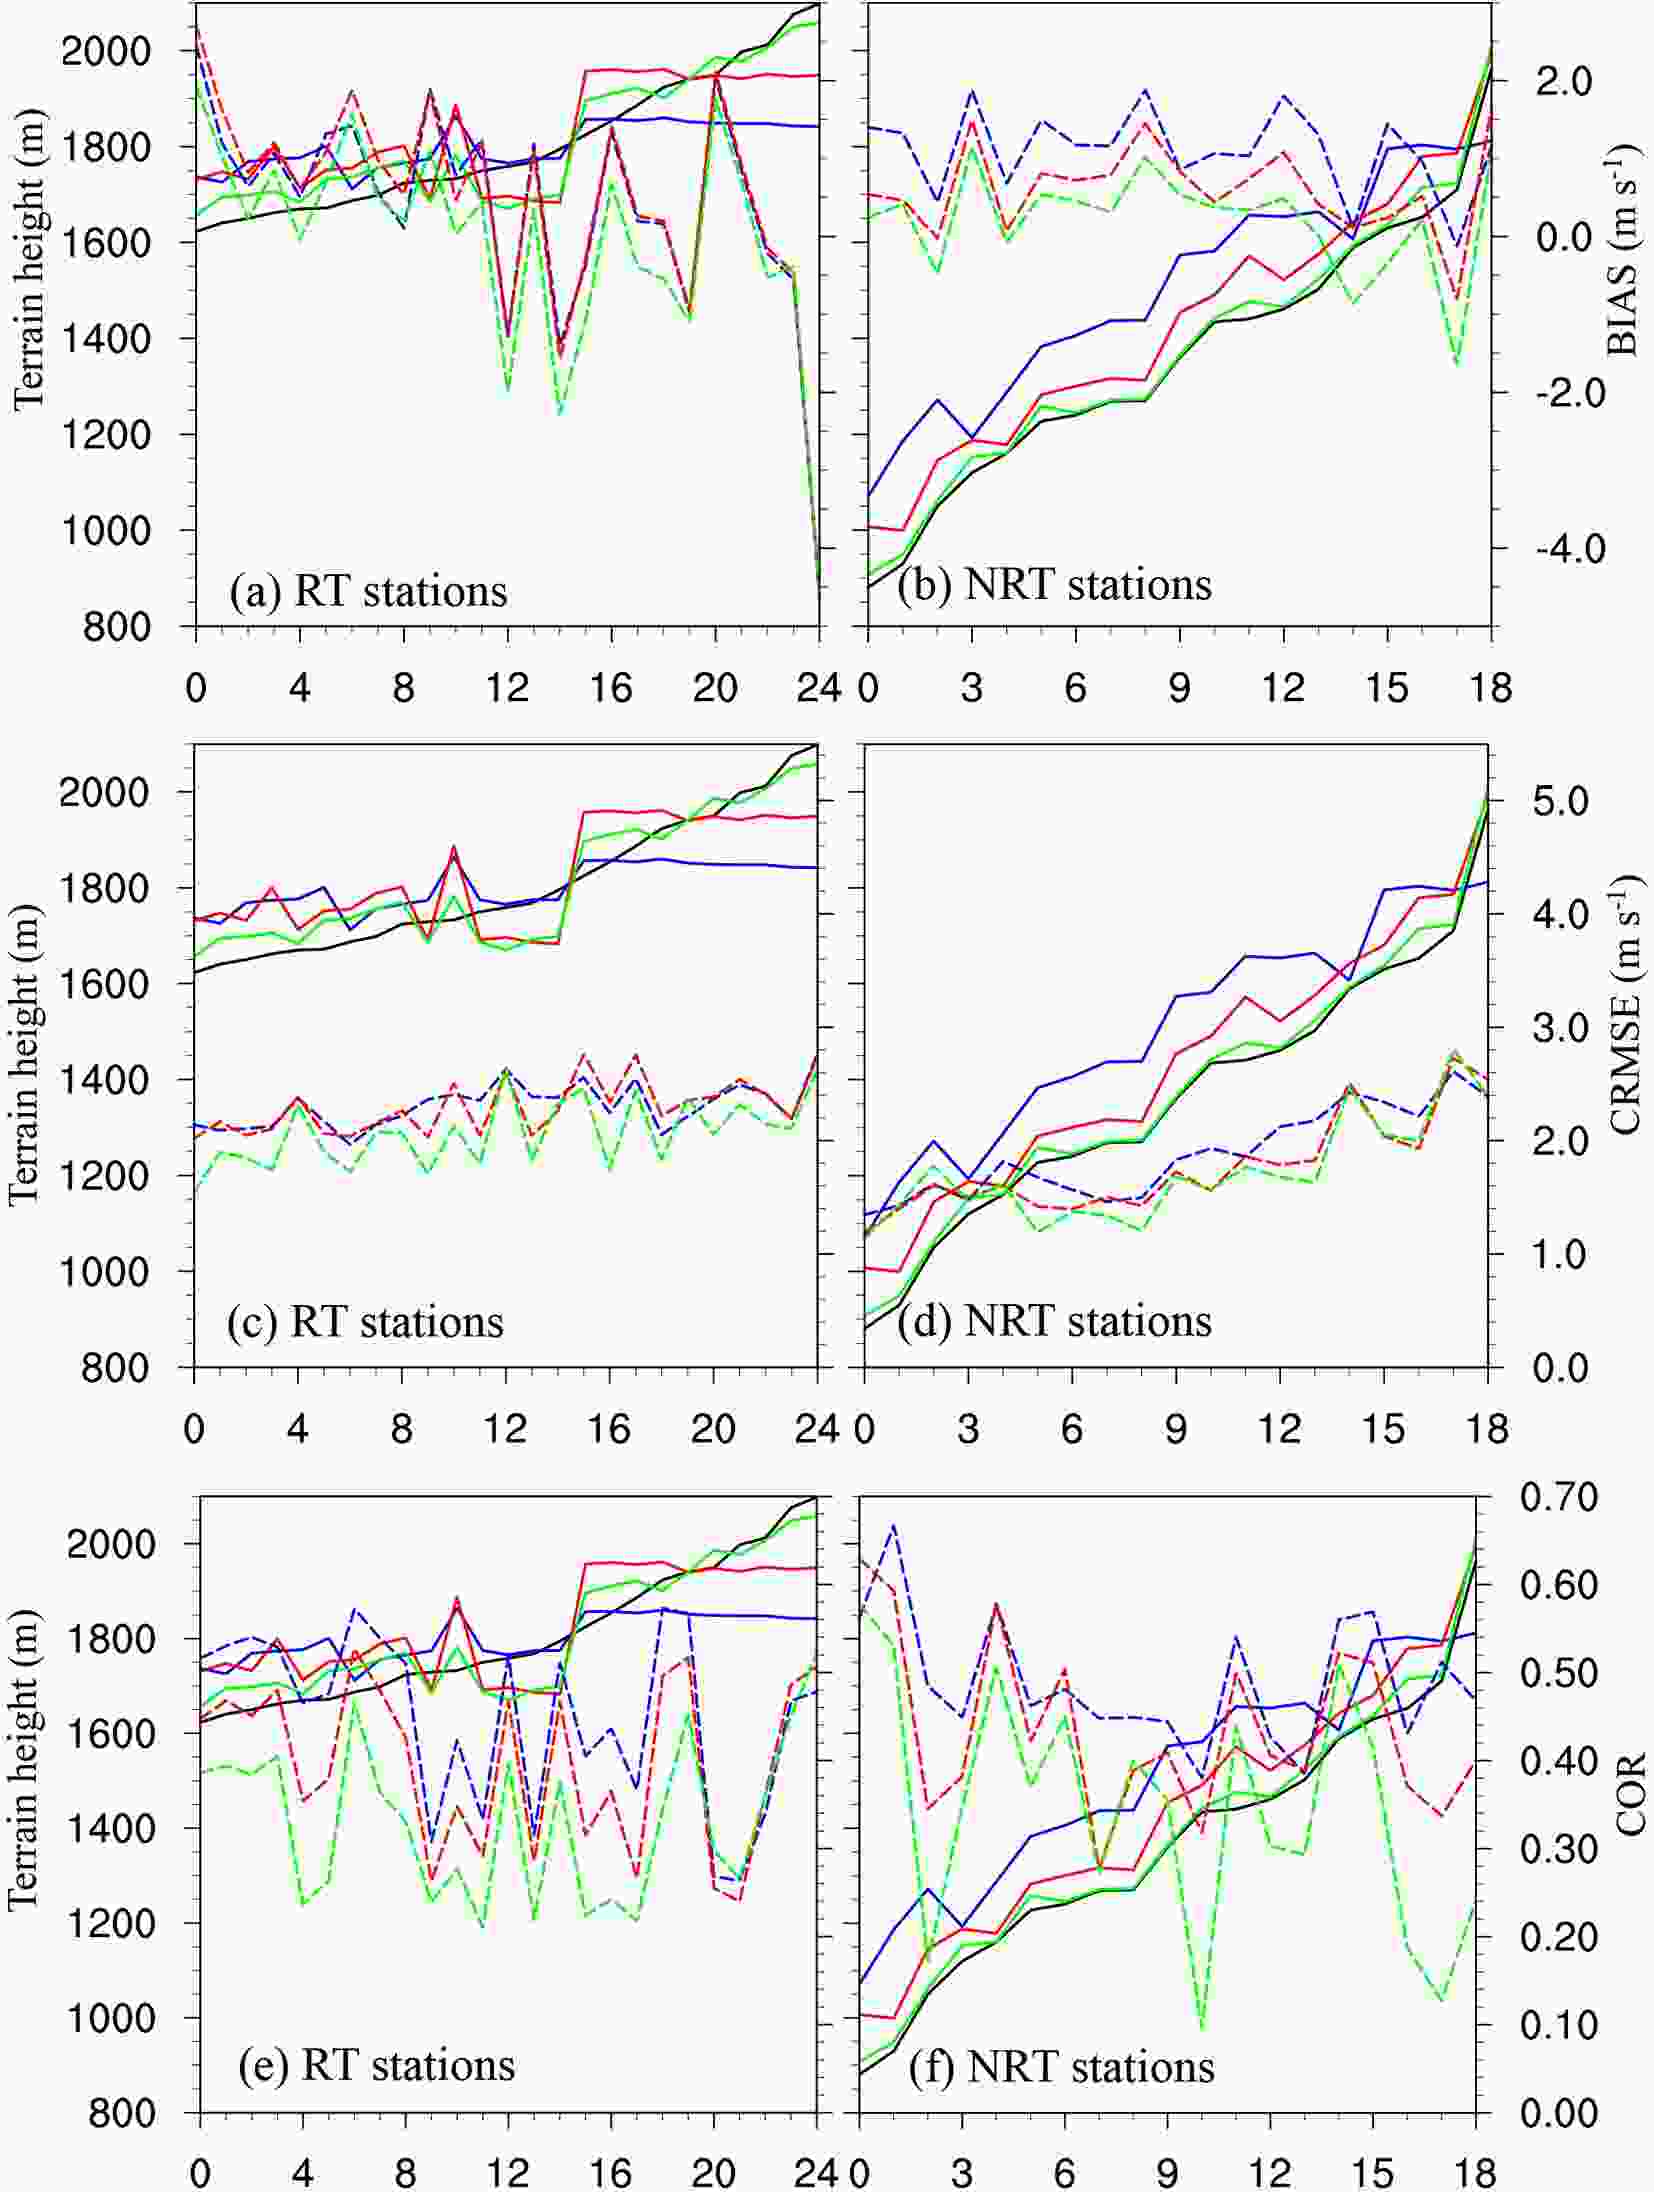 Figure5. Change in (a, b) BIAS, (c, d) CRMSE and (e, f) COR at the RT and NRT stations (x-axis), which are arranged from the lowest to highest elevation according to the actual terrain elevation. The blue color indicates the 4.05-km grid, the red color indicates the 1.35-km grid and the green color indicates the 0.45-km grid. The solid lines are the station elevations with the actual terrain elevation in black. The dashed lines indicate BIAS, CRMSE and COR.
By comparing Figs. 5a, c, and e to Figs. 5b, d, and f, the elevation of the RT stations ranges from 1625 to 2100 m, and most of the NRT stations are lower than the RT stations, corresponding to Fig. 2a. Generally, the 0.45-km-grid model terrain (the green solid line) matches the actual terrain (the black solid line) the best, followed by the 1.35-km grid (the red solid line) and 4.05-km grid (the green solid line). However, the terrain biases at the RT and NRT stations are quite different. At the RT stations, the model exhibits great limitations in resolving the terrain fluctuations in the competition areas in Chongli. Compared to the smoothly changing actual terrain from the lower RT stations to the higher RT stations (the black solid line in Figs. 5a, c, and e), the model terrain elevation fluctuations in each of the domains are notable (the colored solid lines in Figs. 5a, c, and e). However, at the NRT stations, the trend of the actual terrain elevation is successfully resolved by the 0.45-km grid and mostly represented by the 4.05- and 1.35-km grids, although a higher bias occurs in the coarser grids.
Although many factors can induce a bias in the near-surface wind speed forecasts, the mismatch between the actual and model terrains is always an important factor. As indicated by Jiménez and Dudhia (2012), an unresolved topography produces an additional drag, which is a possible reason for the frequent overestimation of the near-surface wind speed by the WRF model. Vionnet et al. (2015) indicated that the details of complex terrains may notably influence near-surface wind speed forecasts, such as wind deceleration in sheltered areas or wind increase due to the presence of crests and mountains (Raderschall et al., 2008).
In Figs. 5a–b, the BIAS change trend with the terrain elevation is not very evident, but the model tends to have a lower bias at low altitudes (the NRT stations) than at high altitudes (the RT stations). At most NRT stations, the model exhibits an overestimation of the near-surface wind speed. Underestimation occurs at some of the NRT stations with a terrain elevation higher than 1600 m. At the RT stations, overestimation also occurs at low altitudes, but a very large underestimation is observed at the RT stations above 1700 m. The CRMSE positive trend with increasing terrain elevation is more evident, as shown in Figs. 5c–d, and larger CRMSE values are observed at the RT stations. Compared to BIAS and CRMSE, the fluctuations in COR with increasing station elevation are much larger, ranging from 0.2 to 0.6 at the RT stations and from 0.1 to 0.68 at the NRT stations.
Generally, increasing the horizontal resolution from the kilometer to subkilometer scale results in lower BIAS and CRMSE values (Figs. 5a–d), with the exception of the high-altitude RT and NRT stations. At these stations, a higher (positive or negative) BIAS is observed at the finer resolution (in the 0.45-km grid). This is different from the results of Duan et al. (2018), in which resolution refinement reduces the wind speed forecast error, or of Vionnet et al. (2015), where the underestimation is reduced at the finer resolution due to its ability to capture a crest. The underestimation at the high altitudes in the coarser domains is likely due to the negative terrain bias (the solid lines in Fig. 5), namely, the model is unable to discriminate the details of the high peaks of the terrain (Vionnet et al., 2015). However, a better resolution of terrain details may produce more drag in the PBL parameterization scheme and thus result in a larger underestimation in the finer domain (the 0.45-km grid) (Jiménez and Dudhia, 2012). These uncertainties make it difficult to accurately forecast the near-surface wind speeds in Chongli under such complex terrain conditions.
The performance of the two postprocessing methods in calibrating the 10-m wind speed forecasts at the RT and NRT stations is shown in Figs. 6 and 7, respectively. As shown in Figs. 6a–c and 7a–c, both methods can successfully reduce the notable bias in the raw WRF forecasts. The various postprocessing methods result in lower spatial variabilities than that of the raw WRF forecasts. In particular, the high negative bias at the high-altitude RT stations is also evidently reduced. The highest bias of –4.5 m s–1 at the highest station (2100 m, Figs. 6a–c) is successfully reduced to –0.5–0.5 m s–1. This result is similar to the global analysis results in the above subsection.
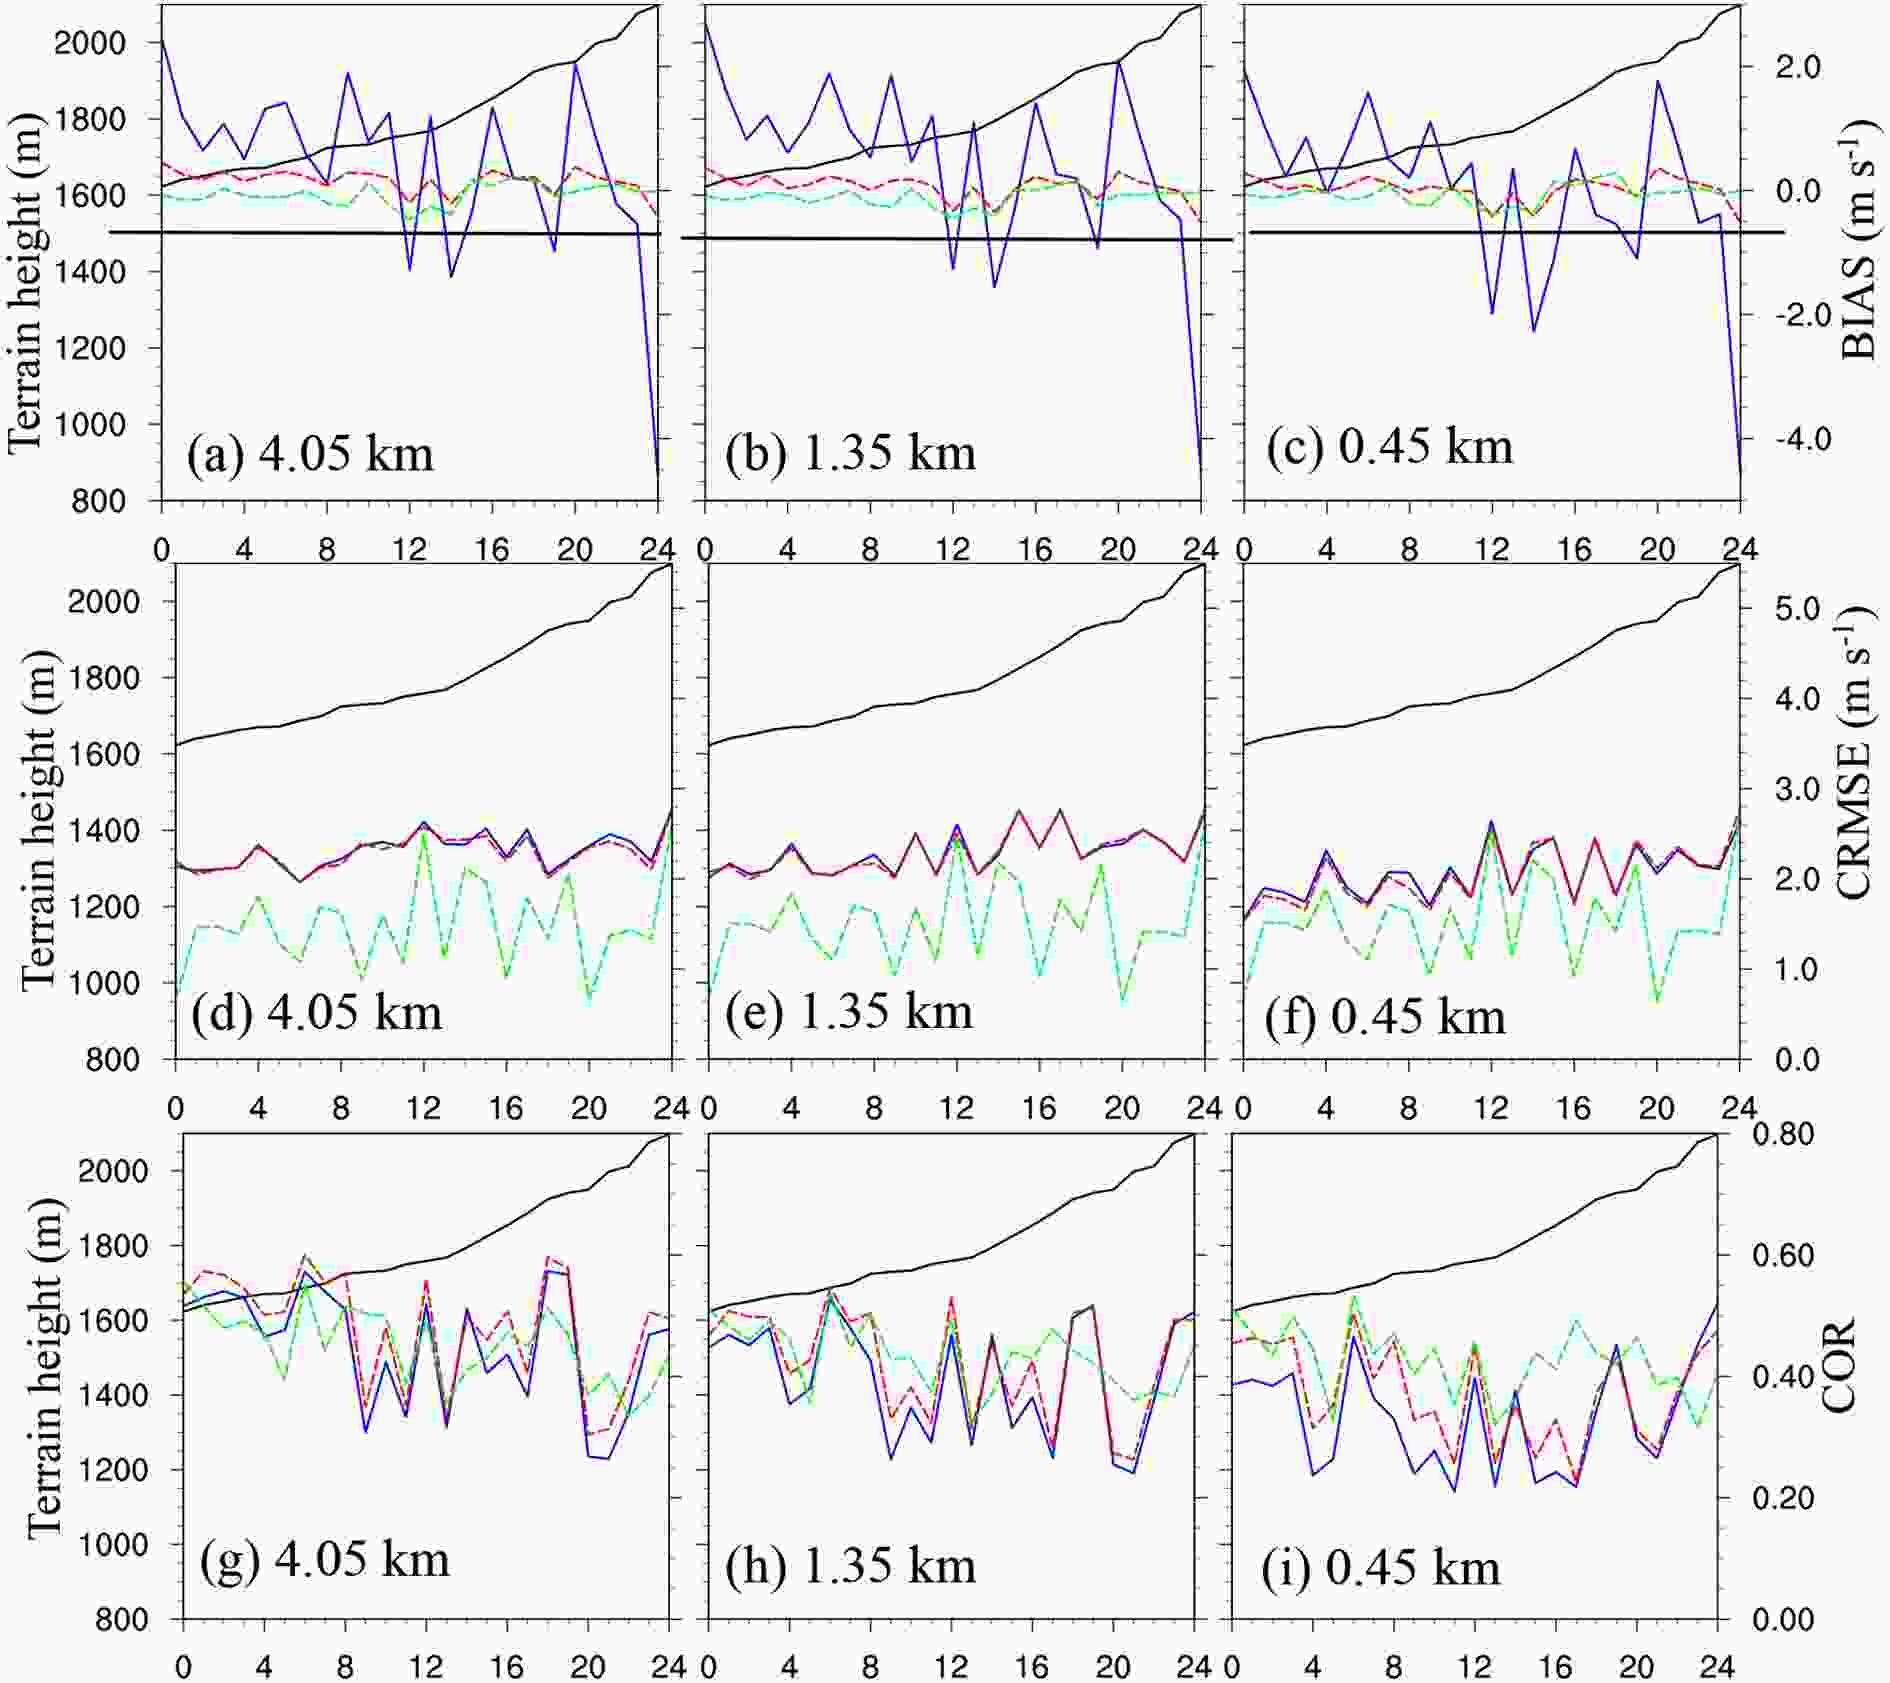 Figure6. Change in BIAS, CRMSE, and COR of the raw model forecasts (blue solid lines) and the forecasts obtained with the DA (red dashed lines) and AN (green dashed lines) methods of the 10-m wind speed at the RT stations (x-axis), which are arranged from the lowest to highest elevation according to the actual terrain elevation: (a, d, g) 4.05-km grid; (b, e, h) 1.35-km grid; and (c, f, i) 0.45-km grid. The black solid lines are the actual terrain elevations.
 Figure7. Same as Fig. 6 except for the NRT stations (x-axis).
On reducing the random errors measured by CRMSE, the DA method is almost unable to reduce the random errors, as the red lines nearly coincide with the blue lines in Figs. 6d–f and 7d–f. Nevertheless, the AN method exhibits a clear potential for CRMSE reduction. In addition, the AN method also performs better in improving COR (Figs. 6g–i). However, it seems that the COR improvement at the RT stations is not as large as that at the NRT stations (Figs. 7g–i).
2
3.3. Diurnal variations in the errors
The diurnal cycle is a basic characteristic of the surface variables in the PBL due to the influence of surface heat and momentum fluxes. The accurate simulation of the diurnal variations in near-surface variables is one of the most difficult tasks in NWP models. Although the various PBL parameterization schemes can basically reproduce the diurnal variations in the surface wind speed, the resulting errors are often large. Zhang et al. (2004) found that PBL parameterization schemes tend to underestimate the surface wind speed during the day and overestimate it at night. However, with the presence of nocturnal jets, positive bias errors of 10-m wind speed forecasts were observed in the analysis of Zhang et al. (2013). In our evaluations, the diurnal variations in both the systematic (BIAS) and random (CRMSE) errors of the WRF raw 10-m wind speed forecast are significant.Figures 8 and 9 show the temporal variations in BIAS, CRMSE, and COR at the different horizontal resolutions and for the various forecast methods at the RT and NRT stations. Here, BIAS, CRMSE, and COR are computed with all available observations and predictions across all the stations and times at a given forecast time (Np = stations × times). As shown in Figs. 8a–c and 9a–c, the bias of the raw model forecasts exhibits a distinct diurnal cycle at both the RT and NRT stations. In the 4.05-km domain (Figs. 8a and 9a), the bias exhibits a trough after sunrise in the early morning, followed by a ridge in the afternoon before sunset, a small trough during sunset and a wide ridge throughout the night over one cycle in the first 24 hours of the forecast, and a similar cycle is observed over the next 24–48 hours of the forecast. Corresponding to this diurnal pattern, the WRF model tends to strongly underestimate the 10-m wind speed in the early morning, which is then greatly overestimated in the afternoon, and the notable overestimation persists throughout the night until sunrise at the RT stations (Fig. 8a). At the NRT stations, systematic overestimations are observed throughout the diurnal cycle (Fig. 9a). In particular, over one cycle, a minimum bias occurs at the NRT stations in the early morning, but this situation does not last long in the finer domains. In the 1.35- and 0.45-km domains (Figs. 8b–c and 9b–c), the diurnal pattern is slightly different from that in the 4.05-km domain with the absence of the small-amplitude ridge and trough at sunset. In addition, it is observed that the whole cycle moves from a positive bias toward a negative bias with increasing model resolution. This results in a persistent decrease in the positive bias during the nighttime and an increase in the negative bias during the daytime. In particular, with increasing model resolution, the model performance improves at night but deteriorates during the day. This phenomenon occurs at both the RT and NRT stations, and the daytime negative bias at the RT stations is higher than that at the NRT stations (Figs. 8b–c and 9b–c). The finding whereby large underestimation occurs in the daytime surface wind speed forecasts at the RT stations in the finer-resolution domains is critical as most races only occur during the day.
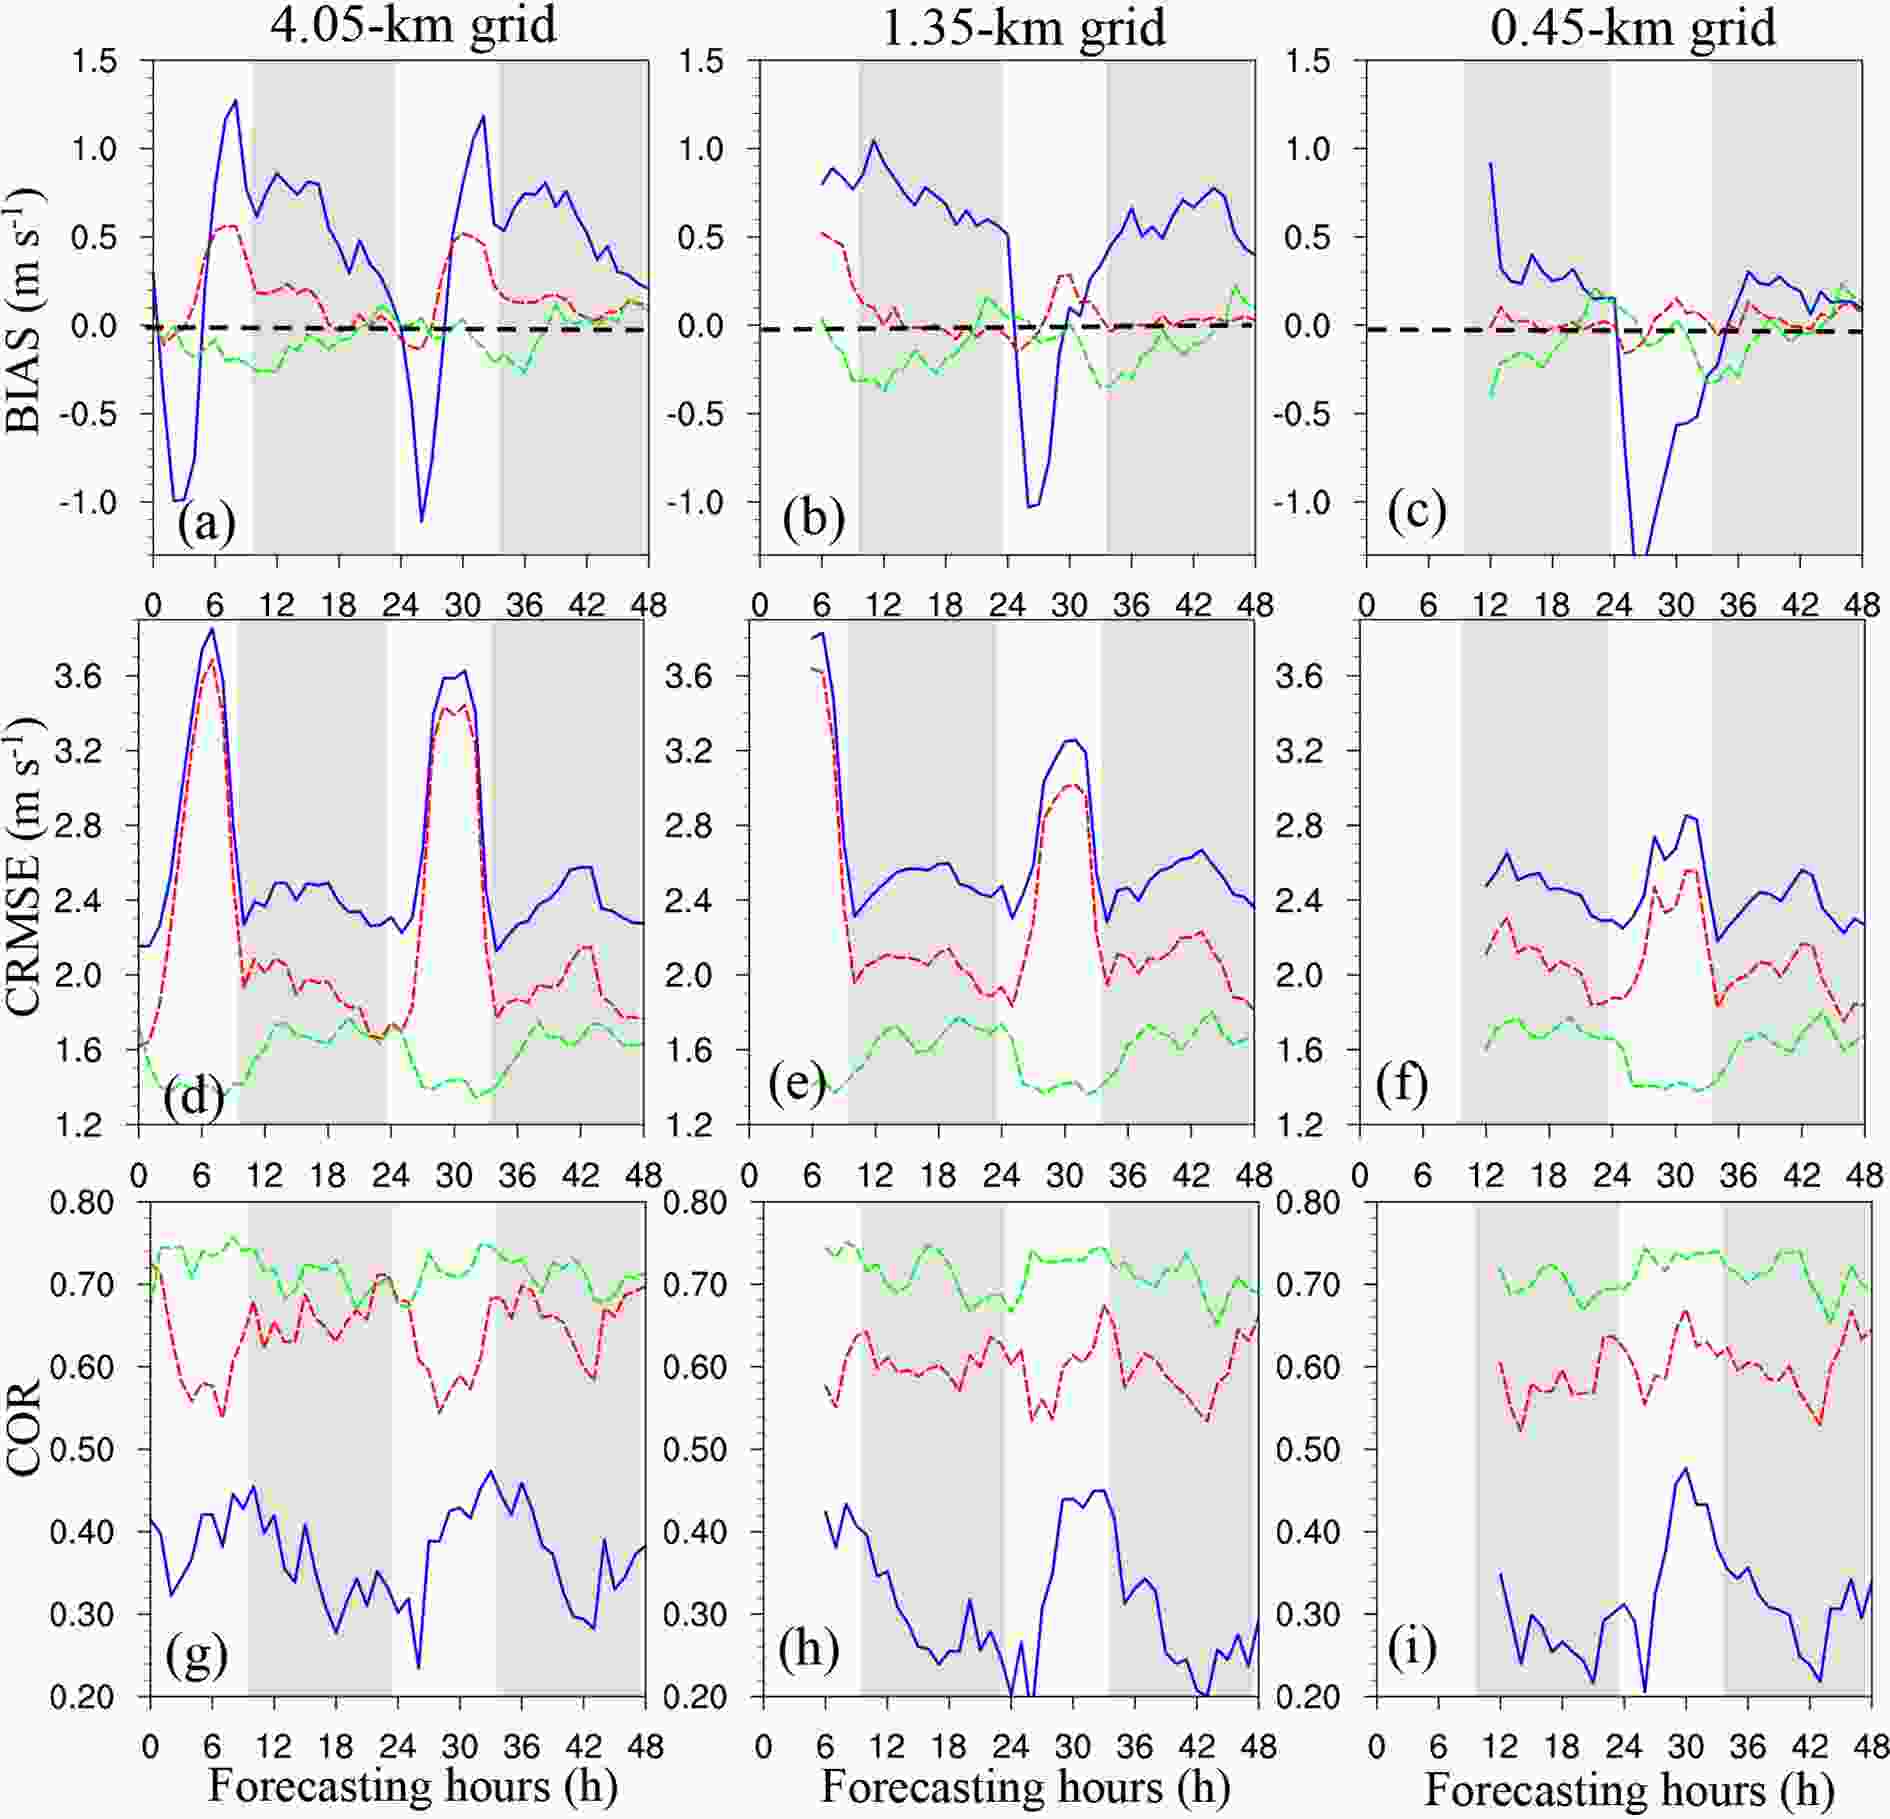 Figure8. Diurnal variations in BIAS, CRMSE, and COR at the different horizontal resolutions and for the various forecast methods at the RT stations. The x-axis is forecast hours. The blue solid line indicates the WRF raw forecast, the red dashed line indicates the DA method and the green dashed line indicates the AN method. The gray shaded areas indicate nighttime data, while the white areas indicate daytime data. This figure applies to sunrise and sunset in Chongli in January.
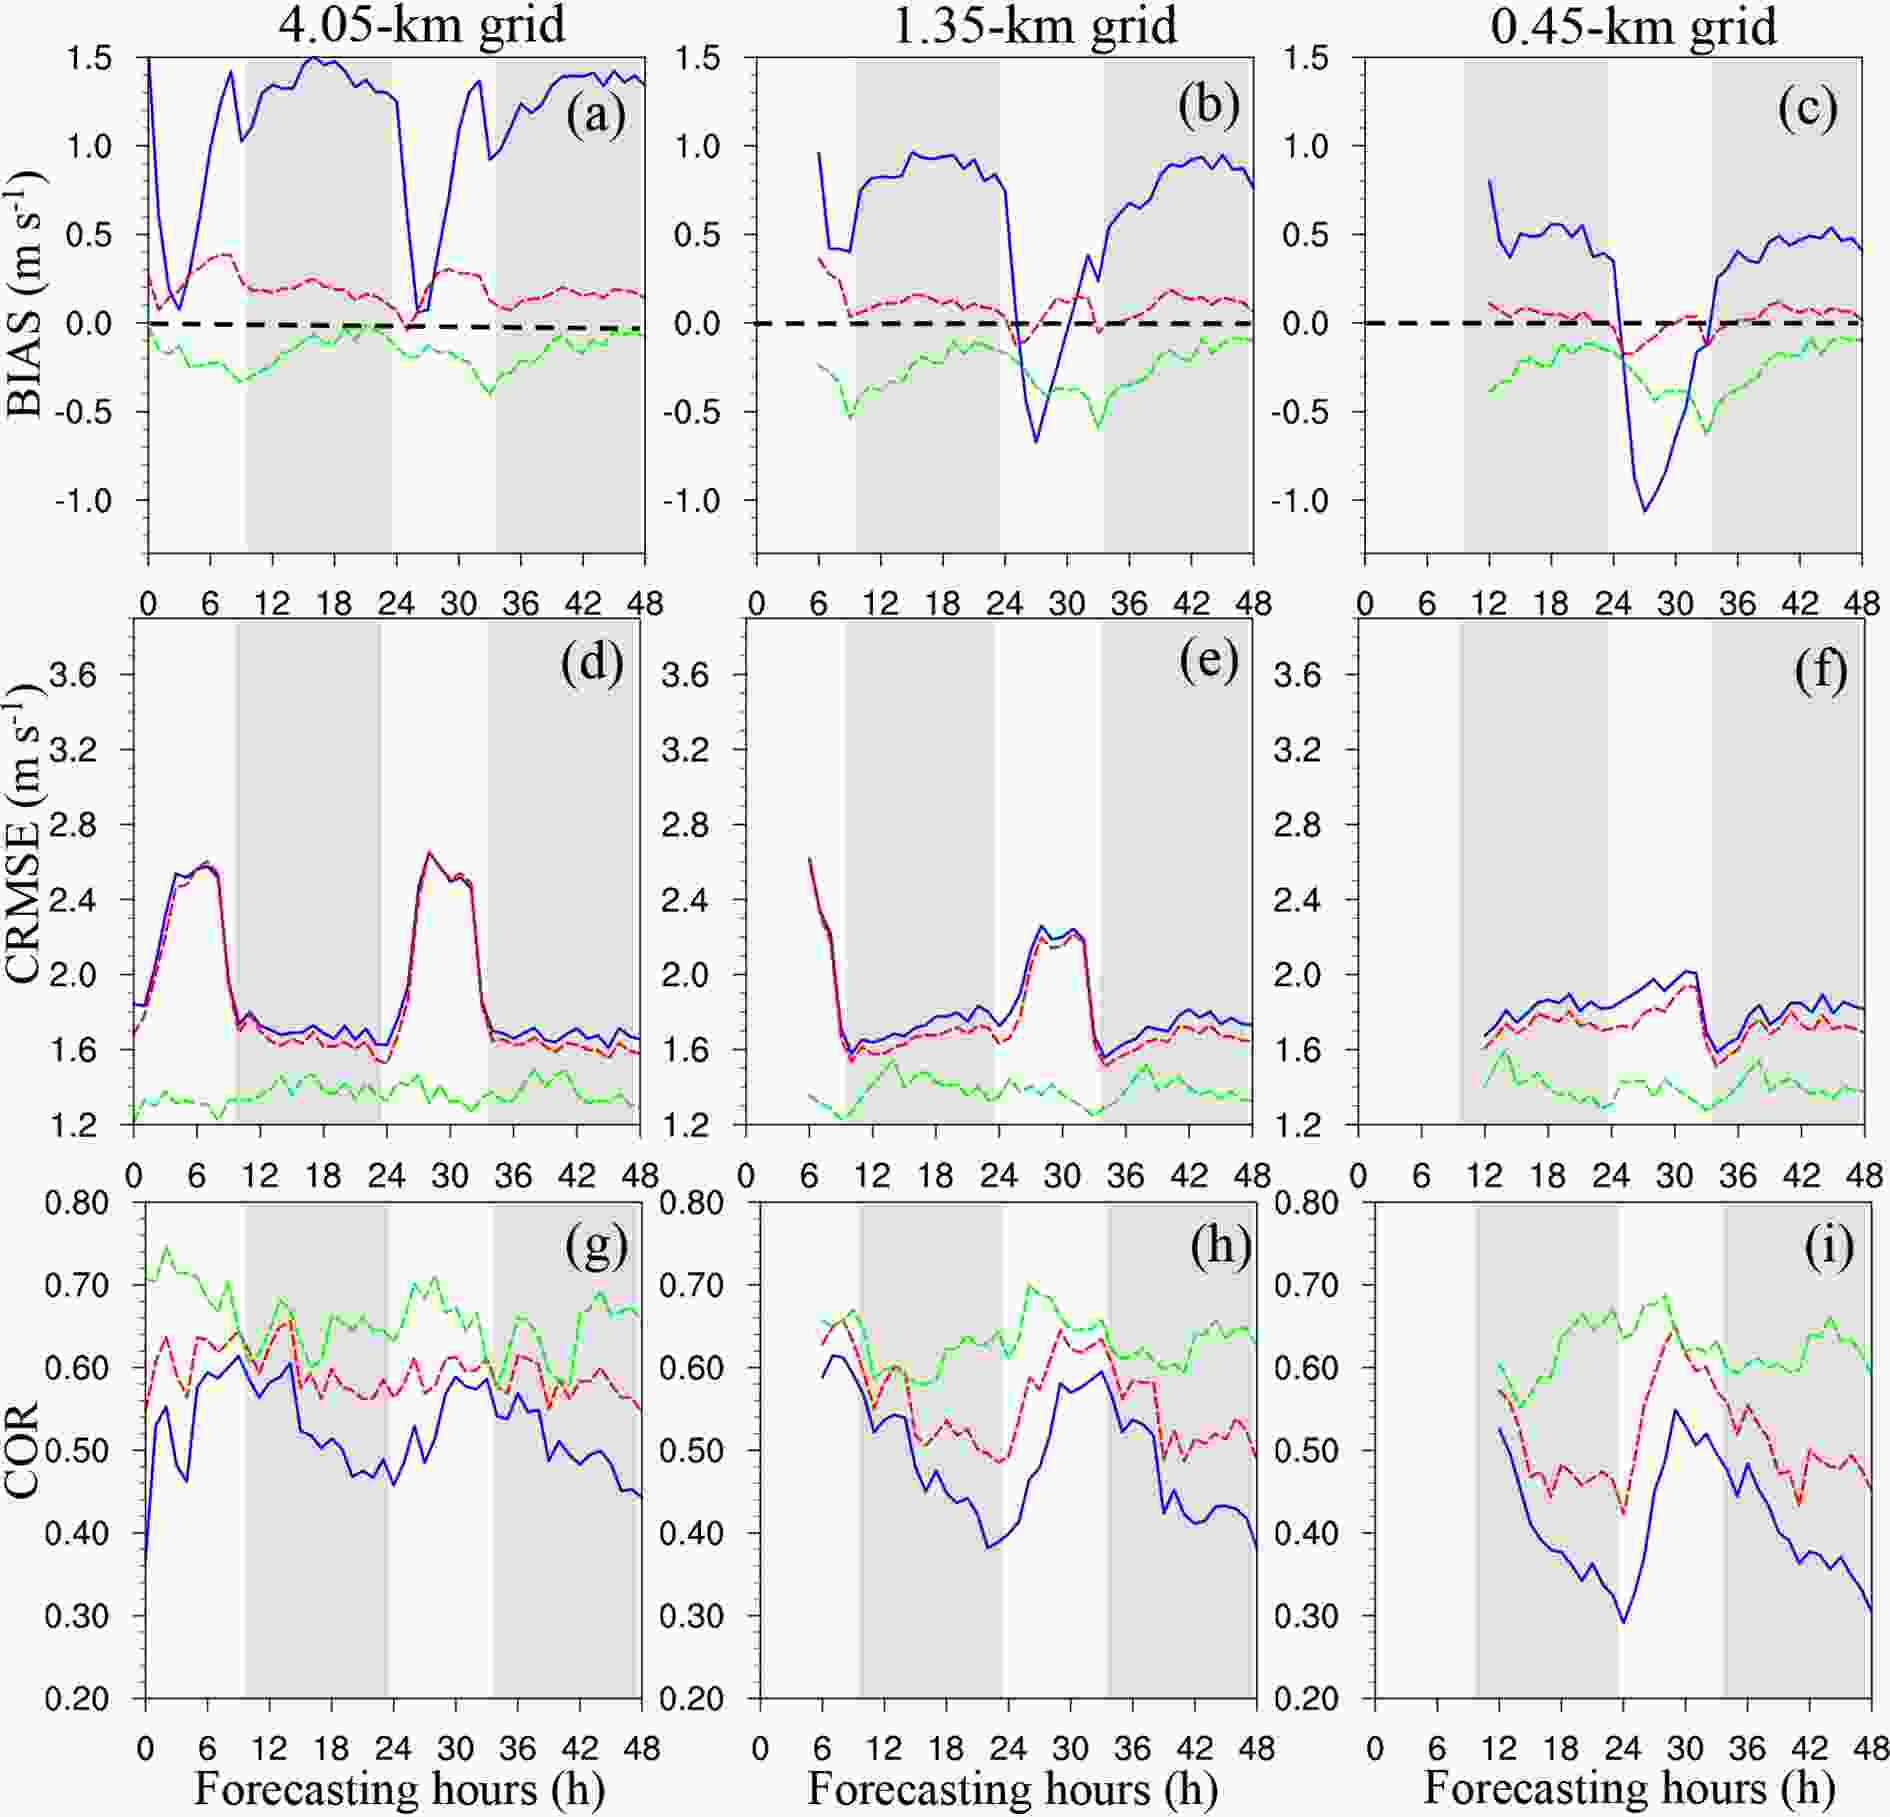 Figure9. Same as Fig. 8, except for the NRT stations.
In Figs. 8a–c and 9a–c, both methods greatly reduce the bias of the raw forecasts, with the diurnal variations in the bias notably decreasing after calibration. At the RT stations, the AN method outperforms the DA method in reducing the daytime negative bias to nearly zero (Figs. 8a–c), but its performance during the nighttime is not as good as that during the daytime. In the 1.35- and 0.45-km domains, the DA method attains better performance in reducing the nighttime positive bias. At the NRT stations, the performance of the AN method is not as good as that at the RT stations, where an evident negative bias is observed (Figs. 9a–c). The DA method performs better than the AN method either during the daytime or the nighttime.
Similar to BIAS, CRMSE of the raw WRF forecast also exhibits notable diurnal variations with high CRMSE values occurring in the daytime and low CRMSE values occurring in the nighttime (Figs. 8d–f and 9d–f). The first CRMSE peak is observed in the daytime approximately 6 h after sunrise, which then rapidly decreases until sunset. Right after sunset, CRMSE begins to increase again and exhibits a second peak at midnight or it remains constant throughout the night. Despite the similar pattern, CRMSE at the RT stations is much larger than that at the NRT stations, further reflecting the poor predictive skill of the WRF model in predicting the surface wind speed at the RT stations, especially during the daytime. With increasing horizontal model resolution, CRMSE during the daytime clearly decreases, but CRMSE does not change much during the nighttime for the raw WRF forecasts. CRMSE during the daytime decreases from approximately 3.6 to 2.8 m s–1 at the RT stations (Figs. 8d–f) and decreases from 2.6 to 2.0 m s–1 at the NRT stations (Figs. 9d–f) with the horizontal resolution increasing from 4.05 to 0.45 km. However, at night, there is little change.
Similar to the previous results, the random errors represented by CRMSE can be effectively reduced by the AN method, with the diurnal variations in CRMSE fluctuating less than those in the raw forecasts. At the RT stations, CRMSE of the AN method even exhibits a trough during the daytime, and the daytime CRMSE decreases to approximately 1.4 m s–1 (Figs. 8d–f).
The diurnal variations in COR of the raw forecasts are slightly different from those in BIAS and CRMSE, which reveals the highest correlation at sunset and the lowest correlation at sunrise. COR at the RT stations (Figs. 8g–i) is much smaller than that at the NRT stations (Figs. 9g–i). However, it is clear that the postprocessing methods attain a better performance in improving COR at the RT stations (Figs. 8g–i). Figures 8g–i and 9g–i show that the AN method can improve COR to almost 0.7, while the DA method yields a lower COR value.
Several questions, as described in the Introduction section, are addressed, and they are mostly answered through this study. A global evaluation across all the stations and times showed that increasing the horizontal resolution could improve the model’s 10-m wind speed forecasts by reducing both BIAS and CRMSE, especially at the RT stations. However, a more detailed analysis considering the wind speed intensity, the spatial variability, and the diurnal cycle revealed several problems at the RT stations, particularly those at altitudes higher than 1700 m. In terms of the 10-m wind speed forecasts at wind speeds higher than 5 m s–1, the WRF model exhibits a high negative bias, which even increases when the horizontal resolution is refined from the kilometer to subkilometer scale. Although the finer-resolution domain contains a much better description of the actual terrain, at certain high-altitude RT locations, a high positive or negative bias is observed, and the negative bias even increases with increasing horizontal resolution. The diurnal cycles of the model errors in forecasting the surface wind speed are quite evident at these RT stations, with a clear negative bias during the daytime. Moreover, the negative bias is also exaggerated in the subkilometer domain. The possible reasons for these problems are the mismatch between the actual and model terrains and misrepresentation of the near-surface physical processes in the PBL and LSM parameterization schemes. These uncertainties pose a great challenge to the near-surface wind speed forecasting in the competition areas in Chongli.
An evaluation of the use of the various postprocessing methods to calibrate the near-surface wind speed forecasts indicates that these methods improve the prediction accuracy of the near-surface wind forecasts and partly resolve the above problems. Both tested methods clearly reduce the bias, and the AN method is better able to reduce the random errors represented by CRMSE. In addition, the notable bias at high wind speeds and the forecast accuracy issues at the high-altitude stations and during the daytime are also notably reduced. These results indicate the necessity of applying postprocessing methods.
Acknowledgements. This study was supported by the Strategic Pilot Science and Technology Special Program of the Chinese Academy of Sciences (Grant No. XDA17010105), the National Key Research and Development Project (Grant No. 2018YFC1507104), the Key Scientific and Technology Research and Development Program of Jilin Province (Grant No. 20180201035SF), and the National Natural Science Foundation of China (Grant Nos. 41875056, 41775140, 42075013 and 41575065).
