HTML
--> --> -->Prior to meteorological satellite observations, records of typhoons covered only the periods of landfall and subsequent evolution. In recent decades, analysis of TC structure has been one of the most compelling problems in this field of TC research (Zhu et al., 2002). TCs spend most of their life cycles over the sea, and sudden changes in its strength or structure often occur at sea. However, owing to the lack of marine observational data with suitably high spatiotemporal resolutions, comprehensive understanding of the dynamics, thermal structure, and evolutionary processes of TCs remains lacking (Zhang et al., 2004; Halverson et al., 2006). The lack of understanding in these areas is one of the most important reasons for the limited improvement in TC intensity forecasting in recent years (Shu et al., 2011). Consequently, it is very important that suitable observations be obtained to improve TC forecasting skill.
By virtue of their maneuverability, flexibility, avoidance of risk to personnel, and other characteristics, unmanned aerial vehicles (UAVs) offer many advantages in comparison with other platforms for military, ecological, environmental and disaster surveys, and for taking meteorological measurements. With rapid advancement in UAV technology, applications of UAVs have become increasingly common in many fields and the prospects for further development are very broad. Aerial vehicle-based observations can be important for investigating marine typhoons (Bessho et al., 2006), obtaining information over terrestrial areas where construction of observing stations is difficult, and for verifying satellite observations (Lei, 2015). Therefore, airborne meteorological observations, especially those obtained using UAVs, may become indispensable sources of atmospheric data (Li et al., 2009). The level of acquisition of airborne meteorological observations can be an important indicator of the meteorological observational capability of a country, as it can reflect the degree of modernization of a national meteorological service.
In addition to monitoring typhoons, UAVs can be used to observe sea surface conditions such as near-surface air temperature, humidity, pressure, and wind, as well as sea surface temperature and salinity, all of which are very important for analysis and forecasting of typhoons (Cao et al., 2019; Chen et al., 2019). Clearly, comprehensive three-dimensional observations of oceanic and atmospheric conditions using UAVs represents an important trend in the field of atmospheric measurement. For these reasons, the China Meteorological Administration (CMA) has launched the “Petrel Project”, which will focus primarily on the comprehensive meteorological observing methods for typhoons and enhance the technical improvement of weather prediction and forecasting with the UAV platform, with the intent of establishing an operational mobile observing system for the CMA.
The Meteorological Observation Center (MOC) of the China Meteorological Administration has been working on selecting and deploying a large high-altitude UAV for field experiment data collection purposes since 2018. This effort is supported by the Ministry of Science and Technology of China and also through the Marine Meteorological Support Project. The MOC has selected the fixed-wing Yilong-10 UAV and has coordinated and carried out the installation of an airborne dropsonde system, a millimeter-wave cloud radar, and other instruments aboard the UAV for typhoon observation. The MOC also oversaw the development and engineering of other new remote observation platforms, including marine, unmanned surface vessels (USVs), drifting buoys, and intelligent reciprocating horizontal drifting radiosonde systems. Furthermore, they developed aircraft data receiving, processing, and command systems, as well as other related ground support systems. During June–August 2020, the first comprehensive three-dimensional field observation experiment over the South China Sea, the “South China Sea Experiment 2020” or “Petrel Project” for short, was undertaken by MOC in collaboration with 12 other institutions (including the AVIC Chengdu Aircraft Industry (Group) Co., Ltd., Hainan Provincial Meteorological Bureau, and the manufacturers of installed instruments). The 58-day experiment used the high-altitude large Yilong-10 UAV. The main tasks of the project included verification of the performance and overall adaptability of the UAV and its meteorological payload, as well as the development of the overall design of the field observation experiment. The tasks accomplished include the timely deployment of typhoon observation experiments over the South China Sea, successfully obtaining needed observational data, exercising procedures of observation–forecast interactions in field conditions, and exploring the feasibility for the establishment of a mobile, emergency operational observation system to process UAV-based observations.
2.1. Experiment design and plan
The area selected for South China Sea Experiment 2020, shown in Fig. 1, is a region where TCs occur frequently; it is in the central part of the South China Sea (northern boundary: Qionghai Boao, southern boundary: Xisha). Hainan Boao Airport (19.15°N, 110.47°E) was selected as the base of operations for the Yilong-10 UAV flights up to 10 km in elevation. A solar-powered USV took controlled navigation observations in the zone of UAV operations. In addition, drifting sea surface observations were obtained by both buoy No. 20005, deployed 51.1 km southeast of the coast of the city of Wanning, and buoy No. 20006, deployed 103.3 km southeast of the coast of the town of Li’an in Lingshui County. An intelligent reciprocating radiosonde system was deployed at Sansha Meteorological Observing Station. This system is capable of data collection during both ascent and descent, as well as when drifting horizontally in the stratosphere. These devices together provided comprehensive three-dimensional data collection within the experimental zone. The specific data collection routes and patterns are shown in Fig. 1. Figure1. Location of study area, layout of the comprehensive experiment, and trajectories of sea equipment in the South China Sea
2
2.2. Aircraft platform and equipment involved in the experiment
32.2.1. UAV and meteorological payload
The experiment used the high-altitude UAV Yilong-10, which is a fully autonomous platform (see Fig. 2). The vehicle’s flight ceiling was 12 km and the experimental cruise altitude was 10 km. Its total payload was more than 400 kg capable of speeds of up to 550 km h?1, and the flight duration was at least 5 h. Figure2. The Yilong-10 UAV used in the experiment (Carried underneath the wings of the UAV are the dropsonde systems.)
The dropped sounding system used in the experiment was hung in pods underneath both wings of the UAV (Fig. 2). The system included the pod structure, radiosonde, signal receiver, radiosonde receiver antenna, GPS navigation antenna, radiosonde delivery mechanism/dropping mechanism, and a controller. Each pod can load up to 24 radiosondes that can acquire measurements with the following accuracy: temperature: ±0.2°C, relative humidity: ±3%, air pressure: ±1 hPa, wind speed: ±0.5 m s?1. The range of the receiver is up to 150 km.
The millimeter-wave cloud radar was installed on the belly of the aircraft. The observation modes included the vertical fixed-point sensing mode and the vertical scanning mode, the upper limit of the observing distance is about 16 km. The measured parameters included the reflectivity factor (Z), radial velocity (Vr), and spectral width (W). The radial resolution was 30 m and the angular resolution was 1.6°.
3
2.2.2. Unmanned surface vessel
The solar-powered USV was equipped with a control system, sensor system, and communication system. It observed temperature, air pressure, humidity, wind direction, and wind speed at 1.5 m above the sea surface, as well as sea surface temperature, salinity, shortwave radiation, and other parameters, while traveling at a speed of 3–5 knots. Observations were acquired at 1-min intervals. The observation modes included the navigation mode, positioning mode, and drifting mode, and the communication was conducted via the Beidou navigation and communication satellites.3
2.2.3. Drifting buoy
The marine meteorological drifting buoys used were linked via the Beidou navigation and communication satellites. The observed variables included near-surface air temperature, air pressure, wind velocity as well as sea surface temperature and salinity. The observations were acquired at 10-min intervals.3
2.2.4. Intelligent reciprocating horizontal drifting radiosonde system
The horizontally drifting radiosonde system was tracked using satellite navigation (see Fig. 3). It was comprised of carriers, payloads, and ground-based receiving equipment. The carriers included an outer balloon, an inner balloon, and parachutes. The outer and inner balloons acted as carriers during ascent and horizontal drift, respectively, while the parachute acted as the carrier during descent. The payloads included a separator and a radiosonde. The purpose of the separator was to separate the inner balloon and the parachute. The system can measure temperature, humidity, wind velocity, and air pressure, regardless of whether the radiosonde is ascending, descending, or drifting within the stratosphere.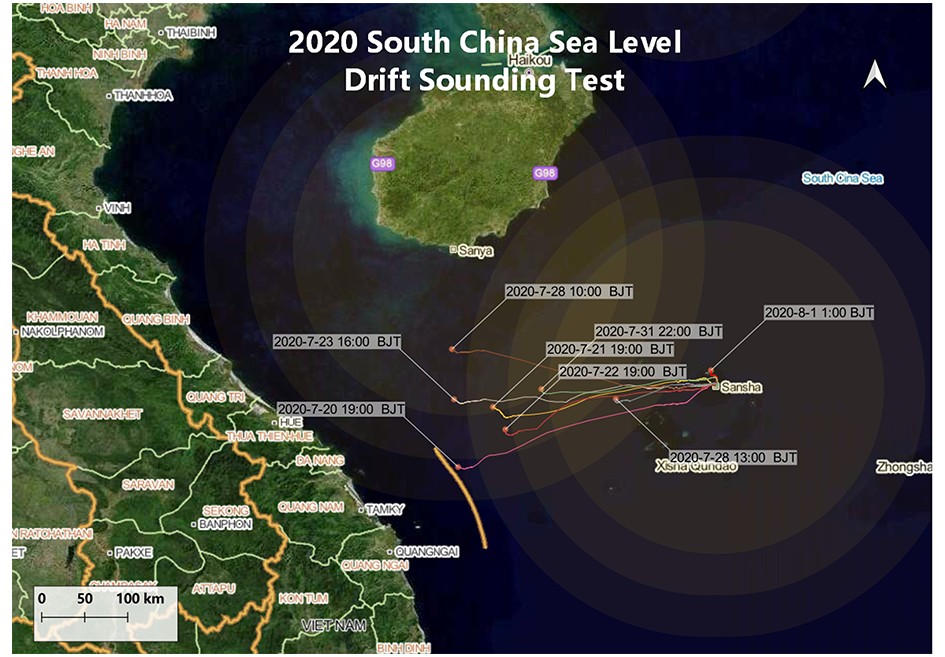 Figure3. Trajectories of intelligent reciprocating horizontal drifting radiosondes released during the South China Sea Experiment
3.1. Observing experiment
In order to carry out typhoon observations, three UAV flights were conducted on 25 June, 2 July, and 12 July, 2020. These flights were used to validate and optimize the functional performance of the UAV, payload, and data transmission links. On July 19, a fourth flight obtained measurements of atmospheric temperature, humidity, wind direction, wind speed, air pressure profiles, and cloud data from the sea surface to 10 km altitude. Additionally, the flight recorded observations of the cloud structures such as cloud height and cloud thickness, as well as, microphysical characteristics (e.g. reflectivity factor) of the cloud system above the sea for the first time. During the 5 week period from June 25 to August 1, eight intelligent, reciprocating horizontal drifting radiosondes (IRHDR) were released from the Xisha Upper-air Observatory (Fig. 4). The USV and two drifting buoys were deployed in the experiment region on 23 July 2020. Figure4. Observational data of the USV (July 28, 2020 to August 2, 2020)
At 0700 UTC on 31 July 2020, a tropical disturbance was upgraded to a tropical depression by the Center Meteorological Observatory, and it was named "Sinlaku (2020)" at 0700 UTC on 1 August 2020 over the South China Sea. Notification of the tropical depression (16.9°N, 113.4°E) was first issued at 0600 UTC on July 31. At that time, the USV and drifting buoys were observing continuously in the sea area affected by the low pressure system. At 1400 UTC on July 31, an IRHDR was released, which found a substantial increase in humidity at the height of 6–8 km, attributable to the tropical depression. During 0100–0300 UTC on August 1, data acquired by the USV and buoys were provided in real time to the Typhoon Forecast Center of the China Meteorological Administration. Furthermore, at the request of forecasters, the experiment staff navigated the USV into a designated maritime area. The closest distance of the USV to the center of the low pressure was 2.4 km. The measured sea level pressure was 996.8 hPa (see Fig. 4), and the intensity of the typhoon center was 992 hPa, (i.e., “the typhoon intensity level”), according to the Central Meteorological Observatory of CMA. The drifting buoys also observed the change of pressure. At 0600 UTC on August 1, the Typhoon Forecast Center designated Senlake a named typhoon, and the observation systems on the sea surface played an important role in determining the location and intensity of the typhoon.
During the afternoon of 2 August, the UAV undertook a mission to observe the peripheral cloud system of Typhoon Sinlaku (2020). The UAV took off from Boao Airport and rose to a height of 10 km. During the flight, it successfully obtained 30 sets of dropsonde profiles (Fig. 5) and millimeter-wave cloud radar data for nearly 80 min which completed the CT-type scanning of the peripheral cloud system of Typhoon Senlake, and transmitted the dropsonde profile data back to the ground-based command system in real time. Together with the instruments on UAV, the USV, drifting buoys, horizontal drifting radiosondes, and operational Fengyun meteorological satellites, a comprehensive data set was assembled that was then used to perform model verification and evaluation. Initial data analyses indicated that the South China Sea Experiment 2020 has achieved its pre-set goals, and a comprehensive three-dimensional data set on a typhoon using unique combinations of observing platforms was obtained for the first time; such systems can help fill operational gaps in observation of typhoons near China.
 Figure5. Map showing positions of UAV dropped soundings (satellite cloud image of Himawari-8 has been added)
2
3.2. Observational data
The observational data set acquired during the South China Sea Experiment 2020 of the “Petrel Project” includes five types of 21 observational parameters and one UAV flying video file (which can be used for auxiliary analysis of data quality and cloud systems). The total size of the data set is 880 Gb. Much of the data was obtained for the first time, for the given settings, and is therefore scientifically very valuable. The quality of the dropsonde and horizontal drifting soundings (except the horizontal drifting temperature data) exceeds the World Meteorological Organization standards. Analyses and evaluation of the data are ongoing. Specific information regarding the data is outlined in Table 1.| Observation equipment | Data time | Data size | Observation elements | Data interval |
| Dropping radiosonde system | July 19, August 2 | 34 sets | Temperature, relative humidity, air pressure, wind direction, wind speed, geopotential height | 1s |
| Millimeterwave cloud radar | July 19, August 2 | 110 min | Reflectivityfactor, speed, spectral width data | 250 ms |
| Unmanned surface vessel | July 22 to August 2 | 315 h | Sea surface temperature, relative humidity, wind speed, wind direction, air pressure, shortwave radiation, sea temperature, sea surface salinity | 1 min |
| Horizontaldrift sounding | July 31 | 7 sets | Temperature, relative humidity, air pressure, wind direction, wind speed, geopotential height | 1 s |
| Drifting buoy | July 23 to August 2 | No. 20005, 251 h; No. 20006, 245 h | Sea surface temperature, relative humidity, wind speed, wind direction, air pressure, shortwave radiation, sea temperature, sea surface salinity | 10 min |
| UAVforesight camera data | August 2 | 240 min | During the operation of the UAV, thetakeoff-flight-landing video recorded by the foresight camera | 1 s |
Table1. Specific details of the South China Sea Experiment 2020 data set.
(2) Optimization of instrumentation platforms: Goals are to include identification of problems with the UAV and other equipment platforms used in the experiment, improving the UAV platform and the payload instruments, and carrying out the remaining phases of the Petrel Project.
Acknowledgements. This project is supported by the Petrel Meteorological Observation Experiment Project of the China Meteorological Administration and the “Adaptive Improvement of New Observation Platform for Typhoon Observation (2018YFC1506401)” of the Ministry of Science and Technology. We wish to express our sincere gratitude to the Chengdu Aircraft Industry (Group) Co., Ltd., Hainan Meteorological Service, and all the other institutions and personnel that participated in this experiment.
