HTML
--> --> -->Lightning detection networks are capable of accurately measuring lightning discharge channels and other lightning properties, including location, current, and polarity. In recent decades, lightning activity and the electrical characteristics of various convective systems have been thoroughly investigated, with valuable contributions from lightning detection networks such as the Lightning Mapping Array, the Low Frequency Array, low frequency Lightning Network, Low-frequency E-field Detection Array, and so on (Betz and Meneux, 2014; Thomas et al., 2004; Rison et al., 2016; Shi et al., 2017; Hare et al., 2018). Lightning networks could provide lightning discharge information to investigate the charge structure of thunderstorms (MacGorman et al., 2005; Rison et al., 2016), as well as the relationships among lightning, kinematics and microphysics (Carey and Buffalo, 2007; Deierling et al., 2008; Emersic et al, 2011). Lightning has a good relationship with radar reflectivity, especially with the strong radar echo (Petersen et al, 2005; Liu et al., 2009). Lightning has a significant correlation with ice volume and updraft (Carey and Rutledge, 1996; Petersen et al, 2005; Carey et al., 2019). Deierling et al. (2008) found that lightning activity shows a solid relationship with precipitation and non-precipitation ice mass, and the correlations between total lightning and ice mass flux were even higher. Usually, lightning increases with strengthening updraft, falling cloud-top temperature and increasing graupel volume, but lightning decreases when wet hail has formed in the new updraft (Emersic et al., 2011; Marra et al., 2017). Furthermore, Buiat et al. (2017) found that high ice water content and a relatively high effective radius of ice particles are favorable for occurrence of cloud-to-ground (CG) strokes. In terms of the close relationship between lightning and convective parameters, therefore, lightning frequency could be an indicator for predicting disastrous weather events of thunderstorms, such as hail, wind gusts, and heavy rainfall (Deierling and Petersen, 2008; Schultz et al., 2017; Tian et al., 2019).
A normal tripole charge structure with a middle negative charge layer and an upper and lower positive charge layer is usually recognized as the most common conceptual model of a thunderstorm. However, observations and numerical simulations indicate that thunderstorm charge structures are likely to be much more complex than predicted by these simple models (Stolzenburg et al., 1998; Calhoun et al., 2014).
The electrical characteristics of supercell storms have been investigated since the 1950s, sometimes revealing unusual charge structures (MacGorman, 1993). Lightning frequency in mesocyclone regions of supercell storms is greater than in most other types of thunderstorm (MacGorman et al., 2005). Gilmore and Wicker (2002) examined the relationship between the mesoscale environment and the electrical activity of a supercell storm, and found that vertical wind, convective available potential energy (CAPE), and hydrometeor mixing ratios have important influences on the charge structure.
MacGorman et al. (2005) and Wiens et al. (2005) examined the electrical features of supercell storms during the Severe Thunderstorm Electrification and Precipitation Study (STEPS) and found that such storms have an inverted charge structure with a positive charge in the middle level and a negative charge layer in the upper and lower layer, respectively. Calhoun et al. (2013) analyzed lightning characteristics in a supercell storm, the results indicating that this high-precipitation tornadic supercell storm showed an inverted charge structure. Investigating the charge structure of supercell storms by numerical simulations has revealed different charge structures influenced by different electrification schemes, with results also showing that the simulated charge structure differs from the non-inductive scheme expected (Ziegler and MacGorman, 1994; Mansell, 2000; Barthe and Pinty, 2007; Sun et al., 2018). Kuhlman et al. (2006) performed simulations that captured the inverted tripolar charge structure of supercell storm observed during STEPS. Fierro et al. (2006) simulated the charge structure of a supercell and found that the supercell showed a positive dipole or inverted tripole charge structure by four different non-inductive charging parameterizations. Furthermore, simulations by Calhoun et al. (2014) revealed that charge structures can evolve from an inverted polarity tripole to more complex structures.
Here, we investigate lightning and electrical structures observed in a supercell storm that occurred on 13 June 2014 over metropolitan Beijing, whose complex terrain extending from the Yanshan Mountains in the northwest to the Bohai Sea in the southeast plays an important role in the generation of convective storms (Xiao et al., 2017). The studies mentioned above have shed new light on lightning activities of supercell storms, but the relationship between lightning characteristics and the properties of supercell storms warrants further exploration. Therefore, this study investigates the evolution and electrical properties of a supercell storm using multiple coordinated observations, including lightning network, S-band radar, X-band radar, sounding, and surface observations, as part of the Dynamic–Microphysical–Electrical Processes in Severe Thunderstorms and Lightning Hazards project (Qie et al., 2015).
2.1. Beijing Lightning Network
Lightning data used in this study were obtained from the Beijing Lightning Network (BLNET) (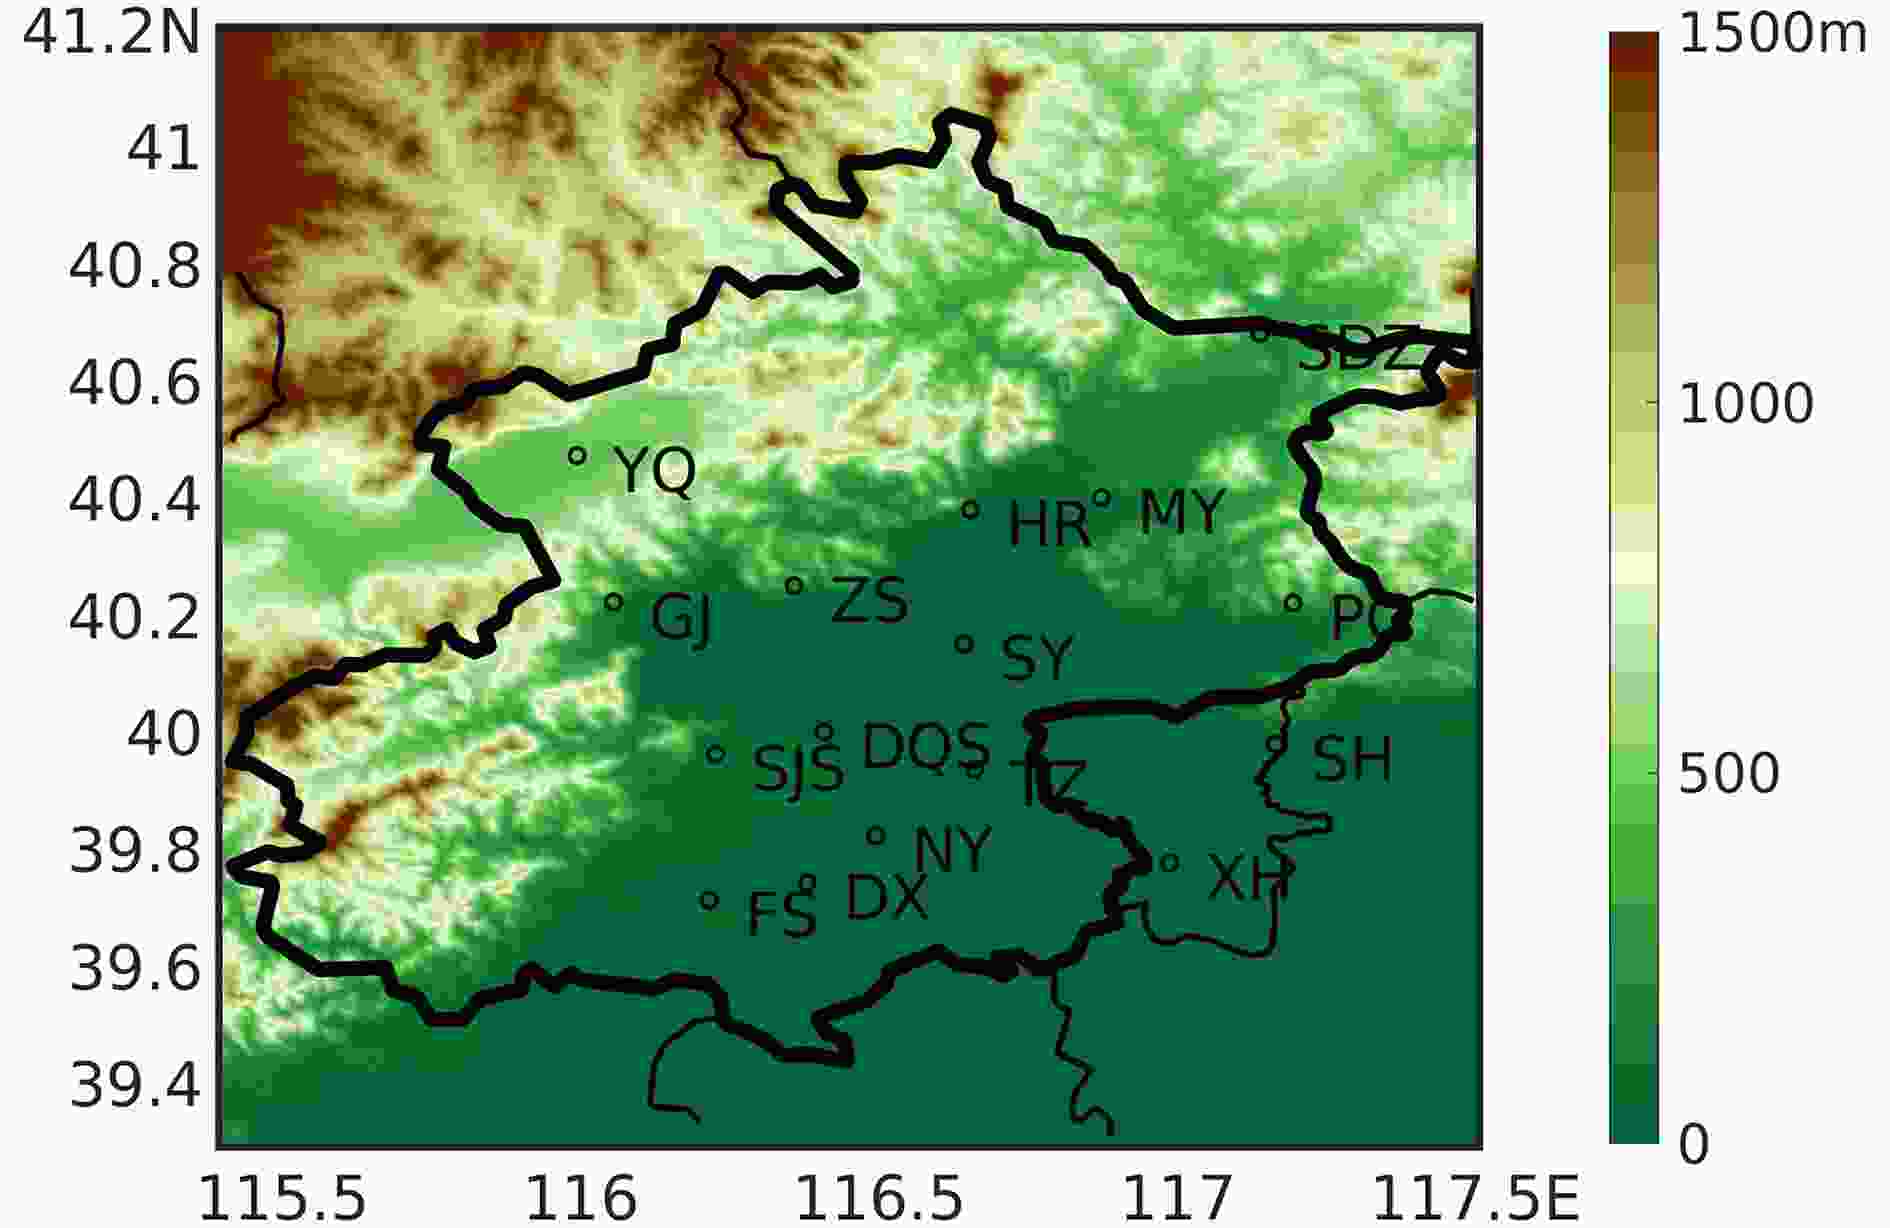 Figure1. Surface elevation of Beijing and the locations of the 16 sub-stations of BLNET. The lighter black line indicates the provincial border and the heavier black line indicates the boundary of the Beijing area.
2
2.2. Lightning data
The Chan algorithm and Levenberg–Marquardt method are adopted to determine the lightning location. In addition, two- and three-dimensional lightning radiation sources are retrieved from different bands to determine lightning positions. To determine accurate location, of each lightning flash, the signal of lightning pulses is detected simultaneously at no fewer than four stations. Following the method of Cummins et al. (1998), lightning observations within a 10-km range and within a 500-ms window are considered to be a single flash. The locations of CG flashes are determined by the position of the return stroke. Return strokes with positive and negative polarities are classified as +CG and negative cloud-to-ground (?CG) flashes, respectively. Generally, strong IC lightning flashes can be misrecognized as +CG flashes. Therefore, +CG flashes with currents < 10 kA are classified as IC flashes in this study. Finally, we can obtain both IC and CG in two dimensions and also acquire IC and CG lightning discharges in three dimensions by BLNET.2
2.3. Radar data
Radar data were obtained from an S-band Doppler radar located at (39.8°N, 116.5°E) and are available from the Beijing Meteorological Administration (Besides the S-band radar we also used data from an X-band dual-polarimetric Doppler radar located at (40.3°N, 115.8°E) with a 150-km radius range to obtain information on various hydrometeors. Precipitation observations were made at nine elevation angles: 0.5°, 1.45°, 2.4°, 3.35°, 4.3°, 6°, 9.9°, 14.6°, and 19.5°. Hydrometeors were classified using a fuzzy logic method and X-band dual-polarimetric radar data. Five unique radar parameters (Horizontal reflectivity (ZH), differential reflectivity (ZDR), specific differential phase (KDP), linear depolarization ratio (LDR), the coefficient between the horizontal and vertical power returns(ρhv)) were calculated by membership functions (MBFs). Twelve categories of hydrometeors were used as the MBF input parameters. Based on the rule base of the classification system, a series of IF–THEN rules were applied after the fuzzy parameters were calculated. To achieve the total effect of all the rules, rule aggregation was applied. After defuzzification, the aggregated results were converted into a single hydrometeor type (Liu and Chandrasekar, 2000).
In addition, high-resolution meteorological fields for wind, temperature, convergence field, and humidity were derived from the Variational Doppler Radar Analysis System (VDRAS) (Sun and Zhang, 2008) by assimilated radar observations obtained from four S-band radars at Beijing (39.8°N, 116.5°E), Tianjin (39.0°N, 117.7°E), Shijiazhuang (38.3°N, 114.7°E), and Qinhuangdao (39.8°N, 118.8°E), and two C-band radars at Chengde (40.9°N, 117.9°E) and Zhangbei (41.0°N, 114.4°E).
2
2.4. Meteorological data
The unique terrain of the Beijing area, with a plain adjacent to high mountains in the northwest and the gulf of the Bohai Sea in the southeast, combined with low-level northerly cold and southerly warm airflows, leads to the frequent generation of convective storms that form near the mountains and intensify over the plain. Synoptic conditions and local thermodynamics together influence the distribution and evolution of storms over Beijing. Southerly warm and moist air are forced upwards over the mountains, generating a windward upslope effect that favors the formation of convective storms (Chen et al., 2012; Yu et al., 2017). As storms move down from the mountains, the radar reflectivity of the convective system gradually intensifies by topographic forcing (Xiao et al., 2019). The generation and development of convective cells might also be influenced by urban effects in metropolis regions (Yu et al., 2017).3.1. Case overview
A supercell storm occurred on 13 June 2014 and moved from northwest to southeast, affecting most of the Beijing area. During the period of coordinated observations, the convective storm lasted for 8 h, generating modest amounts of hail, with surface reports of large (5 cm) hailstones. Wind gusts were observed at the surface, with peak gusts in excess of 28 m s?1 over the Beijing area.At synoptic scales, the supercell was influenced by a high-altitude cold vortex in the northeast at upper levels and wind shear at middle levels, and was supported by low-level warm, moist air. A sounding (data not shown) launched at 1400 LST (local standard time; UTC + 8) on 13 June revealed a large moist layer extending from the surface to high altitudes, with a CAPE value of 3000 J kg?1. The perturbation temperature and wind field retrieved by VDRAS clearly showed a cold air mass over northeast Beijing, which formed a strong cold pool corresponding to an intense convective system (Fig. 2). Cold-pool outflow, combined with southerly warm, moist airflow and northerly cold, dry airflow, leads to the formation of convective cells at the edge of the mountains that gradually intensify moving from the foothills to the plain. In addition, the high surface temperature in the metropolitan region resulted in a deep boundary layer, which favored thunderstorm formation. Thus, the downwind urban region became a convergence area for convection development.
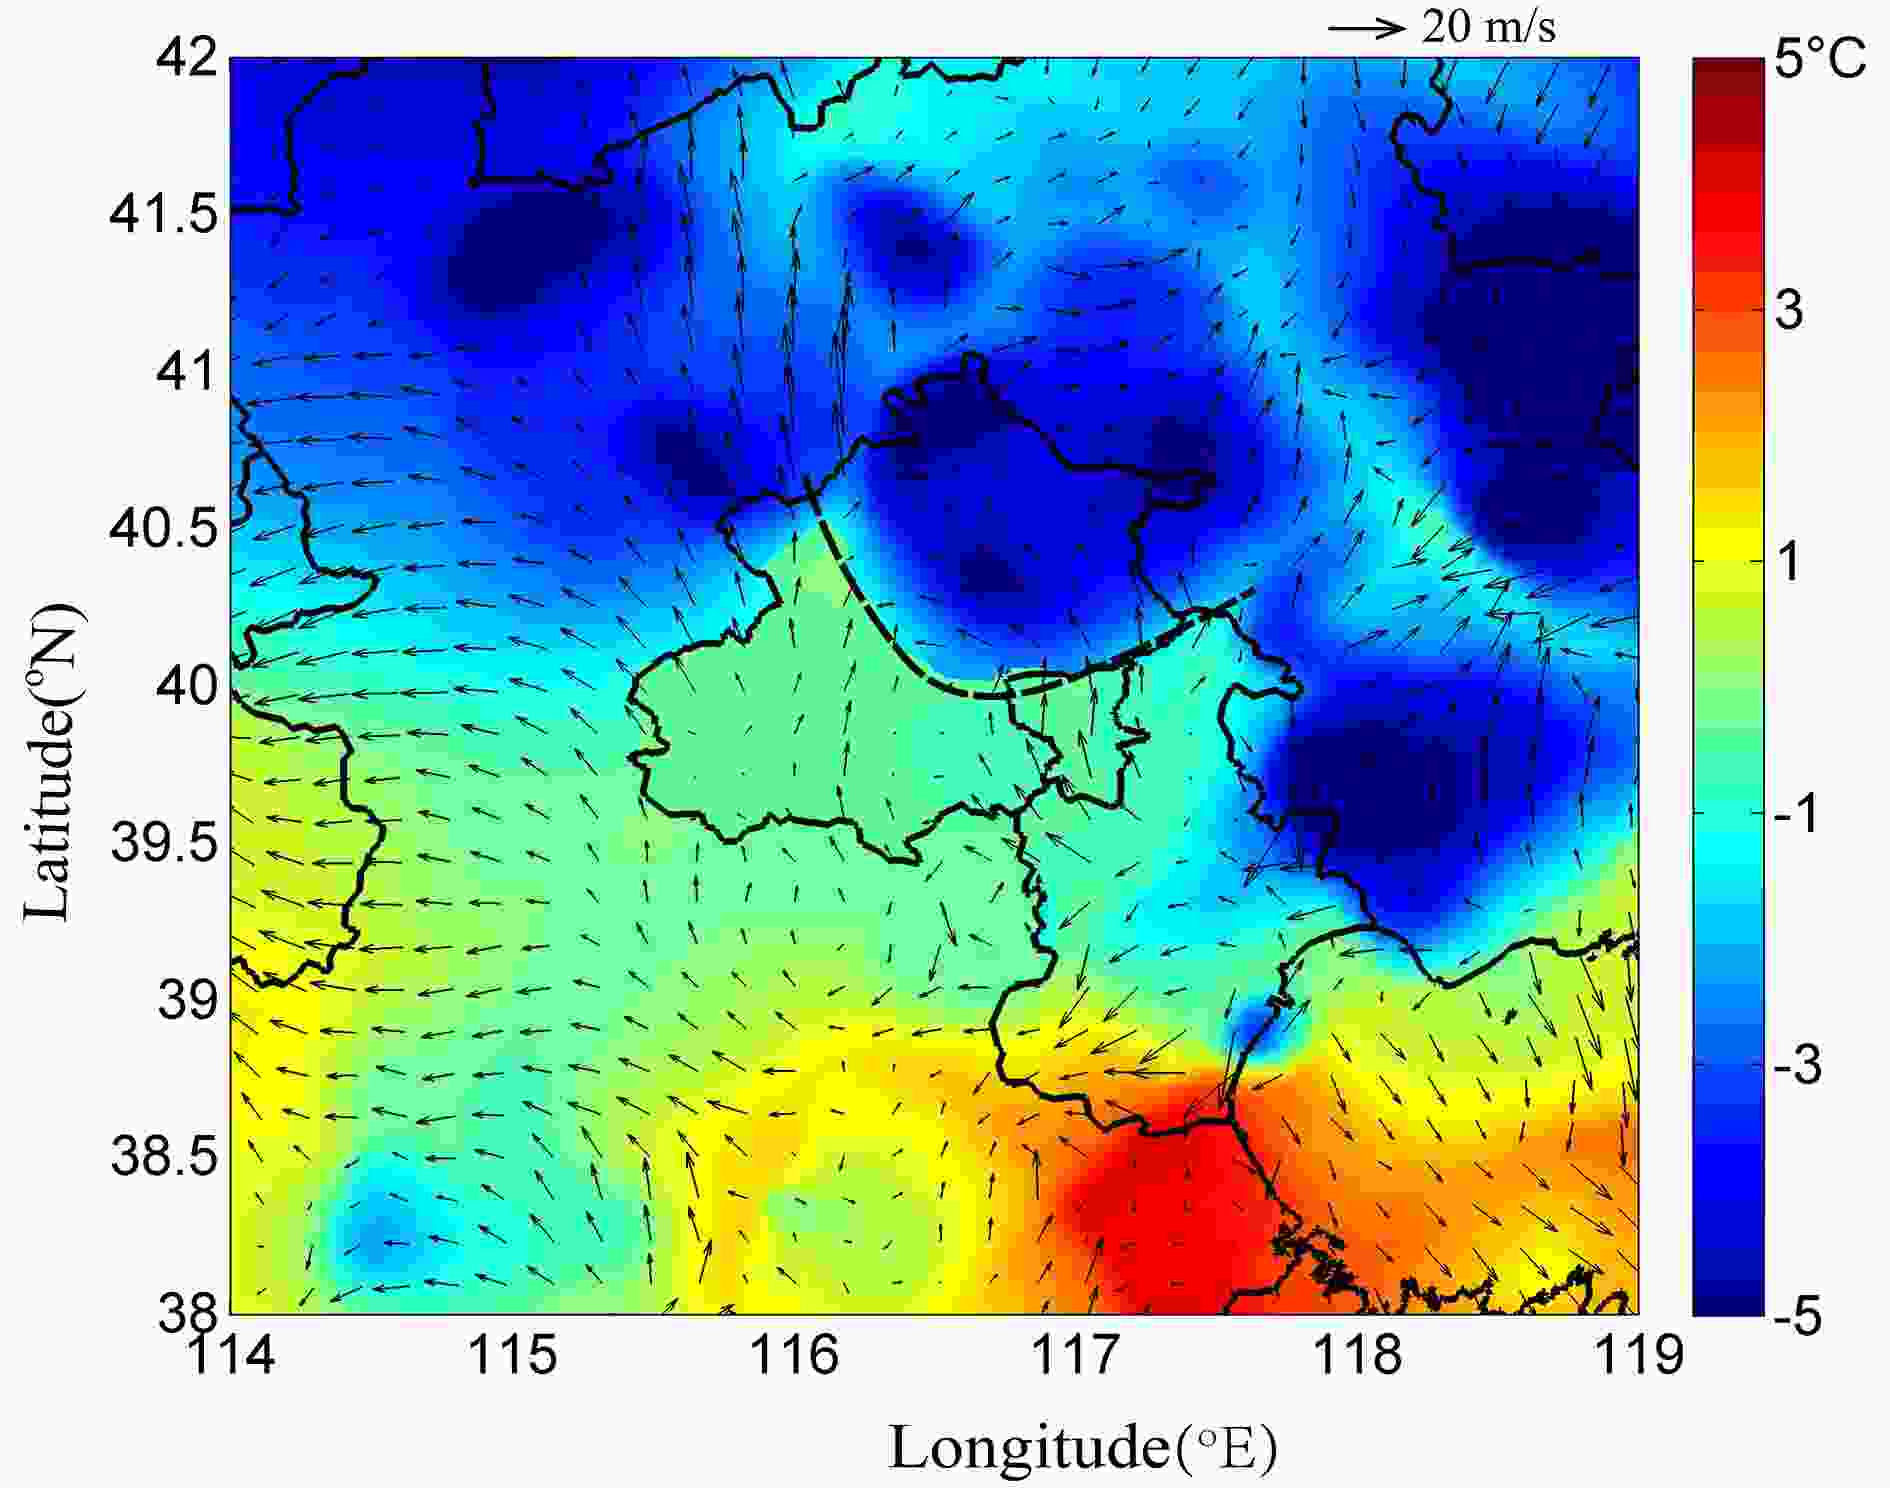 Figure2. Perturbation temperature and horizontal wind retrieved by VDRAS at the surface level at 1713 LST. The black dashed line stands for the surface outflow boundary of the cold pool.
2
3.2. Lightning activity of the supercell storm
Figure 3 shows the pathway of the supercell, from its arrival through urban Beijing to its departure. Due to the rapidly expanding scale of the supercell, only the convective region with strong radar reflectivity is superimposed on Fig. 3 from 1712 LST. Beginning at 1524 LST, a small storm cluster began rapidly forming a linear convective cell. At 1712 LST, it grew into a bow echo over the southeast urban area. As the supercell storm swept over Beijing urban area, the strong convective region gradually intensified and changed from a linear to a circular morphology. Concurrently, its rapid southwestward trajectory turned to southeastward. After hail reports ended, the supercell gradually converted to a linear mesoscale convective system (MCS). Figure3. Moving path of the strong convective region in the supercell. The dashed line stands for the outflow boundaries at different times.
The lightning superimposed on the composite radar reflectivity obtained from the S-band radar within a 6-min window is shown in Fig. 4. In the initial stage, as the gradually strengthening convective cell had a linear form and propagated southwards, the lightning frequency increased sharply, with +CG lightning dominating this stage. At 1700 LST, as the supercell developed into the mature stage, several convective cells merged with each other and continued to intensify, and the convective line began to curve into a circular shape, with lightning occurring mainly in the strong radar echo (> 40 dBZ) and +CG lightning still being more frequent than ?CG lightning. At this moment, the Doppler-derived updraft speed was > 28 m s?1 and the maximum radar reflectivity reached 68 dBZ. Subsequently, because of the convergence of surface winds, the path of the convective cell curved to the left, towards the southeast. The supercell storm appeared as a V-shaped gap in the radar reflectivity, while from the radial velocity the mesocyclone appeared at a higher angle and maintained for nearly 1 h (not shown here), forming a typical supercell system. A large relative velocity inflow existed at the near surface and outflow in the upper level, whilst inside the supercell there was a tilted updraft. Thus, the highly unstable air mass and the development of a significant rotating updraft supported the intensification and maintenance of the supercell. The strong cold pool contributed to the supercell’s intensification. At 1724 LST, after the storm changed its path, the strong radar echo (> 35 dBZ) presented a clear round shape and the strengthened convective region was located over the urban area. The frequency of IC and CG lightning increased sharply, reaching a maximum. During this period, corresponding to surface hail reports, IC lightning dominated, with the number of +CG lightning flashes being obviously larger than ?CG lightning flashes. Lightning was mainly concentrated in the convective region, and some of the lightning along a pathway defined as the transition zone connecting the convective and stratiform regions, sloped down to the trailing stratiform region, and a small fraction of the total lightning occurred in the stratiform region, in agreement with Liu et al. (2011). This phenomenon appeared throughout the life of the supercell and was most pronounced in the mature stage. After hailfall had ended, the morphology of the circular strong radar echo of the supercell converted to a linear MCS, and the number of ?CG lightning flashes increased obviously. At 1754 LST, the strong radar echo of the supercell started to weaken and decay, the lightning distributed densely in the strong radar echo, and the number of ?CG lightning flashes increased obviously. As the supercell entered the dissipating stage, its intensity and size decreased. At 1830 LST, a “quiet” period for +CG lightning, only IC lightning and ?CG lightning occurred during this period. Noticeably, ?CG lightning was most frequent and located mainly at the leading edge of the strong radar reflectivity (Fig. 4d). At 1842 LST, there was an evident decrease in the number of lightning events and a shift in their location to the stratiform region, with more frequent +CG lightning than ?CG lightning.
 Figure4. Composite radar echo obtained by S-band radar superimposed with the lightning within 6 min. Black dots indicate IC lightning, blue dashes indicate ?CG lightning, and black plus signs indicate +CG lightning. (a) 1624 LST, (b) 1700 LST, (c) 1724 LST, (d) 1754 LST, (e) 1830 LST, and (f) 1842 LST.
Figure 5 shows the evolution of lightning frequency within the supercell in 5-min windows. During the initial stage (1600–1700 LST), the lightning frequency gradually increased, with more +CG than ?CG lightning. As the supercell developed further, the lightning frequency increased dramatically, particularly IC lightning. During the mature stage, CG lightning increased rapidly with a high percentage of +CG lightning Moreover, the frequency of CG lightning reached a maximum before IC lightning did, as the high radar reflectivity (> 30 dBZ) of the supercell formed a circular morphology at that moment. MacGorman et al. (2005) pointed out that supercell storms favor frequent +CG lightning more than other storm types. Lightning frequency increased rapidly prior to surface observations of hail, and the occurrence of hail was accompanied by rapid +CG lightning, in agreement with previous work (Schultz et al., 2017). After the hail event ended, IC lightning decreased sharply, whereas CG lightning remained stable and frequent. Decreasing IC lightning was accompanied by increasing ?CG lightning, which reached its maximum and dominated this stage, instead of less frequent +CG lightning. The sharp increase in ?CG lightning and its dominance after the first report of hail may have been caused by the drag effect of solid particles falling, which reduced the distance from the negative charge region to the ground and increased the opportunity for negative discharge (Liu et al., 2009). Eventually, as the supercell storm weakened, the lightning frequency further decreased, with +CG lightning dominating CG lightning. Overall, the lightning activity of the supercell was dominated by IC lightning, with +CG lightning accounting for a high percentage, especially during the hailfall, early and late dissipating stages, and ?CG lighting dominated the CG lightning in the mature to early dissipating period of the supercell.
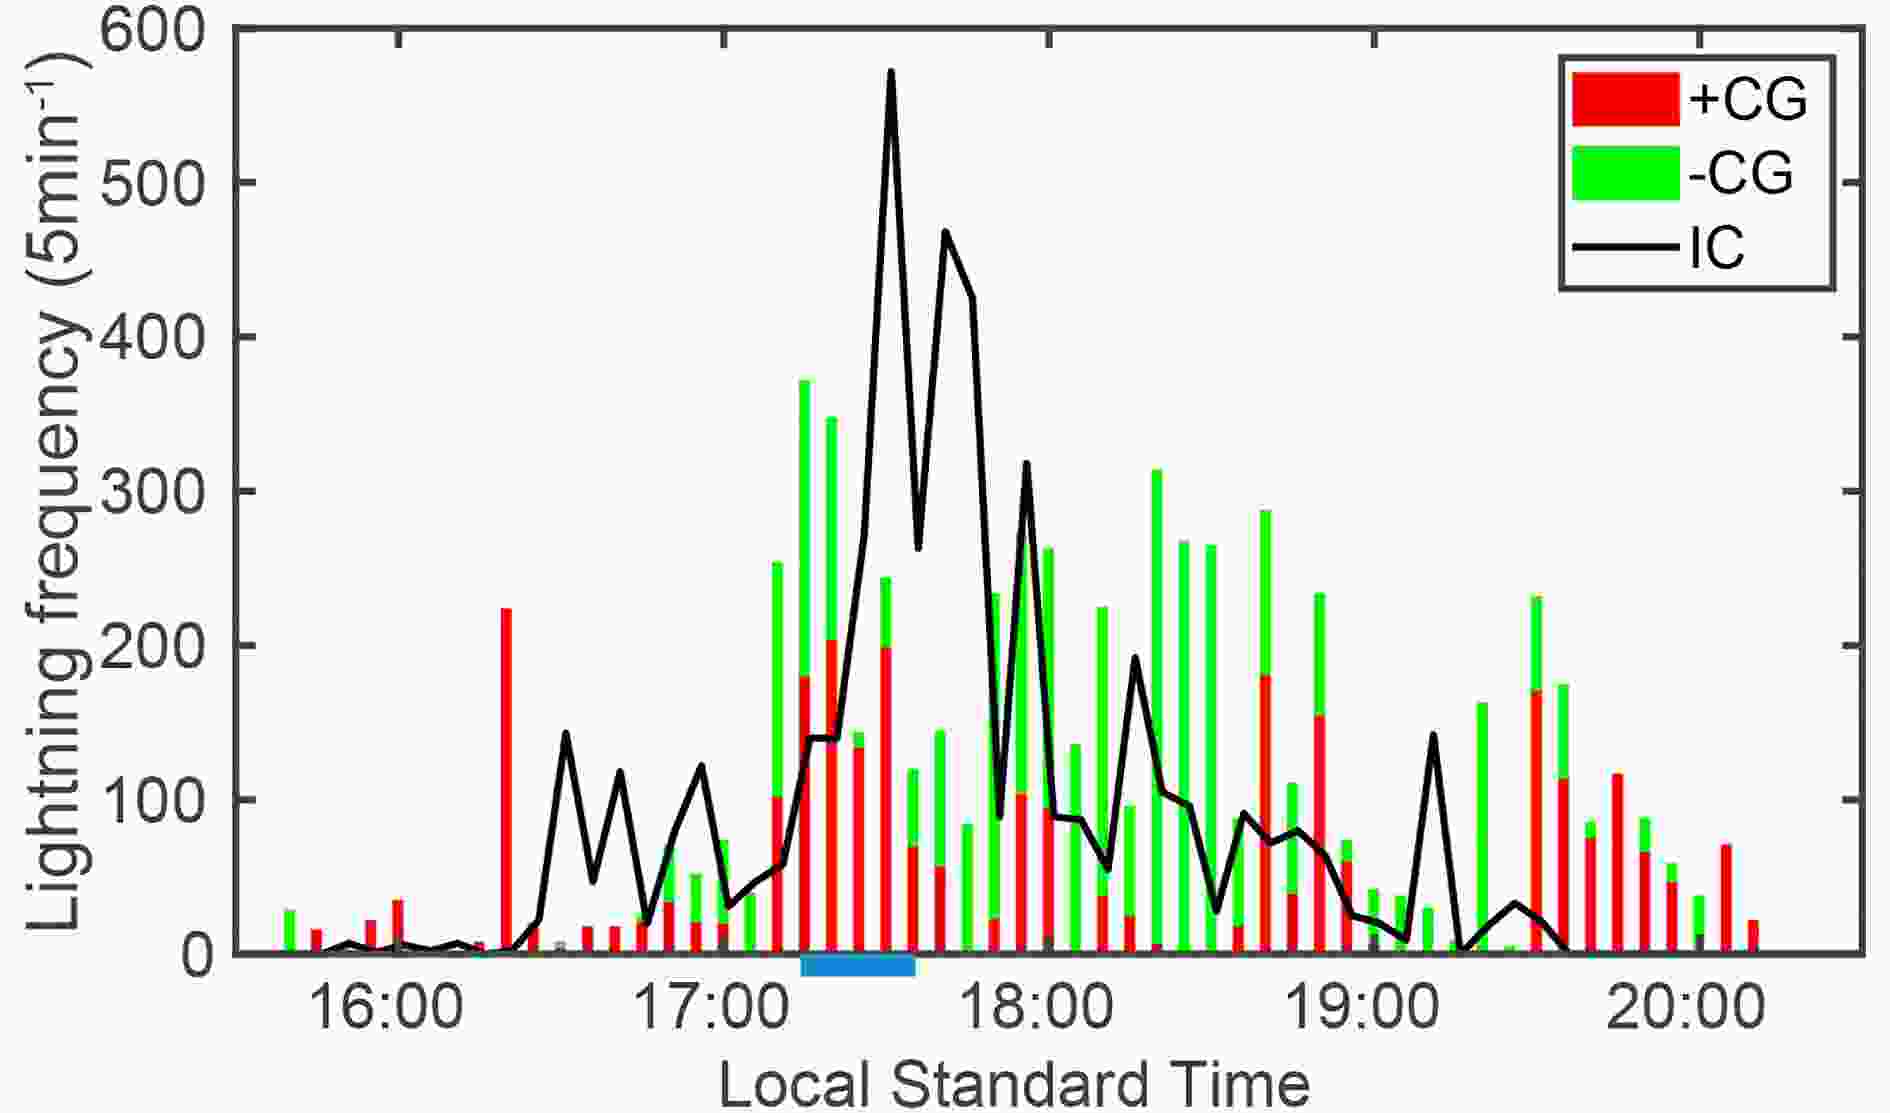 Figure5. Evolution of lightning frequency within 5 min. Green bars stand for ?CG lightning, red bars stand for + CG lightning, the black line indicates IC lightning, and the blue rectangle indicates the period when hail was reported.
2
3.3. Distribution of lightning radiation sources
The horizontal distribution of lightning radiation density over the path of the supercell from the initial to dissipating stages is shown in Fig. 6. Throughout the lifetime of the supercell, the density of lightning radiation sources covered most of the Beijing region, and strengthened with maxima in the eastern and southern parts of Beijing. A comparison with radar reflectivity reveals that the eastern maximum was associated mainly with lightning discharge during the mature stage, and the southern maximum was associated mainly with lightning discharge during the dissipating stage.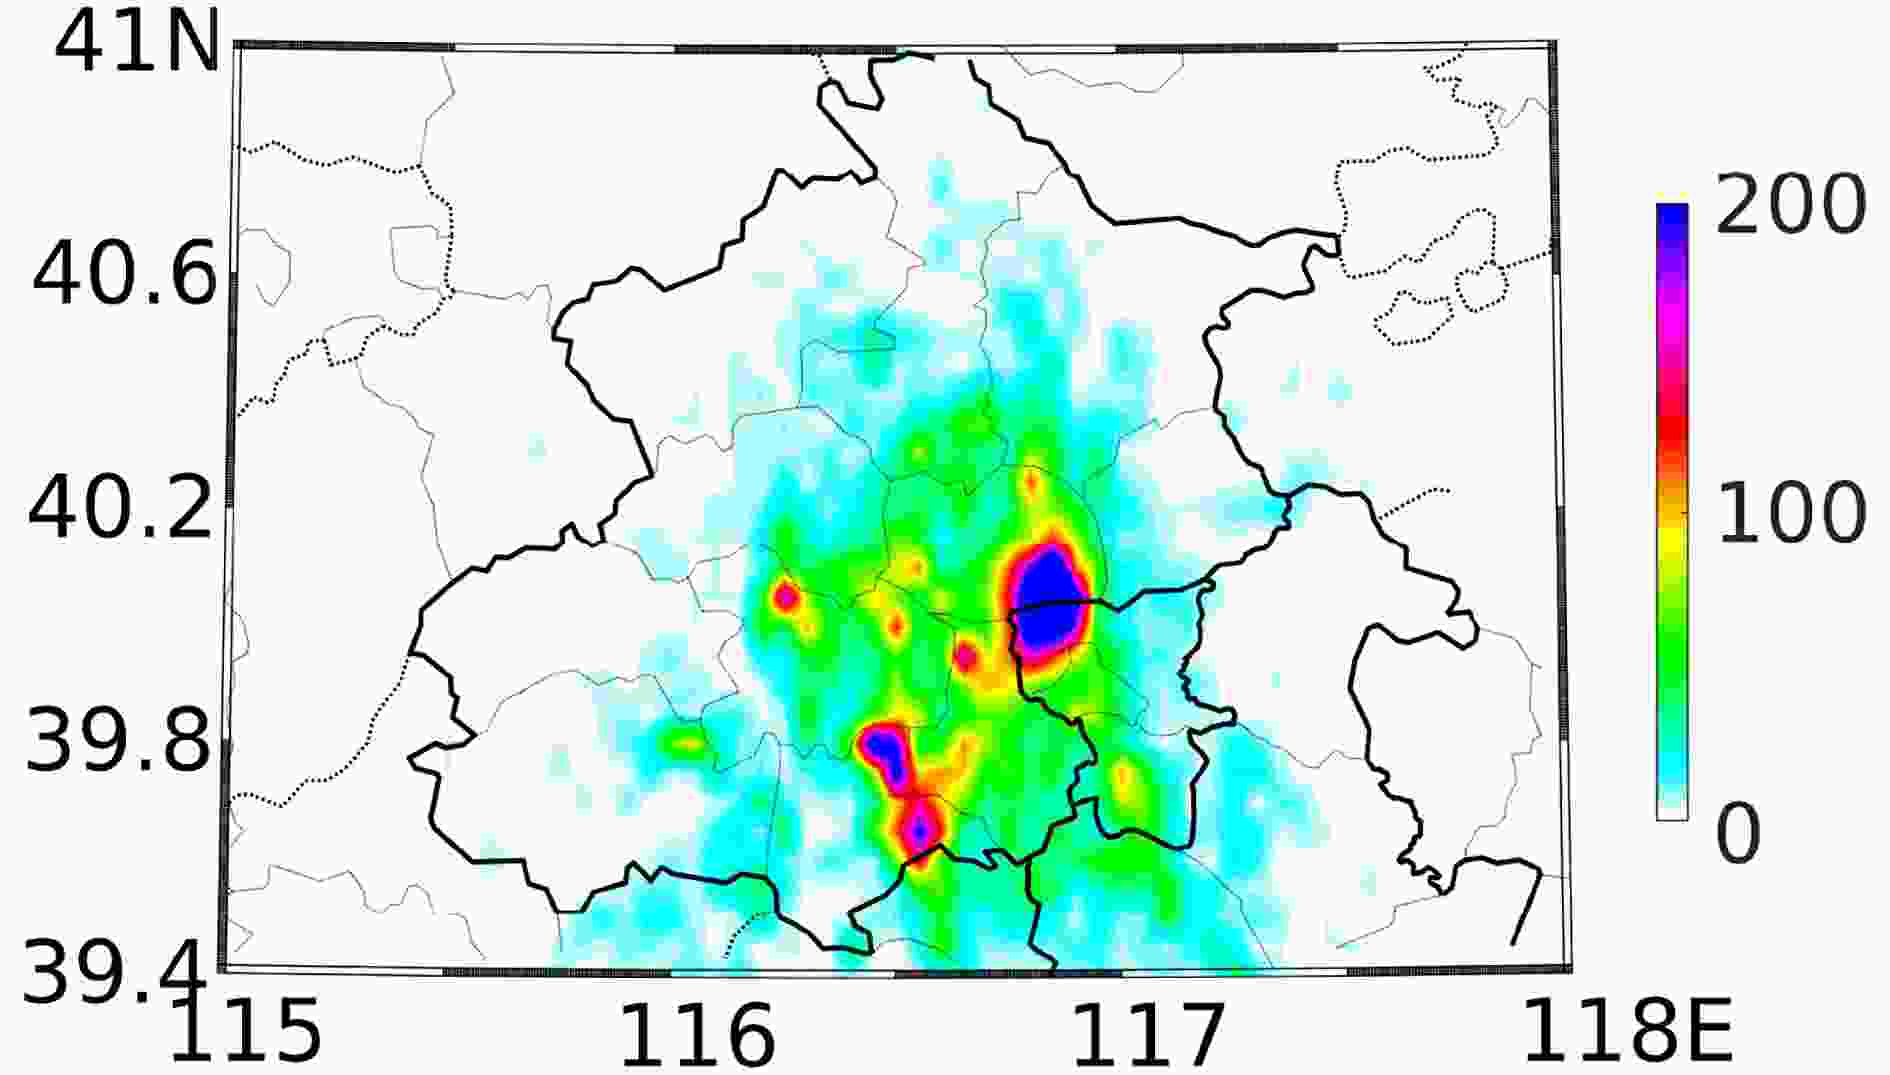 Figure6. Horizontal distribution of lightning radiation density (km?2 h?1) during the whole lifetime of the supercell.
Before the first report of hail at 1700 LST, several isolated convective cells merged with each other and formed a hook shape in the strong radar echo. The vertical lightning radiation distribution shows that the lightning pulses occurred mainly from 3 to 7 km height, and concentrated in the convective core of the supercell at approximately 4 km (Fig. 7a). Most lightning radiation sources were located between 0°C and ?20°C, which is typical of the primary discharge area of a thunderstorm. Comparison with the radar echo indicated that the lightning radiation sources were mainly located in the convective region with high radar reflectivity (> 40 dBZ), and some of them were particularly likely to occur in the gradient of radar reflectivity along the transition zone from the convective region to the stratiform region. A few lightning radiation sources were scattered throughout the cloud anvil and the stratiform region within weak radar reflectivity (< 30 dBZ).
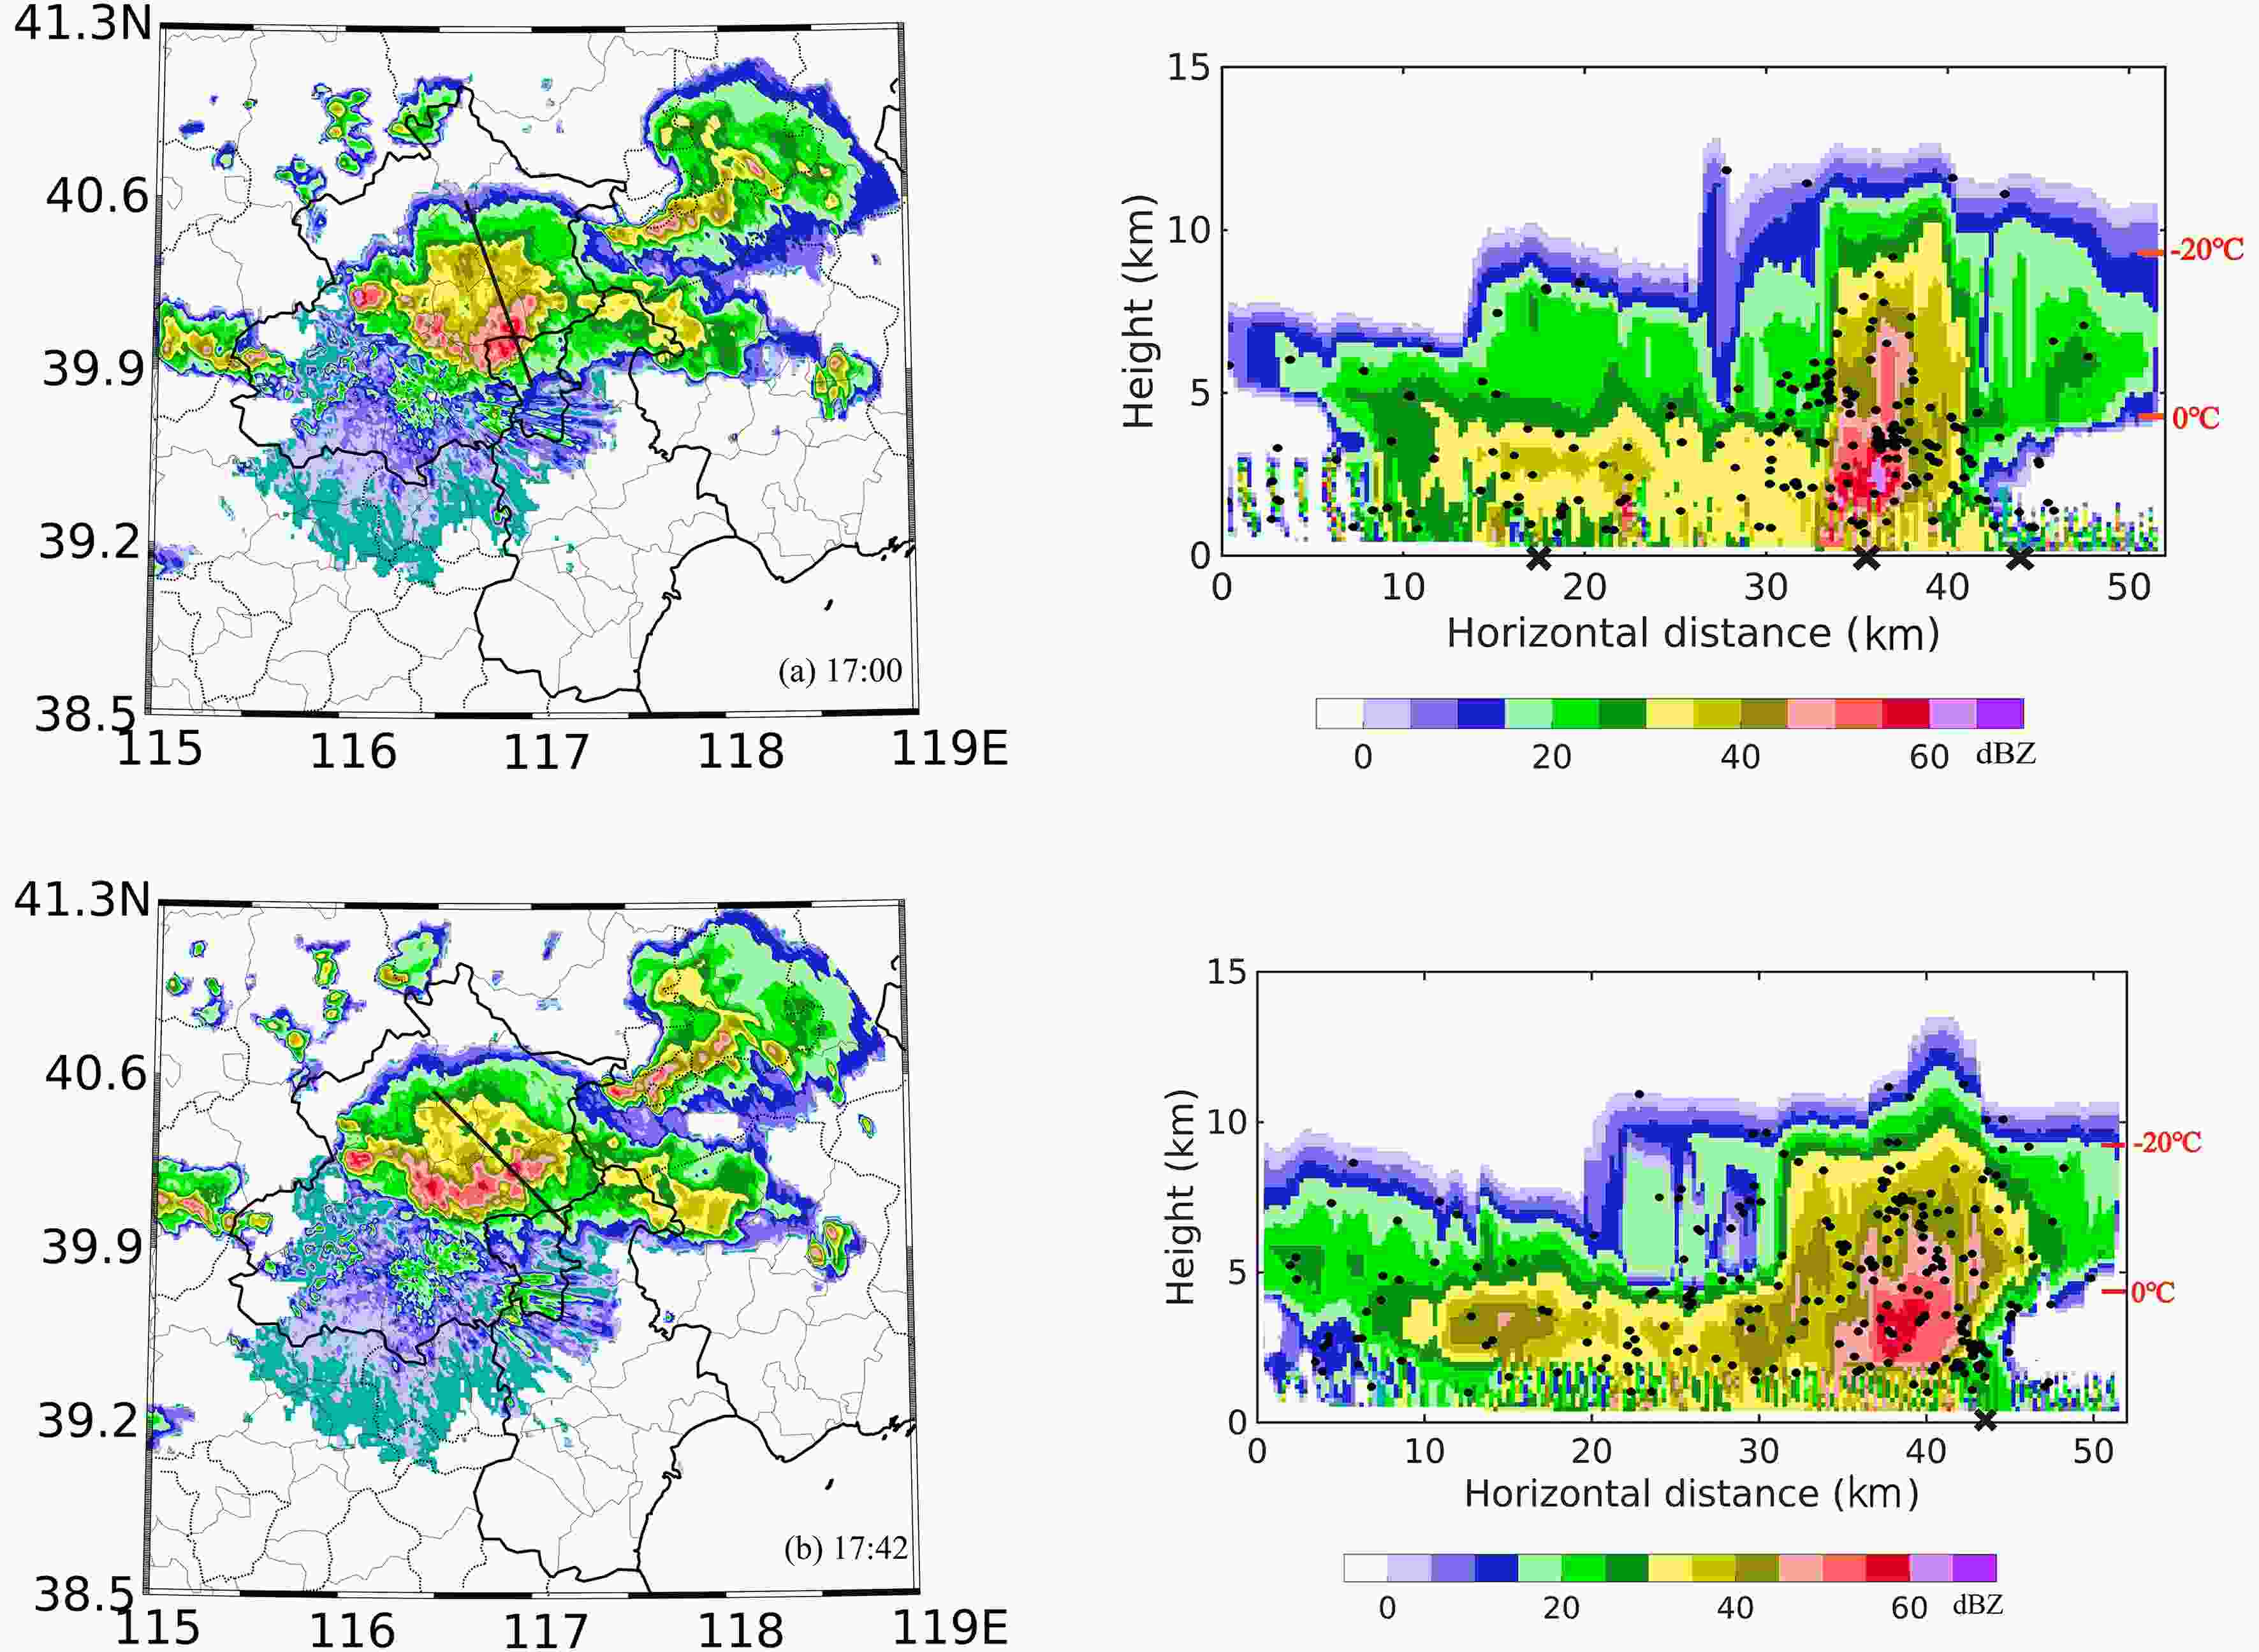 Figure7. Composite radar echo obtained from S-band radar, and the cross section along the black line with lightning radiation sources within 5 km at (a) 1700 LST and (b) 1742 LST within 1 min. Black dots represent lightning radiation sources; black crosses indicate +CG lightning.
Three +CG lightning events occurred at this time—in the convective region, the cloud-anvil region, and the trailing stratiform region. The +CG lightning generated in the convective region probably originated in the core of the strong radar echo, whereas the +CG generated in the stratiform region might have been initiated by charged ice particles propagating from the convective region along the pathway with the gradient of the radar echo. Lang et al. (2004) found that 77% of stratiform +CG flashes originated along the convective line. For +CG lightning occurring in the cloud anvil, Weiss et al. (2012) and Kuhlman et al. (2009) proposed that lightning events can initiate within or near the convective region and propagate to the cloud anvil of supercells. In addition, it also might be generated by the net positive charge discharge directly to the ground without a shielding effect in the cloud anvil area.
Figure 7b shows the composite radar reflectivity after the hail event and the vertical distribution of lightning pulses superimposed on a cross section of the radar echo at 1742 LST. At this time, the convective region formed an ellipse shape, and the strong radar echo (> 45 dBZ) extended to a higher level (> 8 km) as the maximum of radar reflectivity was 65 dBZ and the highest lightning radiation source position reached to 12 km. In the convective region, the intensive lightning radiation sources did not occur in the high-reflectivity area, but were concentrated directly above the strong radar echo, especially in the gradient of radar reflectivity. In the transition zone, it is clear that lightning radiation sources followed the large gradient in radar reflectivity from the convective region to the stratiform region through the transition area. In the trailing stratiform region, lightning pulses were scattered throughout the large area of the secondary maximum of radar reflectivity. Carey et al. (2005) found that the vertical distribution of lightning radiation sources reaches a maximum in the convective region, and gradually decreases as it moves towards the stratiform region through the transition area, consistent with our results. Only one convective-region +CG flash with dense lightning pulses was detected at this time—a reduction compared with the previous moment.
2
3.4. Inferred charge structure of the supercell
The vertical distribution of lightning radiation sources within a 30-min window are demonstrated during the pre-hail (Fig. 8a) and post-hail (Fig. 8b) stages. During the pre-hail stage, the distribution of lightning radiation sources gradually increased, reached a maximum, and decreased with fluctuations. Figure 8a infers that the main discharge was located between the heights of 6 and 9 km and was centered at 7.5 km. MacGorman et al. (2005) pointed out that the updraft of a supercell is strong and the charge regions tend to be higher than normal, leading to more elevated lightning. Usually, lightning initiates between two charge layers with opposite polarity. Lightning channel propagation is considered to be bidirectional, with positive and negative leaders propagating up and down from their initial positions, spreading through the negative and positive charge regions (MacGorman et al., 2001). Figure 8c presents the electrical field change waveform accompanied by the corresponding distribution of lightning radiation sources changing with height of a +CG flash with a single return stroke. Analysis of them reveals that the negative leader of +CG lightning occurred at a height of 7.2 km after the return stroke and then developed upwards until reaching a stable height of 8 km. Although the lightning radiation sources of +CG lightning were relatively sparse, the charge structure can to a certain extent be inferred according to the lightning propagation in the charge layer. In addition, the +CG flashes dominated before the first report of hail. This indicates that the main discharge region with positive polarity was located at 6–8 km during the pre-hail period. Wiens et al. (2005) found that an inverted-dipolar structure may not be sufficient for +CG flash generation, and a lower negative charge may be needed to initiate +CG flashes. In the present study, it is inferred that the supercell presented an inverted charge structure before and during the appearance of the hail event, with a positive charge region at middle levels and a negative charge at upper and lower levels. Figure8. Change in lightning radiation sources with height: (a) pre-hail falling stage at 1700 LST within 30 min; (b) post-hail falling stage at 1800 LST within 30 min; (c) electrical field change around return stroke (11.54–11.57 ms) of a +CG flash. Blue dots indicate the corresponding lightning radiation sources distributed with height.
The vertical distribution of lightning radiation sources after the hail event ended is shown in Fig. 8b. Two main discharge levels existed: one from 8 to 10 km with a maximum at 8.5 km, and the other centered at 4 km. As in our study, Wang et al. (2016) used the electrical field and the distribution of lightning radiation sources to analyze the preliminary breakdown process of ?CG and IC flashes after the hail event of this storm ended. They found that the negative radiation sources of a single ?CG flash and single IC flash initiated at 4.7 km and 4.4 km, respectively, and propagated down to the ground. In addition, the negative lightning sources of one IC flash initiated at 7.1 km and propagated upwards. To some extent, the charge structure can be inferred concurrently with the existence of a negative charge region at middle levels (4.7–7.1 km) and a lower-level positive charge region (below 4.4 km), which is associated with frequent ?CG lightning. Mansell et al. (2002) and Kuhlman et al. (2006) pointed out that CG flashes are governed by the polarity of the main charge region, and a charge region of opposite polarity is needed beneath the main charge region to initiate the flash. Therefore, after the hail event ended, the supercell formed a normal tripolar charge structure.
2
3.5. Distribution of hydrometeors and lightning radiation sources
As previously stated, the inside strong updraft of the supercell was sufficient to support the hydrometeor particles, especially ice-phase particles. To help determine which hydrometeors contributed to the electrification of the supercell, the hydrometeor identification method was applied to X-band dual-polarimetric radar data. The vertical distributions of several categories of hydrometeors and lightning radiation sources at 17:36 LST are shown in Fig. 9. At lower levels, the supercell mainly contained drizzle, light-to-medium rain, and small hailstones. In the convective region, graupel and light hail were concentrated in the middle from 2 to 8 km with high radar reflectivity. Ice crystals and snow were mainly located at upper levels of the supercell. Dense lightning radiation sources were present in the convective region with a high concentration of graupel and light hailstones. The discharge was mainly distributed at the level of 4 km. Graupel and hailstones were the main charge particles. In the trailing stratiform region, the hydrometeor particles mainly comprised snow, ice crystals and graupel. Sparse lightning radiation sources distributed in the stratiform region with snow, ice crystals and graupel. Moreover, these lightning radiation sources mainly located in the area with the occurrence of graupel particles. The distribution of lightning radiation sources in the stratiform region indicated a charge layer located at 6 km. The ice particles may have propagated from the top of the storm along sloping trajectories and finally down to the trailing stratiform region. It is hard to distinguish between the role of the electrification caused by advection from the convective region and in-situ charging mechanisms. Ice crystals and snow are two main ice-phase particles in the stratiform region. Recent studies (Williams, 2018; Zheng et al., 2019) have proposed that, in the ice–ice non-inductive mechanism, ice aggregates (including snow) could replace the role of graupel. These observations will provide further support for the roles of charging in different categories of hydrometeor particles, which contribute to electrification and lightning discharge.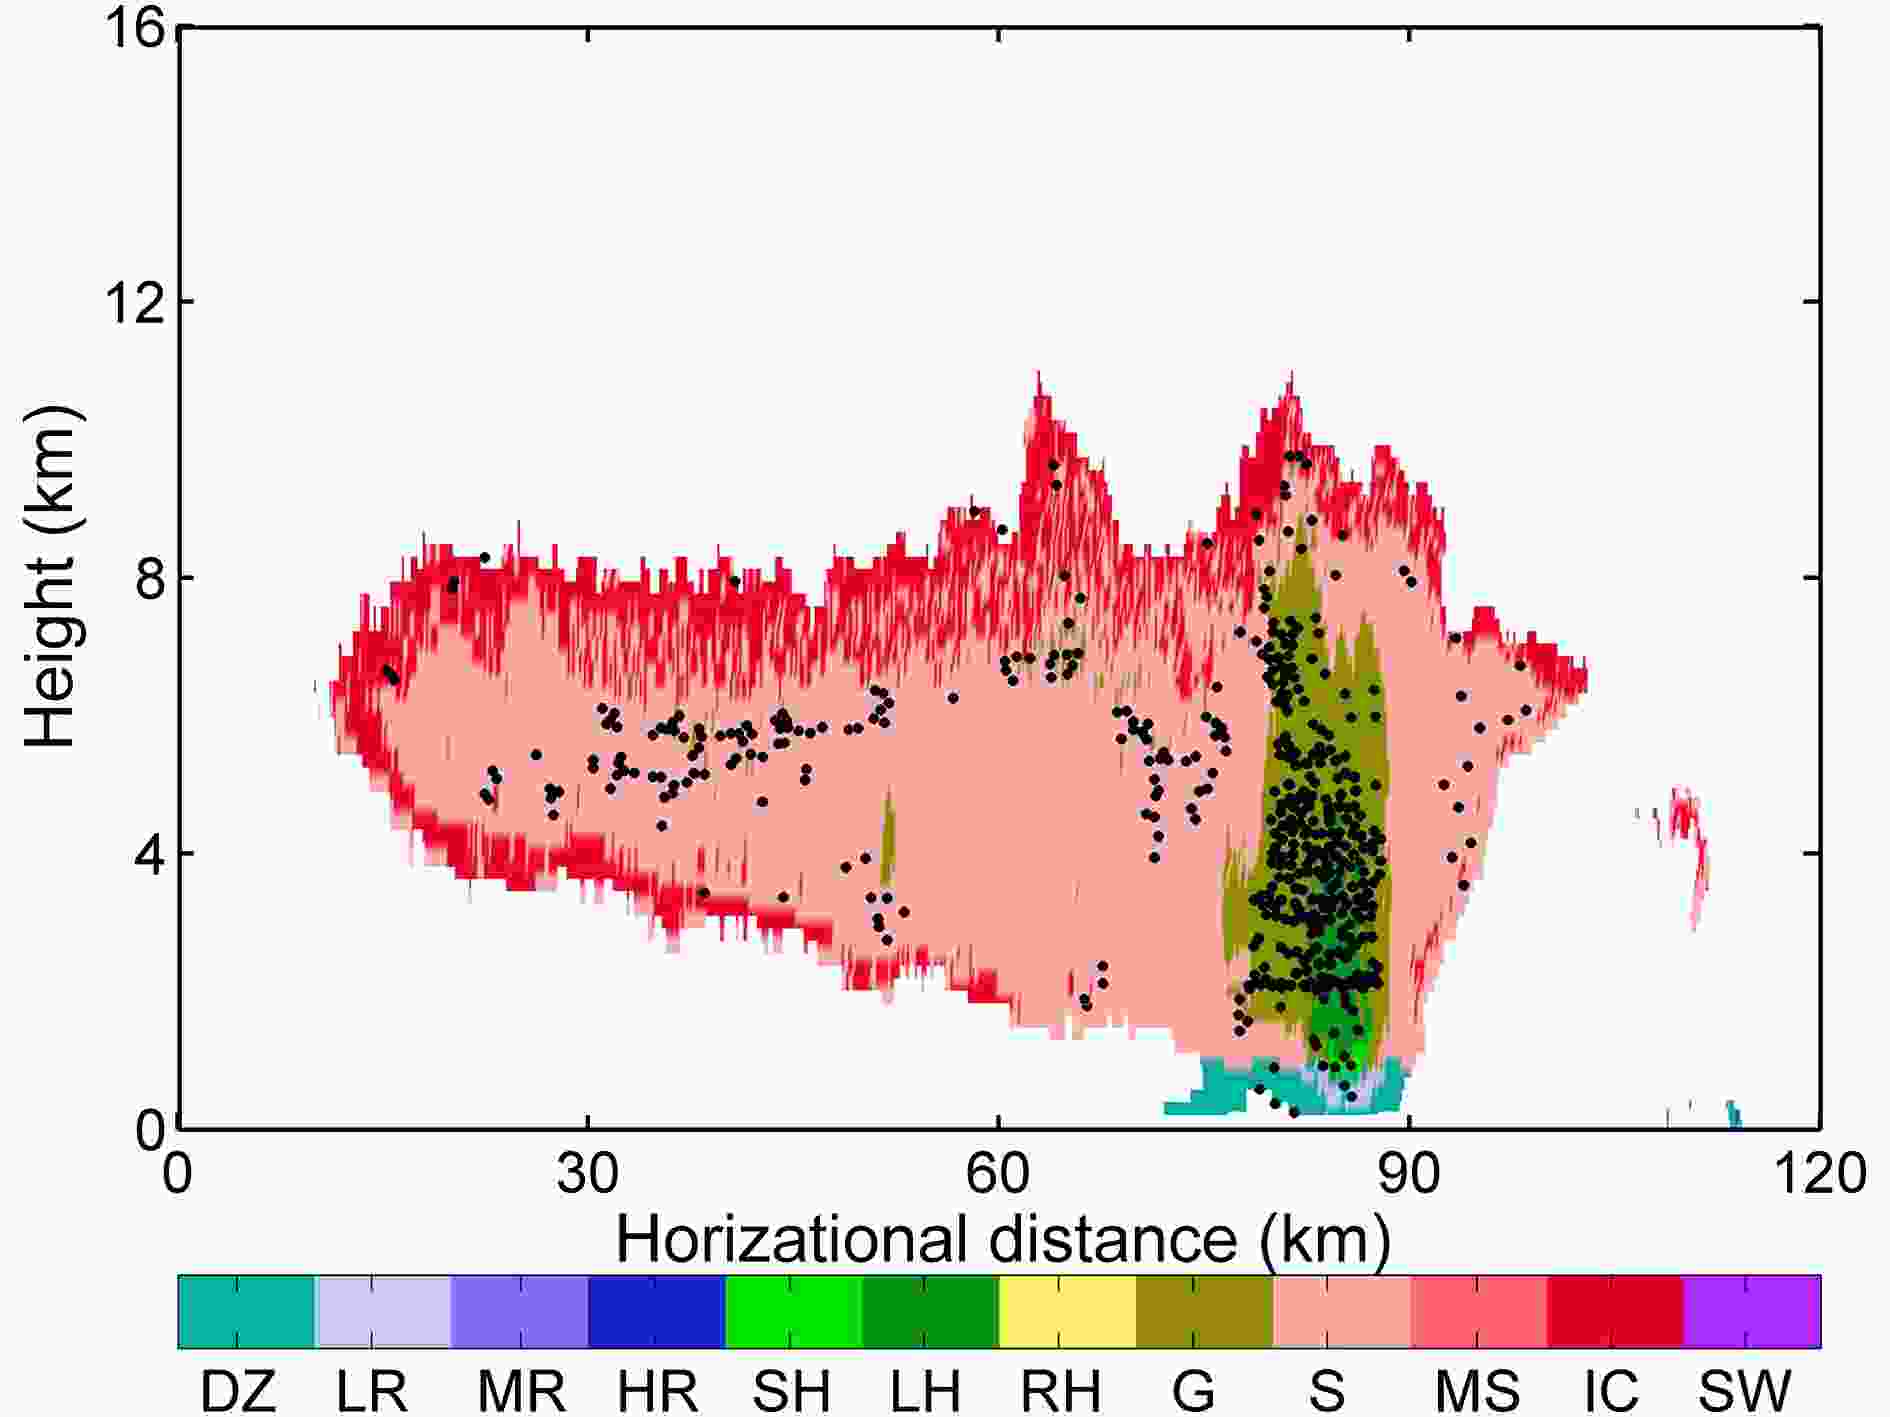 Figure9. Vertical distribution of different categories of hydrometer particles (drizzle, light rain, medium rain, heavy rain, small hail, large hail, rain+hail, graupel, snow, melting snow, ice, super cooled water) superimposed on lightning radiation sources within 5 km in 3 min.
During the lifetime of the supercell, IC lightning was dominant. Although +CG lightning took a high percentage, in general, it was slightly smaller than ?CG lightning. From the initial stage until the hail event ended, the frequency of +CG lightning was higher than that of ?CG lightning, whereas the frequency of ?CG lightning gradually increased to more than +CG and reached a peak value after the hail event ended. In particular, in the early and late stage of the supercell, +CG lightning demonstrated a greater frequency than CG lightning and accounted for a large fraction of CG lightning during the hail event. Lightning radiation sources can be associated with high radar reflectivity and were generally concentrated in convective regions with strong radar echoes (> 40 dBZ). Moreover, they distributed from the convective core along a pathway with the gradient of radar reflectivity to the stratiform region, and some of them extended to the cloud anvil. In addition, lightning radiation sources occurred mainly in an area with high contents of graupel and hailstones in the convective region. In the stratiform region, lightning discharges were located within the graupel, snow and ice crystals. To some extent, the main charging hydrometeors were graupel and ice crystals. Combining the analysis of the lightning activities with the distribution of hydrometeor particles, it was possible to infer the charge structure of the supercell. Before and during the hail event, the supercell demonstrated an inverted charge structure; whereas after the hail event ended, the supercell converted to a linear MCS corresponding to a normal tripolar structure.
Although the detected lightning radiation sources for single lightning events could not capture the whole lightning channel in a finely reconstructed manner, information on the lightning discharge channel was still obtained, and thus the charge structure of the supercell could be analyzed in detail. Several charge structures have been proposed to explain a +CG-lightning-dominated thunderstorm, including a tilted charge structure, a tripole with enhanced lower positive charge, and an inverted charge structure (Williams, 2001). A tripole charge structure with enhanced lower positive charge usually increases the frequency of IC flashes and is accompanied by fewer CG flashes (Qie et al., 2005; Nag and Rakov, 2009; Li et al., 2020). In the supercell investigated here, the frequency of CG flashes was relatively high, particularly for +CG lightning. Therefore, the charge structure of the studied supercell was not a type of tripole with enhanced lower positive charge. For the tilted charge structure, Brook et al. (1982) demonstrated that +CG lightning can be produced by thunderstorms in which the polarity of the lowest charge region is negative. In addition, the numerical simulations of Mansell et al. (2002) highlighted that most +CG lightning events are initiated by a negative charge below a large positive charge region, but it is not sufficient to result in downward propagation in the negative charge region. Therefore, a small amount of negative charge below a large positive charge might exist during a normal-polarity storm, but this structure occurs more frequently in an inverted-polarity storm (MacGorman et al., 2005).
Hydrometeor particles and microphysical processes are very important for generating frequent +CG lightning. The non-inductive exchange of charge is the critical charging mechanism during rebounding collisions of ice particles with riming graupel (Mansell et al., 2010). A non-inductive charging mechanism leads to graupel being charged with different polarity depending on the temperature and liquid water content (LWC) in or around the main updraft region. Typically, graupel particles gain negative charge and ice crystals gain positive charge. However, some laboratory studies have shown that contaminants can result in positive graupel charging (Jayaratne et al., 1983; Takahashi, 1984). In the supercell studied here, which developed rapidly before hail was first reported, large amounts of supercooled water likely accumulated in the mixed-phase region and supported hailstone growth (Fig. 9). With the high accumulated LWC of the supercell, graupel particles gained positive charge in the mixed-phase region at middle levels and ice crystals gained negative charge at upper levels by non-inductive charging. MacGorman et al. (2005) suggested that +CG lightning is associated with large hail, but the electrification does not involve the hail itself. Therefore, the supercell followed the pattern of an inverted charge structure during the hail period. Inverted-polarity charge structures require the dominant charge on graupel to be positive, under high LWC and high rates of graupel riming (MacGorman et al., 2005). Simulation studies (Kuhlman et al., 2006; Fierro et al., 2006; Calhoun et al., 2014) have also found that inverted-polarity charge structures are mainly characterized by the positive charging of graupel and the negative charging of rebounding ice in the updraft region.
The draft effect of falling hail increased the downdraft significantly and led the charge region to descend farther than during the previous period. After the hail event ended, lightning frequency decreased sharply, leading to a “quiet” lightning period. At that time, the supercooled water content decreased as the precipitation weakened; both the size and content of the hydrometeors differed from the pre-hail stage. The non-inductive charging mechanism causes graupel to gain negative charge and ice crystals to gain positive charge. As the net charge of the storm re-accumulates, the frequency of ?CG flashes increases dramatically during this period. After the hail event ended, the charge structure of the supercell changed from an inverted-polarity charge structure to a normal tripole charge structure.
The hypotheses presented herein should be tested by a numerical simulation study. An important limitation of this study is that there are no electric field soundings to verify the charge structure of the supercell. Fine lightning discharge location, soundings of the charge structure, and measurements of different charging hydrometeor particles should be included in future observational studies of supercells. Future work will combine simulations with observations to investigate the lightning activity of supercells in greater detail.
Acknowledgements. This study was supported by the National Natural Science Foundation of China (Grant Nos. 41875007 and 41630425), the Special Fund for Meteorology-Scientific Research in the Public Interest (Grant No. GYHY201506004), and the 2018 Open Research Program of the State Key Laboratory of Severe Weather (Grant No. 2018LASW-B06). Thanks for the efforts of all the people who participated in the coordinated observations of Dynamic–Microphysical–Electrical Processes in Severe Thunderstorms and Lightning Hazards project.
