HTML
--> --> -->There are many factors affecting SSR, such as cloud cover, aerosols, water vapor, and volcanic eruptions (Shen et al., 2008; Wang et al., 2018c). However, in different regions, the main causes may vary. Although the influence of clouds on shortwave and longwave radiation has been well studied, the dominant role of clouds in the atmospheric interaction with solar radiation is still uncertain (Liepert, 2002; Yang et al., 2013). From the 1960s to around 1990, a natural phenomenon called "global dimming" was widely observed (Liepert, 2002). Specifically, global SSR exhibited a decreasing trend in this period. Nevertheless, an inversion from dimming to brightening has occurred since 1990, as SSR gradually began to increase in the available observational areas (Pinker et al., 2005; Wild et al., 2005; Yang et al., 2013). In China, Yang et al. (2013) demonstrated that the role of cloud cover in the variability of SSR is important and contributes to brightening. Meanwhile, the variability in cloudiness is not the primary reason for dimming. On the contrary, Liepert (2002) indicated that increasing cloud cover could well explain the dimming in the United States.
East Asia, especially China, has become one of the most populated and rapidly developing regions in the world over the past several decades, with frequent occurrence of serious air pollution events. The ever-growing population and human activity have led to a rapid and continued increase in the emission of aerosols and their precursors (Qian and Giorgi, 2000; Qian et al., 2001, 2006; Zhu et al., 2013; Qu et al., 2018). Ellis and Pueschel (1971) believed that human activity had no impact on atmospheric turbidity, as demonstrated in a 13-year observation on a global scale in Hawaii. However, Varotsos et al. (1995) showed that the anthropogenic aerosols over the city had a significant impact on ultraviolet radiation. Lelieveld et al. (2002) pointed out that air pollution reduces the infiltration of solar radiation into the surface, which can lead to the suppression of precipitation. The increase in anthropogenic aerosols leads to an increase in the scattering and absorption of solar radiation. Cloud condensation nuclei can modify cloud physical and optical properties, and also change the planetary boundary layer height and atmospheric stratification, as well as the balance in the Earth's radiation budget (Haywood and Boucher, 2000; Kaiser and Qian, 2002; Che et al., 2005; Lohmann and Feichter, 2005; Qian et al., 2006, 2007; Qu et al., 2017). Meanwhile, increased aerosols, e.g., haze, urban aerosols, fog, sand, and dust, may reduce visibility (Bendix, 1995; Park et al., 2006; Dayan et al., 2008; Vautard et al., 2009). Therefore, the interaction among clouds, aerosols, and radiation is still a challenging task (Jandaghian and Akbar, 2017).
The temporal and spatial distribution characteristics of SSR become very important because some effects of SSR, e.g., photosynthesis, differ by location (Pinker et al., 2005). There is evidence that the reported long-term tendencies might not continue because of the reduction in levels of air pollution, which was demonstrated in Germany by Power (2003). Therefore, it is of great importance to establish high-precision radiation stations and make direct observations in China. Nanjing is located on the eastern coast of China, a megacity of the Yangtze River Delta. Both its economy and industry are developed. Air pollution has become a major environmental issue in Nanjing (Wang et al., 2012; Qu et al., 2018). However, there are few studies regarding the relationship between air pollution and SSR in Nanjing at present. Zhang et al. (2004) analyzed a 40-year record of solar radiation data in eastern China and showed that the acceleration of air pollution is a possible reason for the reduction in global and direct radiation. Qian et al. (2007) showed that, in cloud-free conditions, the increase in aerosol concentration caused by air pollution significantly reduces SSR in China.
Most studies have been conducted to explore the impact of air pollution on SSR from a qualitative point of view or to study the interannual variation in SSR from a quantitative perspective. Nonetheless, to our knowledge, few studies have analyzed the effects of different levels of air pollution on SSR under clear skies. This study supplements this gap with observations and numerical simulations using data taken over one year in Nanjing, China. Air quality is classified into five levels (excellent, good, slightly polluted, moderately polluted, and heavily polluted) to discuss the characteristics of SSR for different levels of air pollution. Moreover, in this work, we present the characteristics of SSR seasonal variations and its correlation with air pollution/visibility at three stations in Nanjing, China. Compared with PM10, PM2.5 plays a dominant role in the scattering of solar radiation due to the differences of single-scattering albedo and phase function. Furthermore, we evaluate model simulations of SSR under different clear-sky conditions.
The structure of this paper is as follows: Section 2 discusses the measurements and methods; section 3 presents the observation and simulation results, and the characteristics of SSR under different air pollution conditions are discussed in detail. Here, SSR includes three parameters: global horizontal irradiance (GHI), diffuse horizontal irradiance (DHI), and direct normal irradiance (DNI). A short summary is presented in section 4.
2.1. Observation sites and datasets
Three observation sites were centrally located in the urban area of Nanjing City, which is the second largest city in eastern China and features a high population density and large energy consumption. Eastern China, including the middle and lower reaches of the Yangtze River and Yellow River, is a major agricultural region that comprises about one-third of China's total cultivated land and almost half of the country's agricultural yield. The three observation sites were located at Nanjing University of Information Science and Technology (NUIST) (32.21°N, 118.72°E), the Xianlin campus of Nanjing Normal University (NNU) (32.11°N, 118.92°E), and Nanjing University Xianlin campus (NJU) (32.12°N, 118.95°E), as shown in Fig. 1. NNU was approximately 21 km southeast of NUIST and less than 5 km from NJU. The main radiation data were measured at NUIST. Other data related to this work [e.g., visibility, air quality index (AQI), and surface PM2.5 and PM10 concentrations] were observed at NNU, and the total-sky images were obtained at the Atmospheric Parameters Vertical Detection Site (APVDS) at NJU (Qu et al., 2017; Yang et al., 2017).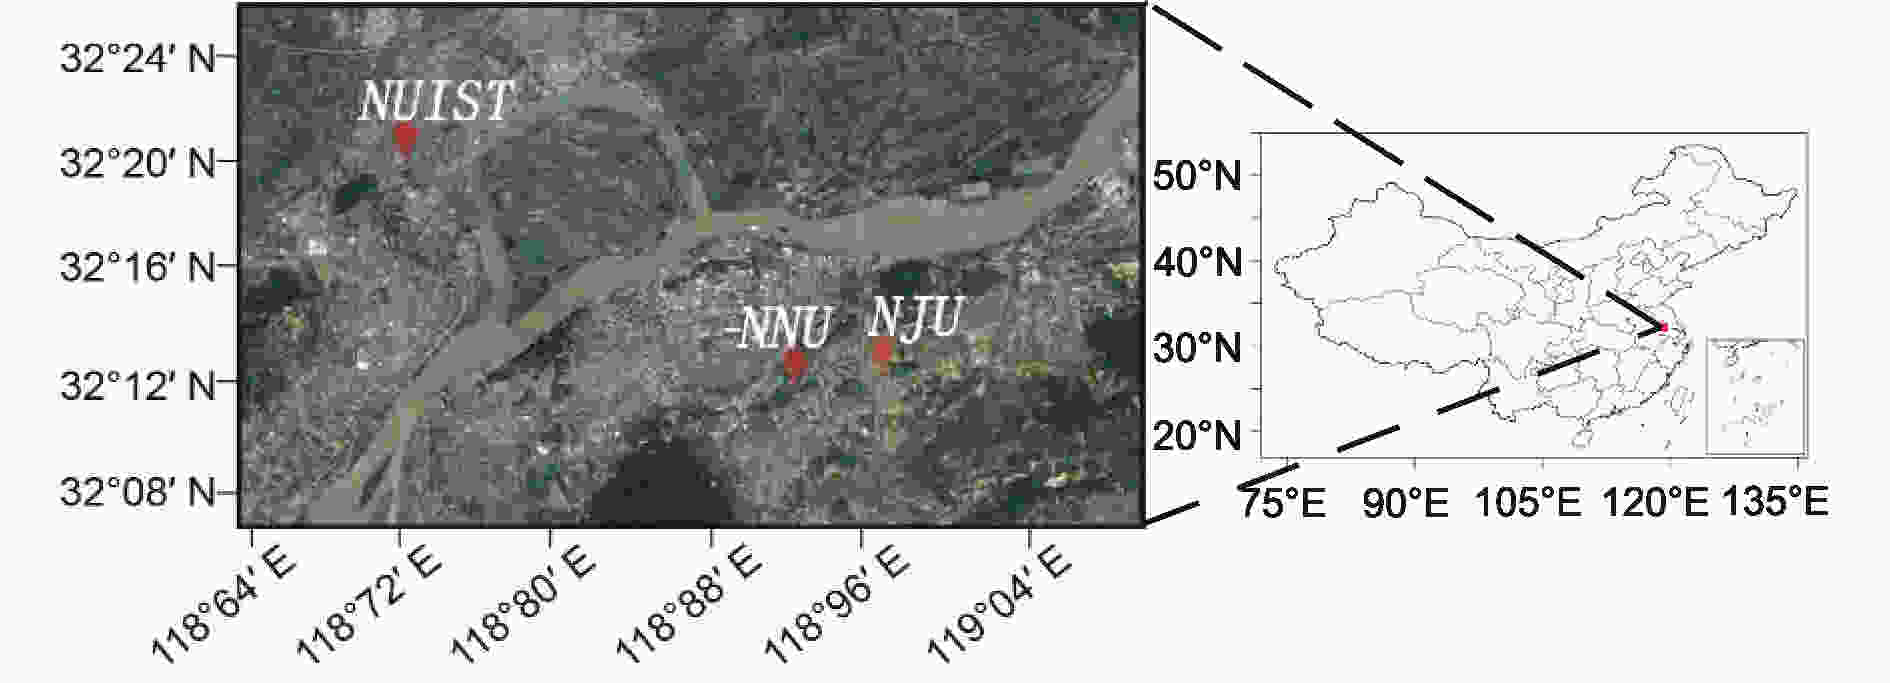 Figure1. Observation sites in Nanjing—NUIST (32.21°N, 118.72°E), NNU (32.11°N, 118.92°E), and NJU (32.12°N, 118.95°E).
SSR data were measured during March 2016–June 2017 at a solar radiation monitoring station (instrument model: TP-SMS-22G) located at NUIST. Due to some technical issues, there was a lack of radiation observation data between November and December 2016. A secondary standard pyranometer (instrument model: SKO MS-802F) was used for the measurement of GHI and DHI, and a pyrheliometer (instrument model: SKO MS-56), for measuring DNI, was mounted on the sun tracker. All the observational data were collected every minute. The MS-802F is sensitive to solar irradiance in the spectral range of 280 to 3000 nm, and the wavelength range of MS-56 is from 200 nm to 4000 nm. The working temperature range of these instruments is between ?40°C and 80°C. Routine maintenance and calibration of the instruments was carried out during the study period, including cleaning the sensor lens weekly, checking the wiring condition monthly, and checking the level of the bubble monthly. The observation data covered all four seasons in Nanjing, including spring (March–May 2016), summer (June–August 2016), autumn (September–November 2016), and winter (December 2016–February 2017).
In addition, a visibility sensor (model GSN-1) was deployed to monitor visibility based on the Koschmider principle (Horvath and Noll, 1969), facilitating the retrieval of aerosol extinction coefficients at 500 nm. Surface PM2.5 and PM10 concentrations (Thermo TEOM-1405) were continuously monitored and hourly averages recorded. PM2.5 is considered as fine particles, while particles with diameters of 2.5–10 μm (PM2.5?10) are referred to as coarse particles. The visibility, PM10, PM2.5, and AQI data were observed at Xianlin Ambient Air Quality Monitoring Site, located at NNU. The value of AQI was calculated by the concentrations of six atmospheric pollutants—namely, sulfur dioxide, nitrogen dioxide, PM10, PM2.5, carbon monoxide, and ozone—measured at the monitoring site (https://en.wikipedia.org/wiki/Airqualityindex). The main pollutants might vary throughout the year, and AQI represented the overall pollution level. The total-sky imager was set up at the APVDS site at NJU. Specific parameters of the observation instruments are shown in Table 1.
| Observation instrument | Technical parameter | |||||
| SKO MS-802F SKO MS-56 | Operating temperature (°C) | Spectral range (nm) | Spectral sensitivity | Response time | Long-term stability | Sensitivity (μV W?1 m?2) |
| ?40 to 80 | 280?3000 | <1% | <5 s | <0.5% | Approx. 7 | |
| ?40 to 80 | 200?4000 | <1% | <1 s | <0.5% | Approx. 10 | |
| Thermo TEOM-1405 | Operating temperature (°C) | Measurement range (g m?3) | Resolution (μg m?3) | Accuracy | Main flow rate (min?1) | Bypass flow rate (min?1) |
| ?40 to 60 | 0?1 | 0.1 | ±0.75% | 3 | 13.67 | |
| GSN-1 | Operating temperature (°C) | Measurement range (km) | Resolution (m) | Accuracy | ? | ? |
| ?40 to 50 | 0.01?35 | 100 | ±10% | |||
Table1. Detailed discriptions of the observation instruments. The response time is taken as the time required for the measured signal to reach 95% of its final value. The long-term stability is specified as the maximum change in the zero signal and output span signal of the instrument under reference conditions within one year.
2
2.2. Determination method of the clearness index and diffuse fraction
DNI is the maximum available beam radiation that can be measured, which is defined as the amount of solar radiation received in a plane perpendicular to the incoming solar rays. DHI is the solar radiation scattered by dust, aerosols, and particles, received on a horizontal surface. GHI is the total amount of direct and diffuse solar radiation as calculated by the following equation (Sengupta et al., 2015):where

In the absorption and diffusion (scattering) of solar radiation by atmospheric components, cloud cover plays an important role in the change in SSR. Hence, it is necessary to show a distinction between clear-sky and cloudy-sky conditions when we discuss the relationship between SSR and air pollution. Clear days are usually defined as days with an average cloud cover of less than 20% (Wu et al., 2012), or days with a sunshine time of more than 75% per day (Zheng et al., 2012).
The extraterrestrial solar radiation can be expressed by the following equation (Sheng et al., 2003):
where


To characterize clear sky conditions, a clearness index (

Previous studies have shown that there is no standard value of


Scattered light is extremely vital to the process of photosynthesis. Therefore, the diffuse fraction is important in the research of both atmospheric physics and biological systems (Che et al., 2005). The diffuse fraction (

In this study, the diffuse fraction is used to study the radiation scattered by aerosols, dust, and other particulate matter in clear skies.
2
2.3. SBDART and OPAC models
The Santa Barbara DISORT atmospheric radiative transfer (SBDART, version 2.4) model is a practical tool for plane-parallel radiative transfer in the Earth's atmosphere, which is applied in studies of atmospheric energy budget and satellite remote sensing (http://www.crseo.ucsb.edu/esrg/paulsdir/). The code is based on a marriage among reliable and developed physical models, which have been consistently developed over the past few decades (Kundu et al., 2018). The model contains all important physical processes, such as infrared, visible, and ultraviolet radiation (Ricchiazzi et al., 1998). In this study, the SBDART model is used to simulate GHI, DNI, and DHI with different visibilities under clear-sky conditions, and the performance of the model under different air pollution levels is analyzed. SBDART is a software tool that computes plane-parallel radiative transfer in clear and cloudy conditions within the Earth's atmosphere and at the surface.The software package Optical Properties of Aerosols and Clouds (OPAC) was originally created for the purpose of an easy availability of spectral optical properties of aerosol particles (Hess et al., 1998). OPAC provides a comprehensive collection of refractive indexes of basic aerosol components over a wide wavelength from 0.25 μm to 40 μm, and allows the construction of aerosol types from several basic aerosol components. In this work, the optical characteristics of PM2.5 and PM10 are analyzed and compared by using the OPAC model, and the reasons why these two pollutants have different effects on SSR are further explained. OPAC is a software package that contains the optical properties in the solar and terrestrial spectral range of atmospheric particles, i.e., water droplets, aerosol, and ice crystals.
2
3.1. Statistical characteristics
To study the statistical characteristics of SSR in Nanjing, seasonal and diurnal variations of GHI, DNI, and DHI are analyzed and discussed in the following paragraphs.Figure 2 illustrates a simple visualization of GHI, DNI, and DHI in four different seasons, and the daily average values from 0600 LST to 1800 LST are used, including all the rainy, cloudy, and sunny days from March 2016 to June 2017 over Nanjing, China. The GHI and DHI have their highest values in spring simultaneously, with 344.85 W m?2 and 215.78 W m?2 on average, respectively. On the contrary, the GHI and DNI in autumn are the lowest, with 213.09 W m?2 and 114.49 W m?2 on average, respectively. In winter, the DNI reaches a maximum on average, of about 20 W m?2 larger than that in spring. Meanwhile, the DHI is the lowest among the four seasons. It is clear that the GHI and DHI in spring are the most unstable, while the variability in GHI and DHI in winter is the smallest, though some outliers of DHI occurred. The result is consistent with other research in Nanjing (Cai et al., 2009), except the radiation in winter. Combined with the total-sky images, we can easily find that winter is the least cloudy season. The variation of cloud cover modulates GHI and DNI effectively, and the anomalous absorption of GHI and DNI by clouds has been unexplained for a long time (Cess et al., 1995; Zerefos et al., 2009). Therefore, GHI and DNI in winter are both larger than those in autumn.
 Figure2. Seasonal average values of GHI, DNI, and DHI during March 2016–June 2017 over Nanjing, China. The diamonds represents the mean values, the horizontal lines inside the boxes are the medians, and the bottom and top sides of the boxes represent the first and third quartiles. The whiskers are the minimum (maximum) values within 1.5 interquartile ranges of the lower (upper) quartile, and the plus signs are outliers.
Figure 3 depicts the diurnal evolution (0600 LST–1800 LST) of GHI, DNI, and DHI in different seasons. In general, all three variables in the four seasons exhibit a maximum at noon and a minimum at sunrise and sunset. Nonetheless, great differences exist in the proportions of DNI and DHI among the four seasons. In spring, DHI accounts for a higher proportion than DNI from sunrise to sunset. However, it is the opposite in winter. In summer, the proportion of DHI at noon is more significant than DNI, but it is the opposite in the morning and afternoon. Nevertheless, this interesting phenomenon undergoes a reversal in autumn, except that they are roughly the same in the afternoon. DNI is larger than GHI in the morning in winter, and there is a similar situation in summer and autumn, but less significant.
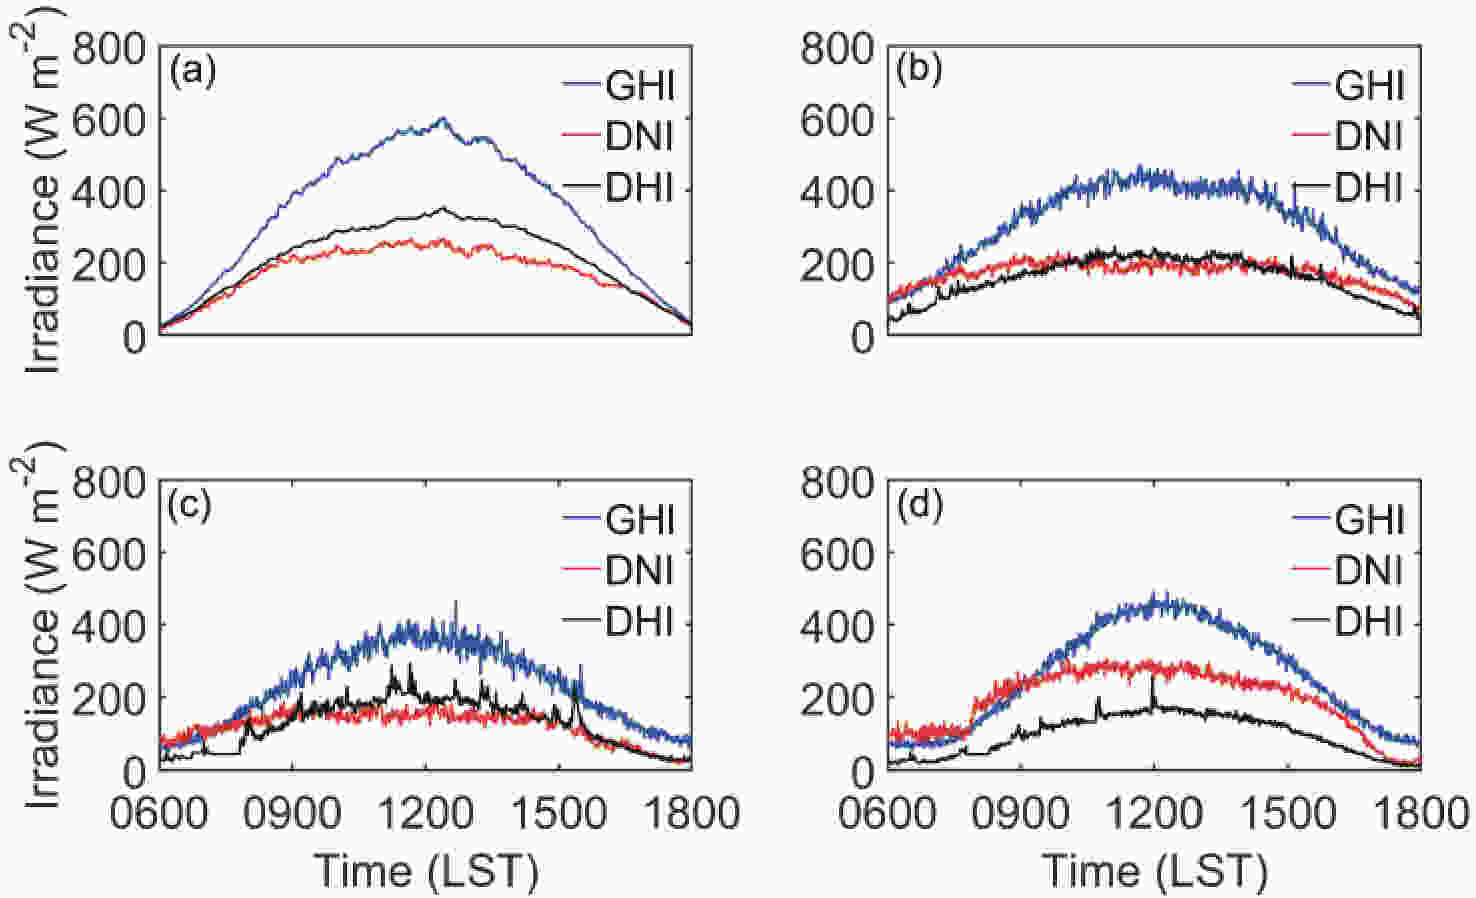 Figure3. Diurnal variations of GHI, DNI, and DHI: (a) spring; (b) summer; (c) autumn; and (d) winter. The abscissas are Beijing solar time.
Figure 4 displays the seasonal variations of AQI, particulate matter (PM10 and PM2.5), and visibility, separately. From the changes in AQI, PM10, and PM2.5, it is clear that air pollution in spring and winter is heavier than in summer and autumn over Nanjing, China. The descending order of air pollution during all four seasons in Nanjing is winter, spring, autumn, and summer. Wang et al. (2011) found that the concentrations of PM10 and PM2.1 have the same seasonal variation in Nanjing. In this study, we also find similar results as Wang et al. (2011), with additional results for other properties. For example, the more serious the air pollution, the lower the visibility, and Fig. 4 shows that there is lower visibility in spring and winter than in summer and autumn, which fits perfectly with the seasonal variations of AQI, PM10, and PM2.5. The especially large outliers of AQI and PM10 in spring correspond to wind-blown sand and dust on 7 May 2016. The good air quality and high visibility in summer are largely affected by the rain in June and July every year in the adjacent regions of the Yangtze River valley (Wang et al., 2018b). Scavenged by precipitation, the concentration of aerosols, dust, and other particulate matter suspended in the atmosphere would be low (Rodhe and Grandell, 1972).
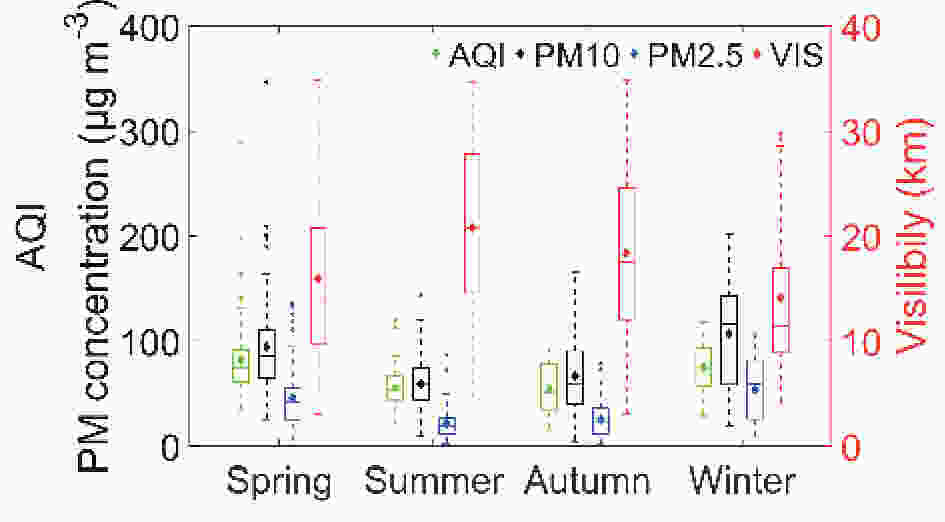 Figure4. Seasonal-averaged values of the PM10 and PM2.5 concentration, AQI, and visibility from March 2016 to June 2017.
2
3.2. SSR variation properties and reasons under different pollution levels
To study the variations in SSR for different pollution levels, we classify the air pollution into six levels according to the technical regulation on ambient AQI (HJ 633–2012, on trial) of China—excellent (


Previous studies have not discussed the characteristics of SSR (GHI, DNI, and DHI) under different air pollution levels, so we have addressed this issue for the first time in this study. Figure 5 shows the diurnal variations (0600 LST–1800 LST) of GHI, DNI, and DHI for different pollution levels. The number of samples in Figs. 5b and c are 28 good days and 7 slightly polluted days under clear-sky conditions. The reference cases, shown in Figs. 5a, d and e are 99 excellent days, 4 moderately polluted days, and 1 heavily polluted day, respectively. Almost all excellent and moderately polluted days occurred on rainy or cloudy days, and the heavily polluted day was influenced by the wind-blown sand and dust episodes from northern China. All the GHI, DNI, and DHI profiles have good regular diurnal variation, except during polluted days. The abnormal phenomenon of SSR is caused by the irregularity of rain and dust storms in Nanjing. The values of GHI are similar on good and slightly polluted days, but the proportions of DHI for the different pollution levels greatly differ (Fig. 5f). Figure 5f indicates that


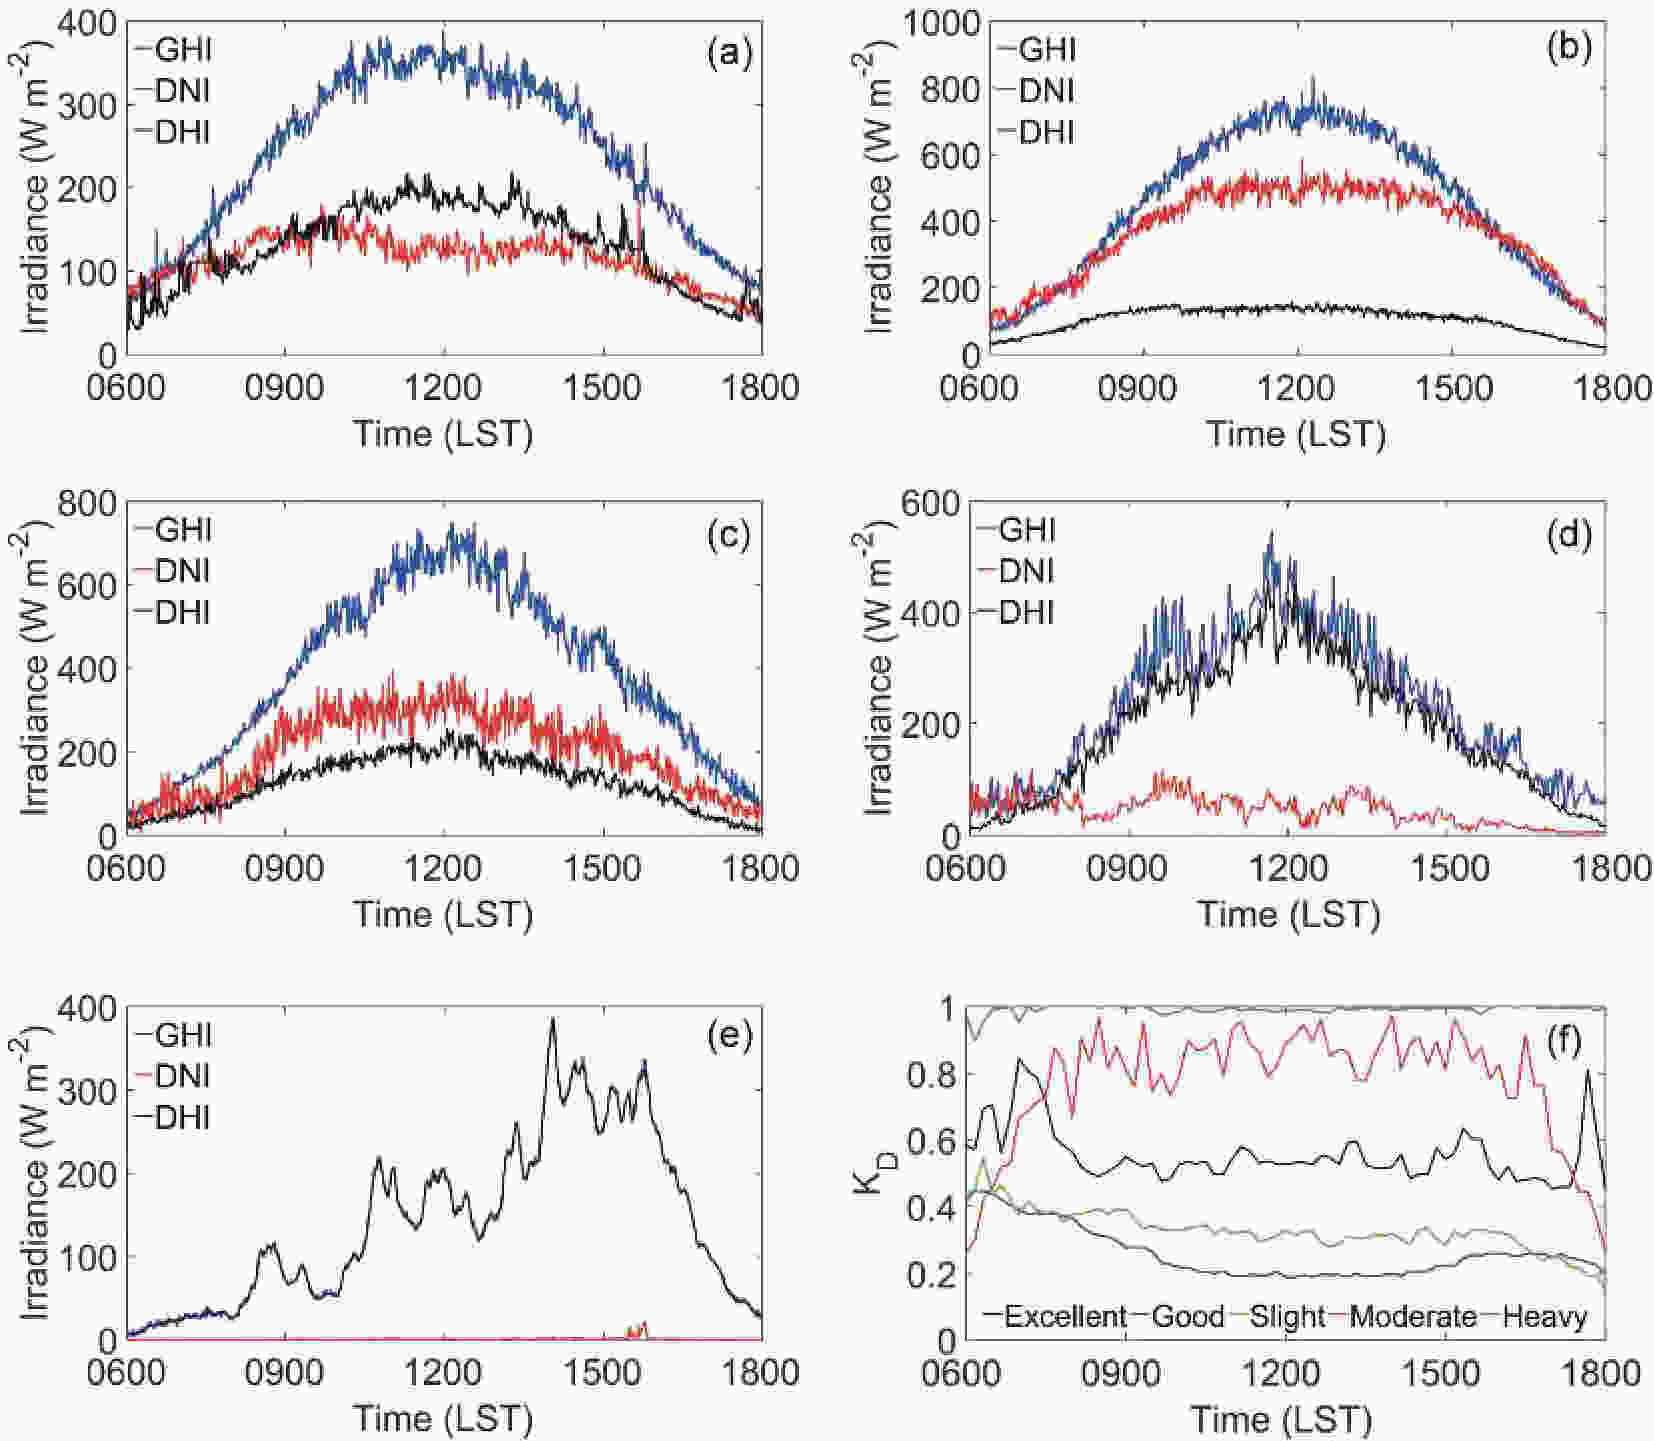 Figure5. Diurnal variations of GHI, DNI, and DHI under (a) excellent, (b) good, (c) slightly polluted, (d) moderately polluted, and (e) heavily polluted conditions. (f) Diurnal variations of the diffuse fraction (
The daily average values of SSR (GHI, DNI, and DHI), AQI, particulate matter (PM2.5 and PM10) concentrations, and visibility are used in this section to study the correlations between solar radiation, air pollution, and visibility under clear-sky conditions. For clear-sky conditions, the daily average of

To better understand the effect of particle size on SSR, the contributions of PM10 and PM2.5 to


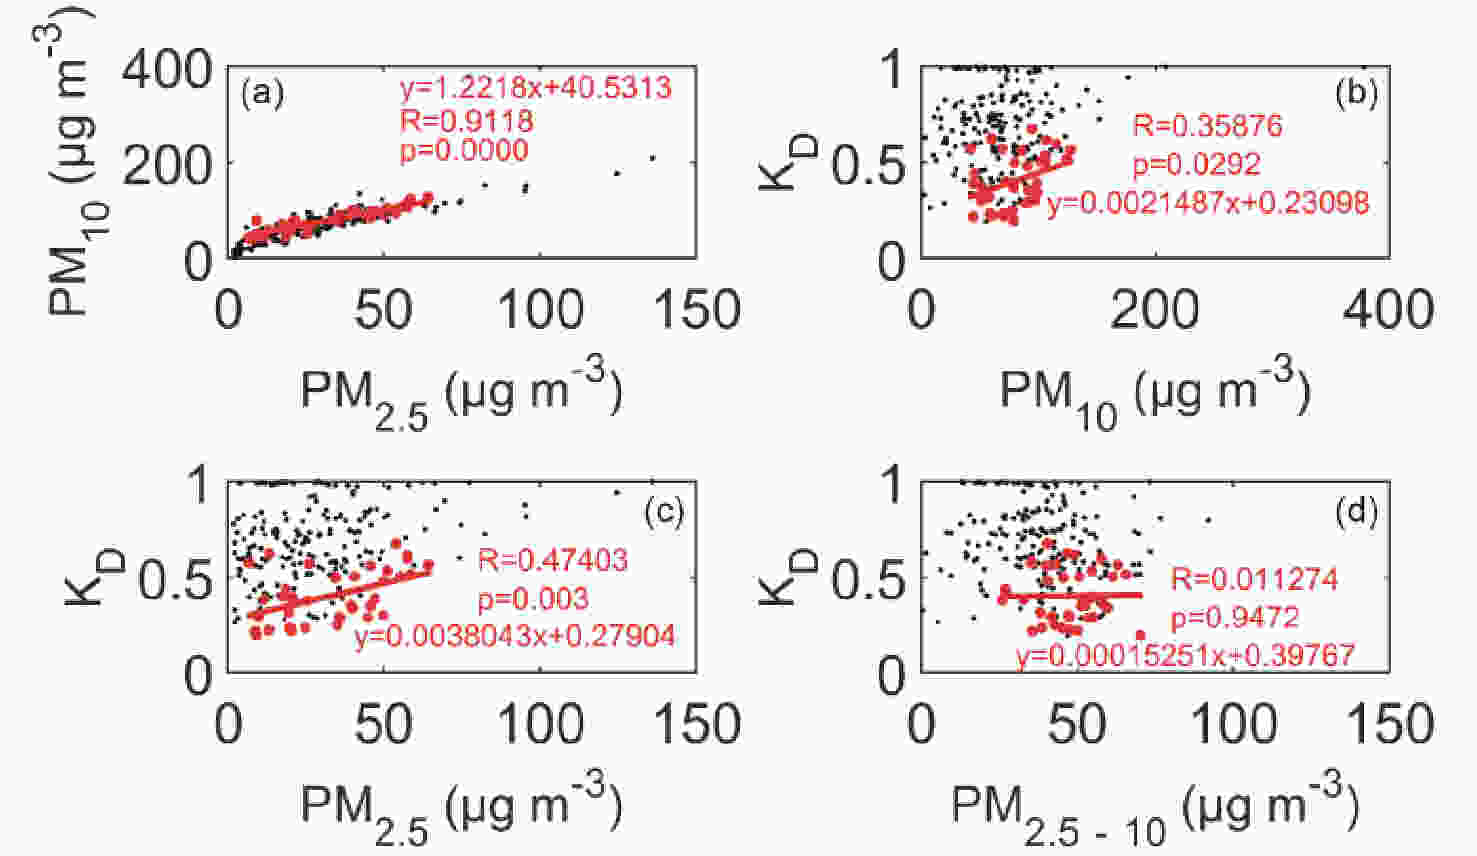 Figure6. (a) Correlation between PM2.5 concentration and PM10 concentration, (b) correlation between


The reasons for the above results were explored by OPAC, and two sensitivity experiments (case1 and case2) were carried out in this study to verify why PM2.5, rather than PM2.5?10, dominates the variation of


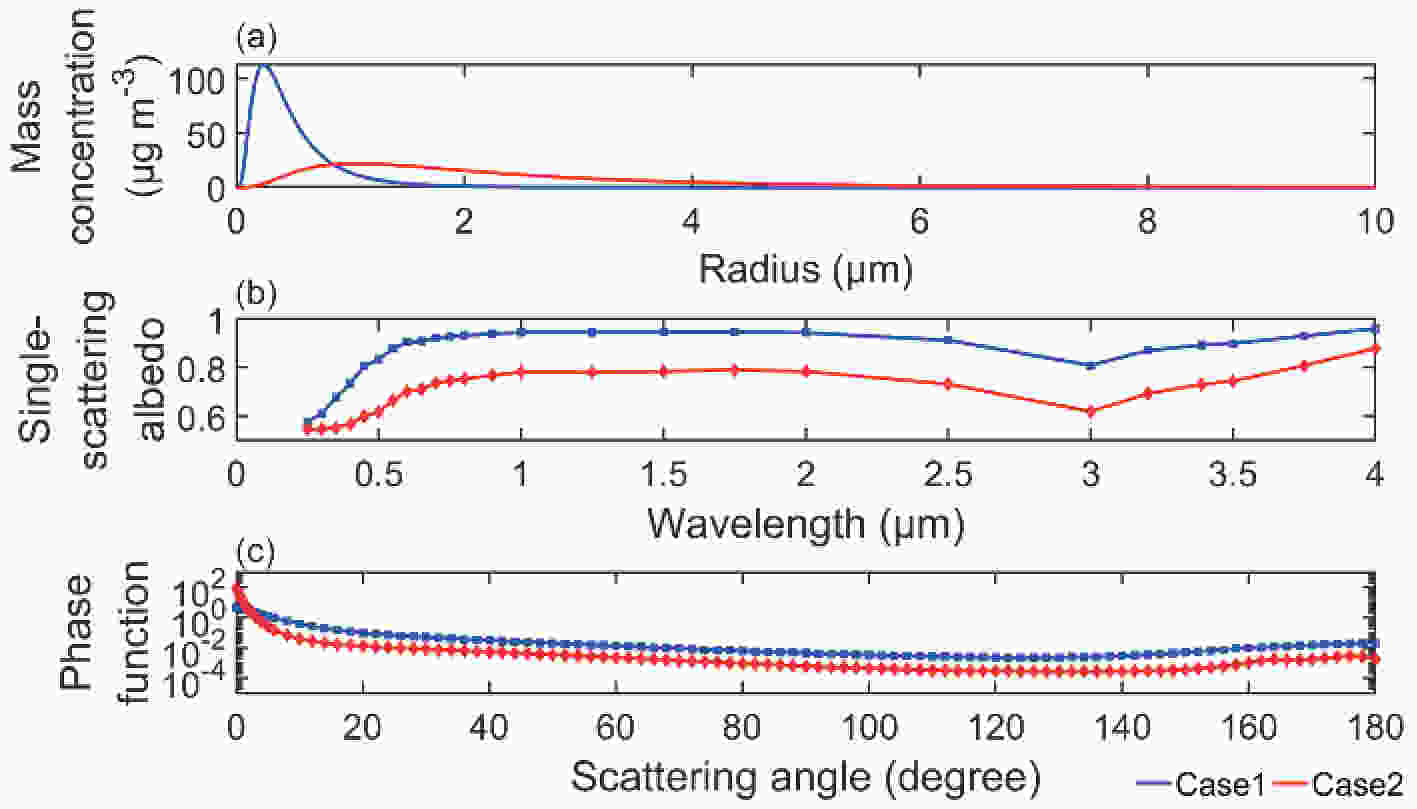 Figure7. (a) Particle size distributions, (b) variations of single-scattering albedo with the wavelength of solar spectrum, and (c) variations of phase function at 550 nm with the scattering angle for case1 (blue lines) and case2 (red lines).
Figure 8 gives the correlations between visibility and


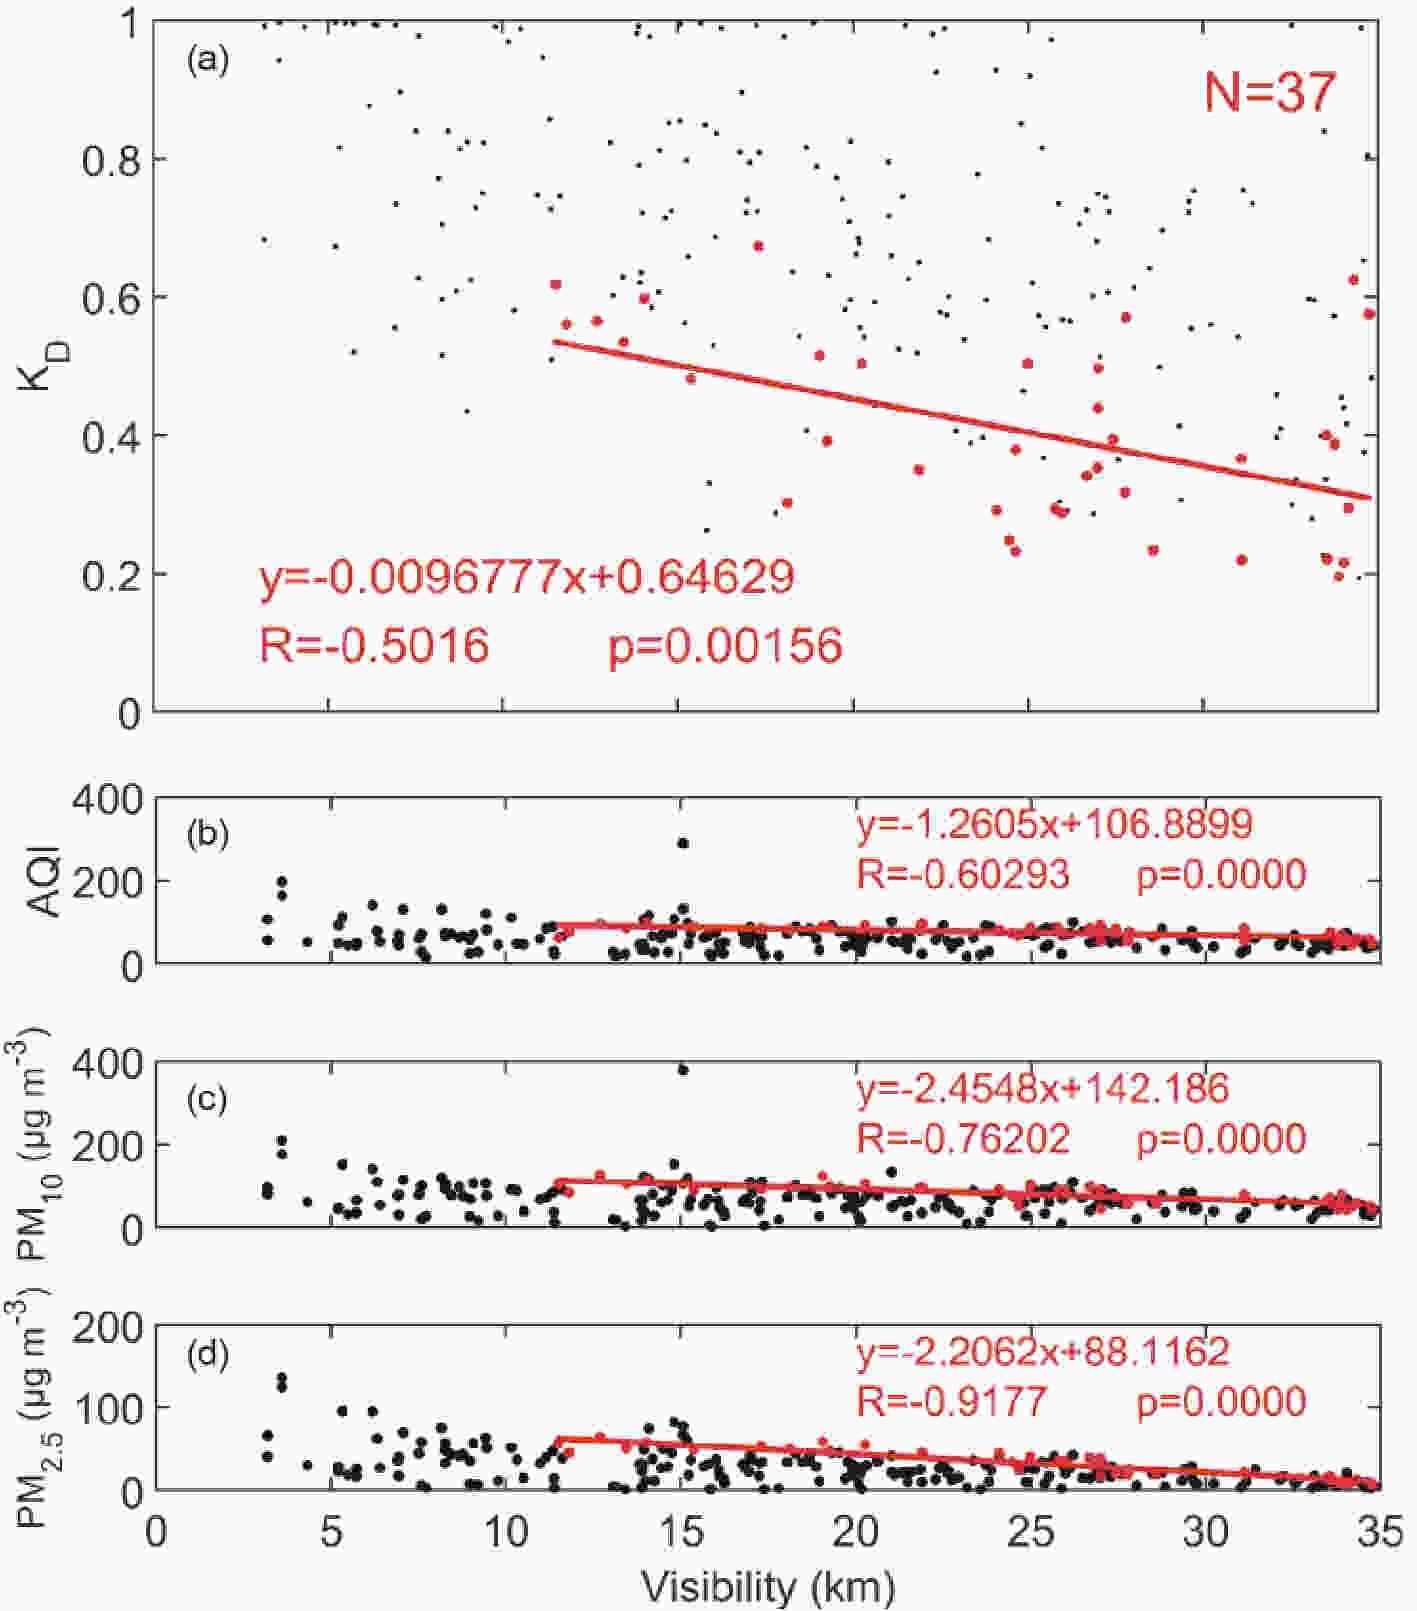 Figure8. (a) Correlation between
2
3.3. Case study
Previous studies have not determined whether the SBDART model is applicable to calculate SSR under different air pollution conditions, so a case study was carried out for verification in China. According to the correlations presented in section 3.2, we simulated GHI, DNI, and DHI with different visibilities under clear-sky conditions. Three different pollution levels were selected to study the performance of the model under different air pollution levels. Figure 9 displays the photos taken by the total-sky imager on 21 January 2017 (excellent), 16 January 2017 (good), and 9 February 2017 (slightly polluted). The daily average
 Figure9. Sky photos taken by the total-sky imager on (a) 21 January 2017, (b) 16 January 2017, and (c) 9 February 2017.
Here, we used the SBDART model to simulate GHI and DNI by inputting the corresponding visibility for the three days, and the DHI was calculated by equation (1) in section 2.2. Other main input parameters in this model were as follows: (1) atmospheric profile (idatm) = 3 (atmospheric profile: midlatitude winter; (2) aerosol information (iaer) = 2 (boundary layer aerosol type: urban; (3) infimum of wavelength (wlinf) = 0.3, supremum of wavelength (wlsup) = 3.0 (wavelength range: 300–3000 nm). Figure 10 indicates the results of the comparison between the observations and simulations, demonstrating that the simulation results generally agree with the observations, especially when the air quality is excellent, as shown in Fig. 10a.
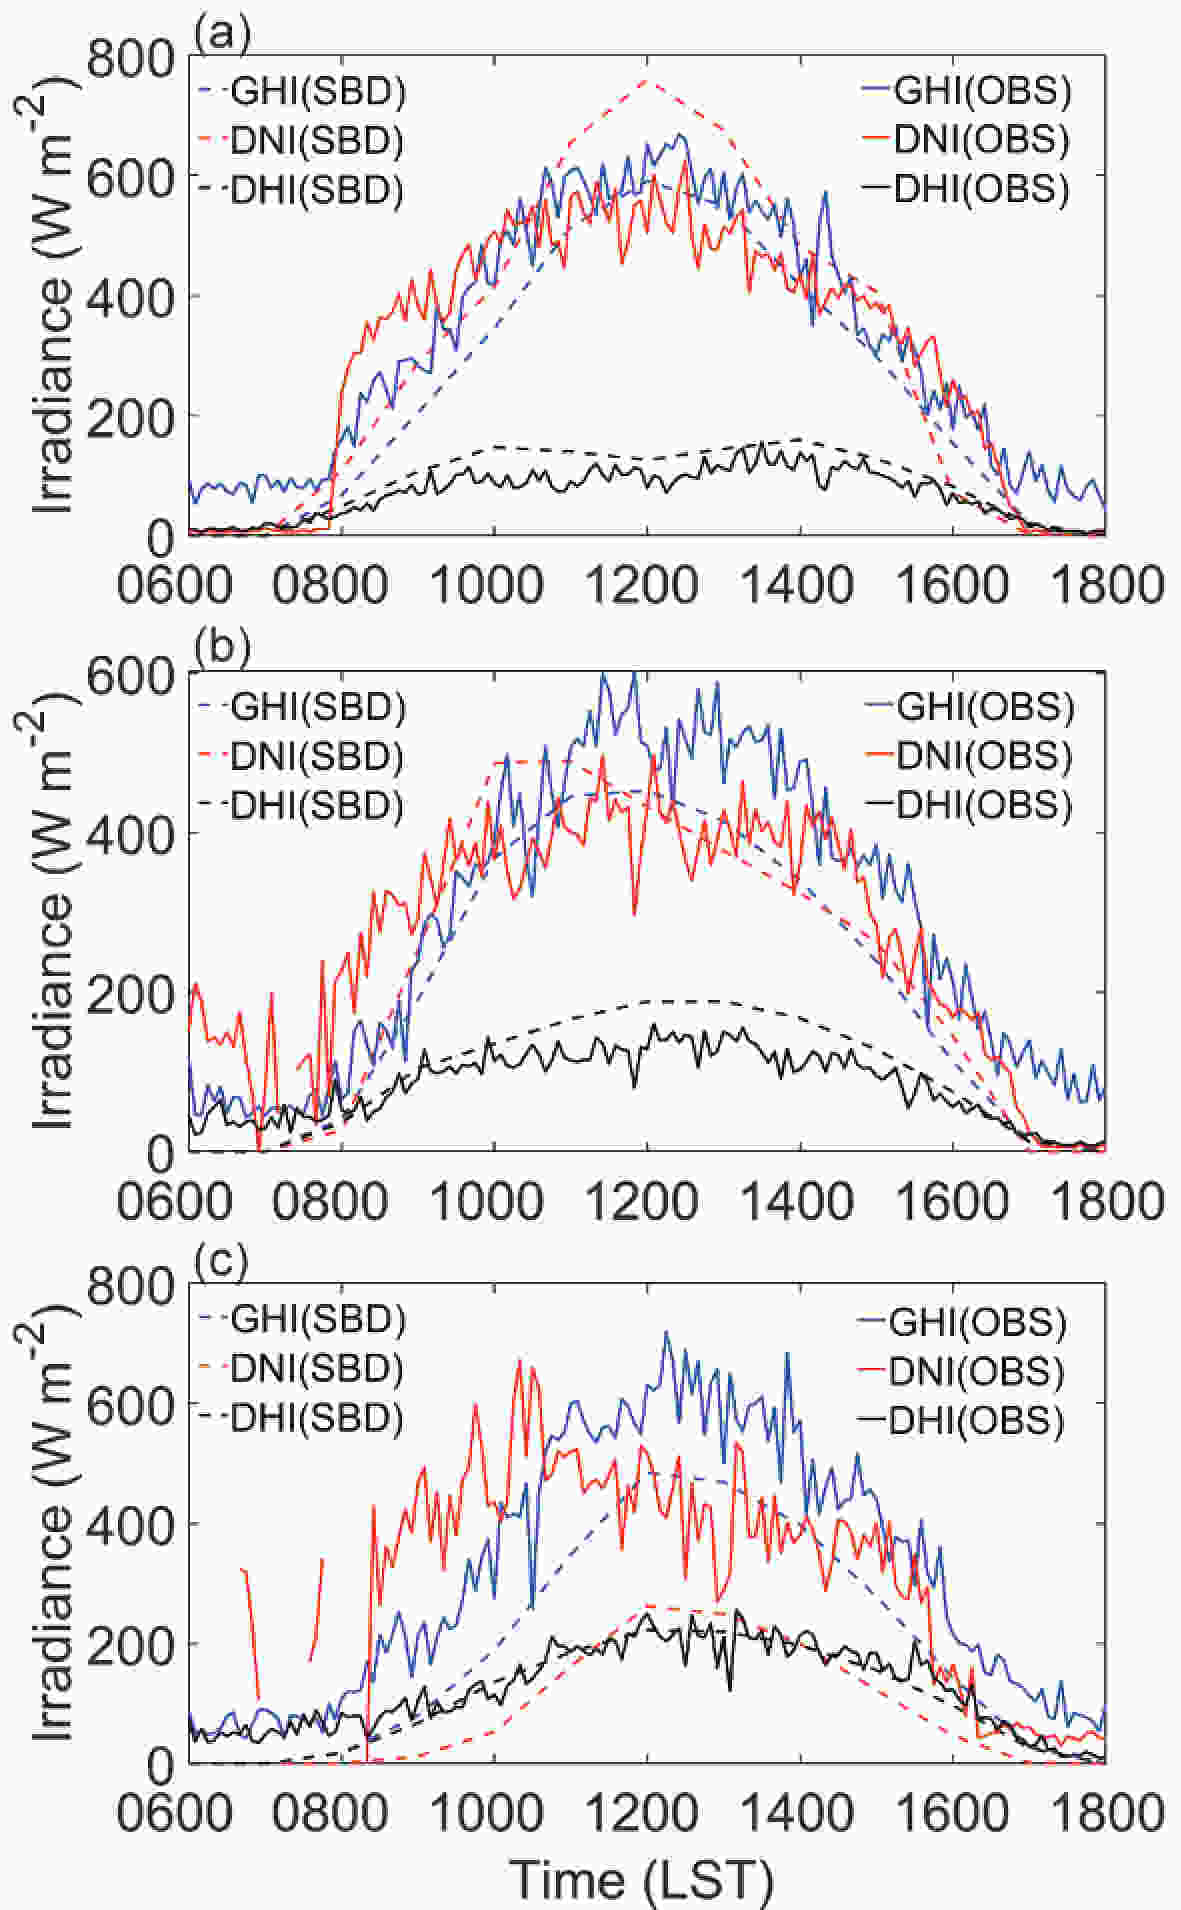 Figure10. Diurnal variations of GHI, DNI, and DHI on (a) 21 January 2017 (excellent AQ), (b) 16 January 2017 (good), and (c) 9 February 2017 (slightly polluted). The solid and dashed lines represent observations and simulation results, respectively.
Figure 11 depicts the correlation analysis between the observation and simulations of GHI, DNI, and DHI, respectively, using the hourly average data for the three days above. The red dashed lines represent the one-to-one line. The simulation results of DHI agree quite well with the observations. However, the simulation results of GHI and DNI are relatively lower than the observations.
 Figure11. Comparison between observations and simulation of (a) GHI, (b) DNI, and (c) DHI.
Because of the excessive consideration of the absorption of water vapor on the polluted sunny days when visibility is low, the SBDART-simulated values of DNI and GHI are lower than the measured data (Figs. 10b and c). Another possible reason is that the relationship between the visibility and the boundary-layer aerosol optical depth is not applicable to all regions; so, the visibility cannot fully reflect the optical characteristics of boundary-layer aerosols. In addition, the atmospheric vertical profiles and boundary-layer aerosols in the SBDART model are not consistent with real atmospheric conditions. Therefore, on a polluted sunny day, the simulation of GHI and DNI exhibits some inaccuracies. However, no matter what the air pollution level is, the simulation of DHI is generally consistent with the observed results, as shown in Fig. 11c. Obregón et al. (2015) validated the good performance of simulating GHI by SBDART model under different aerosol conditions in Portugal. For the first time, the applicability of the SBDART model under different air pollution levels in China has been confirmed. Meanwhile, since there are still some uncertainties in the simulation under different air pollution levels, the model will be further improved to have better application in China.
Generally, the GHI, DNI, and DHI have remarkable seasonal variations in Nanjing. Their descending trend by season follows spring–summer–winter–autumn for the GHI, winter–spring–summer–autumn for the DNI, and spring–summer–autumn–winter for the DHI. Cloud cover is the least in winter, leading to the greatest DNI among the four seasons.
In summer, DHI is greater at noon than DNI, but DNI is greater than DHI in the morning and afternoon. Nevertheless, this phenomenon in autumn reverses, except that they are almost equal in the afternoon.
With the increase in air pollution levels, the


We find that DHI can be well simulated by the SBDART model on the three clear days, but the GHI and DNI are well simulated only on days with excellent air quality. Generally, the present results suggest that performing calculations of SSR (GHI, DNI, and DHI) under different air quality conditions using the SBDART model with observational visibility is an effective approach in China.
Based on one-year observation data and numerical simulations, this work reveals the characteristics of SSR (GHI, DNI, and DHI) and its correlation with air pollution levels in Nanjing, China. Longer temporal and broader spatial data will be collected and integrated in a future study.
Acknowledgements. This work was jointly supported by the National Science Foundation of China (Grant Nos. 41775026, 41075012, 40805006, 91544230, 41822504, 41575133, and 41675030), the National Science and Technology Major Project (Grant No. 2016YFC0203303), and the Natural Science Foundation of Jiangsu Province (Grant Nos. BE2015151 and BK20160041). In addition, the authors would like to thank the two anonymous reviewers for their valuable comments and suggestions, which greatly helped to improve the quality of this article.
