HTML
--> --> -->These studies mostly focused on June?July rainfall, but rainstorms did not stop in August 2020. An adjustment of the circulation in August from that in June and July was noticed by Liu et al. (2021). They pointed out that the subtropical high experienced a northward shift in August, which was contributed by the tropical Madden-Julian Oscillation. The abnormal southwesterly winds at the western edge of the subtropical high extended to North-Northeast China, forming an abnormal northeast-southwest rainbelt that is noticeably different from that during June?July (Liu et al., 2021). Frequent rainfall events affected the Eastern Periphery of the Tibetan Plateau (EPTP) and the western Sichuan Basin (SCB), leading to waterlogging, landslides and flooding in August. The SCB rainfall event in mid-August was ranked as one of the top ten weather/climate events in 2020 by the National Climate Center, accompanied by the extraordinary mei-yu over the Yangtze?Huaihe River valley. However, there has been little research on rainfall characteristics over the EPTP in August 2020.
The EPTP connects the Tibetan Plateau in the west and the SCB in the east (Fig. 1) and is located in the corridor between the Indian and East Asian summer monsoon regions (Wang and Ho, 2002). The orography of the EPTP is characterized by steep slopes and a bell shape (Xi, 1992; Hu and Yuan, 2021), and precipitation in this region is modulated on multiple scales by topography. The well-known ЁАrainy cityЁБ of YaЁЏan, which has the highest annual precipitation and number of rainy days in inland China, is located in this region (Zeng et al., 1994; Li et al., 2010). Many studies of precipitation mechanisms over the EPTP and western SCB have been conducted previously. For example, Chen et al. (1963) discussed a rainfall process from August 17-21, 1958 on the basis of a large-scale analysis. Their results showed that heavy rainfall appeared in a stationary low pressure system without any surface front. The subtropical high stretched westward, and thus, there was sufficient water vapor supply in the whole troposphere. Convective instability near the surface, a dry front in mid-levels, and a trough at high-levels (500?400 hPa) induced upward motion, which triggered precipitation. The role of the low-level easterly winds blowing perpendicular to the eastern slope of the Tibetan Plateau was also emphasized (Zhou and Wu, 2015; Li et al., 2016). The topography of the eastern slope of the Tibetan Plateau could force ascent as it blocked the easterly winds (Zhao et al., 2012). Air rising up the slope and the cyclonic shear induced from the flow around the barrier were both favorable for the initiation and development of convective rainstorms. At a longer time scale, Zhu and Yu (2003) studied the interannual variation in summer precipitation over the western SCB and its relationship with large-scale circulation patterns. They found that flooding years in the western SCB were closely related to two ridges of high pressure located in the Ural Mountains and East Asia and the trough between Balkhash and Lake Baikal.
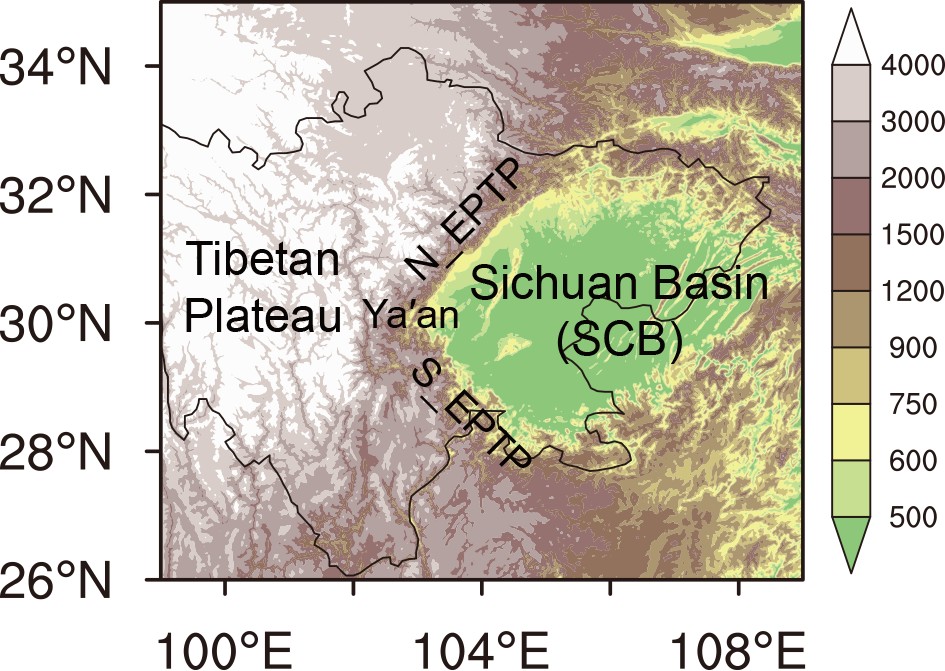 Figure1. Topography around the Eastern Periphery of the Tibetan Plateau (EPTP). The color shading represents the terrain height in meters. The EPTP connects the Tibetan Plateau in the west and the Sichuan Basin in the east. The EPTP can be divided into northern (N_EPTP) and southern (S_EPTP) slopes. The ЁАrainy cityЁБ of YaЁЏan is located in the center of the EPTP.
The rainfall characteristics, especially the fine-scale characteristics over the EPTP, were somewhat limited in early years due to the lack of in situ observations. With the help of ground- and satellite-based radar, the fine-scale structure of rainfall was revealed in more recent studies (Xu and Xiao, 2015; Heng and Li, 2017; Wang et al., 2017). With the increased station density over the EPTP, more detailed rainfall characteristics could be revealed with rain gauge data (Chen et al., 2018; Hu et al., 2020), which may be helpful for better understanding rainfall mechanisms. As the EPTP rainfall in August 2020 appeared to be extraordinary, it is worth first analyzing the rainfall characteristics and locating the differences.
The aims of this study were (1) to give a comprehensive description of the characteristics of the extraordinary rainfall over the EPTP in August 2020 and (2) to investigate the anomalous circulation and systems of influence that resulted in this rainfall. This paper aims to point the attention of the research community toward this period of intense precipitation, which could further expand our understanding of the mechanisms of rainfall over this region. Section 2 describes the data and methodology used. Sections 3 and 4 present the results of the rainfall and circulation analyses, respectively. The discussion and conclusion are presented in sections 5 and 6, respectively.
 Figure2. Average accumulated rainfall (mm) in August (a) from 1986 to 2019, (b) from 2017 to 2019, and (c) accumulated rainfall observed in August 2020. The gray shading represents the topography (m). The three white boxes in (a) represent the S_EPTP, YaЁЏan, and the N_EPTP where rainfall was concentrated in August 2020, from south to north. The black rectangles in (a) that are numbered 1 to 50 were used to calculate the area averages of rainfall and topography, which are shown in Fig. 5.
The hourly rainfall amount (intensity) was defined as the total rainfall amount divided by the number of nonmissing hours (rainy hours). The ratio of rainy hours to total nonmissing hours was defined as the rainfall frequency. The hours with Ён0.1 mm rainfall are referred to as rainy hours. The amount, intensity and frequency of rainfall all have diurnal cycles, and the timing of the peak is referred to as the diurnal phase.
3.1. Accumulated rainfall amount: magnitude and distribution
Figure. 2 shows the accumulated rainfall in August 2020 (Fig. 2c) compared to the average accumulated rainfall from August 2017 to August 2019 (Fig. 2b) and from 1986 to 2019 (Fig. 2a). The average cumulative amount of rainfall in August from 2017 to 2019 is shown by a denser network of stations and had a similar spatial pattern as that averaged in August from 1986 to 2019. In general, the largest amount of rainfall was distributed around the EPTP in both August 2020 and previous months of August. The region with the highest amount of rainfall in earlier years was around YaЁЏan and its southeastern slope (south to 30ЁуN, S_EPTP, Fig. 2b). The amount of rainfall decreased from the S_EPTP to the northeastern SCB (Figs. 2a and b). In contrast, in August 2020, the high rainfall region was around YaЁЏan and the northern slope of the EPTP (north to 30ЁуN, N_EPTP, Fig. 2).The accumulated rainfall over the YaЁЏan region and the N_EPTP was much larger than the average in previous months of August, and the amount of rainfall decreased from the N_EPTP to the southeastern SCB. Specifically, the regional maximum of the cumulative amount of the previous yearЁЏs average was approximately 926 mm, and there were only 50 stations where the amount of rainfall was Ён500 mm. The maximum accumulated rainfall at a single station in August 2020 was 1708 mm, almost twice the average of the previous August. A total of 150 stations recorded Ён1000 mm of rainfall.
We calculated the regional average and maximum rainfall since 1986 for the YaЁЏan region and the N_EPTP (Fig. 3). The rainfall in these two regions varied in a similar manner. The multiyear averages of the regional maximum amount of rainfall in the YaЁЏan region and the N_EPTP were 525 and 345 mm, respectively. The amount of rainfall reached a peak in 2020 in both regions. The amount of rainfall was larger in the YaЁЏan region than in the N_EPTP in the previous August but was larger in the N_EPTP region in August 2020.
 Figure3. (a) Regional maximum and (b) mean accumulated rainfall (mm) averaged over the N_EPTP (dashed lines) and YaЁЏan (solid lines) regions, as shown in Fig. 2 in August from 1986 to 2020.
2
3.2. Hourly scale rainfall characteristics
The accumulated rainfall around the EPTP in August 2020 had unique characteristics: the amount of rainfall was the largest recorded in the last 35 years, and the rainfall was distributed over both the YaЁЏan region and the N_EPTP. The spatial distributions shown in Figs. 2a and 2b are similar, despite the large discrepancy in the number of stations and the time periods of the calculations. The mean state of the dense station network in August 2017?19 was taken as the climatological mean in the following analyses, and some fine-scale characteristics were analyzed.The hourly average amount, frequency, and intensity of rainfall from August 2017?19 were compared with those in August 2020 (Fig. 4). The distribution of the hourly rainfall was similar to that of the accumulated rainfall (compare Figs. 4a and 4d with Figs. 2b and 2c), which was centered over the YaЁЏan region and the S_EPTP in the previous August and over the YaЁЏan region and the N_EPTP in August 2020. The frequency of rainfall in the basin was relatively homogeneous in 2017?19, with values generally between 5% and 10%. The frequency over the EPTP was high, with the maximum rainfall in the funnel-shaped terrain around YaЁЏan, where some stations exceeded 25%. In contrast, the frequency was much larger over the N_EPTP and the YaЁЏan region in August 2020, whereas the frequency was lower over the eastern SCB than in the previous August (Fig. 4b). The frequency clearly increased from the southeastern SCB to the N_EPTP, presenting a northeast-southwest striped structure. The largest intensity of rainfall also occurred over the EPTP (Fig. 4c). Intense rainfall was recorded over the S_EPTP in the previous August, whereas the N_EPTP region had the heaviest rainfall in August 2020 (Fig. 4f). Therefore, the large amount of rainfall over YaЁЏan and the N_EPTP in August 2020 was recorded as frequent, intense rainfall. Intense precipitation distributed in the SCB is also noted in Fig. 4f, which may result from the interaction between the local topography and different leading synoptic systems, such as the southwest vortex and low-level jets (Xiao et al., 2021). The amount and frequency of rainfall over the southeastern SCB were both lower in August 2020 than in previous years.
 Figure4. (a, d) Hourly mean (mm d?1), (b, e) frequency (%) and (c, f) intensity of rainfall (mm h?1) averaged for (aЈCc) August 2017ЈC19 and (dЈCf) August 2020. The stations where the values were below the minimum level are omitted. The gray shading represents the topography (m).
The distributions of the amount, frequency and intensity of rainfall showed a close relationship with the height of the terrain (cf. Fig. 4). To show this relationship more clearly, the average amount, frequency and intensity of rainfall were calculated in each black box in Fig. 2, from the Tibetan Plateau (box 1) to the southeastern SCB (box 50) (Fig. 5). The terrain is higher in the northwest and lower in the southeast (gray line in Fig. 5a). There exists a steep change in terrain height from boxes 16 to 26, roughly corresponding to the location of the N_EPTP. From east to west (boxes 50 to 1), the amount of rainfall in August 2020 first slowly increases as the terrain height increases and then sharply increases around box 26, where the terrain height changes rapidly (solid black line in Fig. 5a). The amount and frequency of rainfall reaches a peak at approximately 1300 m (box 23, solid black lines in Fig. 5a and Fig. 5b). The amount and intensity of rainfall decreases rapidly when the terrain height is >1300 m (solid black lines in Fig. 5a and Fig. 5c), but the change in the frequency of rainfall is slower and occurs at a higher altitude (solid black line in Fig. 5c). This result may be because there was less water vapor over the high-altitude region, which had a greater influence on the intensity than the frequency of rainfall.
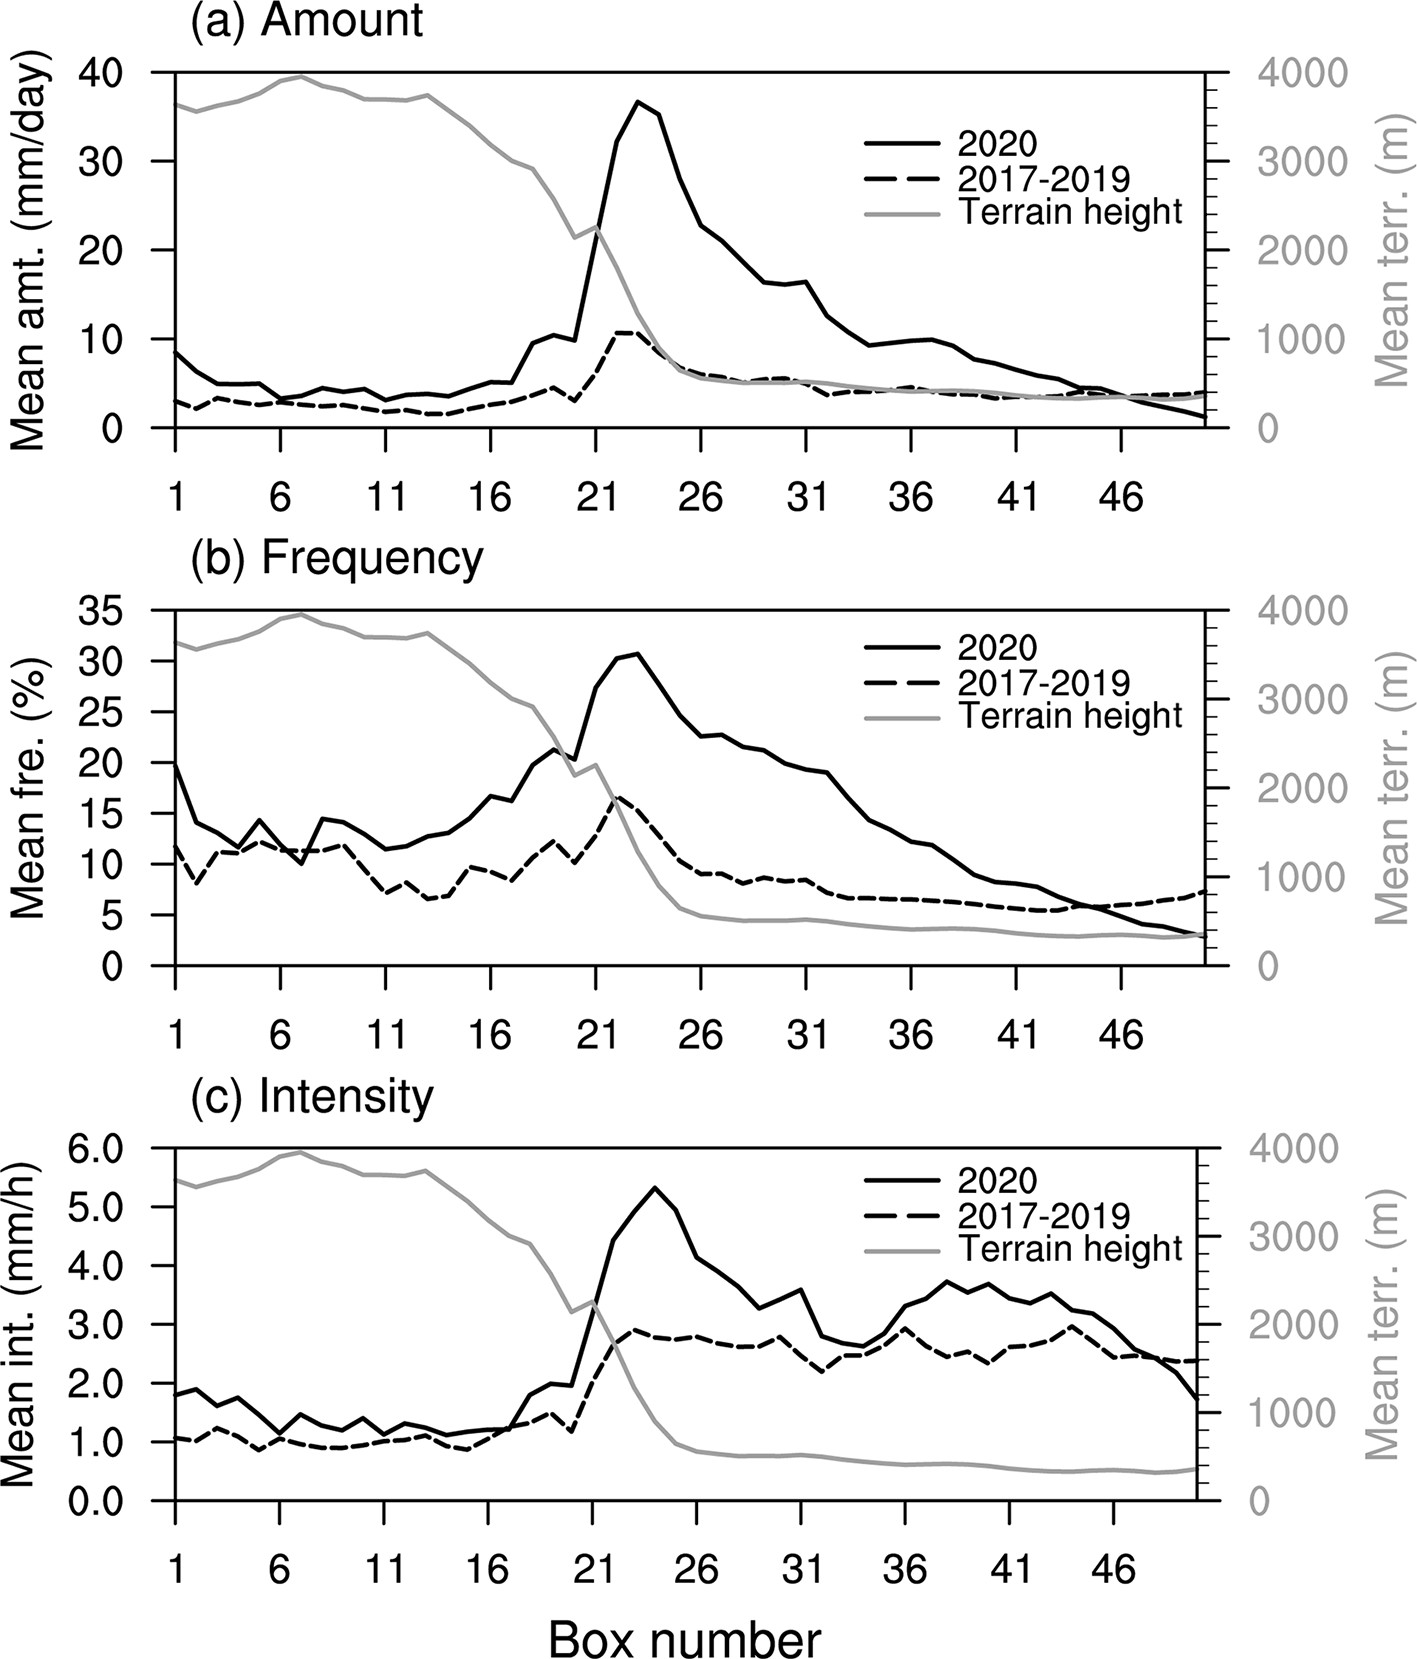 Figure5. Regional mean of the (a) hourly amount (mm d?1), (b) frequency (%) and (c) intensity (mm h?1) of rainfall in August 2017ЈC19 (dashed lines) and in August 2020 (black solid lines) and the terrain height (gray solid lines; m) averaged in the black boxes in Fig. 2. Box numbers 1ЈC50 represent boxes from northwest to southeast.
The intensity of rainfall was much lower over the Tibetan Plateau than over the SCB, whereas the frequency was slightly higher (solid black lines in Fig. 5b and Fig. 5c). Therefore, the amount of rainfall was slightly lower over the Tibetan Plateau than over the basin (solid black line in Fig. 5a). The average results for previous years showed some similar characteristics to August 2020: (1) the amount and frequency of rainfall first increased and then decreased with the height of the terrain; (2) the frequency of rainfall was higher over the Tibetan Plateau than over the basin, whereas the intensity of rainfall over the Tibetan Plateau was weaker than that over the basin; and (3) the intensity of rainfall decreased as the height of the terrain increased.
However, there are also some differences. In the previous August, the amount and frequency of rainfall shows little change from boxes 50 to 26 and then shows a larger increase from boxes 26 to 22, reaching a peak at box 22 (dashed lines in Fig. 5a and Fig. 5b). In contrast, there is a steady change from boxes 50 to 26 in August 2020, and a significantly larger increase is seen from boxes 26 to 22, with the peak on the EPTP at lower altitudes (box 23, solid black lines in Fig. 5a and Fig. 5b). From boxes 26 to 23, the amount of rainfall (terrain height) increases by approximately 14 mm d?1 (726 m) in August 2020 (solid line in Fig. 5a), which is significantly larger than the 4 mm d?1 in previous years (dashed line in Fig. 5a). The intensity of rainfall was homogeneous over the SCB and the Tibetan Plateau in the previous August (dashed line in Fig. 5c), with only a sharp decrease from boxes 24 to 21. In August 2020, however, there was a sharp increase in intensity over the N_EPTP, showing a large amplification of the effect of the terrain and then a decrease in intensity over the plateau (solid black line in Fig. 5c). The amount, frequency and intensity of rainfall were all larger in the previous August over the southeastern SCB (beyond box 46).
The diurnal cycle is another important hourly characteristic of rainfall (e.g., Yu et al., 2007; Yuan et al., 2013; Chen, 2020). Figure. 6 shows the diurnal phase of the precipitation amount, which is defined as the time when the maximum precipitation occurred, following Yu et al. (2007). In the previous August, rainfall over the YaЁЏan region and the S_EPTP mainly peaked between 0100 and 0500 LST [Local Standard Time (LST) = UTC+8 h, Fig. 6]. The N_EPTP was dominated by rainfall in the morning and afternoon, and the eastern SCB was dominated by rainfall in the afternoon and evening. In contrast, the rainfall peaks over the S_EPTP in August 2020 generally occurred from 2300 to 0300 LST, and the N_EPTP was dominated by rainfall in the 0100?0500 LST time period, earlier than in the previous August.
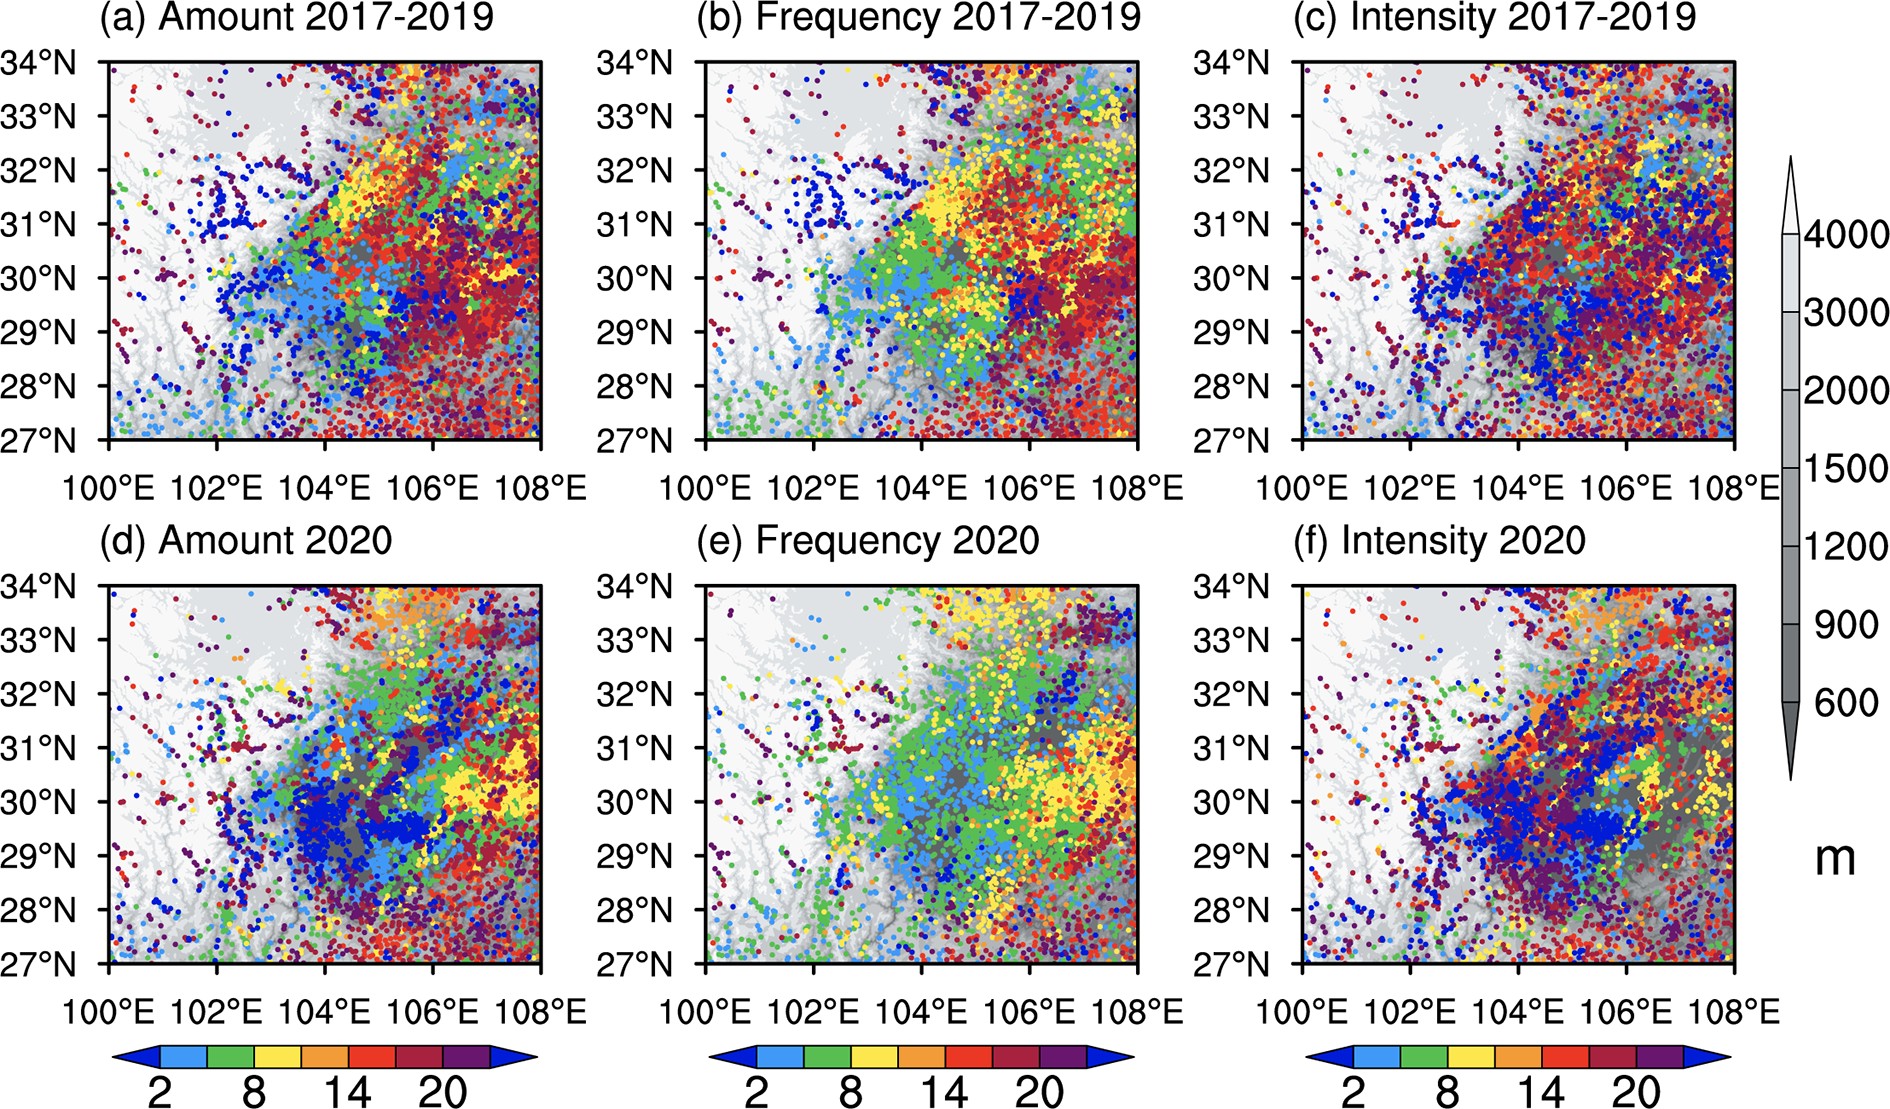 Figure6. Diurnal phase [Local Standard Time (LST) = UTC+8 h] of (a, d) amount, (b, e) frequency and (c, f) intensity of rainfall in August 2017ЈC19 (aЈCc) and in August 2020 (dЈCf). The gray shading represents the topography (m).
This time shift in the diurnal phase was also observed in the frequency of rainfall. Unlike the previous morning to noon phases, the N_EPTP showed a predawn diurnal phase of rainfall frequency in August 2020. The eastern part of the SCB was dominated by an afternoon and evening diurnal phase in the previous August and by a morning phase in August 2020. The diurnal phase of rainfall intensity was not distributed homogeneously in either the previous August or August 2020. Even though nocturnal rainfall intensity dominated the EPTP in the previous August, more stations showed a noon to afternoon diurnal phase over the N_EPTP in August 2020.
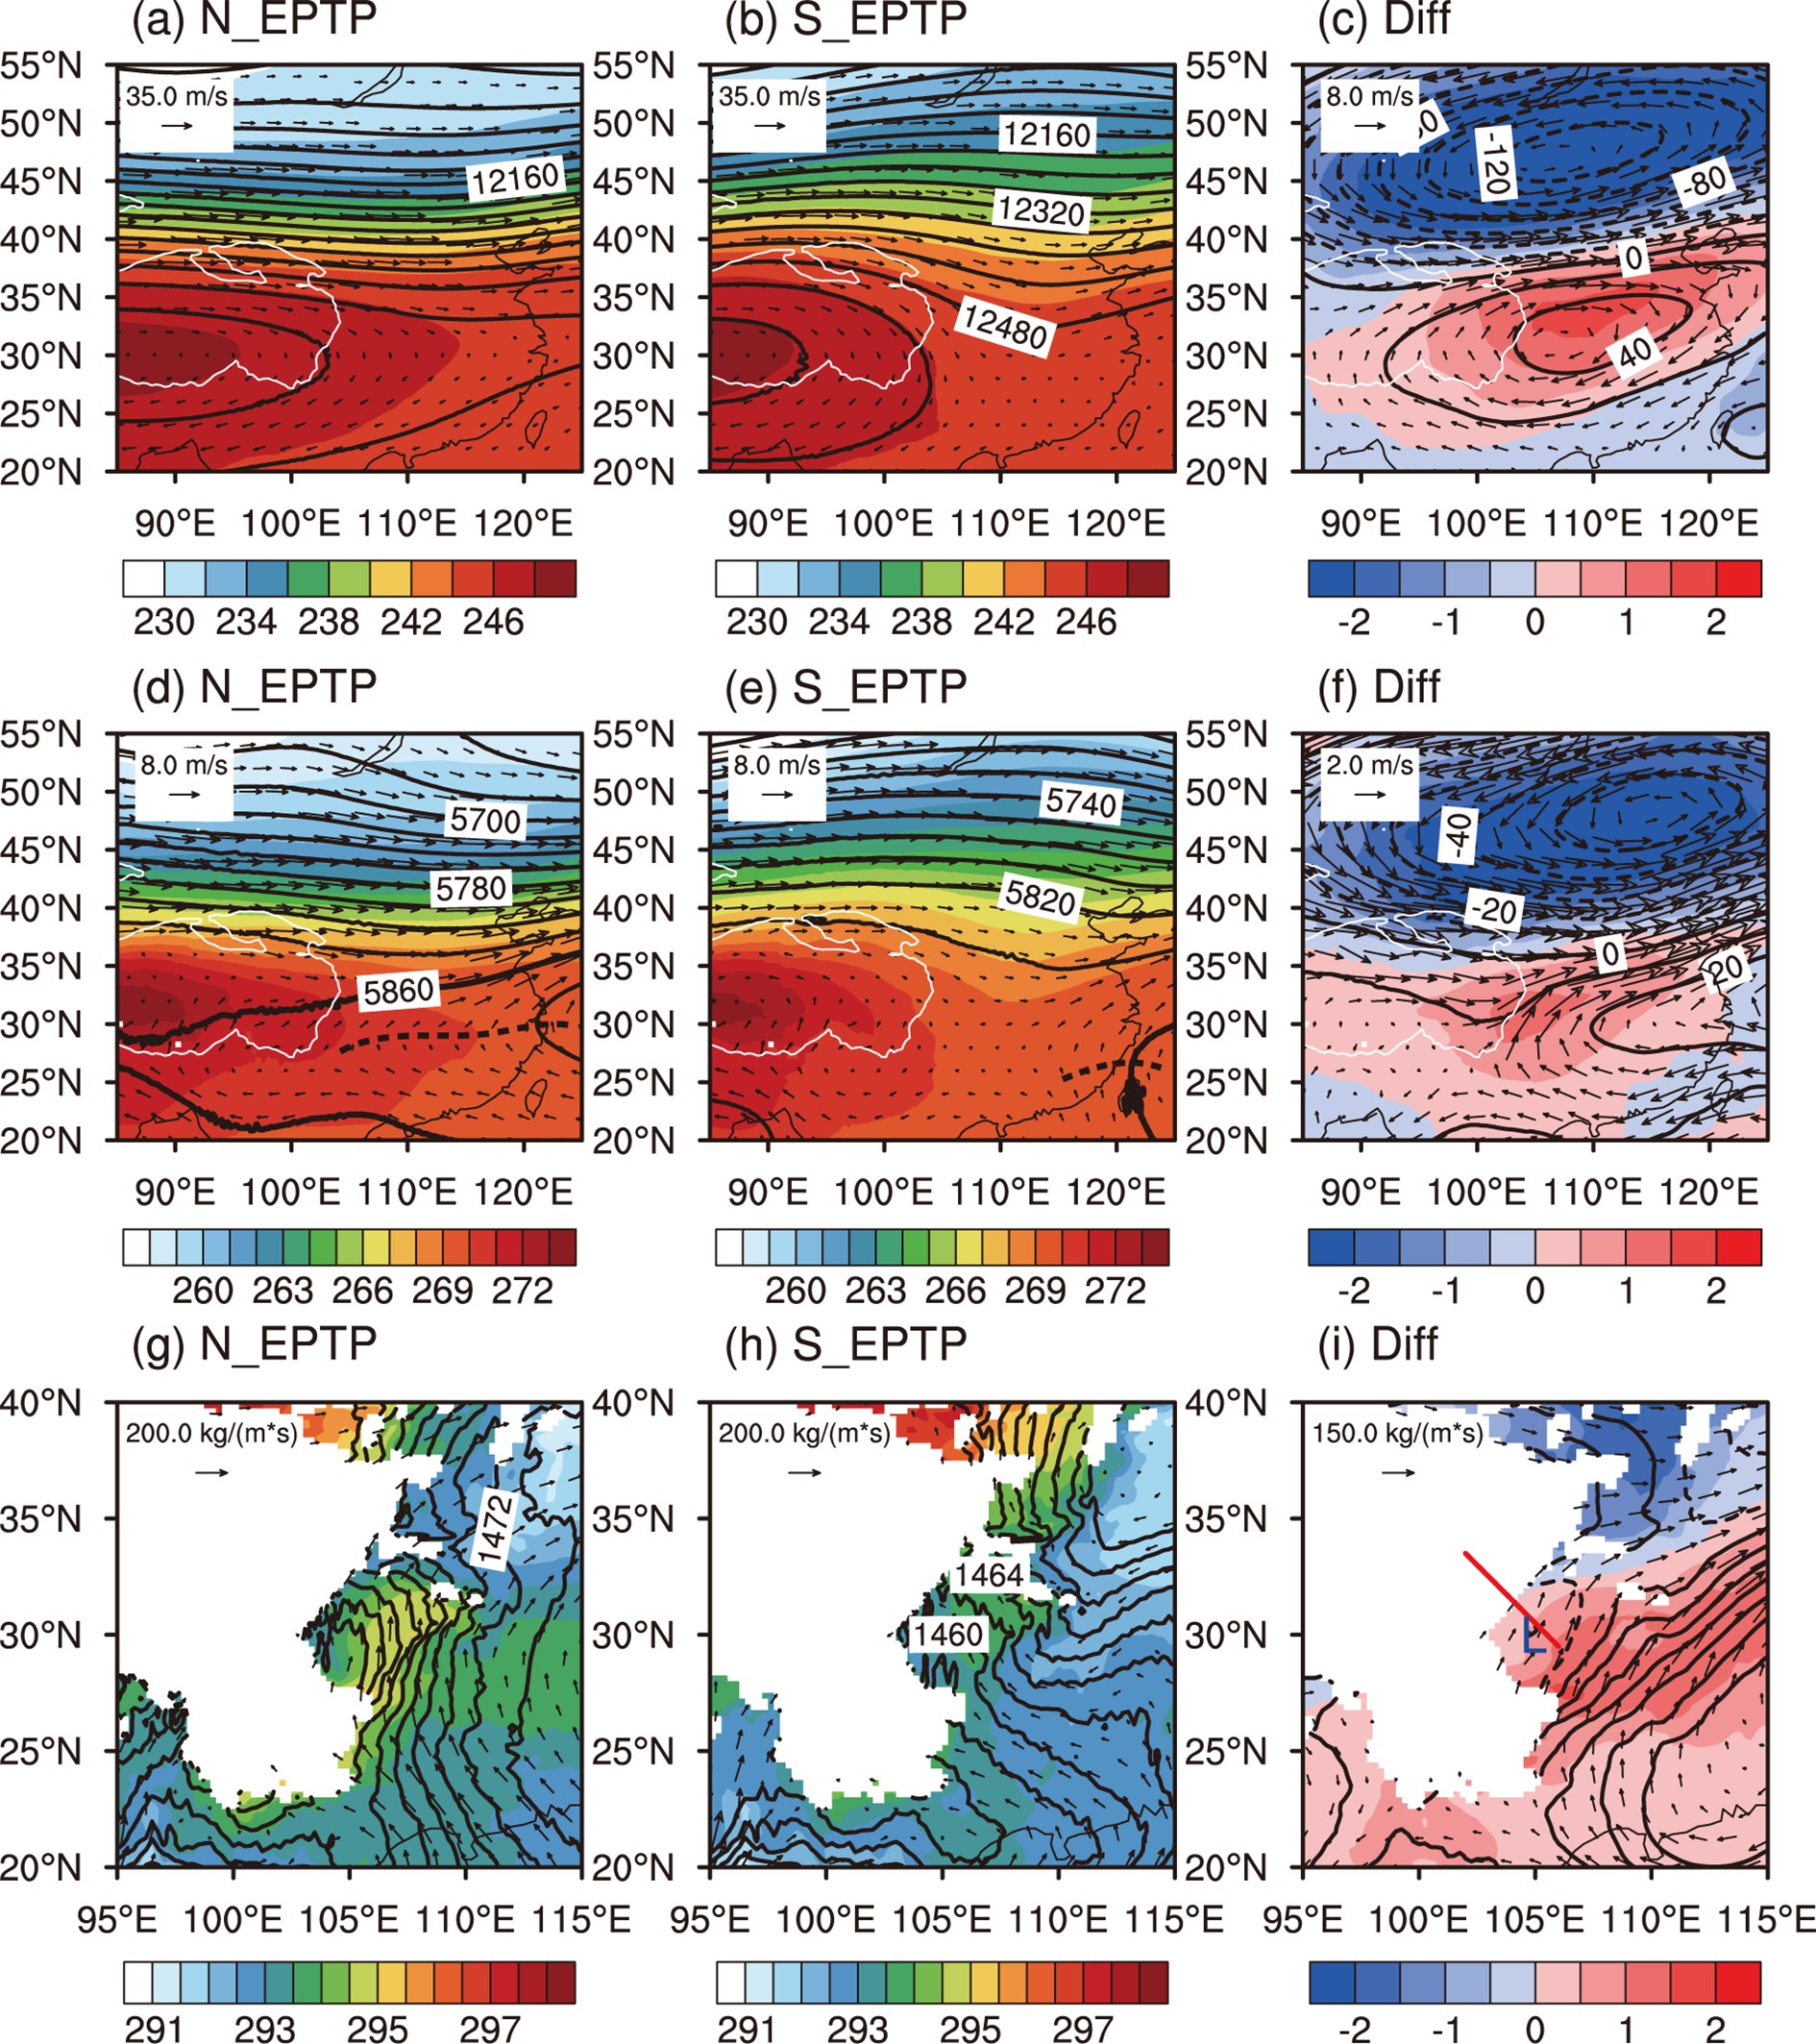 Figure7. Monthly mean circulation in N_EPTP rainfall years (a, d, g, August 1990, 1995, 2003, 2010), S_EPTP rainfall years (b, e, h, August 1991, 1999, 2002, 2018) and their differences from the upper level to the lower level (c, f, i). The black solid lines in (aЈCc) and (dЈCf) represent the 200 hPa and 500 hPa geopotential heights (gpm), respectively. The vectors represent the (aЈCc) 200 hPa winds (m s?1), (dЈCf) 500 hPa winds, and (gЈCi) vertical integrated water vapor flux (kg m?1 s?1). The 5860 gpm contours are presented as thickened black solid lines, and the ridge line of the subtropical high is shown as black dashed lines in (dЈCe). The shading represents temperature (K). The white line indicates the 3000 m terrain height. The red line in (i) indicates the position of the cross section shown in Fig. 8, and the letter ЁАLЁБ in (i) indicates the position of the anomalous vortex.
The temperature difference fields (shading in Figs. 7c, f, and i) show that the northern Tibetan Plateau was cooler and warmer over the main body of the Tibetan Plateau and south of 35ЁуN, respectively. Such a dipole pattern of temperature anomalies existed throughout the troposphere over East Asia, with the location of the cold anomaly being further to the south at lower levels, representing the baroclinic property of the circulation. This thermal field anomaly resulted in a larger south-to-north temperature gradient over the northern Tibetan Plateau. The warm anomaly corresponded to the positive geopotential height anomaly and anomalous anticyclonic circulation; therefore, Fig. 7f shows that the western Pacific subtropical high was much stronger and shifted further to the west and north than in the S_EPTP years. The 586 dpm contour just reached the southeastern coast of China (ridge line at approximately 27ЁуN) in S_EPTP August (Fig. 7e) but reached the northern SCB (ridge line at approximately 30ЁуN) in N_EPTP August and stretched all the way across the Tibetan Plateau in association with a warm anomaly (Fig. 7d). Driven by the anomalous patterns over the east and north of the Tibetan Plateau, the warm, wet air from the south and the cold, dry air from the north converged over the area east of the Tibetan Plateau and its downstream regions. An anomalous vortex was found over the Sichuan Basin (centered at approximately 30ЁуN, 106ЁуE, depicted by ЁАLЁБ in Fig. 7i) in the N_EPTP years, indicating a more intense low-level convergence of water vapor associated with the enhanced southwesterly wind.
The vertical structure of the circulation when N_EPTP rainfall occurred is more clearly shown in Fig. 8, which is a cross section taken along the red solid line in Fig. 7i. A vertical pattern of a relatively warm anomaly was observed over the N_EPTP and the western SCB centered at approximately 600 hPa. Anomalous thermodynamically stable conditions existed at lower levels below 700 hPa. The anomalous vertical motion in this layer mainly resulted from dynamic forcing, in which topographic forcing was an important factor. The temperature was relatively higher between 700 and 500 hPa. There was an anomalous thermodynamically unstable layer above the warm anomaly, and both dynamic and thermodynamic forcings contributed to the anomalous vertical motion. Accompanied by intense updraft, the anomalous water vapor was transported to very high levels (approximately 400 hPa), and the geopotential height anomaly in the lower troposphere in the SCB became negative. The anomalous fields of August 2020 relative to the climate mean showed a similar vertical pattern but with a much more intense upward motion over the slope and a more obvious cool anomaly in the foot of the hill (Fig. 8b). The geopotential height anomaly was even lower than the composite result in Fig. 8a, associated with stronger low-level winds and more water vapor convergence over the N_EPTP in August 2020.
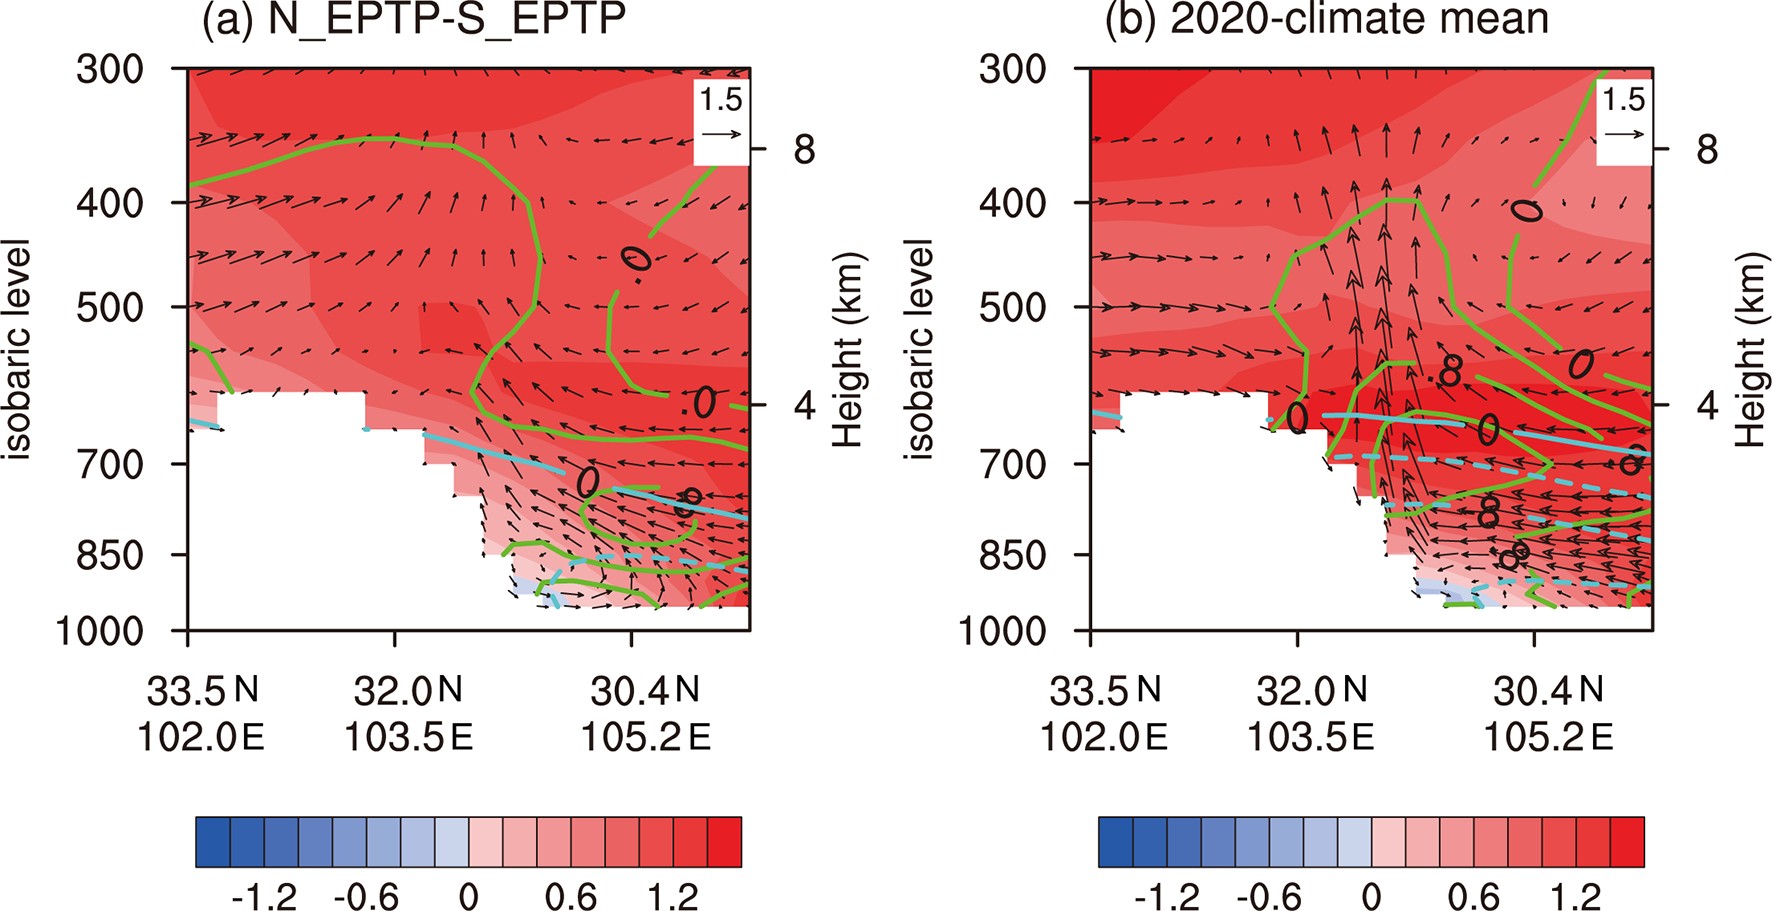 Figure8. Cross-sections of the vertical circulation (vectors, horizontal component, m s?1, vertical component, ?10?1 Pa s?1) and temperature (shading, K) differences between (a) August in N_EPTP and S_EPTP years (N_EPTP years minus S_EPTP years mean) and between (b) August 2020 and the climate mean (1986ЈC2015) along the inclined black dashed line in Fig. 7i. The green and cyan lines represent the anomalous specific humidity (g kg?1) and geopotential height (gpm), respectively.
Figure. 9 shows the patterns of ERA5 rainfall and low-level winds regressed onto the standardized August accumulated rainfall of the N_EPTP. Large amounts of rainfall (>4 mm d?1) were seen over the N_EPTP, and southerly winds appeared at 800 hPa over the SCB. The high correlation (>0.68) between the N_EPTP rainfall and the meridional wind component located in the area south of the SCB implies that an increase in the southerly winds in the SCB favors intense rainfall over the N_EPTP. An easterly wind was observed near the N_EPTP at approximately 105ЁуE, which has a high correlation with the N_EPTP rainfall, suggesting that the influence of the topography on the winds near the N_EPTP was also an important factor for N_EPTP rainfall.
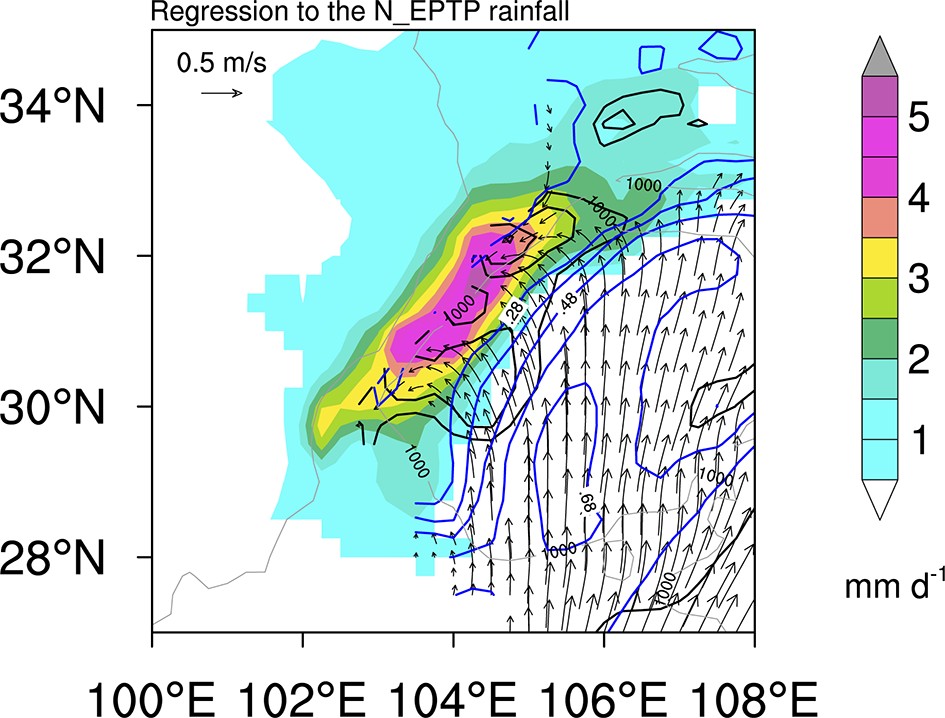 Figure9. Regression patterns of the ERA5 rainfall data (shading, mm d?1) and the horizontal winds at 800 hPa (vectors, m s?1) based on the normalized regional maximum of the accumulated rainfall time series over the N_EPTP in August. Only the areas of rainfall that are stochastically significant at the 90% level are shaded. The blue (black) solid lines show the correlation coefficient between the rainfall series and the meridional (zonal) wind level. The gray lines denote the elevations at 1000 and 3000 m.
The ERA5 reanalysis dataset showed the favorable circulations and influencing systems of the August EPTP rainfall, although the results also raised further questions, such as why the circulations performed in this way and how precipitation and the circulatory systems interact. Recent studies have shown that the 2019 super IOD was an underlying condition for the enhanced mei-yu rainfall in the early summer of 2020 (Takaya et al., 2020; Zhou et al., 2021). Zhou et al. (2021) found that Indian Ocean warming would force an anomalous anticyclone in the lower troposphere over the Indo-Northwest Pacific region and intensify the upper-level westerly jet over East Asia, leading to heavy summer rainfall in the Yangtze Basin. Wang et al. (2020) confirmed that the warmer SST in key areas of the Indian Ocean plays an important role in the strong western Pacific subtropical high during the mei-yu season. In August, the WPSH changed from an east-west zonal distribution in June?July to a "blocking" pattern located further northward, which was induced by the abnormal activity of the tropical Madden-Julian Oscillation (Liu et al., 2020). The Northwest Pacific anticyclone was still intense and persisted in transporting warm, wet air to the north, influenced by the anomalous sea temperature anomaly over the Indian Ocean, favoring rainfall over the EPTP in August. However, the mechanism is worth further investigation. On the other hand, being slightly different from the mei-yu rainfall, the EPTP rainfall could be directly influenced by the low-pressure disturbances propagating from the Tibetan Plateau. The low-pressure systems over the Tibetan Plateau were active in August 2020 (not shown), and why and how they specifically affected rainfall are also interesting questions that need further study.
(1) The largest accumulated August rainfall over the EPTP since 1986 occurred in 2020. The amount of rainfall over the N_EPTP in August 2020 was larger than that over the YaЁЏan region and significantly larger than that over the S_EPTP, which is different from the rainfall centers located in the S_EPTP and YaЁЏan regions in the previous August. The extraordinary amount of rainfall was the result of a much higher frequency and intensity of rainfall.
(2) The northern slope of the EPTP exerted a more significant amplification effect on the rainfall in August 2020. When the terrain height over the N_EPTP increased from the foothills to 1300 m, the amount of rainfall increased by approximately 14 mm d?1 in August 2020, much greater than the 4 mm d?1 in previous years. The diurnal pattern of rainfall over the N_EPTP shifted to earlier in the morning in August 2020.
(3) The large-scale circulation patterns provided favorable conditions for intense precipitation over the N_EPTP. During the N_EPTP rainfall years, cold and warm anomalies existed over the areas north and south of approximately 35ЁуN, respectively. Thus, the western Pacific subtropical high was more intense and extended to the west. The enhanced low-level southerly winds on the periphery of the subtropical high injected the warm, wet air to a more northerly location in the N_EPTP rainfall years. Then, this warm, wet air turned toward the west and was uplifted by the local topography, favoring the intense rainfall seen on the northern slope during this year. The eastward-propagating low pressure systems from the Tibetan Plateau greatly influenced the main rainfall processes during August 2020. The intrusion of anomalous southerly winds toward the northwestern SCB from the western edge of the subtropical high was also closely related to the occurrence of intense rainfall.
Acknowledgements. This work was jointly supported by the National Key R&D Program of China (Grant No. 2018YFC1507603) and the National Natural Science Foundation of China (Grant No. 41875112).
