HTML
--> --> -->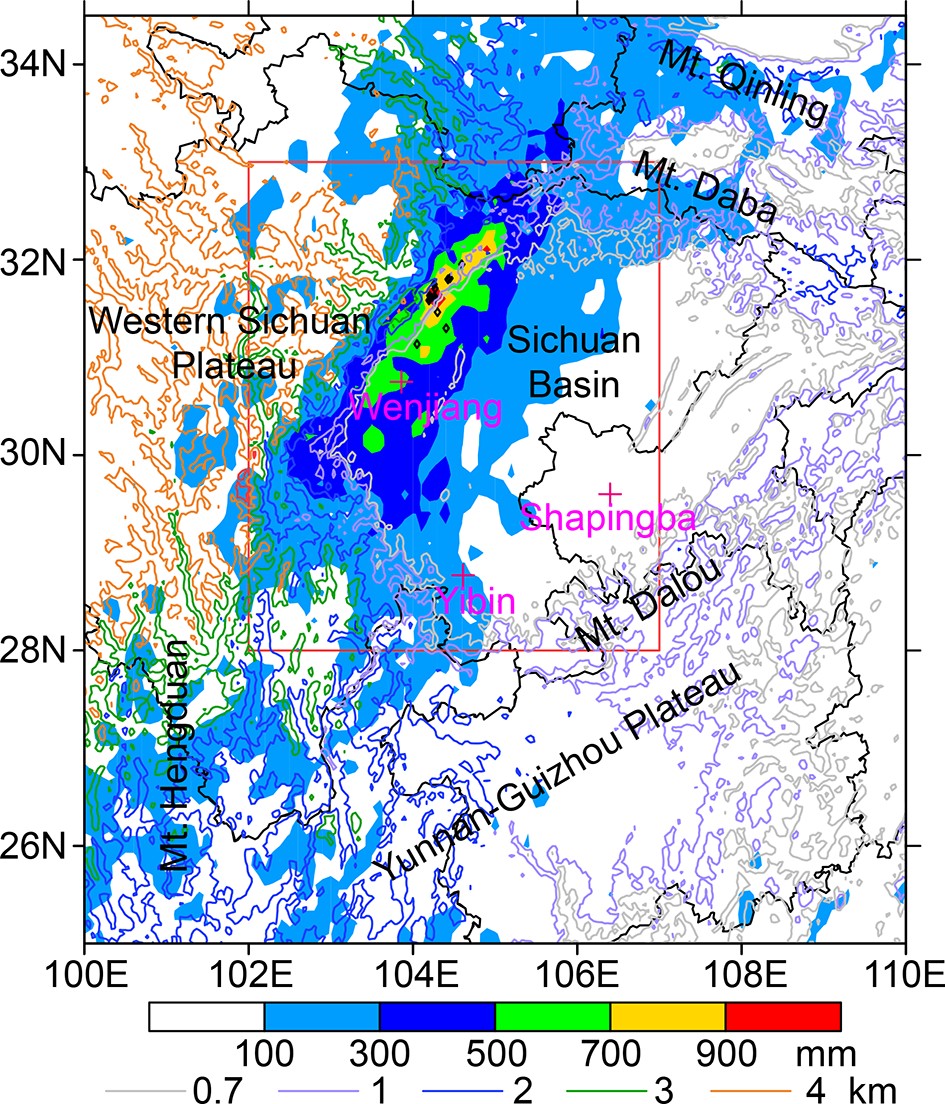 Figure1. The 8-day accumulated rainfall amount (shaded, mm) from 1800 LST 10 August to 1800 LST 18 August 2020, with black solid diamonds denoting stations recording rainfall greater than 1000 mm. The red rectangle denotes the target region of this study. Colored curves denote terrain heights (km). The names and locations of three sounding stations are shown by magenta crosses. The names of major mountains and other relevant locations appear in black.
Previous studies have shown the importance of large-scale pressure systems such as the western Pacific subtropical high, the South Asian high, the Asian monsoon and midlatitude troughs in the generation of heavy rainfall over the Sichuan basin (Ueno et al., 2011; Luo et al., 2020). The southwest vortex—a low-pressure cyclonic system mainly evident in the lower troposphere—is thought to be the most important mesoscale system causing heavy rainfall in the Sichuan basin (e.g., Fu et al., 2014, 2019; Feng et al., 2016). The formation of the southwest vortex is closely related to the topography of the Qinghai-Tibet Plateau (Wang and Tan, 2014), and the movement of the Tibet-Plateau vortex out of the plateau (Li et al., 2017).
A unique feature of rainfall over the Sichuan basin is a prominent peak from late night to early morning in its diurnal variation, differing from many other regions in China (Yuan et al., 2012; Jin et al., 2013; Xia et al., 2015; Luo et al., 2016). Previous studies suggested that the diurnal rainfall cycle in the Sichuan basin is closely related to the regional mountain-plain solenoids driven by the differential solar heating between the surrounding mountains and the basin (Bao et al., 2011; Qian et al., 2015) in association with a south-southwesterly low-level jet (LLJ) in the planetary boundary layer (PBL) to the southeast of the basin (Jin et al., 2013). That is, the convergence of downslope winds mainly to the west of the basin driven by the terrain thermal forcing and the warm, moist air transported by the south-southwesterly LLJ contributed greatly to the nocturnal rainfall peak over the basin. The nocturnal enhancement of LLJs has been observed over many regions worldwide, and explained using the inertial oscillation theory (Blackadar, 1957) and the terrain thermal forcing theory (Holton, 1967), respectively, or their combinations (Zhang et al., 2006; Jiang et al., 2007; Du and Rotunno, 2014; Shapiro et al., 2016). The basis of the inertial oscillation theory lies in the sudden reduction in eddy viscosity at sunset due to stabilization of the PBL, which is mainly a result of radiative cooling of the land surface (Blackadar, 1957; Buajitti and Blackadar, 1957; Hoxit, 1975; Zhang et al., 2006). The decoupling of the middle and upper portion of the PBL from the surface leads to the development of supergeostrophic winds during nighttime. The terrain thermal forcing theory, which most likely plays a secondary role (Du and Rotunno, 2014; Shapiro et al., 2016), highlights the important role of differential heating and cooling over sloping terrains, which causes the diurnal buoyancy-driven flow over the sloping terrain. The Coriolis force can generate an oscillation of the horizontal wind and acquires a southerly component several hours later after the westward wind component formed on the east side of a mountain range sloping upward from the east to west. Recently, Zhang et al. (2019, hereafter Z19) applied the inertial oscillation theory to clarifying the nocturnal enhancement of LLJs southeast of the Sichuan basin. They found that the nocturnal enhancement of the south-southwesterly LLJ resulted in a nighttime peak of net moisture flux into the basin at around 2200 LST, which was about four hours before the nighttime rainfall peak. The night-time downslope wind on the eastern Qinghai-Tibet Plateau and the northern Yunnan-Guizhou Plateau, controlled by shallow thermal forcing, was found to contribute only a small portion of moisture flux into the basin (Z19).
The nighttime rainfall enhancement over the Sichuan basin could be contributed by heavy-rain-producing systems that originate over the eastern side of the Qinghai-Tibet Plateau and the northern side of the Yunnan-Guizhou Plateau and then move into the basin (Wang et al., 2005; Bao et al., 2011; Qian et al., 2015), although only about one quarter of the mesoscale convective systems (MCSs) initiated over the Tibet Plateau during June?August 1998?2001 (Li et al., 2008) and 1998?2004 (Hu et al., 2016) can move out of the plateau with an eastward direction. Moreover, some case studies suggested the important contribution of locally triggered or intensified MCSs in the Sichuan basin to the nocturnal heavy rainfall (Ueno et al., 2011; Zhao, 2015).
A sustained heavy rainfall event occurred over the Sichuan basin during 10?18 August 2020. An 8-day accumulated rainfall amount of greater than 500 mm was distributed along the foothills on the northwestern side of the basin, with 13 rain gauge stations on the sloping mountains below 2-km height recording accumulated rainfall of greater than 1000 mm (Fig. 1). The number of rain gauge stations recording hourly rainfall rates of greater than 20 mm h?1 (the criterion of short-duration heavy rainfall defined by the National Meteorological Center of China (Chen et al., 2013) reached 267 (Fig. 2). The hourly rainfall rates at many stations exceeded 60 mm h?1, with 13 stations exceeding 100 mm h?1, and a maximum rate of 138 mm h?1 occurred at 1400 LST (Local Standard Time = UTC + 8 h) 11 August. The maximum daily rainfall amount reached 423 mm from 2000 LST 10 August to 2000 LST 11 August at Lushan station, which is the second highest value ever recorded in the Sichuan Province. These rainfall extremes triggered floods and geological disasters in the upper reaches of the Yangtze River, causing significant economic losses. The operational forecasts predicted the overall rainfall area reasonably well, but failed to accurately predict the locations and timings of heavy rainfall during the 8-day period.
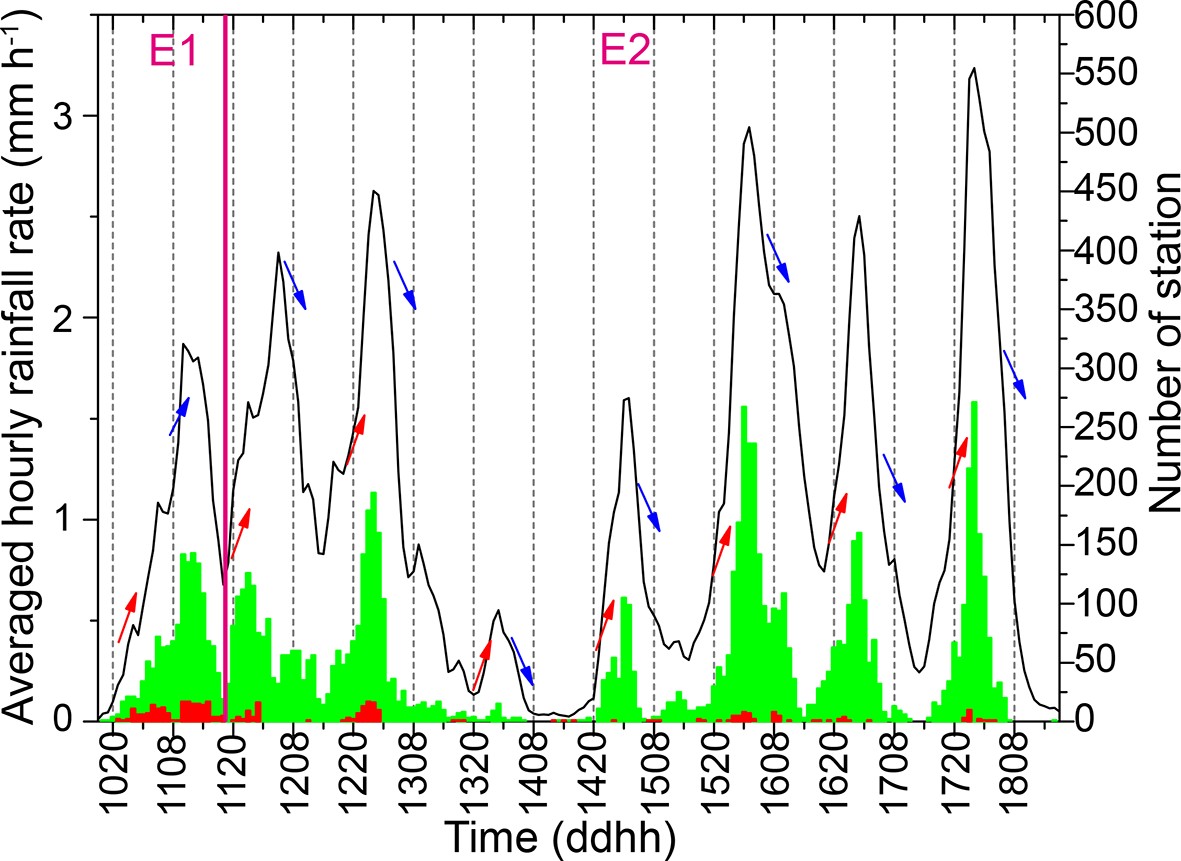 Figure2. Time series of the regionally averaged hourly rainfall rates (black lines) and the numbers of stations with hourly rainfall rates > 20 mm h?1 (green bars) and 60 mm h?1 (red bars), respectively, over the target region during 10–18 August 2020. There are a total of about 5400 rain gauge stations in the target region. Red and blue arrows indicate the trends of hourly rainfall rates after 2000 LST and around 0800 LST, respectively. The magenta vertical line roughly separates the rainfall episodes of E1 and E2; similarly for the remaining figures.
Of interest is that the regionally averaged hourly rainfall rates indicated pronounced diurnal cycles with the respective maximum and minimum values occurring in the nighttime and afternoon hours during the 7-day period from 11 to 18 August, albeit having some small fluctuations (Fig. 2). The peak and minimum values occurred during 0000?0500 and 1300?1700 LST, respectively, given a 24-h cycle from 1800 to 1800 LST. These values are comparable to those found by Z19 in a 3-month composite, i.e., a peak at around 0200 LST and a minimum between 1200 and 1800 LST. However, the slight rainfall enhancement at 1400 LST between 1200 and 1800 LST found in Z19 was not evident in this case. For the sake of our subsequent discussions, we divide the entire rainfall event into two episodes: (i) from 1800 LST 10 August to 1700 LST 11 August (E1), i.e., prior to the onset of the diurnal rainfall cycles; and (ii) from 1800 LST 11 August to 1700 LST 18 August (E2). Note that the weak nighttime rainfall on 13 August is included in the E2 episode simply for the convenience of our analysis. In contrast to the E2 episode, the regionally averaged rainfall rates during the E1 episode exhibited a rising trend at around 0800 LST and started to decrease about 8 hours later.
Although numerous studies have discussed the diurnal characteristics of rainfall and associated physical mechanisms in the Sichuan basin mostly using data during a period of several months to several years, this heavy rainfall event in August 2020 provided us with an opportunity to examine to what extent this extreme rainfall case fits the previous statistical analyses. Specifically, we seek to address the following questions through this case study: Why could this heavy rainfall event persist for so long and be so extreme? How could the heavy rainfall event undergo several diurnal cycles with peak hourly rates occurring during the nighttime? Why is the evolution of hourly rainfall during the E1 and E2 episodes different? And what mesoscale processes were responsible for the nocturnal generation of heavy rainfall?
The next section describes the data and methods used in this study. Section 3 presents the synoptic patterns and their anomalies that influenced the heavy rainfall event. Section 4 examines the dominant factors that were responsible for the diurnal rainfall variations during the two episodes. Section 5 discusses the evolution of MCSs causing nocturnal rainfall enhancement and their associated environments. A summary and conclusions are given in the final section.
The moisture flux across the boundary i [where i can be w (west), s (south), e (east), and n (north)] of the target region,

where


 Figure3. Distribution of the averaged (a) 500-hPa and (b) 800-hPa geopotential heights (contoured at 10-gpm intervals) and isotherms (contoured at 1°C intervals), (c) precipitable water (contoured at 5-cm intervals), and (d) 800-hPa specific humidity (contoured at 1 g kg?1 intervals) during the E2 episode. Standardized anomalies with respect to the 30-year mean quantity of the months of August from 1981 to 2010 are shaded. Purple arrows in (b) show the mean horizontal wind > 10 m s?1 at 800 hPa. Green arrows in (d) show the moisture flux anomalies at 800 hPa (g s?1 cm?1 hPa?1). The contours of 5850, 5880 and 1980 gpm are highlighted in purple in (a) and (b). Blue contours in (d) denote specific humidity of 14.5 g kg?1. Gray shading represents terrain higher than (a) 5 km and (b, c, d) 2 km. The red rectangles indicate the target region of this study. The blue rectangle in (b) is used in Fig. 10.
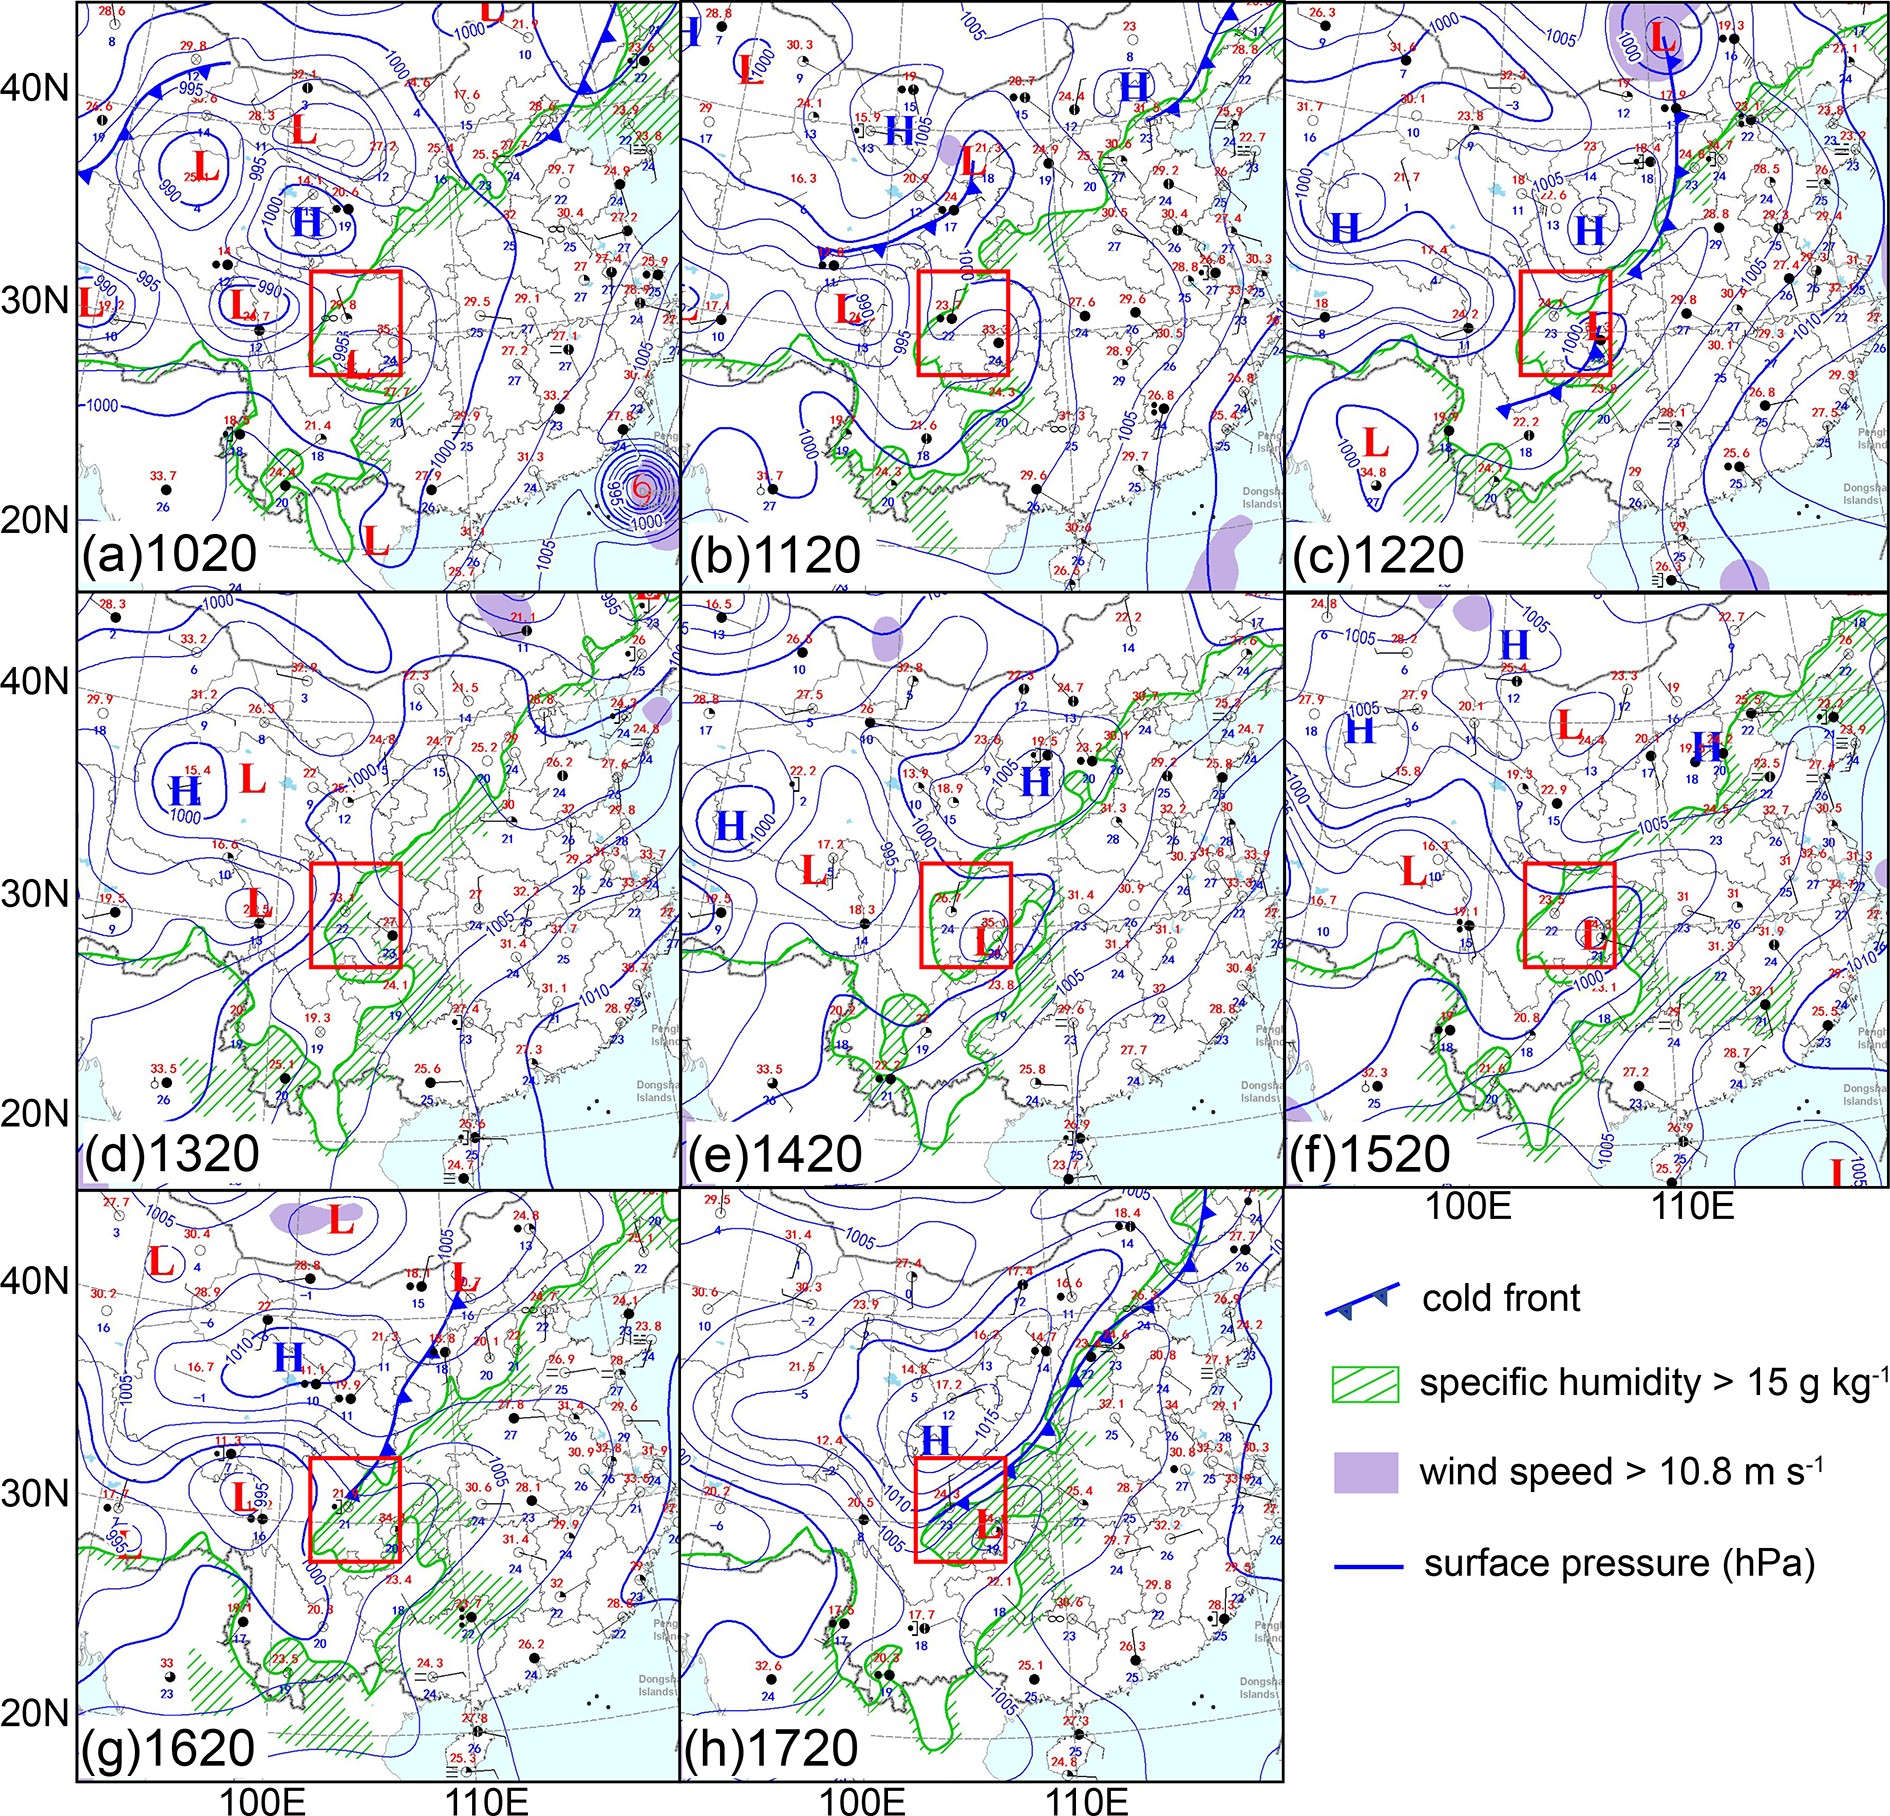 Figure4. Daily surface maps at 2000 LST from 10–17 August obtained from the National Meteorological Center of China Meteorological Administration. Time in form of ddhh (LST) is shown in the left-bottom corners. The red rectangles denote the target region of this study.
The abovementioned synoptic pattern led to ample moisture over the target region during E2 (Fig. 3c). The 7-day averaged precipitable water exceeded 60 mm over the Sichuan basin but was much smaller outside, implying that the total atmospheric column over the basin was much moister than its surrounding regions. The standardized anomalies over the northwest of the basin reached 3?4, which is consistent with the accumulated rainfall center (cf. Figs. 1 and 3c). The distribution of specific humidity at 800 hPa (Fig. 3d) shows high values of ~ 14.5 g kg?1 and anomalies > 2?3 in and to the south of the target region that are accompanied by anomalous southerly moisture flux, implying strong water vapor transport from the south. Surface maps (Fig. 4) also show that near-surface specific humidity over the target region reached 15 g kg?1 at 2000 LST every day from 10 to 17 August 2020.
For the purpose of comparison, a surface map during the E1 episode is given in Fig. 4a showing that the western Pacific subtropical high was located more to the east at 2000 LST 10 August, as indicated by the 1005-hPa isobar, partly due to the influence of Typhoon Mekkha la (2020). This was not conducive to the development of an LLJ to the southeast of the target region. The weather systems favoring heavy rainfall production during the E1 episode included a low-pressure trough associated with a Tibetan vortex to the west of the target region at 500 hPa (not shown) and a southwest vortex in the lower troposphere over the basin (Fig. 4a)
4.1. Spatial distributions of rainfall and low-level flows
Before analyzing the dominant processes controlling the diurnal rainfall cycles, especially the nocturnal rainfall enhancement, we examine the evolution of the total 3-hour accumulated rainfall amounts during the E2 episode (Fig. 5). A major rainfall belt > 50 mm was distributed in the northwestern corner during the early evening hours (i.e., 1800 to 2000 LST, Fig. 5a). The rainfall belt weakened slightly in intensity in the following three hours, while another major rainfall belt developed in the southwestern area of the basin, which was more extensive in coverage, and a secondary rainfall belt appeared in the central region, as highlighted by the two ellipses in Fig. 5b. This corresponded to rapid increase in the regionally averaged hourly rainfall rates during the diurnal cycle (cf. Figs. 5b and 2). The enhancement of 6-hourly rainfall over the southwestern basin from 2000 to 0200 LST was evident during each day from 11 to 17 August except for 13 August (not shown). At the time of the peak regionally averaged hourly rainfall rate (i.e., 0000?0200 LST), the 3-hourly rainfall totals exhibited a widespread coverage, with heavier amounts of over 150 mm in both the northwestern and western basins (Fig. 5c). Subsequently, heavy rainfall was approximately linearly distributed along the foothills on the northwestern side of the basin. The nighttime rainfall was first enhanced over the southwest part of the basin, which then extended to the northwest. This evolution is consistent with that shown in Z19. The rainfall intensity and areal coverage decreased gradually after about 0200 LST. While the 3-hourly heavy rainfall belt in the southwestern basin occurred during the nocturnal period, it did not show up in the 8-day accumulated rainfall map (cf. Figs. 5b, c and 1), because of the more frequent development of rainstorms in the northwestern basin. Figure5. The total 3-hourly accumulated rainfall (mm) during the E2 episode. Time period in the form of hh–hh (LST) is shown in the upper-left corners in each panel. Curves denote terrain heights (km). Red ellipses denote the regions with 3-hourly rainfall amounts exceeding that in the previous 3 hours.
Figure 6 shows that the convergence pattern at 800 hPa coincided well with the diurnal evolution of the rainfall distribution. For example, the convergent wind belt < ?4 × 10?5 s?1 sustained over the northwest of the basin, which is consistent with the 8-day accumulated rainfall distribution (Fig. 1). Of course, this is not surprising because the convergence zone could be understood to result from diabatic heating associated with these storms. The wind convergence over the southwestern part of the basin intensified during 2100?2300 LST due to the presence of relatively stronger easterly winds from the southeast, which is in accordance with the rainfall enhancement in the southwestern part of the basin (Figs. 5a, b and 6a, b). Deviating winds distributed close to the northwestern mountains north of 31°N changed from northeasterly at 1800?2000 LST to southeasterly at 0000?0200 LST, which enhanced the convergence and thus intensified the rainfall over the northwest part of the basin (Figs. 5a, c and 6a, c).When the deviating winds near 104°E in the south of the basin changed from the southeasterly to southerly direction during 0000 to 0500 LST, the convergence and the rainfall over the southwest part of the basin weakened greatly (cf. Figs. 5c, d and 6c, d). During the daytime, a convergence zone always maintained over the northwestern part of the basin, with a slight northeastward displacement of its center in the afternoon, which is in accordance with the heavy rainfall distribution over that region (Figs. 5e–h and 6e–h). All the results indicate that the diurnal variation of the low-level wind field was closely related to that of rainfall distribution in the target region.
 Figure6. Three-hourly averaged 800-hPa wind (black vectors) and its deviation (red vectors) and divergence (blue shading, 10?4 s?1), and 900-hPa

The nocturnal enhancement of rainfall was also related to the low-level thermal field. As indicated by pseudo-equivalent potential temperature (


The diurnal cycles of heavy rainfall in the basin coincided closely with the development of the southwest vortices. Figure 7 shows that the mean relative vorticity in the Sichuan basin was < 6 × 10?5 s?1 during the E1 episode, but was substantially larger during E2. The vorticity peaked in the 850?800 hPa layer during the early morning hours each day of the E2 episode, with the maximum value being > 10?4 s?1 except for the much weaker rainfall period of 13 August. The timings of the peak vorticity coincided well with those of the peak rainfall rate, suggesting the importance of latent heat release in the generation and intensification of the southwest vortices, which in turn favored upward motion and heavy rainfall production (e.g., Zhang and Fritsch, 1987; Kuo et al., 1988; Li et al., 2014). Such positive feedbacks among latent heat release, increased rotation, and increased low-level convergence associated with the southwest vortices could explain the nocturnal enhancement of rainfall over the basin, with the southerly LLJ feeding the needed high-

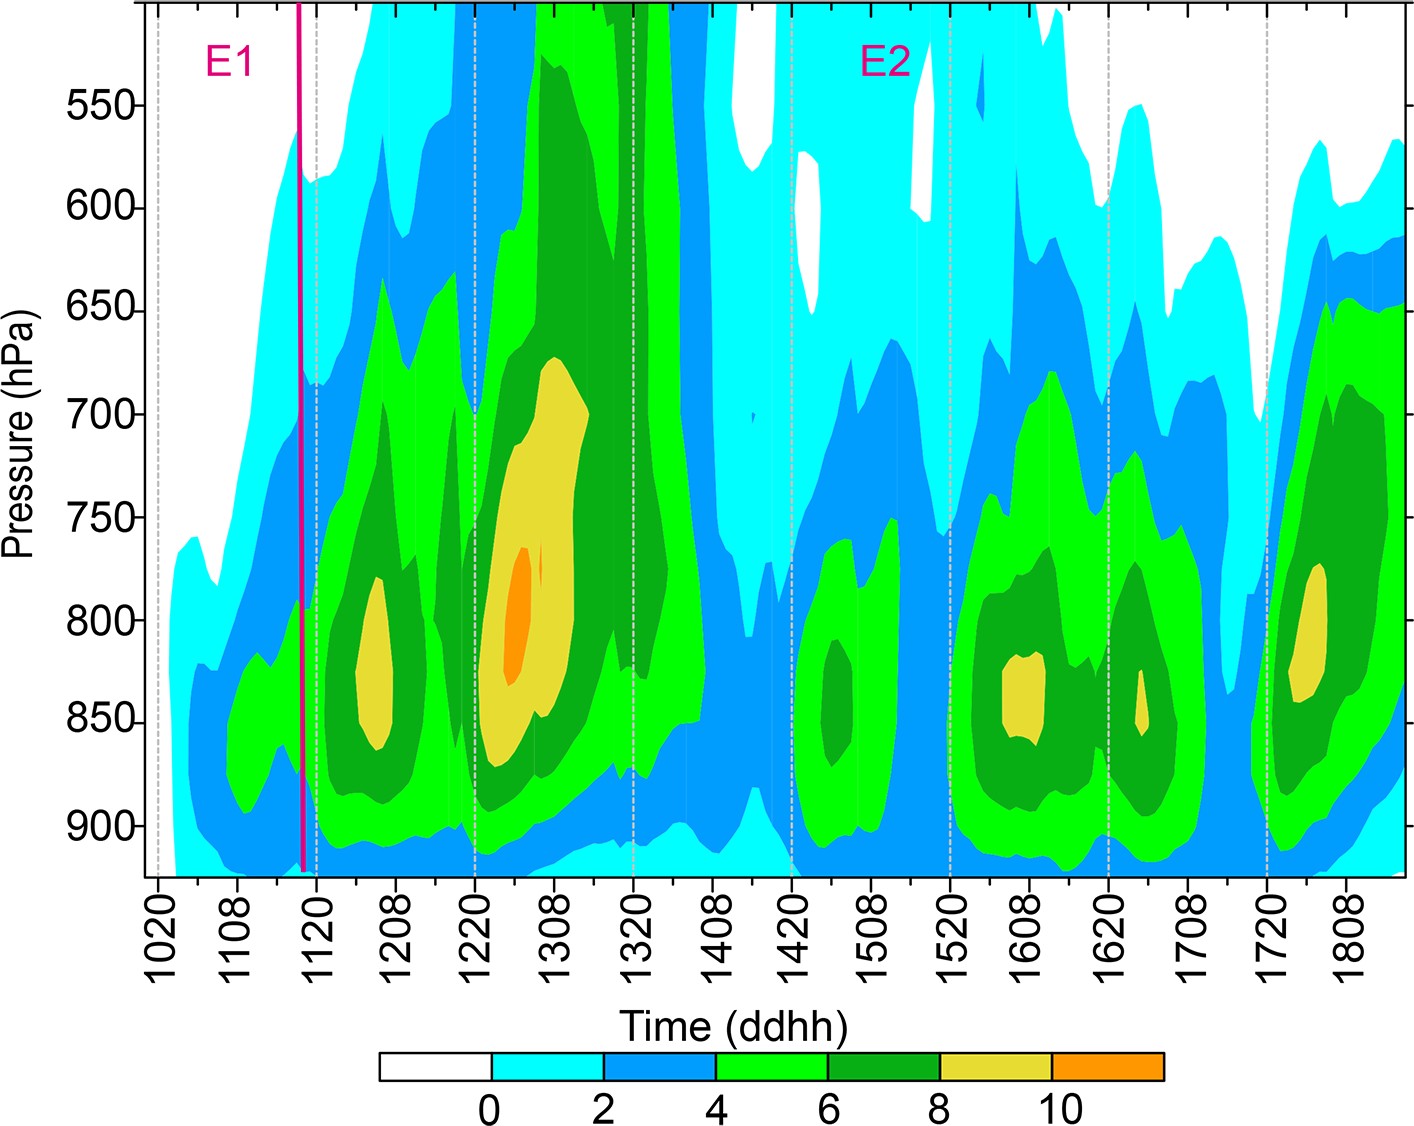 Figure7. Time series of the vertical distribution of relative vorticity (10?5 s?1) averaged over the target region with terrain elevations of less than 700 m.
2
4.2. LLJ and water vapor fluxes
Given the importance of the southerly airflow to the southeast of the basin in transporting water vapor to the basin (Figs. 3b, d), how the lower-tropospheric flows varied diurnally in and around the basin was examined. The 3-hourly averaged wind fields during E2 (Fig. 6) show that a southerly LLJ was located in the eastern part of the target region, with its coverage and intensity increasing during the late evening to early morning hours and decreasing during the daytime, as indicated by the isotachs of 10 and 14 m s?1. Meanwhile, the direction of the LLJ varied from southeasterly in the evening to southerly near midnight, and then to southwesterly in the morning hours. As a result, deviating winds rotated in a clockwise sense. These variations in wind direction and speed, based on the 7-day composite, were similar to those found by Z19 based on their three-month composites. Given the topographical features to the east of the target region, we may infer that the deviating winds helped enhance water vapor transport into the target region when they were close to the eastern and southern boundaries of the target area with some components crossing the boundaries. For example, the deviating winds to the southeast of the basin exhibited easterly, southeasterly, southerly, and southwesterly directions chronologically during the evening to early morning hours, which would increase the water vapor transport and result in rainfall enhancement during about 2100 to 0500 LST (Figs. 6b–d). In contrast, the deviating winds with a westerly, northwesterly or northerly direction during daytime would reduce the transport of water vapor. This conjecture is confirmed by an analysis of moisture flux across the four boundaries of the target region.Figures 8a–d show that the southern boundary was the main channel for water vapor transport into the basin during E2, followed by the eastern and western boundaries. The largest water vapor flux of greater than 16 g s?1 cm?1 hPa?1 was at ~ 800 hPa across the eastern portion of the southern border, which is consistent with the location of the southerly LLJ. At the eastern boundary, the largest water vapor flux > 8 g s?1 cm?1 hPa?1 was distributed at ~ 900 hPa, which is associated with the lower terrain height there. Water vapor was advected out mainly from the northern boundary, and also from the eastern boundary above the PBL.
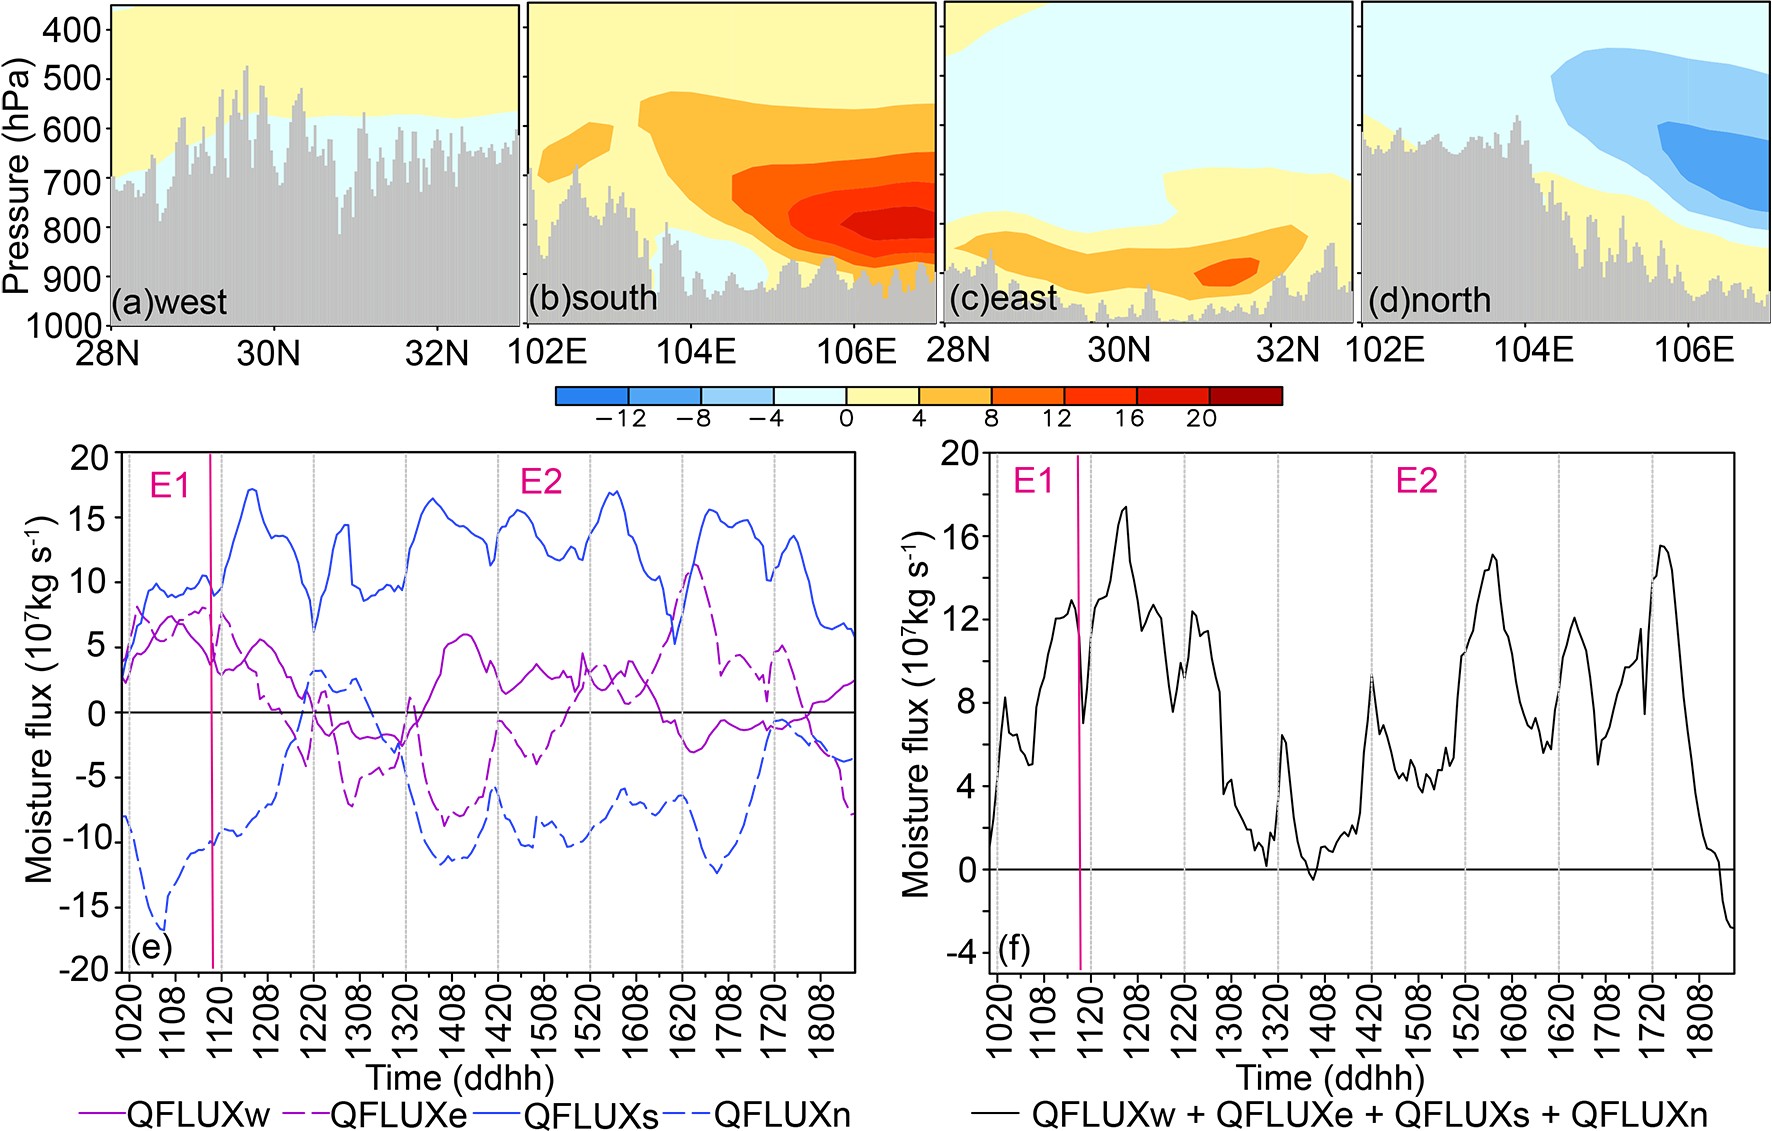 Figure8. Vertical cross sections of the averaged moisture flux (g s?1 cm?1 hPa?1) during the E2 episode across the (a) western, (b) southern, (c) eastern, and (d) northern boundaries of the target region shown in Fig. 1. Gray shadings represent terrain. Time series are shown of (e) the averaged moisture flux across each boundary (107 kg s?1), and (f) the net moisture flux through the four boundaries (107 kg s?1) from 10 to 18 August 2020.
The temporal variations of the moisture flux through the four boundaries (Fig. 8e) indicate that the water vapor flux across the southern boundary (


2
4.3. Mechanisms governing the nocturnal LLJ enhancement
The time-latitude distribution of the 800-hPa flow over the LLJ region clearly shows the diurnal evolution of the southerly LLJ during E2 (Fig. 9). Clearly, the zonally averaged horizontal wind speed increased to > 14 m s?1 at nighttime and decreased to < 12 m s?1 in the daytime during E2. Accordingly, the associated deviating wind speeds exhibited similar changes. In addition, the deviating winds presented periodic clockwise rotation and oscillation during each 24-h cycle of E2. Such oscillations of the deviating winds could enhance the water vapor convergence at nighttime, as shown previously. In contrast to the E2 episode, the zonally averaged wind speed during E1 was much smaller, i.e., 6?10 m s?1, and the deviating winds were mainly northeasterly over the eastern target region, which was more or less related to the distribution of large-scale pressure systems (Fig. 4a). Figure9. Time series of the horizontal wind speed at 800 hPa (shaded, m s?1) averaged over 105°–108°E during 10 to 18 August 2020. Deviations from the temporal means during E2 are shown as vectors (m s?1). The white line denotes the southern border of the target region.
The periodic variation of the deviating wind field over the LLJ region during E2 was evidently related to the inertial oscillation of the ageostrophic wind component, as previously put forward by Z19. The inertial oscillation period is


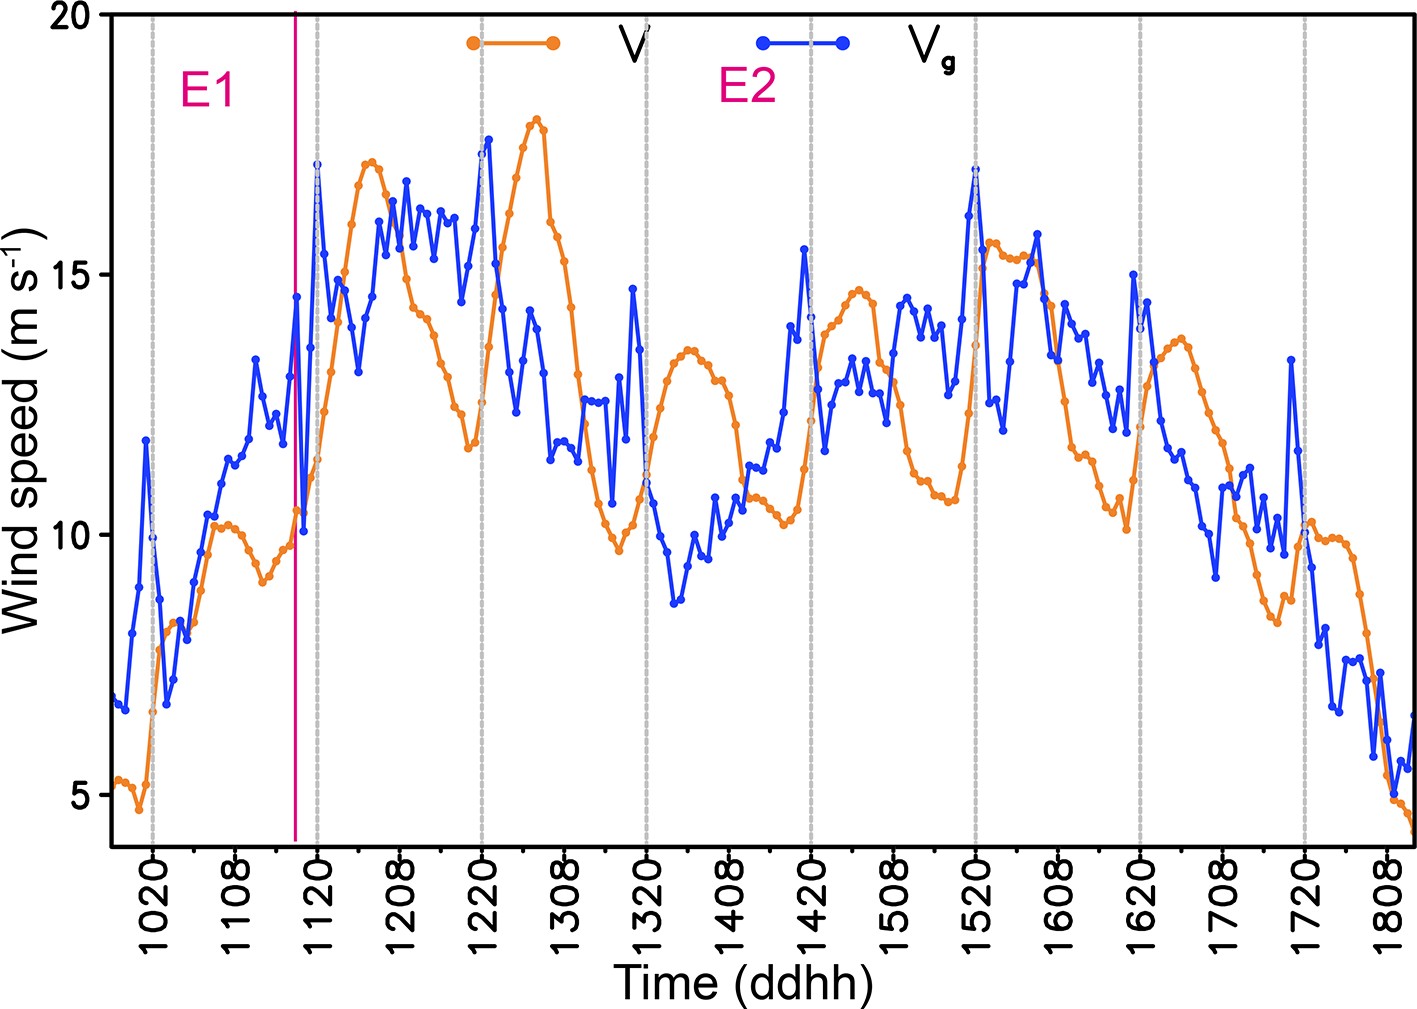 Figure10. Time series of area-averaged (25°–28°N, 107°–110°E; see the location in Fig. 3b) geostrophic wind speed (


The periodic variation of the LLJ could also be influenced by the terrain thermal forcing (Holton, 1967) as the southerly LLJ was located over the eastern part of the Yunnan-Guizhou Plateau (Figs. 1 and 3b). To minimize the influence of the southwest vortices over the basin, a zonal cross section to the south of the target region is given in Fig. 11, showing the presence of a significant mountain-plains solenoid. There were easterly deviation winds in the near-surface layer, and upward (downward) motion over the western high mountains (eastern lower mountains) at 1400 and 2000 LST (Figs. 11a, b). In contrast, the deviation circulation in the cross section was reversed at 0200 and 0800 LST (Figs. 11c, d), and was closely related to the temperature gradient of opposite sign over the sloping terrain. The easterly deviation wind at 2000 LST was stronger than that in the afternoon. Under the influence of the Coriolis force, a southerly wind could be produced in a few hours, which would help the strengthening of the LLJ during the nighttime. Therefore, the periodic variation of the southerly LLJ could be attributed primarily to the inertial oscillation and secondarily to terrain thermal forcing (Du and Rotunno, 2014; Shapiro et al., 2016).
 Figure11. Zonal cross sections of the deviation temperature (shaded, K), deviation wind [composite of zonal wind (


 Figure12. Time series of the meridionally averaged TBB (°C) between 28°N and 33°N from 10 to 18 August 2020. The two vertical red lines indicate the western and eastern boundaries of the target region.
The evolution of MCSs leading to the nocturnal rainfall enhancement over the basin can be seen from the hourly variation of the cloud-top TBB around the target region (Fig. 13). It is apparent that convective clouds were initiated over the southwest basin mostly during the evening hours (Figs. 14b, e, n, q, t, w), and grew stronger in a few hours, producing heavier rainfall during the nighttime, except on 12 and 13 August (Figs. 14h, k). On the evening of 12 August, three convective cells were oriented from southwest to northeast over the target region (Fig. 13h), where convection previously existed in the late afternoon (Fig. 13g). During the evening of 13 August, convective clouds with TBB < ?30

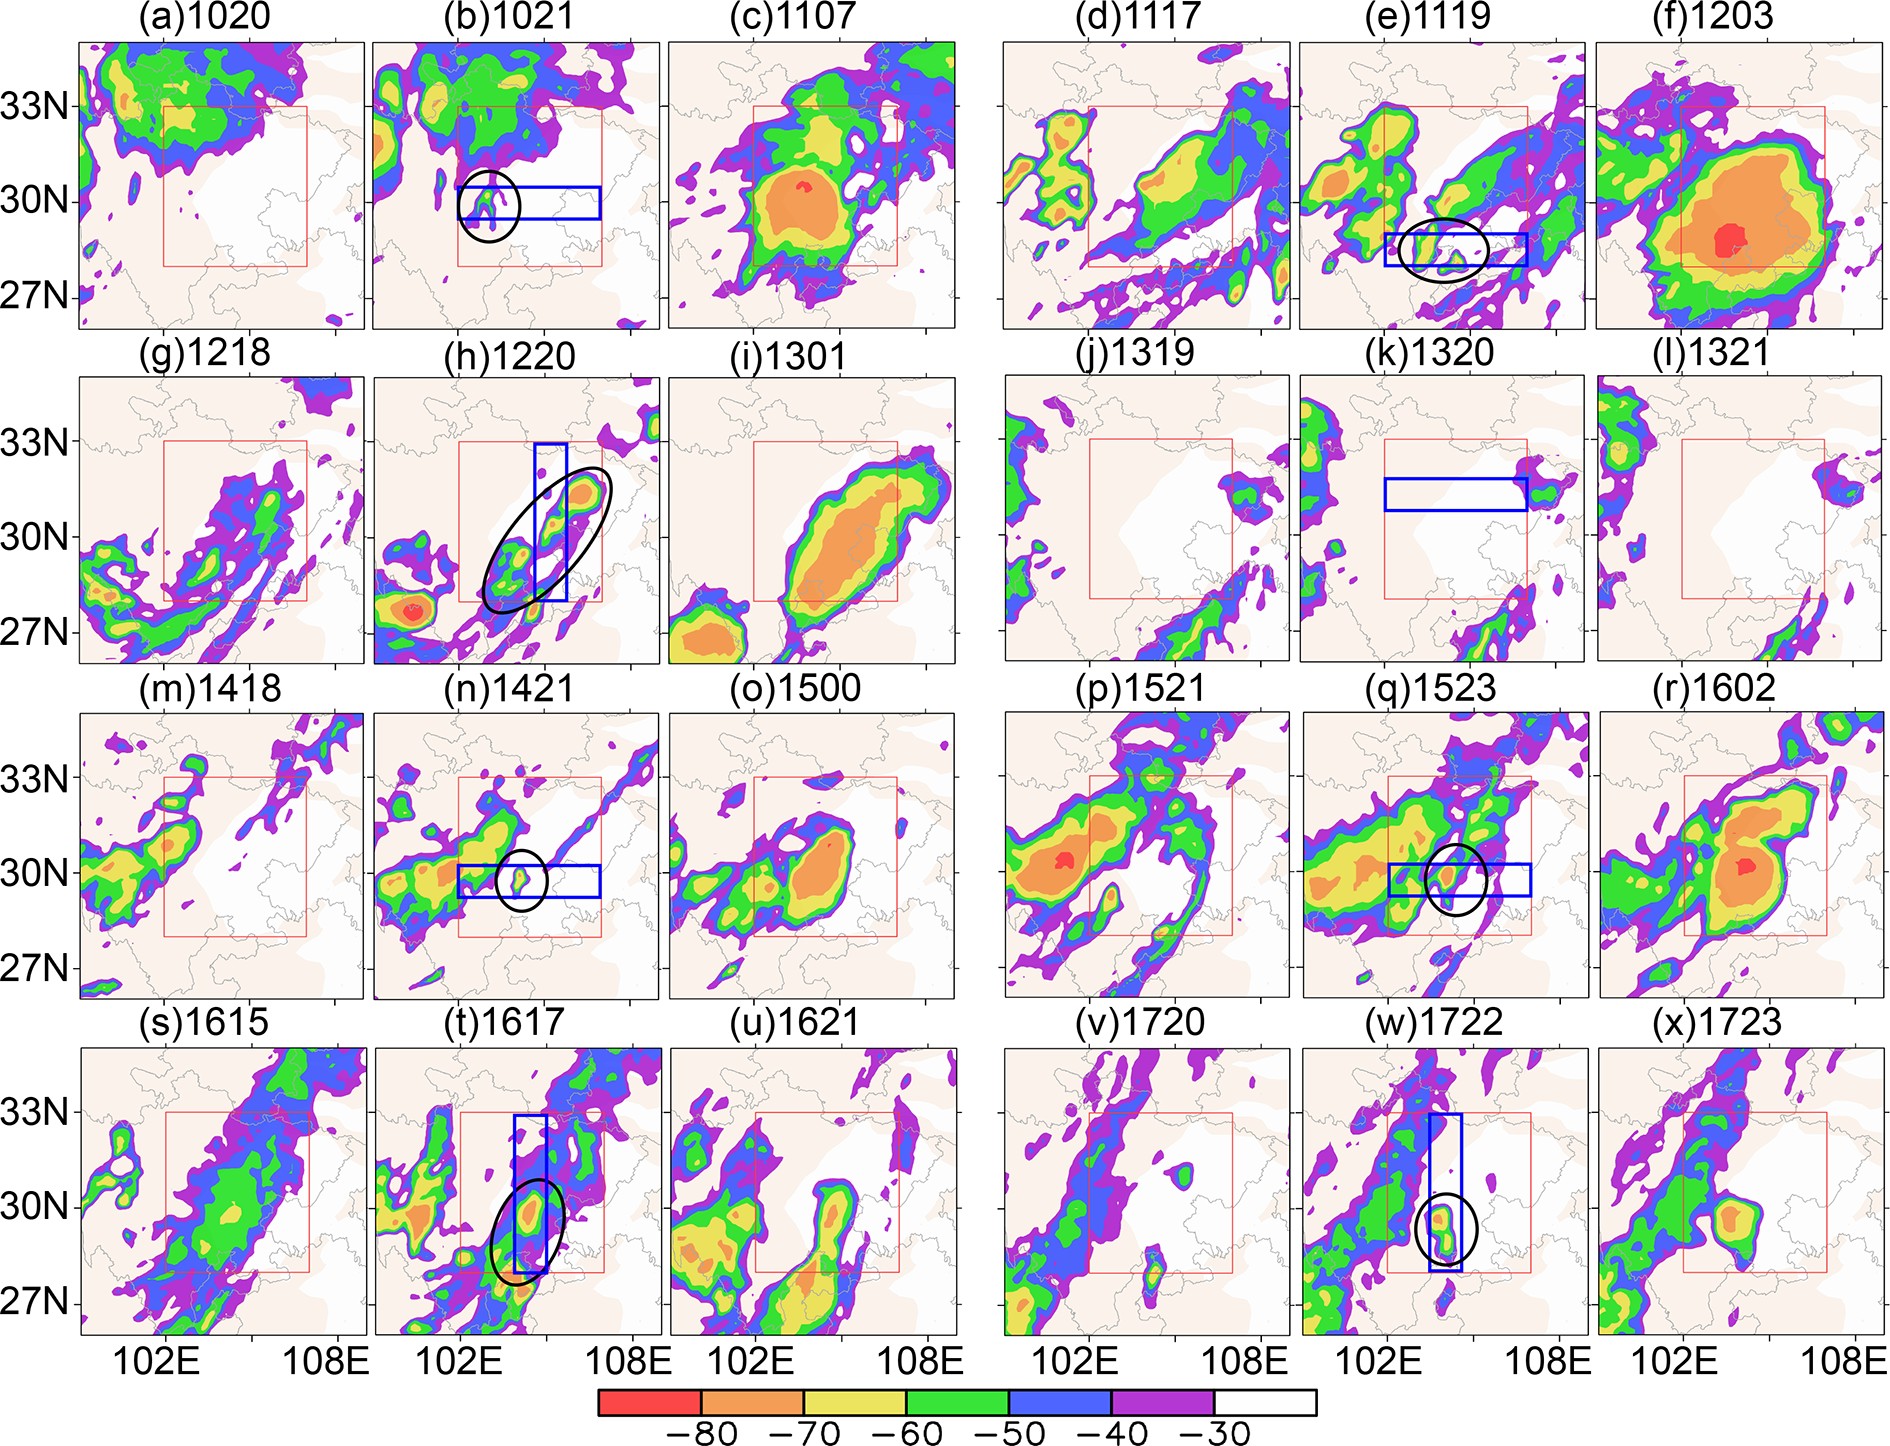 Figure13. Distribution of TBB (°C) at selected times. Time in the form of ddhh (LST) is shown above each panel. Three times were selected for each daily cycle, representing the time immediately before the convection in the target region was triggered or strengthened, when it was triggered or strengthened, and when the cloud was the deepest during its lifetime. The solid ellipses denote the positions of newly initiated convection. Light beige shadings represent terrain above 1 km. The blue rectangles in the second and fifth columns are used to plot the cross sections shown in Fig. 15. The red rectangles denote the target region of this study
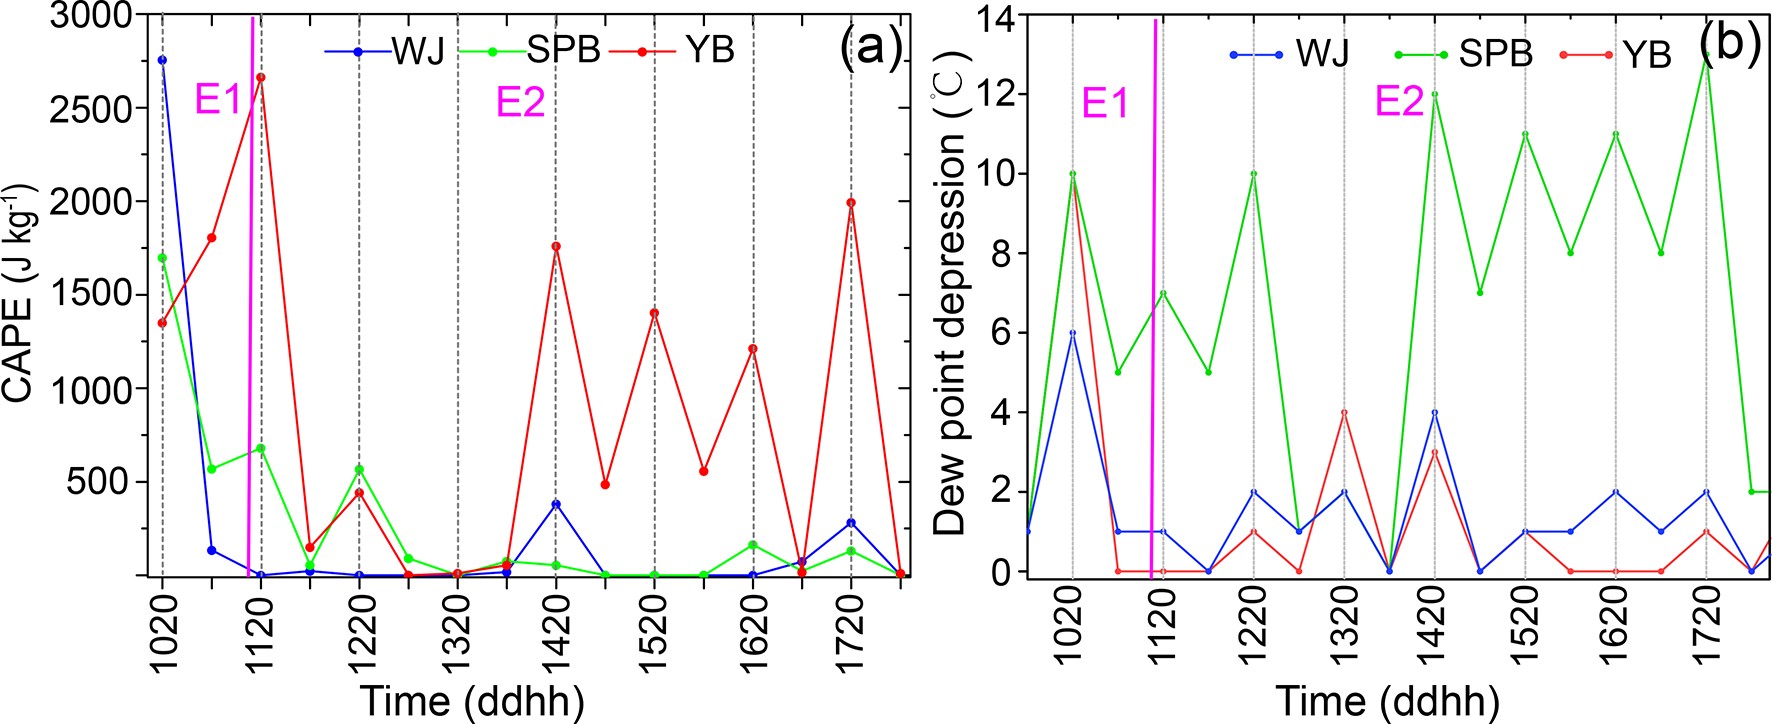 Figure14. Time series of the (a) convective available potential energy (CAPE, J kg?1) and (b) surface dew-point depression over the Wenjiang, Shapingba and Yibin sounding stations (see their locations in Fig. 1).
To gain further insight into the convective initiation in the southwestern basin during the evening hours, the convective available potential energy (CAPE) and surface dew-point depression at three sounding stations in the target region (magenta crosses in Fig. 1) are compared in Figs. 14a, b. The CAPE at Yibin station (located in the southern target region) started increasing at 2000 LST every day during the E2 episode, with the maximum value of 2662

Cross sections through the initiated or intensified convective clouds are shown in Fig. 15 in order to examine the mechanisms of convection development during the evening hours of E1 and E2. Generally, the development of convection during E2 can be classified into two categories. In the first category, a cold front appeared in the basin (Figs. 4c, g, h), as indicated by the dense and slantwise


 Figure15. Zonal (a, b, d, e, f) or meridional (c, g, h) vertical cross sections of the in-plane flow vectors [a composite of meridional/zonal wind (


In the second category, neutral to stable vertical columns with relatively colder air to the west were present close to the western Sichuan Plateau during the evening hours of 11, 14, and 15 August (Figs. 15b, e, f). This was probably associated with rain-evaporation cooling induced by the daytime convection propagating eastward from the western plateau, especially on 14 and 15 August (cf. Figs. 15e, f and 13n, q). The rain evaporative cooling, sometimes manifested as a strong cold pool, could interact with high-


In the evening of 10 August during E1, the basin exhibited a much wider region of warm, moist air than that during the evenings of the E2 episode. The presence of high


The persistence of heavy rainfall during the E2 episode (from 1800 LST 11 August to 1700 LST 18 August) was mainly attributed to the quasi-stationary position of the western Pacific subtropical high and the presence of a westerly midlevel trough to the west or northwest of the target region. The westward extension of the anomalously strong subtropical high was conducive to the maintenance of the southerly LLJ in southwest China, which favored the transport of water vapor from lower latitudes to the basin, resulting in anomalously high precipitable water in the basin. The midlevel trough, albeit with weak negative anomalies, favored the advection of cold air into the target region and the quasi-geostrophic lifting of moist air ahead of the trough axis. In contrast, the western Pacific subtropical high was located more to the east during the E1 episode (from 1800 LST 10 August to 1700 LST 11 August), which was unfavorable for the development of a southerly LLJ to the southeast of the basin. Water vapor was transported into the basin from the south, east and west boundaries with roughly comparable strengths during E1.
The diurnal cycles of heavy rainfall during the E2 episode were closely related to those of the southerly LLJ in and to the southeast of the target region where the low-level wind oscillated periodically. The net water vapor flux from around the target area corresponded well to the diurnal variation of the LLJ and the intensity of the regionally averaged hourly rainfall rates, suggesting the importance of external water vapor supply for this persistent heavy rainfall event. Water vapor mainly entered the target area from the southern boundary, followed by the eastern boundary, with the strongest centers located at 800 and 900 hPa, respectively. The periodic variation of the southerly LLJ resulted in the evident diurnal cycles of the water vapor flux at the southern boundary of the target region, i.e., it strengthened at night and weakened during the daytime. Both the inertial oscillation mechanism and terrain thermal forcing played significant roles in the diurnal cycles of the LLJ in this extreme rainfall event. In addition, along with the variation of the wind direction and speed in the basin, wind convergence was enhanced over the southwest and the northwest of the basin during the evening hours, which was consistent with the heavy rainfall generation.
Results show that convective clouds were initiated over the plateau to the west of the target region in the afternoon during most days of the E2 episode. Their eastward movement and merging with the local convection enhanced the nocturnal rainfall in the basin, which was consistent with previous statistical studies (e.g., Bao et al., 2011; Qian et al., 2015). A more important contribution to the nighttime rainfall enhancement in the basin came from the locally initiated convection in the southwest of the basin in the evening hours, and the subsequent convection intensification in the southwest and northwest parts of the basin at nighttime. The southwest part of the basin was prone to convective initiation during the evening hours because of the presence of low-level wind convergence with high CAPE, and small dew-point depression at the surface.
There are mainly two mechanisms whereby convective initiation was facilitated in the basin during the evening hours of the E2 episode. The first mechanism was closely associated with cold air advection in the northern part of the basin. The cold airflow converged with and lifted warm, moist air in the basin, leading to convective initiation and the release of convective instability. The other mechanism played a role after the MCSs over the western Sichuan Plateau in the late afternoon moved into the western basin. The associated rain-evaporation cooling plus radiative cooling of the near-surface air after sunset led to the formation of a neutral to stable layer over the western mountain sloping surfaces and the adjacent basin area. It is the slantwise ascending motion of the warm, moist airflow from the southeast over the stable layer that triggered convection and released convective instability. Meanwhile, the low-level convergence associated with the southwest vortex facilitated the upward motion in E2. By comparison, the convective initiation during the E1 episode was mainly due to terrain lifting of conditionally unstable air over a wide coverage in the target region.
In other words, the daytime convective clouds over the western Sichuan Plateau contributed to the nocturnal peak rainfall production in the basin, not only through dropping heavy rainfall at night during their eastward journey into the basin, but also by rain evaporative cooling over the western sloping terrain whose cold airflow assisted in convective convection when interacting with warm, moist air over the southwestern basin during the evening hours.
In conclusion, we may emphasize, as Z19 did, the key roles of the southerly LLJ in the generation and enhancement of nocturnal heavy rainfall over the Sichuan basin during the 8-day period of 10?18 August 2020. Moreover, this case study indicates the importance of daytime convection over the western Sichuan Plateau and of cold air advection from the north in determining nocturnal convective initiation in the western basin. Of course, there are still many issues associated with the 8-day heavy rainfall events that are worthy of further investigation, such as the structures and evolution of cold boundaries, warm-moist airflows, and the impact of complex topography on the LLJ in the basin.
Acknowledgements. This study was supported by the National Natural Science Foundation of China (Grant Nos. 41775050, 91937301, 41775002, 42005008) and the Science Development Fund of Chinese of Academy of Meteorological Sciences (2020KJ022).
Open Access This article is distributed under the terms of the Creative Commons Attribution 4.0 International License (
