HTML
--> --> -->The cold continental high (CH) and warm Intertropical Convergence Zone (ITCZ) are two of the many weather systems that affect the NSCS during autumn and are related mainly to heavy non-TC precipitation (Yen et al., 2011; Wang et al., 2015; Feng et al., 2017). For instance, when the ITCZ lies over the NSCS, it is possible for the warm and moist air it carries to mix with the cold air from the CH, resulting in a frontogenesis process and a commensurate increase in the gradient of the potential pseudo-equivalent temperature, both of which are beneficial to the generation of mesoscale convective weather (Yokoi and Matsumoto, 2008; Srock and Bosart, 2009). Meanwhile, the establishment of the low-level easterly jet (EJ) between the cold and warm systems usually induces instability (Liu et al., 2010; Feng et al., 2015), which also triggers heavy rainfall in the NSCS. In addition, Chang et al. (2005) found that the increased shear vorticity caused by the stronger northeasterly winds carried by the cold system contributes to the strengthening of the ITCZ and formation of a vortex, which also enhances precipitation generation. In contrast, in the absence of the ITCZ, heavy precipitation is suppressed. The ITCZ also brings about both low-level convergence (near 950 hPa) and high-level divergence (near 200 hPa) and is accompanied by the reinforcement of local positive vorticity advection and potential pseudo-equivalent temperature advection. This destroys the local quasi-geostrophic balance and aggravates the unstable stratification. The secondary circulation stimulated by the above dynamic forcing supports local ascent (Liu et al., 2010). The changes in temperature and humidity related to the dynamic process of the ITCZ are directly responsible for the rapid development of convection, leading to heavy rainfall (Wang and Magnusdottir, 2006; Li et al., 2009). In summary, the ITCZ plays a vital role in heavy non-TC rainfall over the NSCS. Consequently, two questions arise from these findings: how does the ITCZ move north into the NSCS during autumn, and what are the associated physical mechanisms?
The ITCZ position (PITCZ) in the SCS is closely related to the intensity of the winter or summer monsoon (Lander, 1996; Li and Ju, 2013) and the corresponding rain belt moves north-south seasonally (Hu et al., 2007; Xie et al., 2018). In summer, the ITCZ is pushed to around 20°N by the powerful southwesterly winds in the SCS, and the southwesterly flow on its south side facilitates the development of heavy rainfall over the NSCS and southern China (Zhao et al., 2007). In autumn, the southwesterly winds retreat and the northeasterly winds begin to play a role in the weather processes of the NSCS, also resulting in the southward movement of the ITCZ (Wei et al., 2008; Richter et al., 2017) and the southerly movement of the rain belt towards southern Vietnam (Yokoi et al., 2007; Yokoi and Matsumoto, 2008; Wang et al., 2015). Remarkably, however, under favorable conditions, the ITCZ in the SCS can move north to the appropriate position over 2–14 days (Lander, 1996; Magnusdottir and Wang, 2008; Chen et al., 2015) in autumn, where it can interact with a cold air mass from northern China, causing precipitation over the NSCS (i.e., the north side of the ITCZ) (Zhao et al., 2011; Xiao et al., 2013). Unfortunately, a detailed understanding of the mechanisms associated with this synoptic-scale northward movement of the ITCZ over the SCS, and the resultant heavy rainfall to its north, remains notably absent. So, it is hard to grasp when and where ITCZ begins to affect the NSCS, which leads to poor forecasting accuracy of non-TC autumn precipitation. This research is motivated by the above-mentioned questions, documents the heavy non-TC rainfall event over the NSCS in the autumn of 2010, and explores the mechanisms associated with the synoptic-scale northward movement of the ITCZ in the SCS.
The rest of the paper is organized as follows. Our data and methodology are described briefly in section 2. Section 3 quantitatively describes the northward movement of the ITCZ and the precipitation in the NSCS. The impact of the ITCZ on heavy rainfall is considered in section 4. The favorable factors that cause the northward movement of the ITCZ and the leading response of each factor to ITCZ movement are discussed in section 5. Section 6 presents the summary and discussion of our findings.
2.1. Data
The Tropical Rainfall Measuring Mission level three product (TRMM_3B42RT) provided by the National Aeronautics and Space Administration (NASA) was used to describe rainfall over the NSCS (15°–20°N, 110°–120°E), at a temporal resolution of one day and a spatial resolution of 0.25° × 0.25° (Huffman et al., 2010). The FY2E satellite cloud images, obtained from the Institute for the Environment (IENV) at the Hong Kong University of Science and Technology (HKUST), were used to analyze the changes in clouds during the ITCZ movement.Reanalysis data including the meridional wind, zonal wind, geopotential height, air temperature, and specific humidity, at a temporal resolution of one hour and a spatial resolution of 0.5° × 0.5°, were obtained from the European Center for Medium-Range Weather Forecasts (ECMWF; Hersbach et al., 2020, hereafter referred to as ERA5) to determine PITCZ and investigate the associated atmospheric circulation. In addition, interpolated outing longwave radiation (OLR) data with a temporal resolution of one day and a spatial resolution of 2.5° × 2.5°, provided by the National Oceanic and Atmospheric Administration (NOAA; Liebman and Smith, 1996), were used to calculate the ITCZ intensity. Monthly mean Ni?o-3 index and SST data for the Ni?o-3 area (5°S–5°N, 150°–90°W), derived from the Extended Reconstructed Sea Surface Temperature Version 5 (ERSSTv5; Huang et al., 2017) dataset and provided by the Climate Prediction Center (CPC), were used to demonstrate the favorable SST variations that promoted the northward movement of the ITCZ.
2
2.2. Methods
We defined the value of PITCZ in the SCS as the position of the eastward (west to east) wind shear line at 850 hPa, as shown in Fig. 1. To filter out the high-frequency waves (less than three days), the zonal wind data used to calculate PITCZ were obtained via low-pass filtering of the raw data. The SCS region (0°–24°N, 110°–120°E) was divided into 24 × 19 grid cells, with a meridional and zonal resolution of 0.5° and 1°, respectively. We determined the direction (
 Figure1. Schematic representation of the definition of PITCZ. The three large boxes represent the area covered by the SCS (0°–24°N, 110°–120°E), which were divided into 24 × 19 grid cells. The first box shows all positions where

where


We used the following method to eliminate the abnormal points and select the eligible points:
here,


In addition to the method outlined above, OLR data are often used to quantitatively describe the features of the ITCZ (Zhang and Jiang, 2001; Meenu et al., 2007). In this study, the intensity of the ITCZ was characterized as follows:
where


Tropical Cyclone (TC) precipitation in the SCS falls mainly within 2.5° of longitude from the TC center (Chen et al., 2010; Feng et al., 2013); consequently, TCs with a center west of 130°E or south of 30°N can affect the NSCS. We eliminated dates on which TCs influenced the NSCS based on TC path data provided by the Japan Meteorological Agency, and found that a non-TC precipitation event occurred between 29 September and 5 October 2010 over the NSCS.
 Figure2. The distribution of PITCZ (right) and M (the minimum OLR value) variation over time (left; units: W m–2). The red, orange, yellow, green, black, blue, and purple stars (and accompanying numbers) indicate the PIITCZ from 29 September to 5 October 2010, respectively.
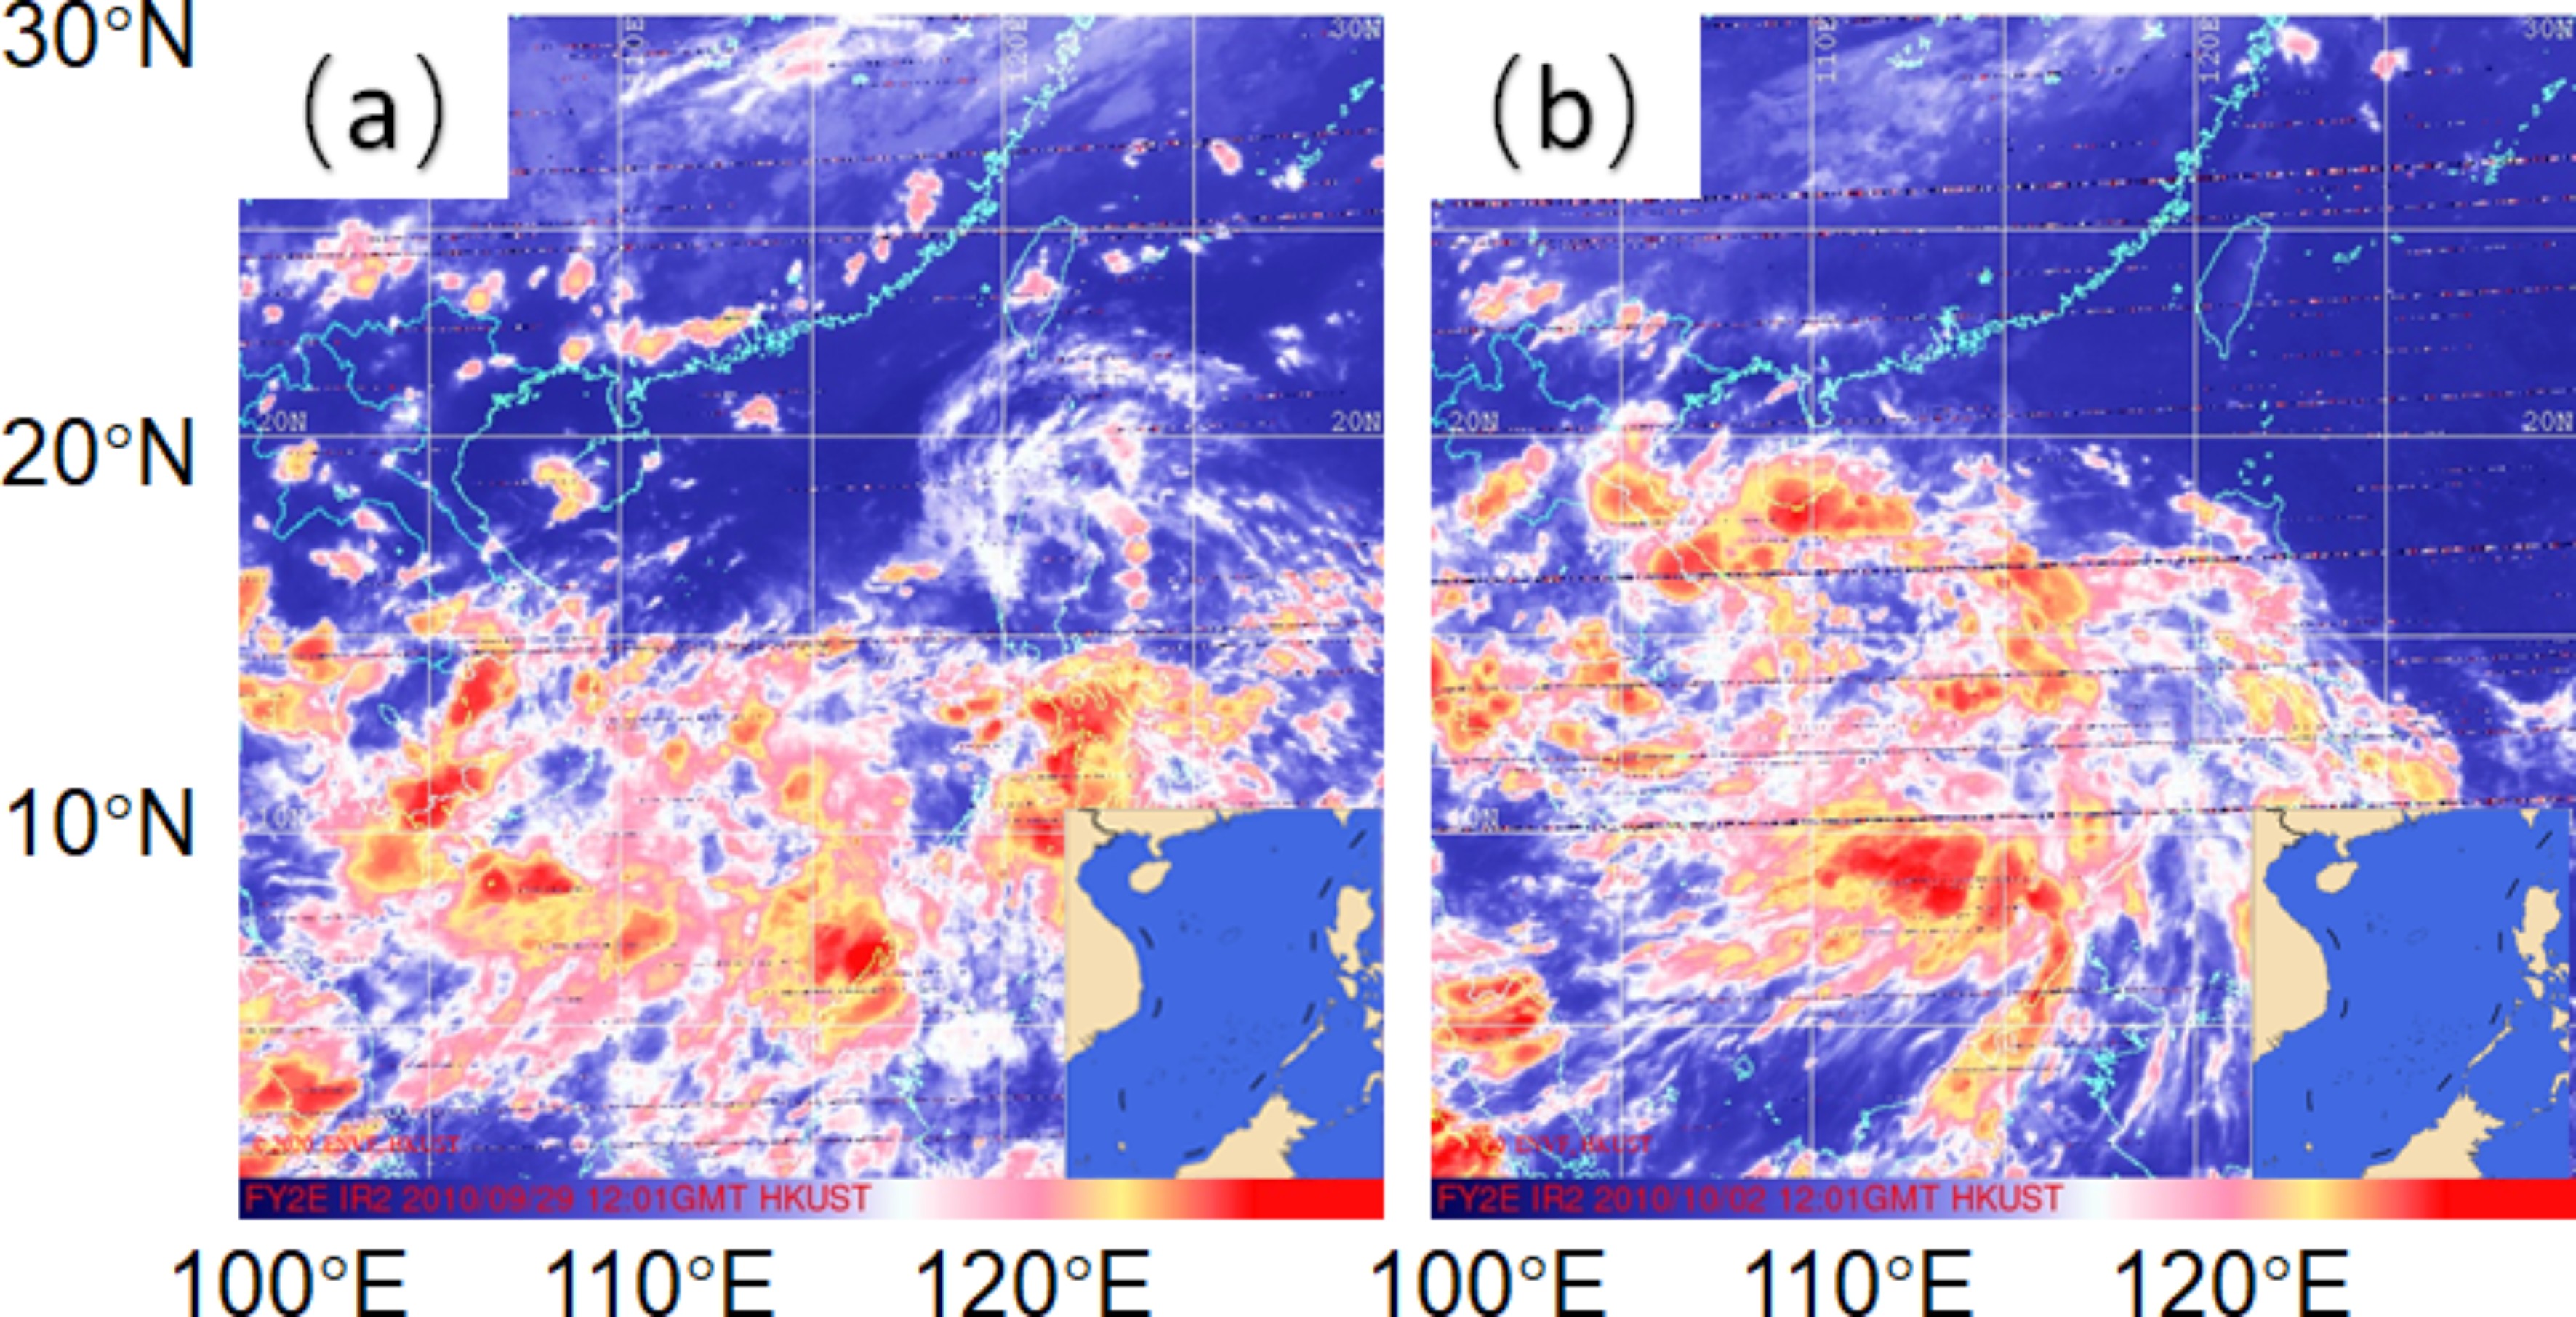 Figure3. Cloud images from (a) before (1200 UTC 29 September 2010) and (b) after (1200 UTC 2 October 2010) the heavy rainfall in the NSCS.
Over the period 2?5 October 2010, the accumulated rainfall broke the record that had stood since 1970 in the NSCS. The rain around Hainan Island began on 2 October, with a daily area-averaged rainfall (15°?20°N, 110°?120°E) of 21.3 mm, with rainfall occurring in 445 grid cells (Fig. 4d). Subsequently, the number of grid cells with rainfall decreased slightly, but the daily area-averaged rainfall increased significantly and it reached its maximum value of 33.4 mm on 5 October (Figs. 4e and 4f). The development of this rainfall was closely related to the ITCZ. When the ITCZ was south of 10°N, the rainfall was weak and scattered near the ITCZ (Figs. 4a and 4b). The rainfall over the NSCS concentrated significantly towards Hainan Island and the surrounding sea area commensurate with the strengthening and northwestward movement of the ITCZ (Figs. 4c?4f).
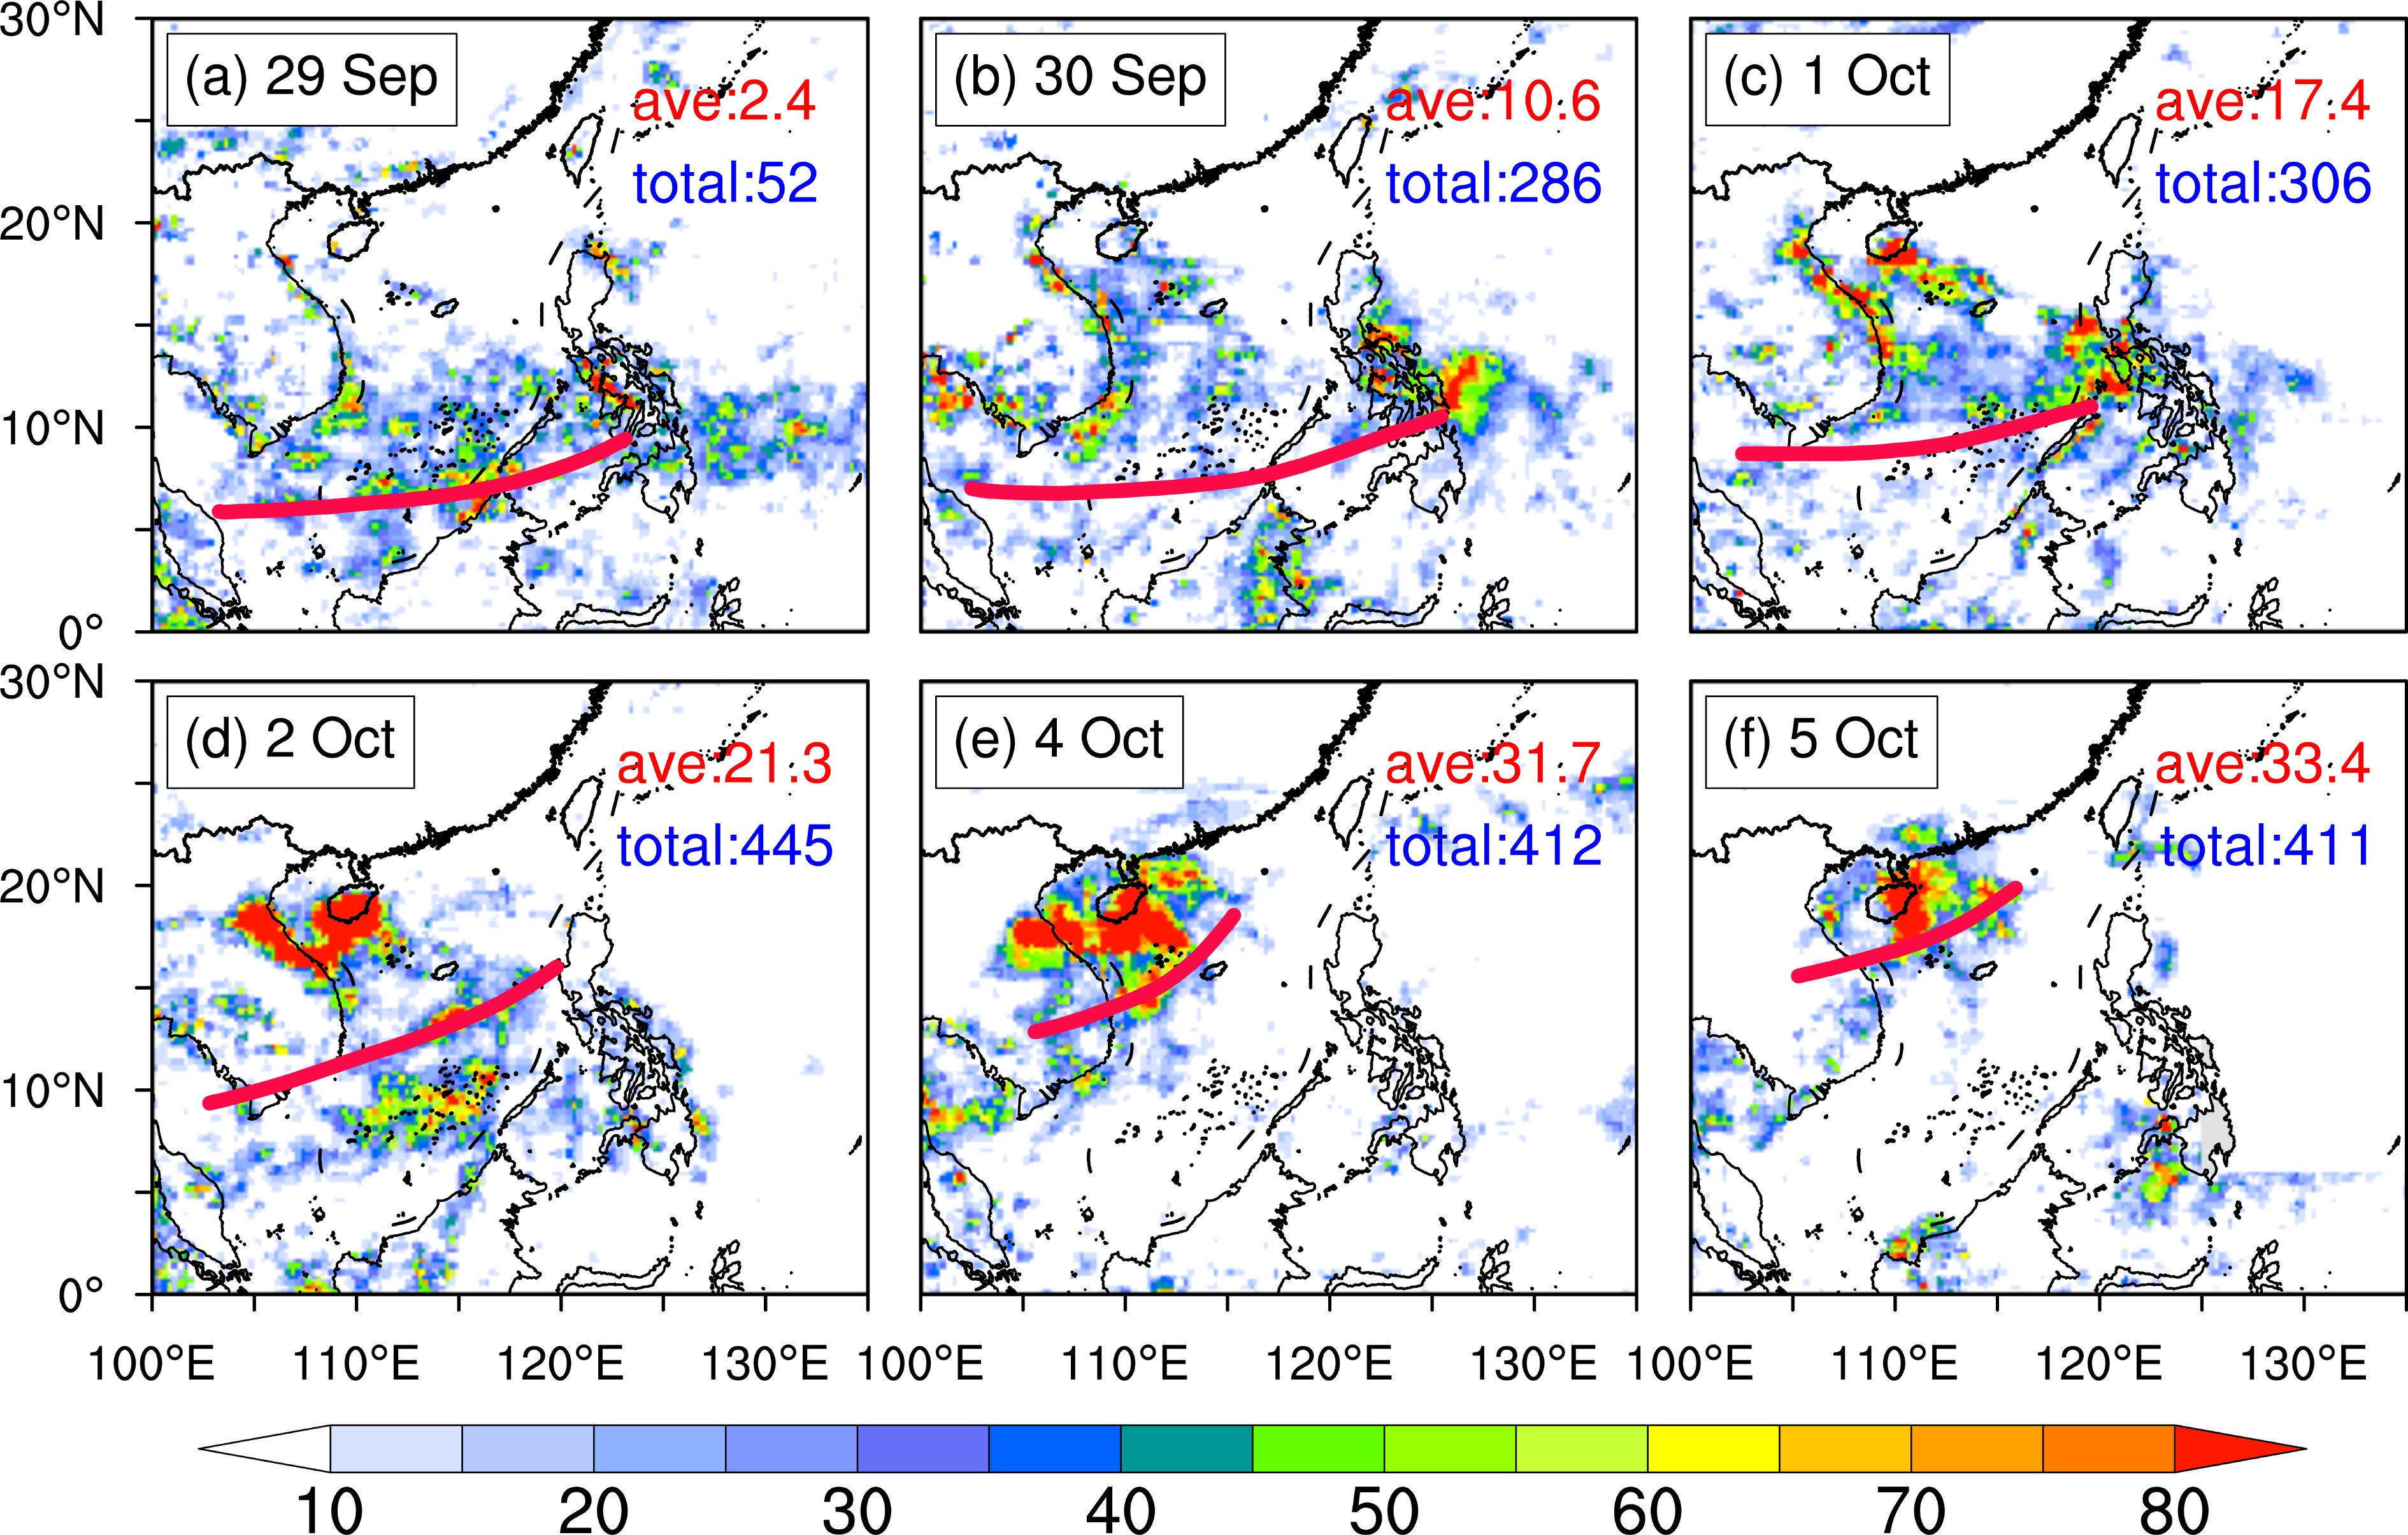 Figure4. Spatial distribution of PITCZ (red solid line) and daily rainfall (shading; units: mm) in the SCS area. (a)–(f) shows plots for 29 and 30 September, and 1, 2, 4, and 5 October 2010, respectively. The red and blue text indicates the daily area-averaged rainfall and the number of grid cells with rainfall in the NSCS (15°?20°N, 110°?120°E), respectively.
4.1. Moisture was transported by the ITCZ
An abundant supply of moisture is one of the conditions required for the generation of heavy rainfall. We determined the source of moisture over the NSCS by calculating the integral of the water vapor flux (WVF) at 1000–300 hPa based on the method applied by Fasullo and Webster (2003). Figure 5a shows that the moisture over the NSCS before the period of heavy rainfall came mainly from the western Pacific. The maximum WVF value was ~ 400 kg m–1 s–1 and concentrated below 900 hPa (Fig. 6a). When the ITCZ approached 12°N on 2 October, moisture was transported by the southwesterly winds on the south side of the ITCZ into the NSCS from the Bay of Bengal and the western Pacific, which, together, enhanced the WVF in the NSCS (Fig. 5b). In the meantime, more moisture extended vertically to 500 hPa (Fig. 6b) and the heavy rainfall began in the NSCS. As the ITCZ entered the NSCS, the moisture from the Bay of Bengal was dominant (Fig. 5c) and continued to spread vertically (Fig. 6c), which intensified the rainfall. We concluded that the moisture supplied from the Bay of Bengal that was driven by the northward movement of the ITCZ, constituted the primary source of the moisture that caused the rainfall in the NSCS.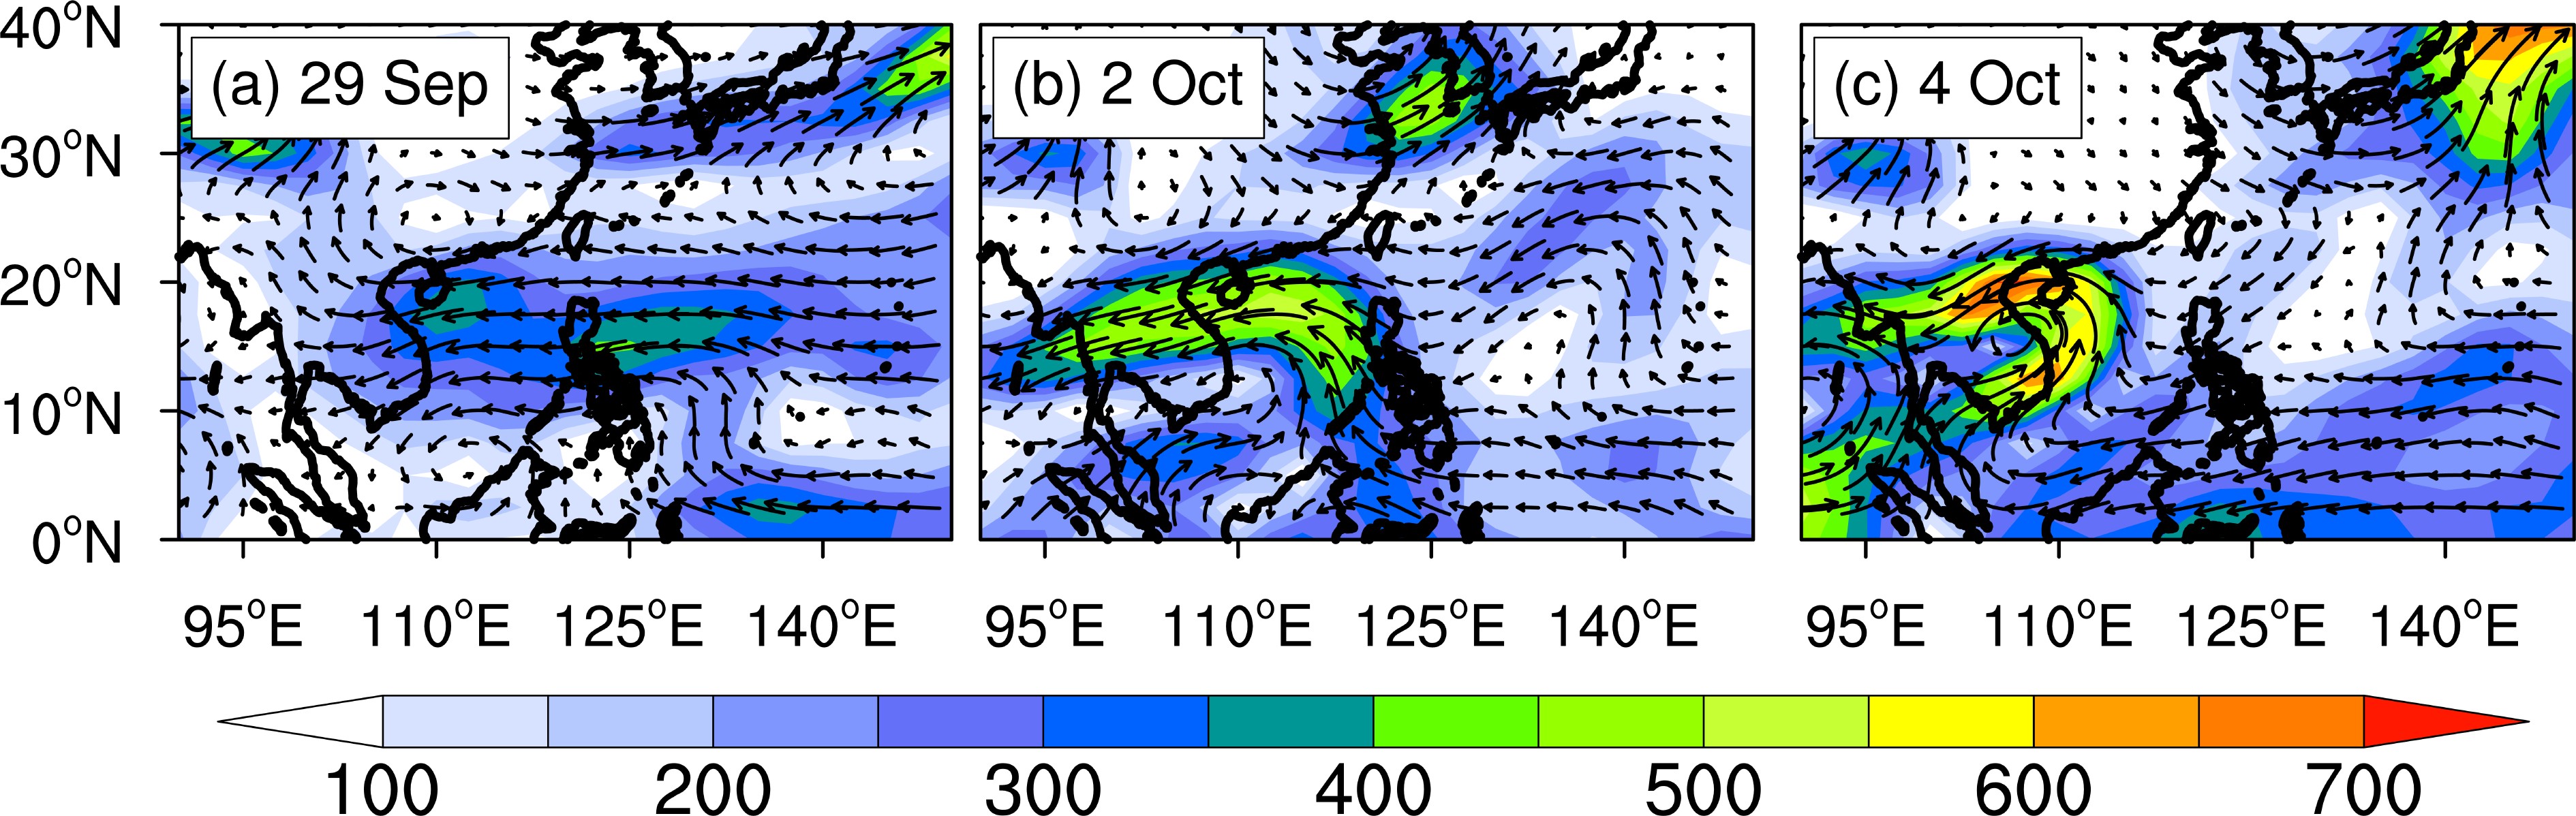 Figure5. Integrated WVF from 1000 to 300 hPa (units: kg m–1 s–1) for (a)–(c) 29 September (before rainfall), 2 October (start of rainfall), and 4 October (during rainfall) 2010, respectively. The shading and arrows represent the WVF value and vector, respectively.
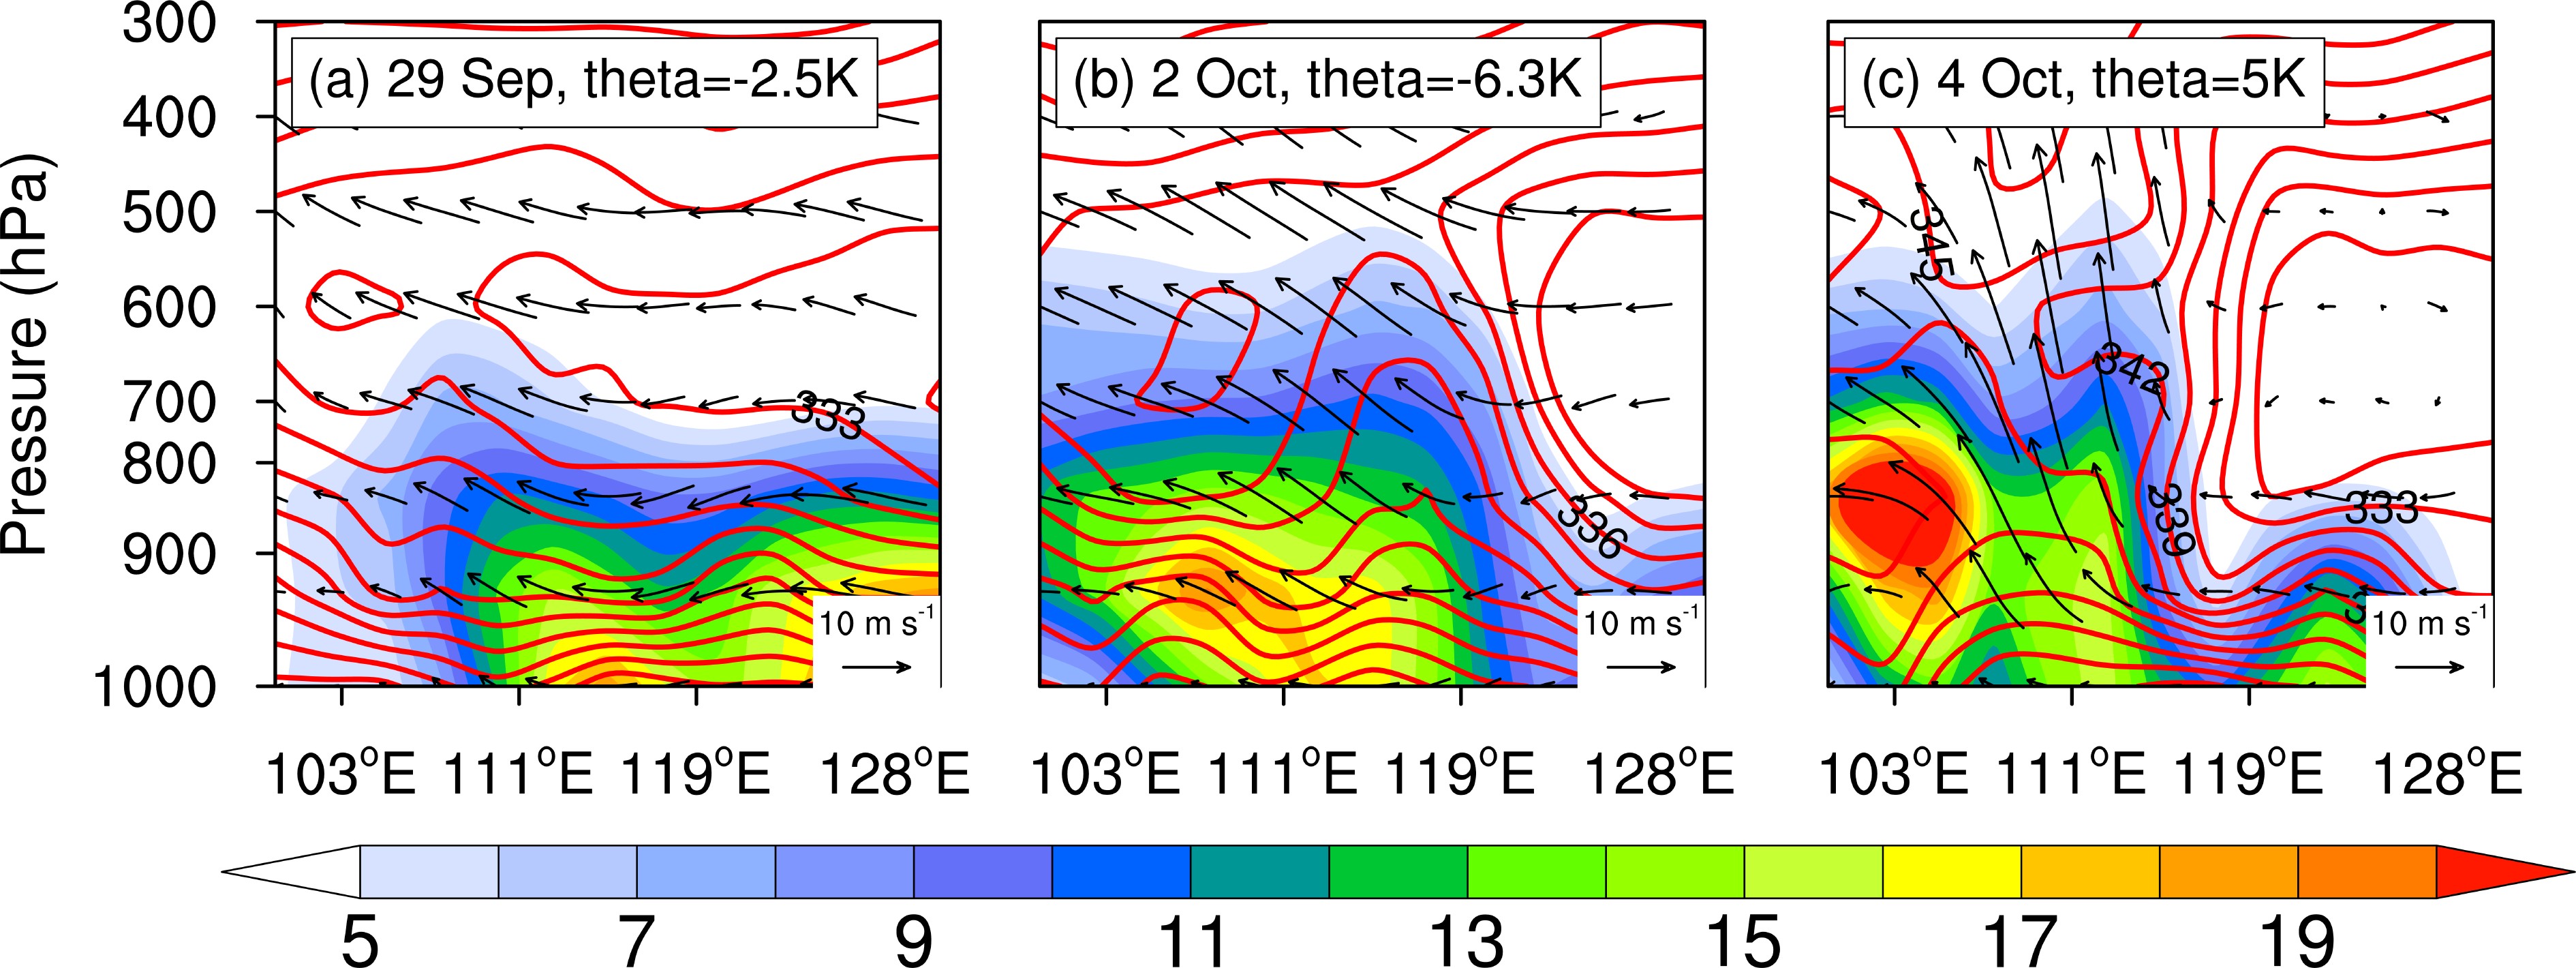 Figure6. Vertical cross-section of the WVF (shading; units: kg m–1s–1), pseudo-equivalent potential temperature (red contours, interval: 3 K) and wind (zonal wind and omega, arrows; units: m s–1) along 18.5°N, and black texts for
2
4.2. Atmospheric instability and ascending motion were strengthened by the ITCZ
In addition to moisture supply, the atmospheric instability and strong ascending motion also facilitated the generation of heavy rainfall. We calculated the tropospheric stability based on the temperature difference between the middle and lower levels (Liu et al., 2017) as follows:here,


For the dynamic field in the NSCS, when the ITCZ arrived at around 12°N, the positive vorticity, the low-level convergence, and ascending motions were obviously stronger than before (Figs. 7a and 7b). This, together with sufficient moisture and atmospheric instability, generated the heavy rainfall. As the ITCZ covered the NSCS, the low-level convergence strengthened further and was accompanied by a more violent ascending motion. This enhancement of the convergence and ascending motion was related to the strengthening and thickening of the positive vorticity layer (Figs. 7b and 7c). To further assess the impact of the ITCZ on the development of the positive vorticity in the NSCS, we used the vorticity budget equation (Chen and Zheng, 2004; Nguyen and Molinari, 2015) as follows:
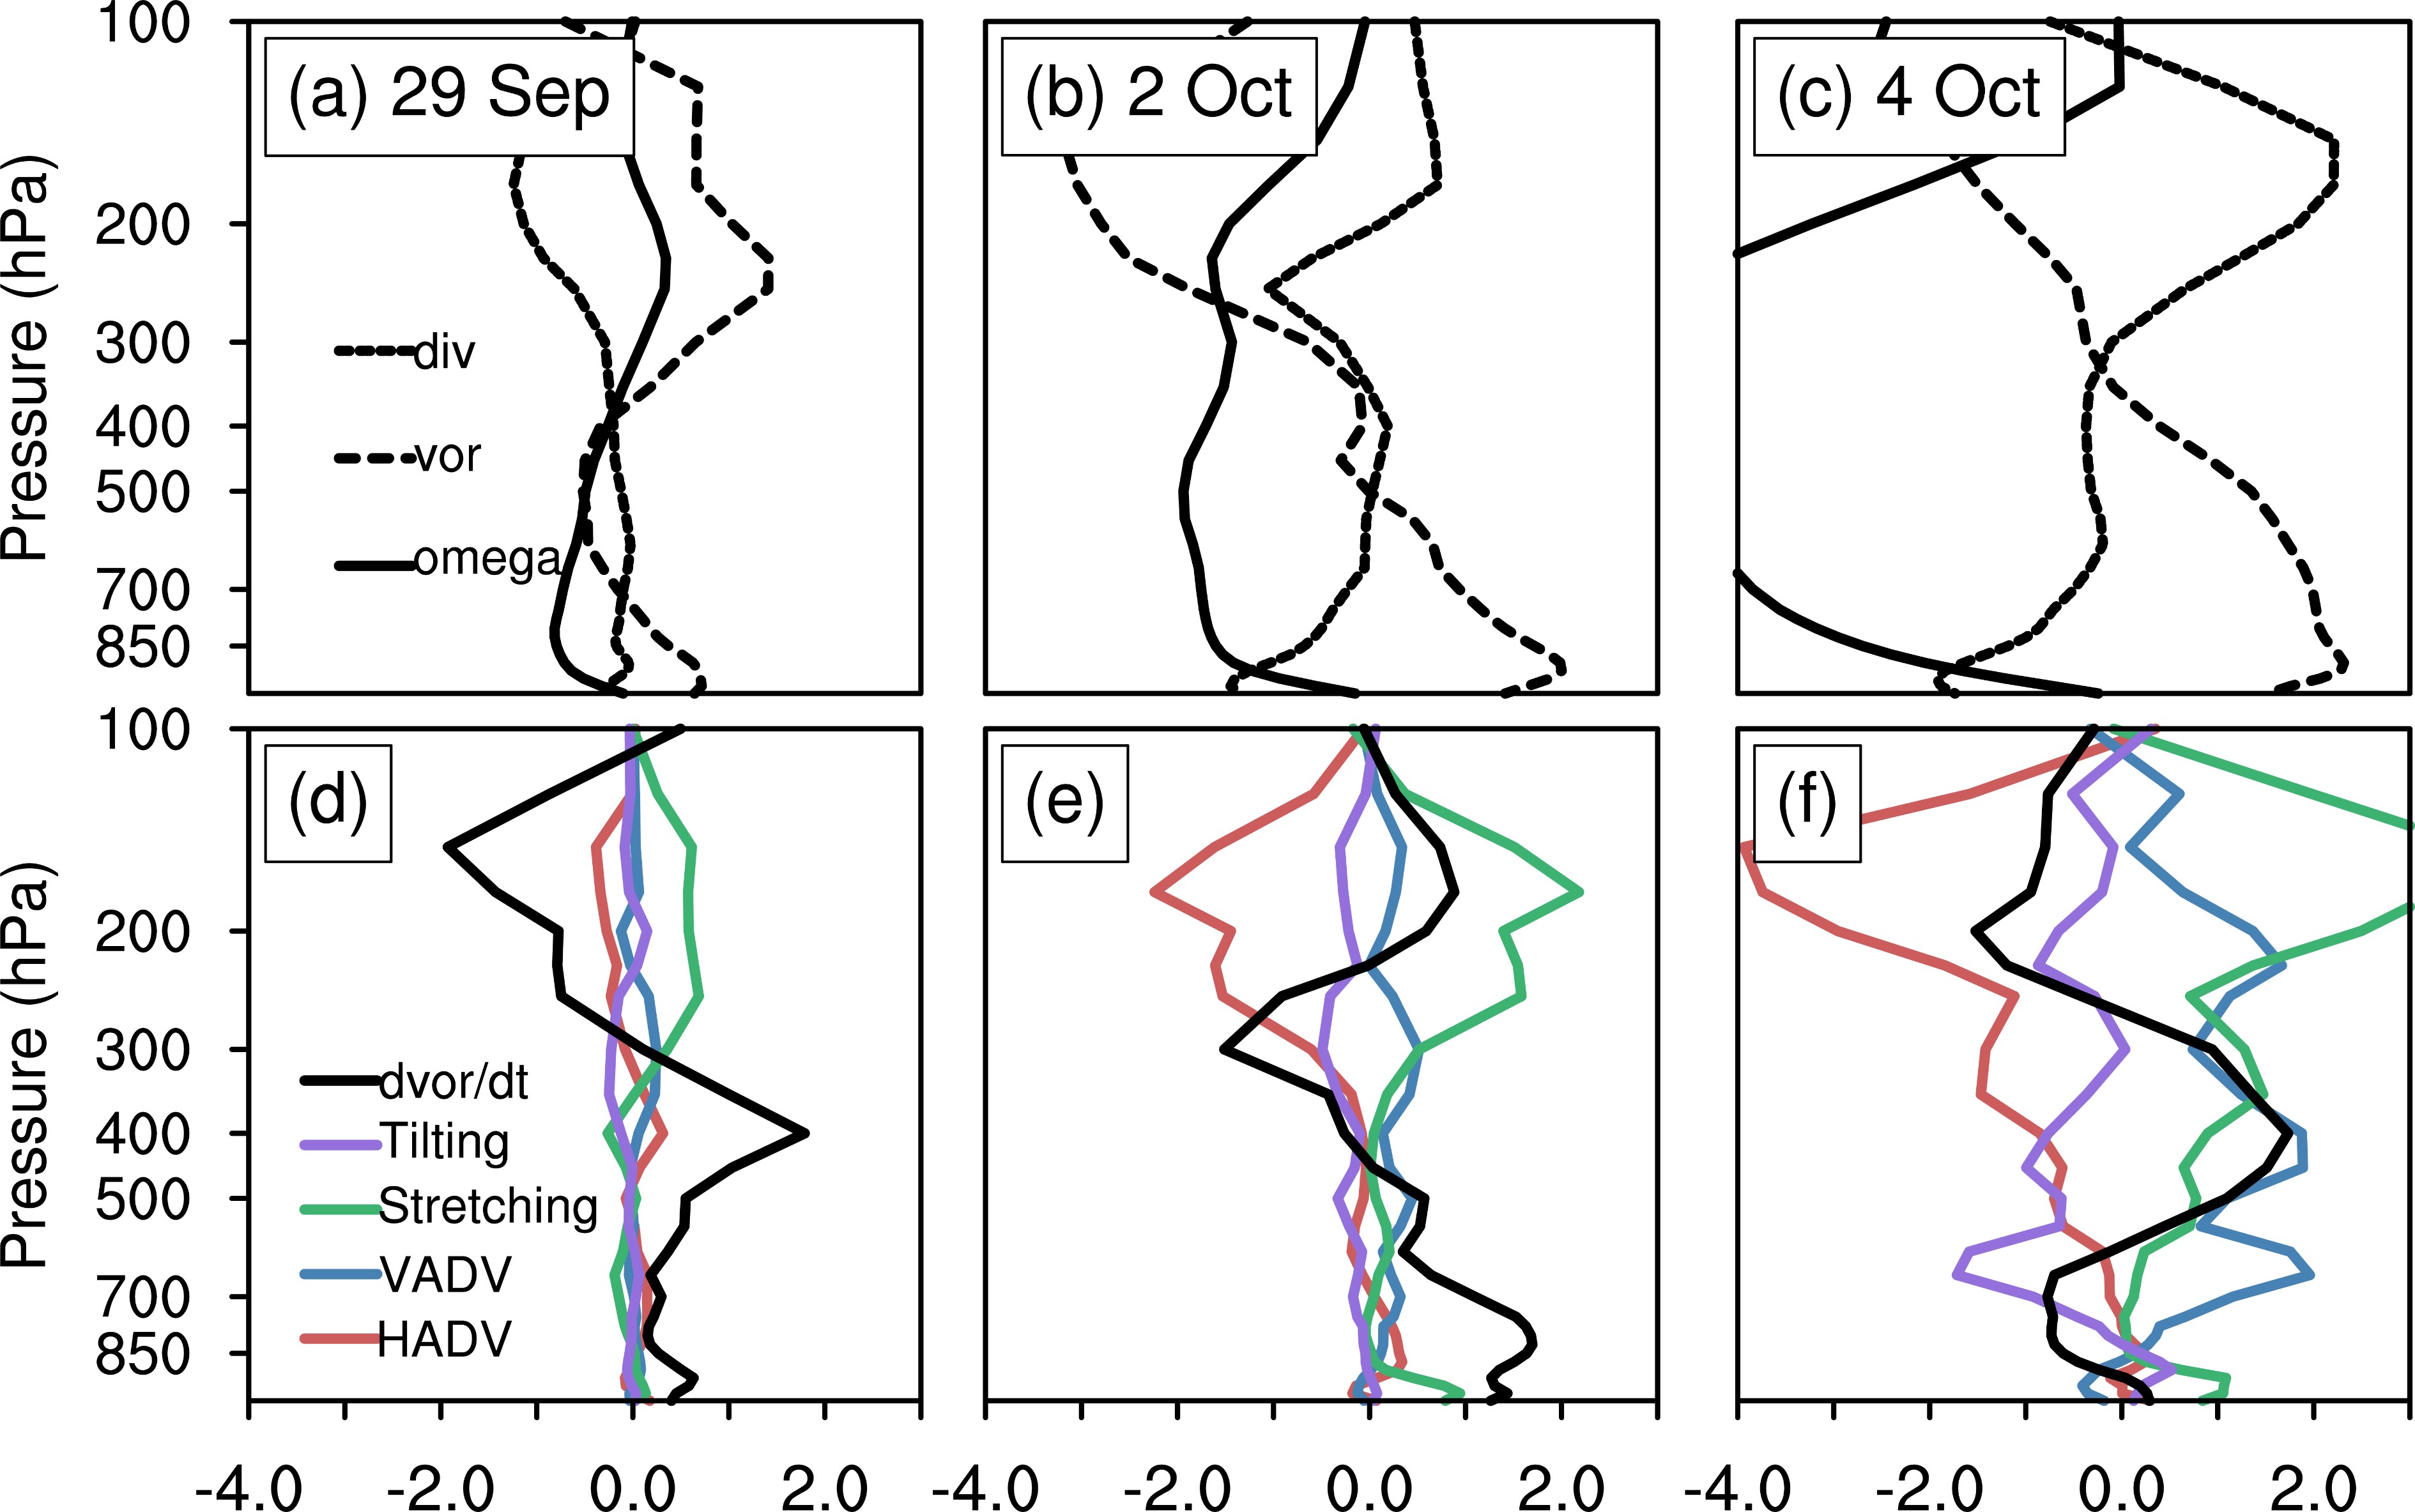 Figure7. (a)–(c) Profiles of average divergence (dotted; units: 10–5 s–1), convergence (dashed; units: 10–5 s–1), and omega (solid; units: 10–1 Pa s–1) in the NSCS. (d)?(f) Profiles of the average contribution to the relative vorticity tendency (units: 10?9 s?2) from horizontal advection (red), vertical advection (blue), tilting (purple), and stretching (green) for the NSCS. Periods covered by (a)–(c) and (d)?(f) are the same as in Fig. 5.
here,


We found that the enhancement of positive vorticity below 500 hPa was associated mainly with the horizontal advection and stretching terms on 2 October (Fig. 7e). This enhancement was a consequence of the horizontal transport of positive vorticity to the NSCS by the ITCZ as it approached 12°N. Subsequently, the vertical advection and stretching terms made a positive contribution to the strengthening and thickening of the positive vorticity layer (Fig. 7f). The positive vorticity layer was further thickened to 300 hPa, and the positive vorticity around 700–500 hPa increased significantly (Figs. 7c and 7f). At this time, the ITCZ controlled the NSCS, which was why the positive vorticity was transported vertically to middle levels. This was conducive to the enhancement of the dynamic field of precipitation.
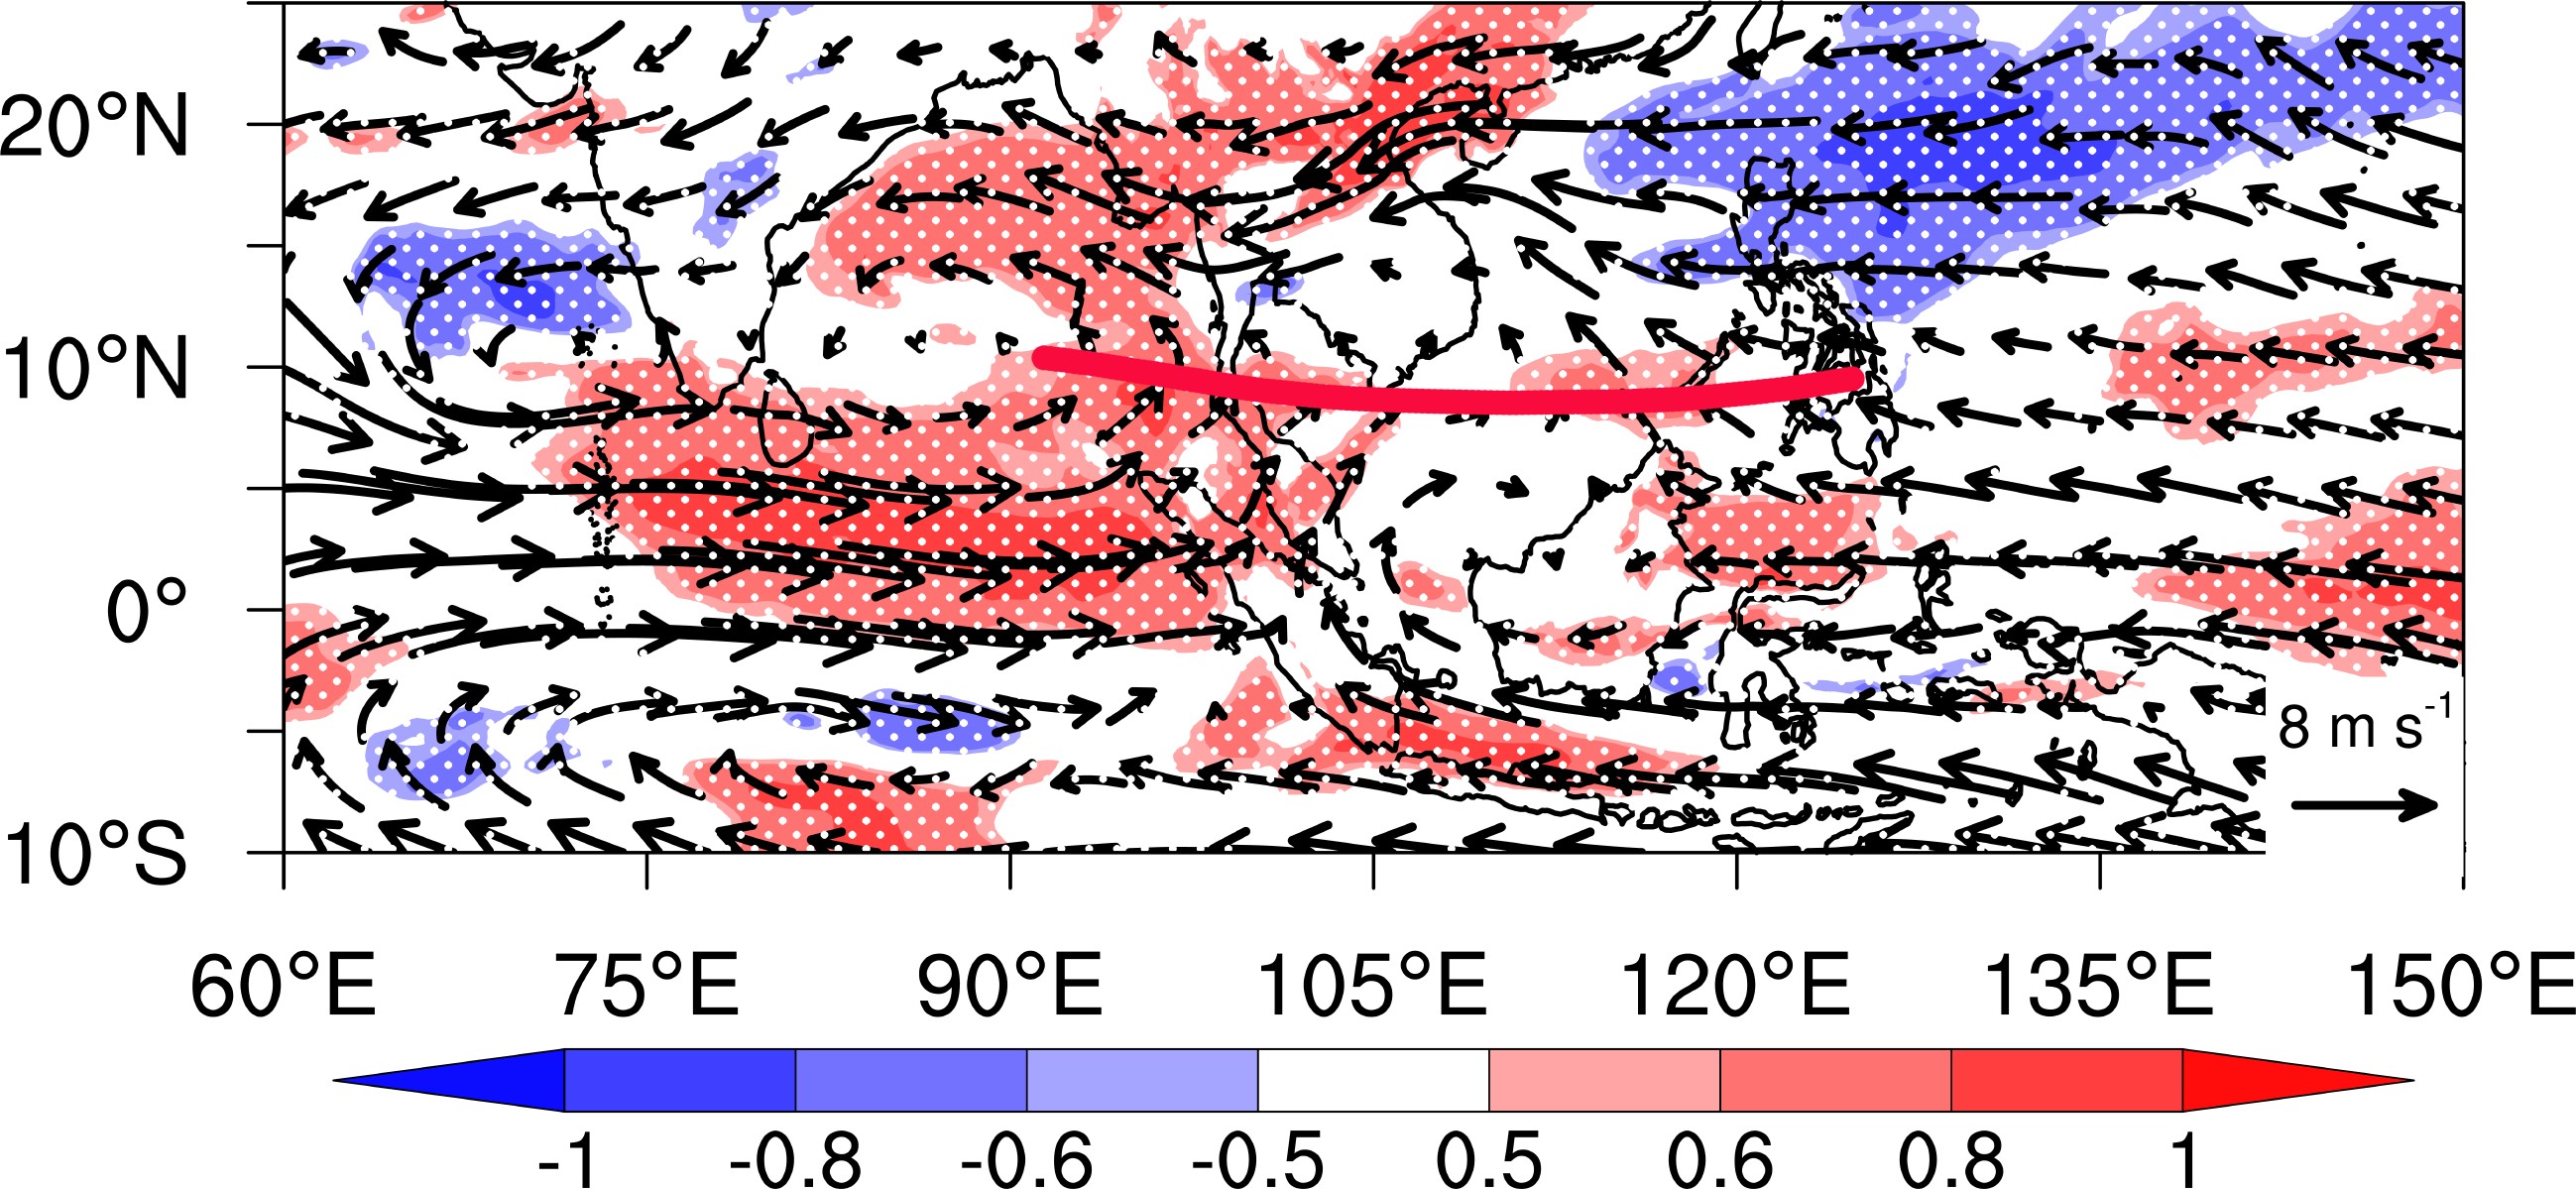 Figure8. The correlation between PITCZ and wind speed at 850 hPa (shading, only those regions where the correlation coefficient is greater than 0.4 and passes 95% significance using the Student’s t-test are shaded) and average wind speed at 850 hPa (arrows; units: m s?1) between 29 September and 5 October 2010. The red line indicates the average distribution of PITCZ.
2
5.1. Equatorial easterly promoted the ITCZ move north
We will first examine the effect of the strengthened EE on the northward movement of the ITCZ. In section three, we divided the northward movement of the ITCZ into three stages. Figures 9a–c show the average wind field during these three stages, and Fig. 9d shows the variation of the average wind over time within 5° of latitude on the south side of the ITCZ. Between 29 September and 1 October, the ITCZ south of 10°N was pushed slowly northward at an average speed of 0.8° per day by southwesterly winds (Figs. 9c and 9d). On 1?2 October, the southwesterly wind was strengthened by an equatorial anticyclone (the negative vorticity attained a maximum in the area 110°–120°E, 5°S–5°N, shown in the red box of Fig. 9b on 1 October), and the EE reached the SCS and then turned to the southeast. The two flows merged to form a strong southerly wind, which enabled the ITCZ to move quickly north (at about 2.5° per day) and reach the vicinity of 12°N (Figs. 9b, d). However, the anticyclone was short-lived (the negative vorticity gradually decreased); consequently, the action time of the southwesterly wind on the northward movement of the ITCZ was also short. Hereafter, the EE continued to pour into the SCS and turned into the southeasterly wind, pushing the ITCZ northwest at an average speed of 1.7° per day during 2?5 October (Figs. 9a, 9d). From the above analysis, the southwesterly wind played only a temporary role in the northward movement of the ITCZ. Therefore, we propose that the EE were more important in driving the ITCZ northward consistently over this period. Figure9. (a)–(c) The average wind (units: m s?1) at 850 hPa during 2?5 October, 1?2 October, and 29 September to 1 October 2010, respectively. Red dots are the distribution of PITCZ. Red numbers are the average values of PITCZ. The red box shows the location of the equatorial anticyclone. (d) Variation of the average wind (units: m s?1) within 5° of latitude on the south side of the ITCZ over time.
Regarding the strengthening of EE, we explored the contribution of the SST in the Pacific to EE enhancement. We found that a La Ni?a event developed in 2010 (Gu et al., 2015), and the Ni?o 3 index and the SST in the Ni?o-3 region dropped to a minimum in October (not shown). Additionally, the variation of the weekly data further demonstrated that the SST in the Ni?o- 3 region during this process decreased from its value of the previous week (Fig. 10a). This resulted in further intensification of the Walker circulation as a result of this process (Feng et al., 2013; Chiodi and Harrison, 2015; Hu et al., 2020), which enhanced the EE, enabling it to reach the SCS to support the northward movement of the ITCZ (Fig. 10b).
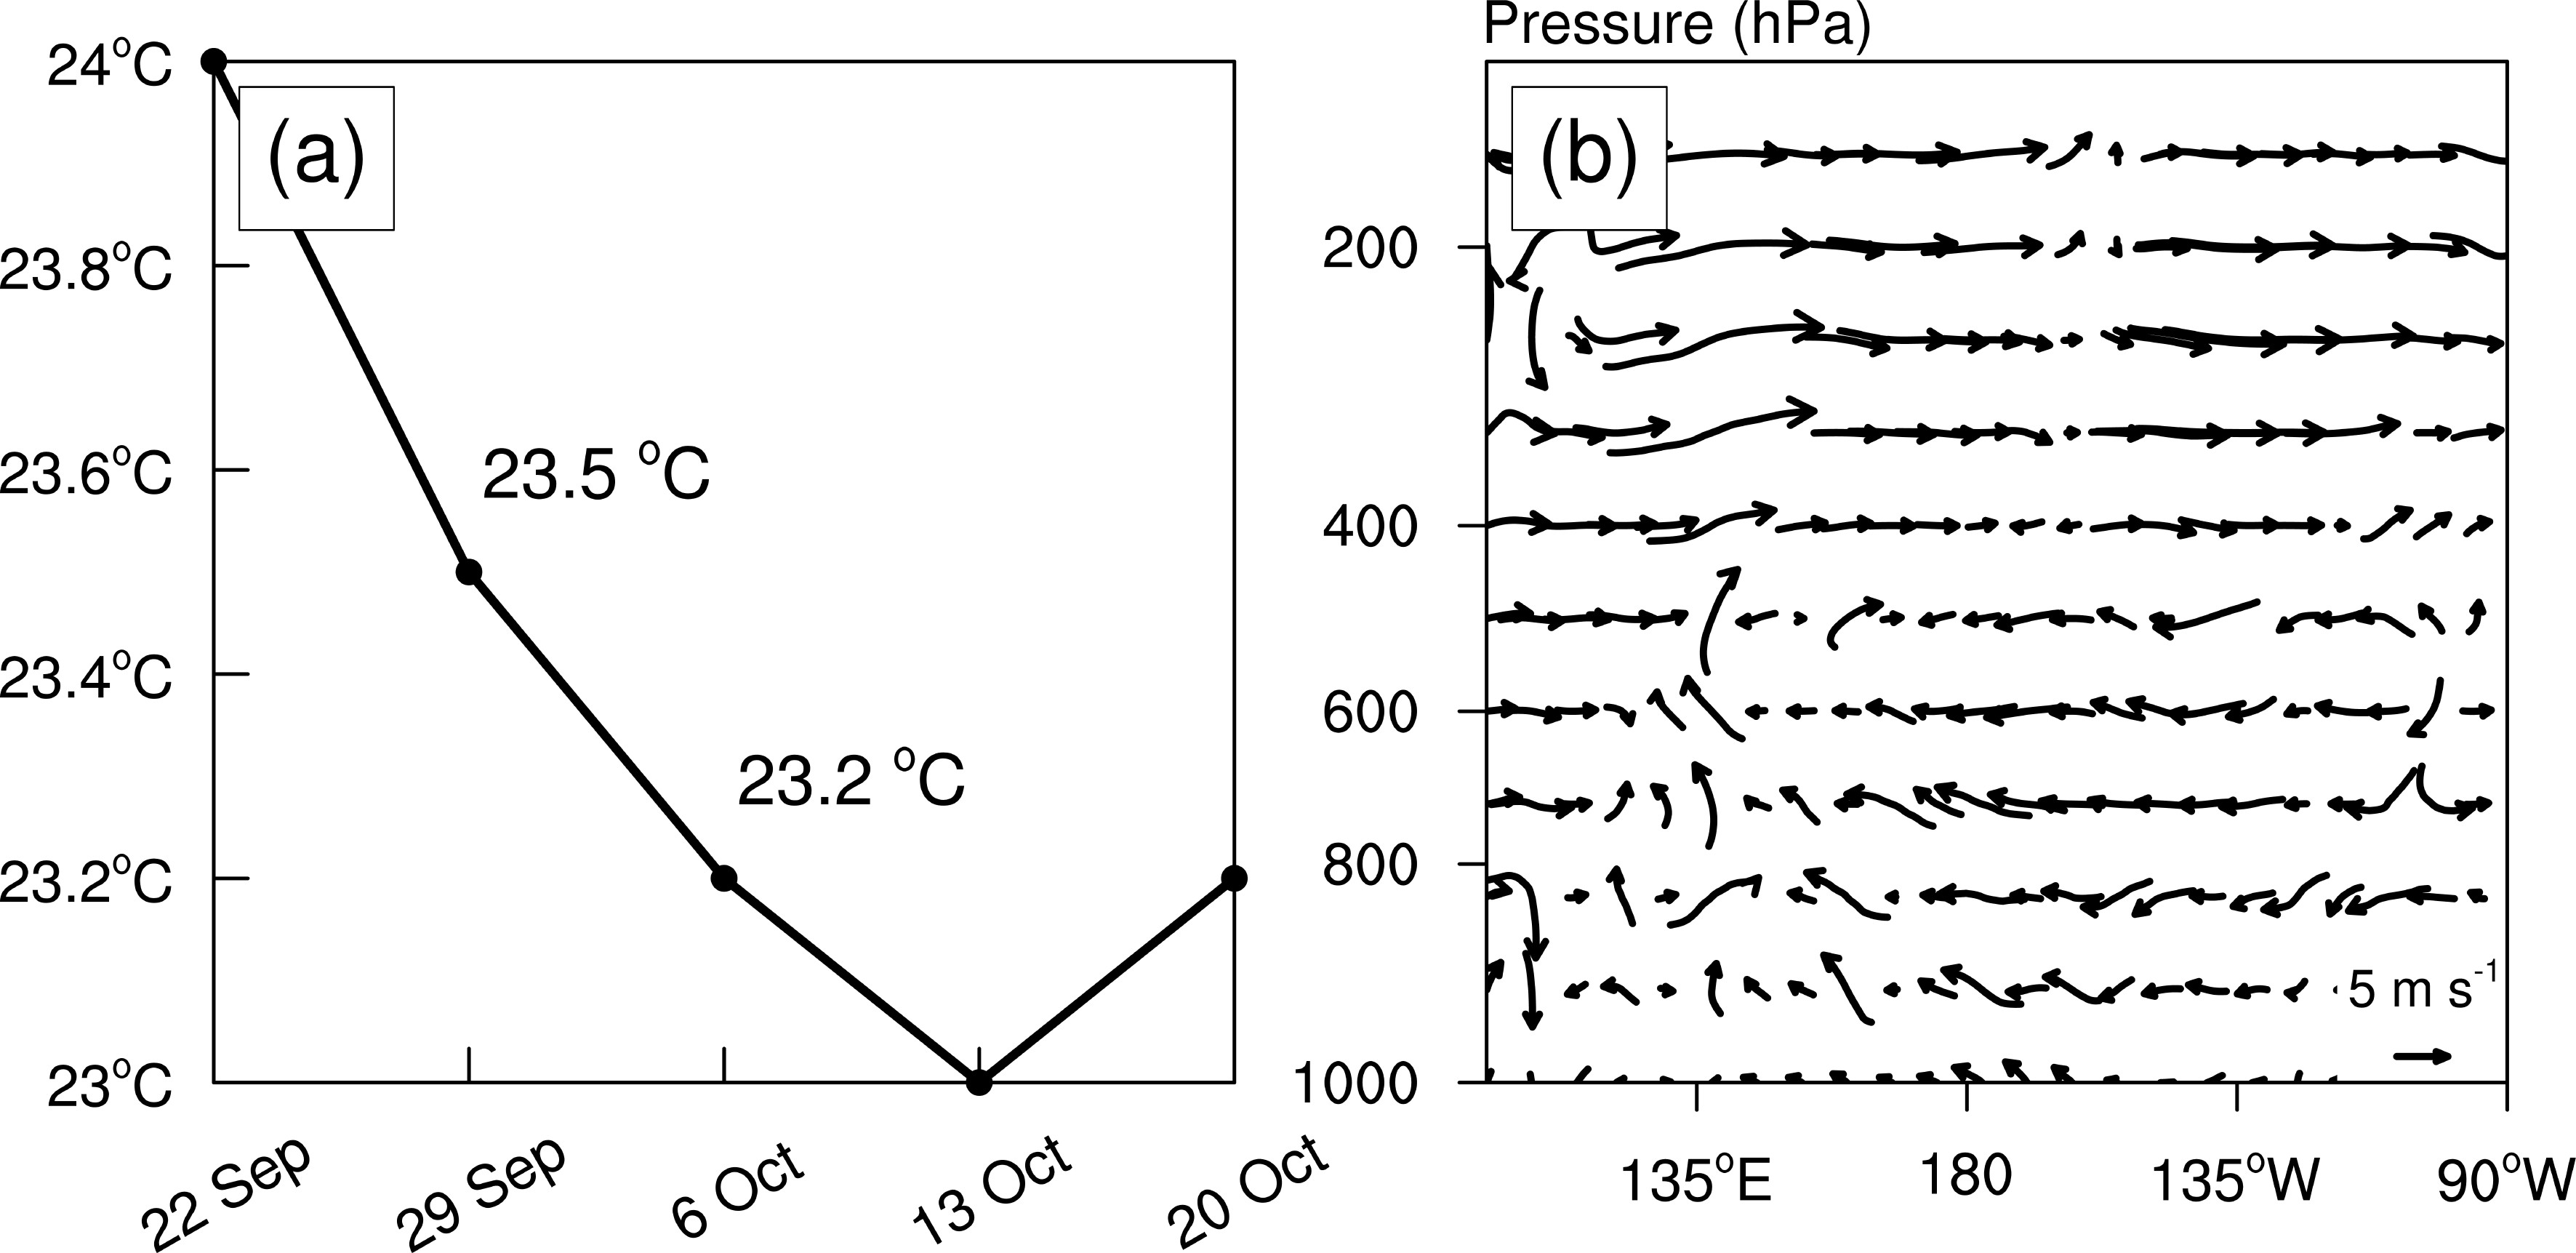 Figure10. (a) The variation of the weekly averaged SST (black; units: °C) in the Ni?o-3 region from 22 September to 20 October 2010. (b) A vertical cross-section in 0°?5°S of the wind difference (arrows; units: m s?1) between 22?29 September and 29 September?6 October 2010.
Four heavy rainfall events in the NSCS resulted from this kind of ITCZ movement over the periods 8?13 October 2008, 9?15 September 2011, 7?13 September 2013, and 6?9 October 2017 during 2008?17. Notably, all episodes occurred in La Ni?a years. This further suggests that the La Ni?a events are conducive to the strengthening of the EE, which may help the ITCZ to move north, finally causing heavy rainfall over the NSCS in autumn.
In addition to the impact of the SST on the EE, we found that the average wind speed within the region 0°?10°N, 120°?180°E (black box in Fig. 11) corresponding to the EE showed a strong positive correlation with the Mascarene High, the western Pacific subtropical high (WPSH; Bian et al., 2018), and the high on the east side of Australia, which is evident from the geopotential height field at 850 hPa (Fig. 11). The intensity of the Mascarene High changed little during the northward movement of the ITCZ (Fig. 12a). The high on the east side of Australia might have played a vital role in strengthening the EE, noting that it had strengthened since 30 September, 2010 (Fig. 12a) due to the eastward propagation of the quasi-biweekly oscillation near 30°S (Fig. 12b). Zhou and Cui (2011) found that higher SSTs on the east side of Australia are instrumental in developing the geopotential height here and an abnormal EE. Therefore, the positive SST anomaly on the east side of Australia, typically present in La Ni?a years, may be more favorable to the positive geopotential height and an EE anomaly.
 Figure11. Average wind speed (arrows; units: m s?1) and geopotential height (shading, only values greater than 1520 are shown; units: gpm) at 850 hPa from 29 September to 5 October 2010, and the correlation coefficient between the area-averaged wind speed across the area bounded by 0°?10°N, 120°?180°E (black box) and geopotential height (red contours, only those regions where the correlation coefficient is greater than 0.6 and passes 95% significance using the Student’s t-test are shown). The black line marks the transect used to draw the Hovm?ller diagrams.
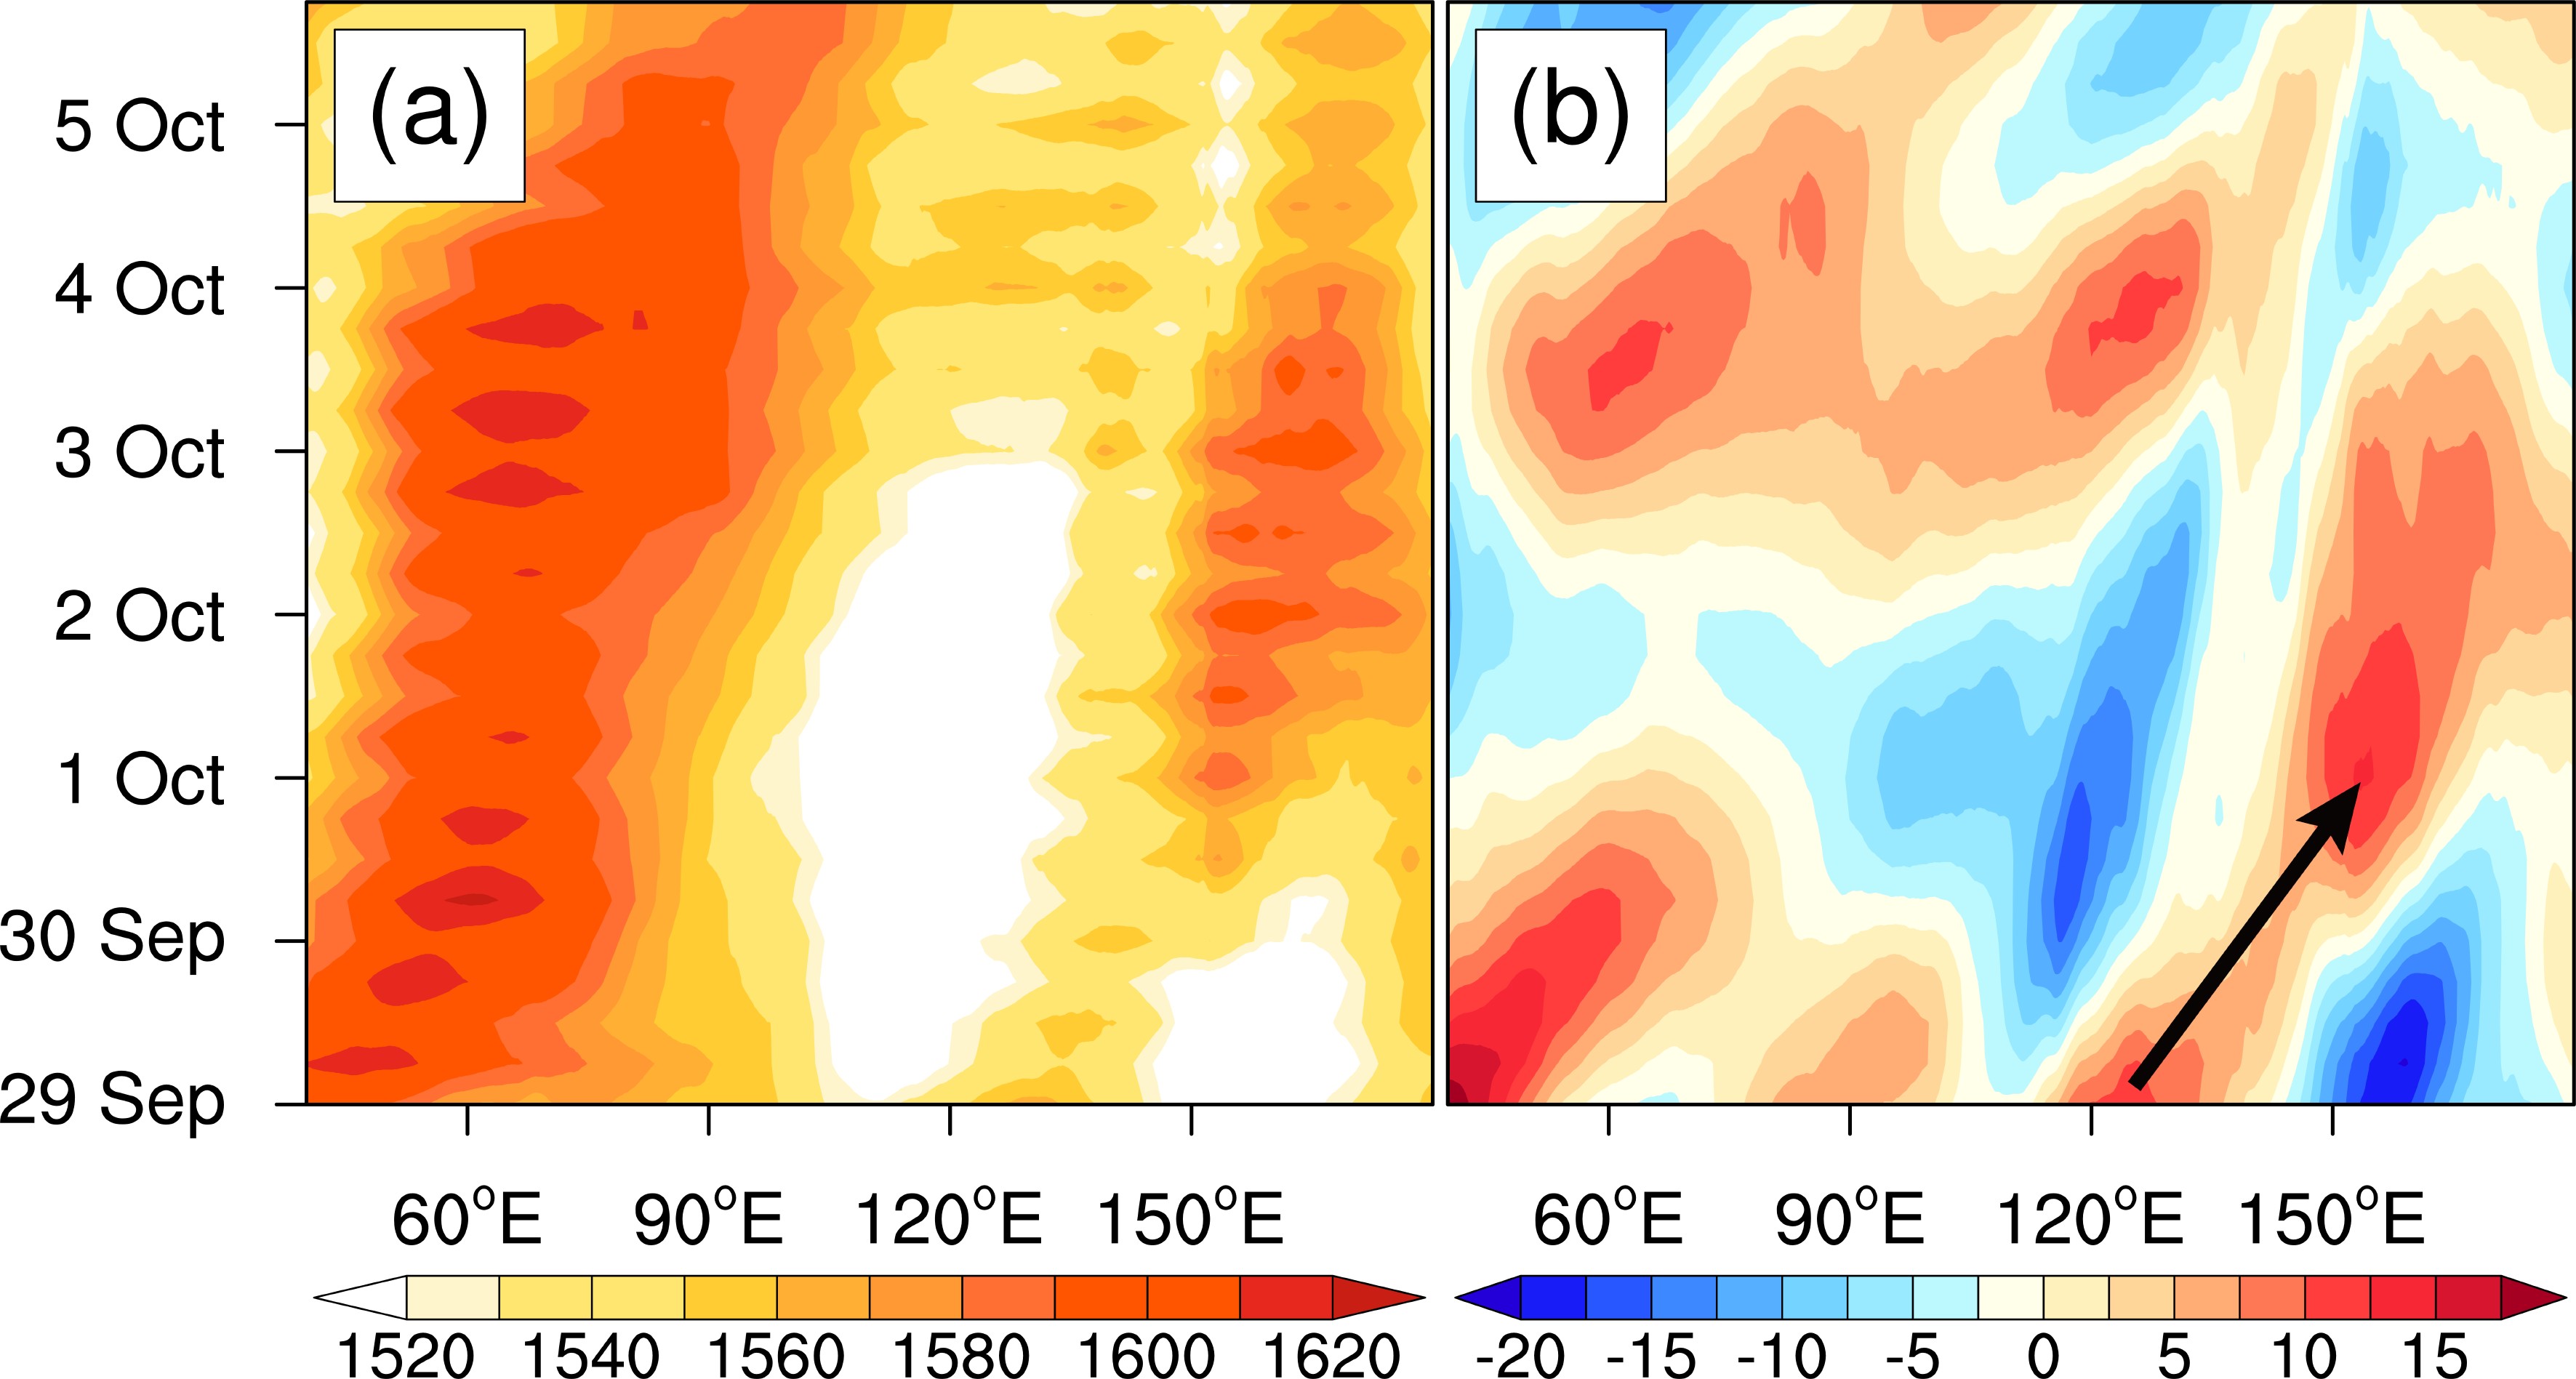 Figure12. (a) Hovm?ller diagram of geopotential height (units: gpm), and (b) the quasi-biweekly oscillation (i.e., the 10- to 20-day filtered geopotential height) at 850 hPa along 30°S (black line in Fig. 11). The black arrow indicates the eastward propagation of the quasi-biweekly oscillation.
2
5.2. The easterly jet in the NSCS made room for the northward movement of ITCZ
Apart from the EE, the decrease in the area influenced by the EJ over the NSCS also plays an important role in the northward movement of the ITCZ. As shown in Fig.13a, easterly flow from the combined CH and WPSH induced the EJ on the north side of the ITCZ, which is key to triggering heavy rainfall over the NSCS (Liu et al., 2010; Feng et al., 2015). However, the EJ also inhibits the northward movement of the ITCZ (Fig. 8), which is not conducive to the maintenance of heavy rainfall. On 1?2 October, the temperature, and vorticity gradients at 850 hPa over the NSCS decreased significantly owing to the reduction of geopotential height at 850 hPa between 110°–140°E by the CH moving to the east of 140°E and merging into the WPSH, which weakened the EJ (Sreekala et al., 2014; Feng et al., 2015; Figs. 13b and 13c). As a result, the ITCZ moved rapidly north (Fig. 2). Later, the local EJ increased due to the southward movement of a new CH (Fig. 13d) and the northward movement of the ITCZ also slowed (Fig. 2).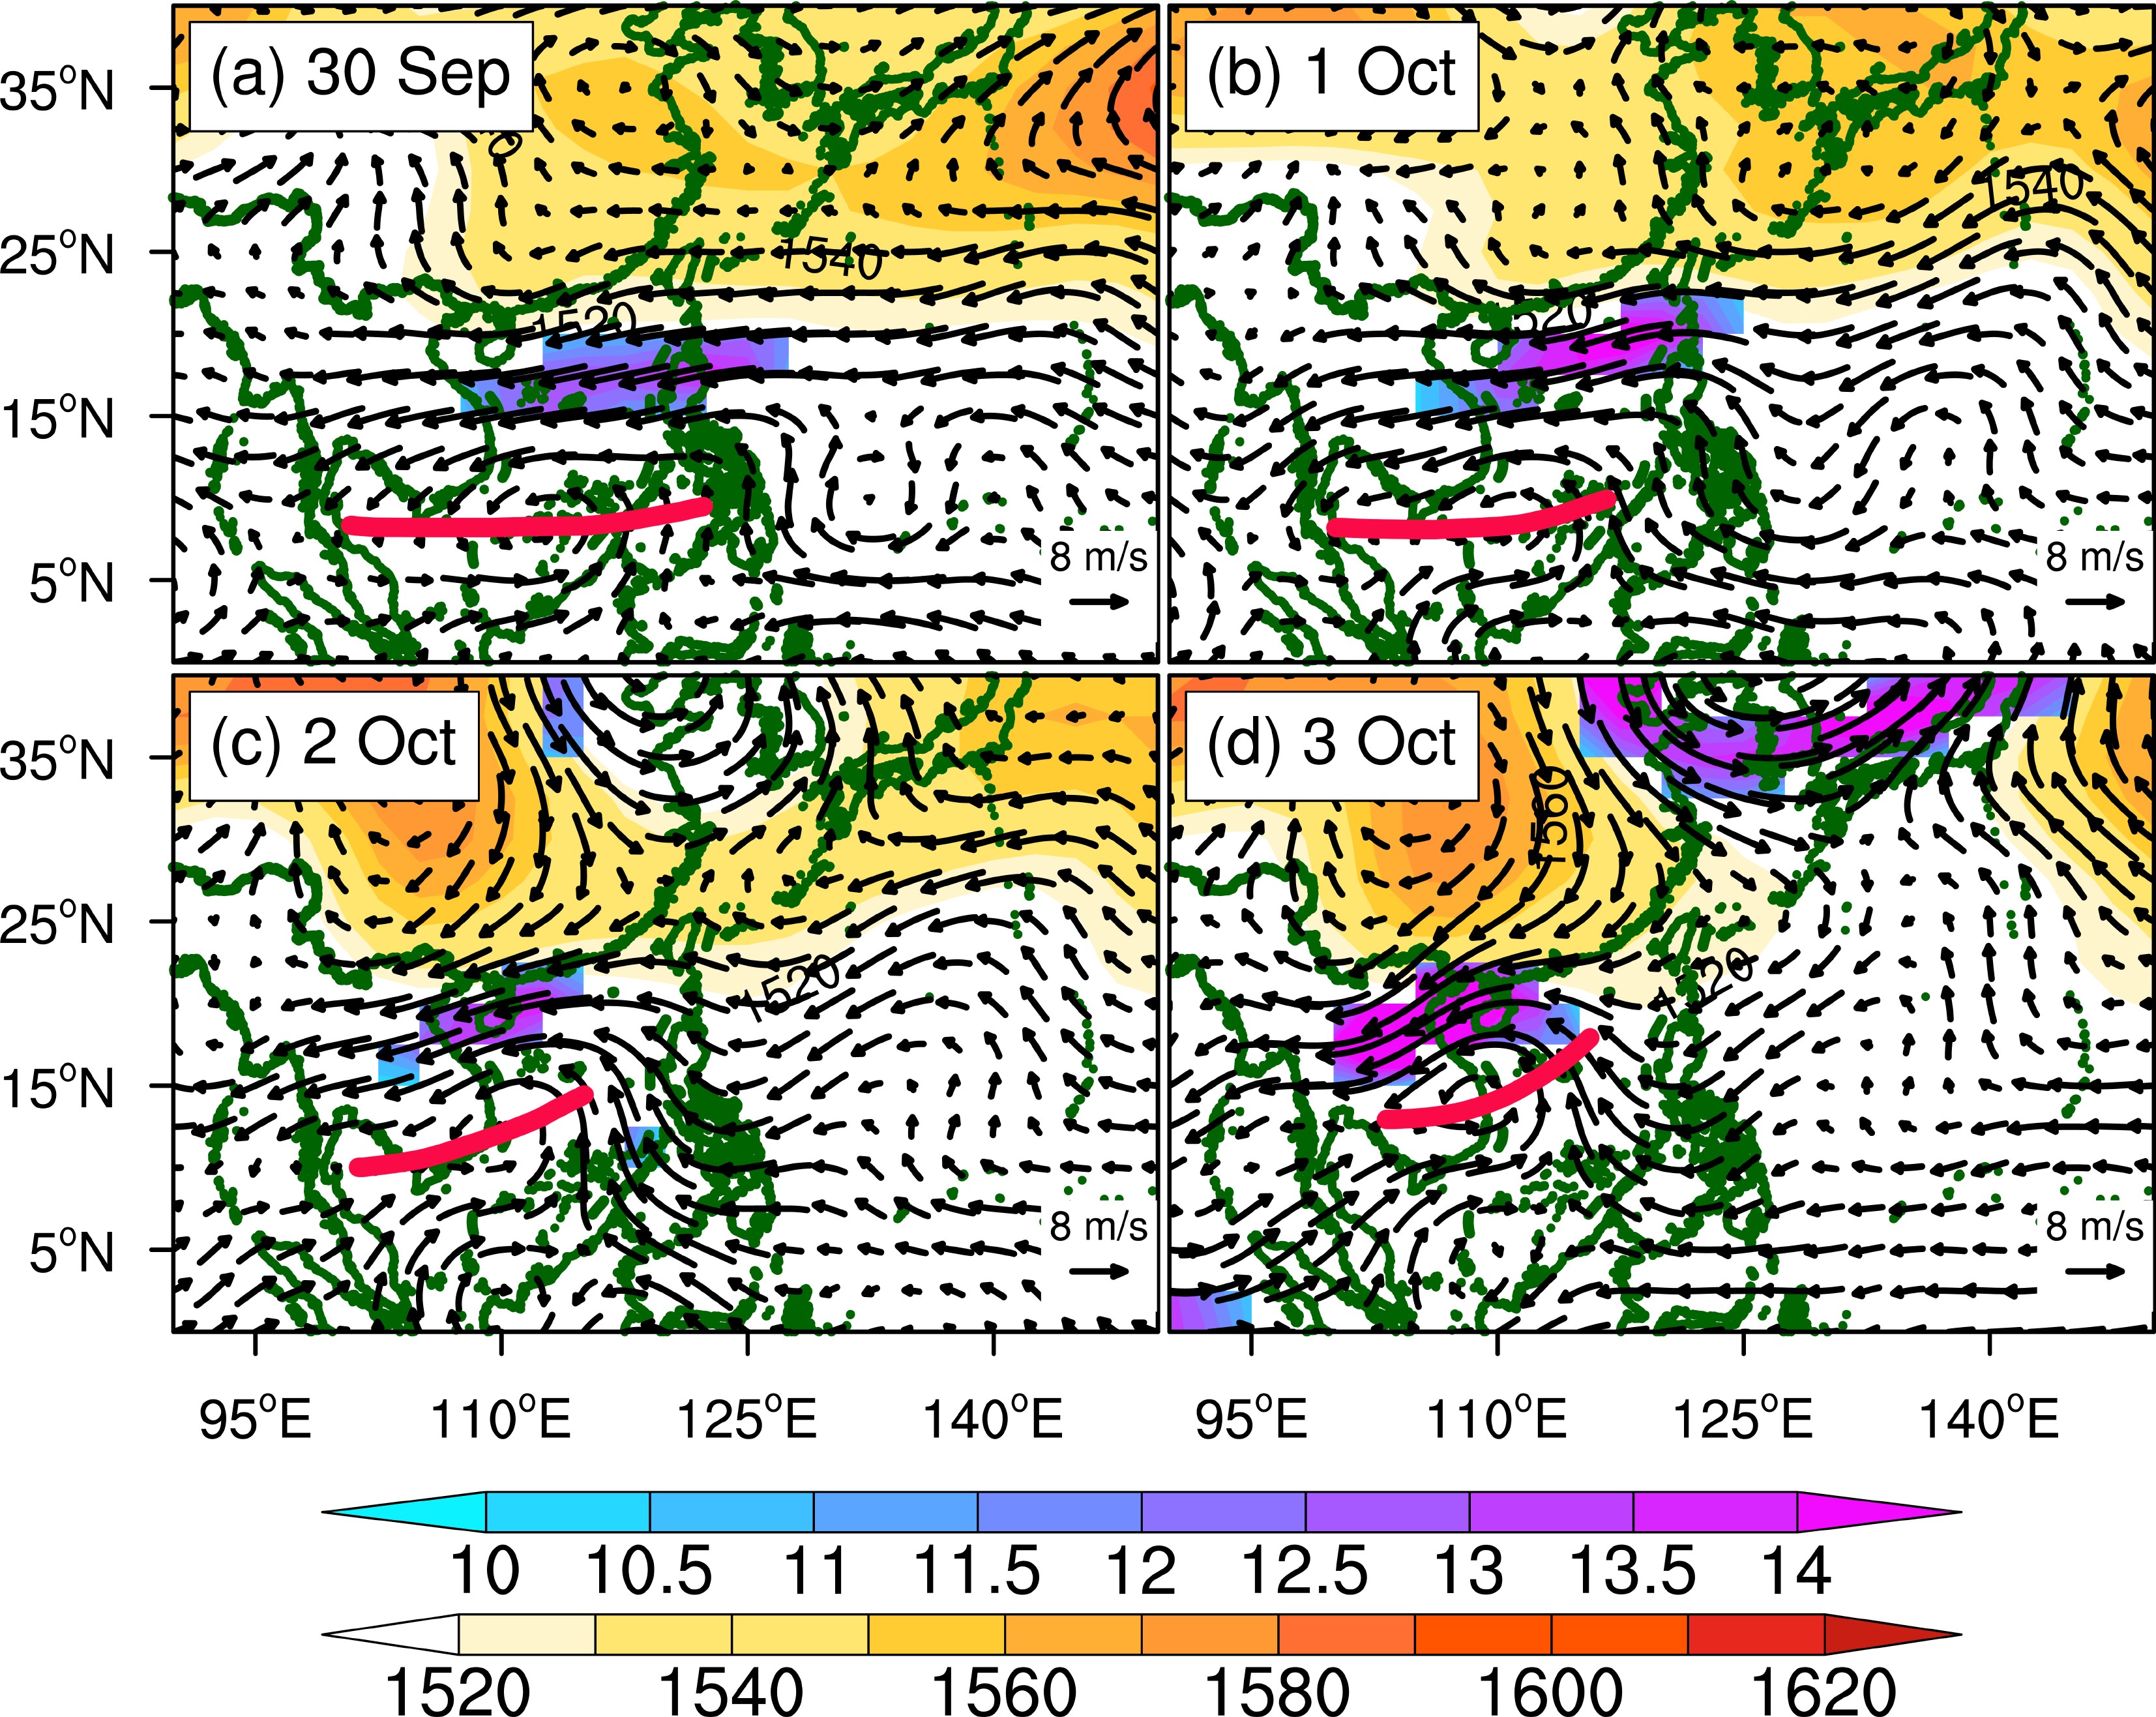 Figure13. The 850 hPa geopotential height (warm shading, only values greater than 1520 are shown; units: gpm), the jet (cold shading, only values greater than 10 are shown; units: m s–1), and wind (arrows; units: m s–1). (a)–(d) are 30 September and 1?3 October 2010, respectively. The red line represents the distribution of PITCZ in the SCS.
To further investigate the relationship between the EJ in the NSCS and PIITCZ, we calculated the correlation coefficient between the index of the EJ area (AIEJ) and intensity (IIEJ) and the PIITCZ. The number of grid points with a wind speed at 850 hPa greater than 10 m s–1 over the NSCS (15°–20°N, 110°–120°E) was defined as the AIEJ, and an average speed of more than 10 m s–1 was recorded as IIEJ. The correlation coefficient between PIITCZ and AIEJ was ?0.61 (above the 95% confidence level), whereas the correlation coefficient between PIITCZ and IIEJ was small. Therefore, the eastward movement of the CH and its subsequent merger into the WPSH at 850 hPa resulted in a decrease in the area of the EJ over the NSCS, which was conducive to the northward movement of the ITCZ. In contrast, the southerly movement of the new CH increased the area of the local EJ, and this limited the northward movement of the ITCZ during the third stage.
We also used multiple linear regression analysis between PIITCZ and the AIEJ, the southwesterly index (SWI), and the EE index (EEI) to further assess the contribution of each factor to PITCZ. The average zonal wind speeds in the regions 0°–10°N, 90°–110°E, and 0°–10°N, 120°–140°E were used to define the SWI and EEI indices, respectively. We obtained the multiple linear regression equation: RPIITCZ = 12.33 – 1.82 AIEJ + 1.33 EEI + 0.94 SWI. The correlation coefficient between RPIITCZ and the original PIITCZ was 0.82 (Fig. 14a). According to the partial regression coefficients, the reduced area of the EJ in the NSCS and increased strength of the EE contributed significantly to the northward movement of the ITCZ. We also found that the ITCZ moved north at its highest speed at about 1200 UTC on 1 October (Fig. 14a) and the EJ in the NSCS decreased during the same period, but the EE and southwesterly winds strengthened preceding the northward movement of the ITCZ by 6 and 12 hours, respectively (Fig. 14b).
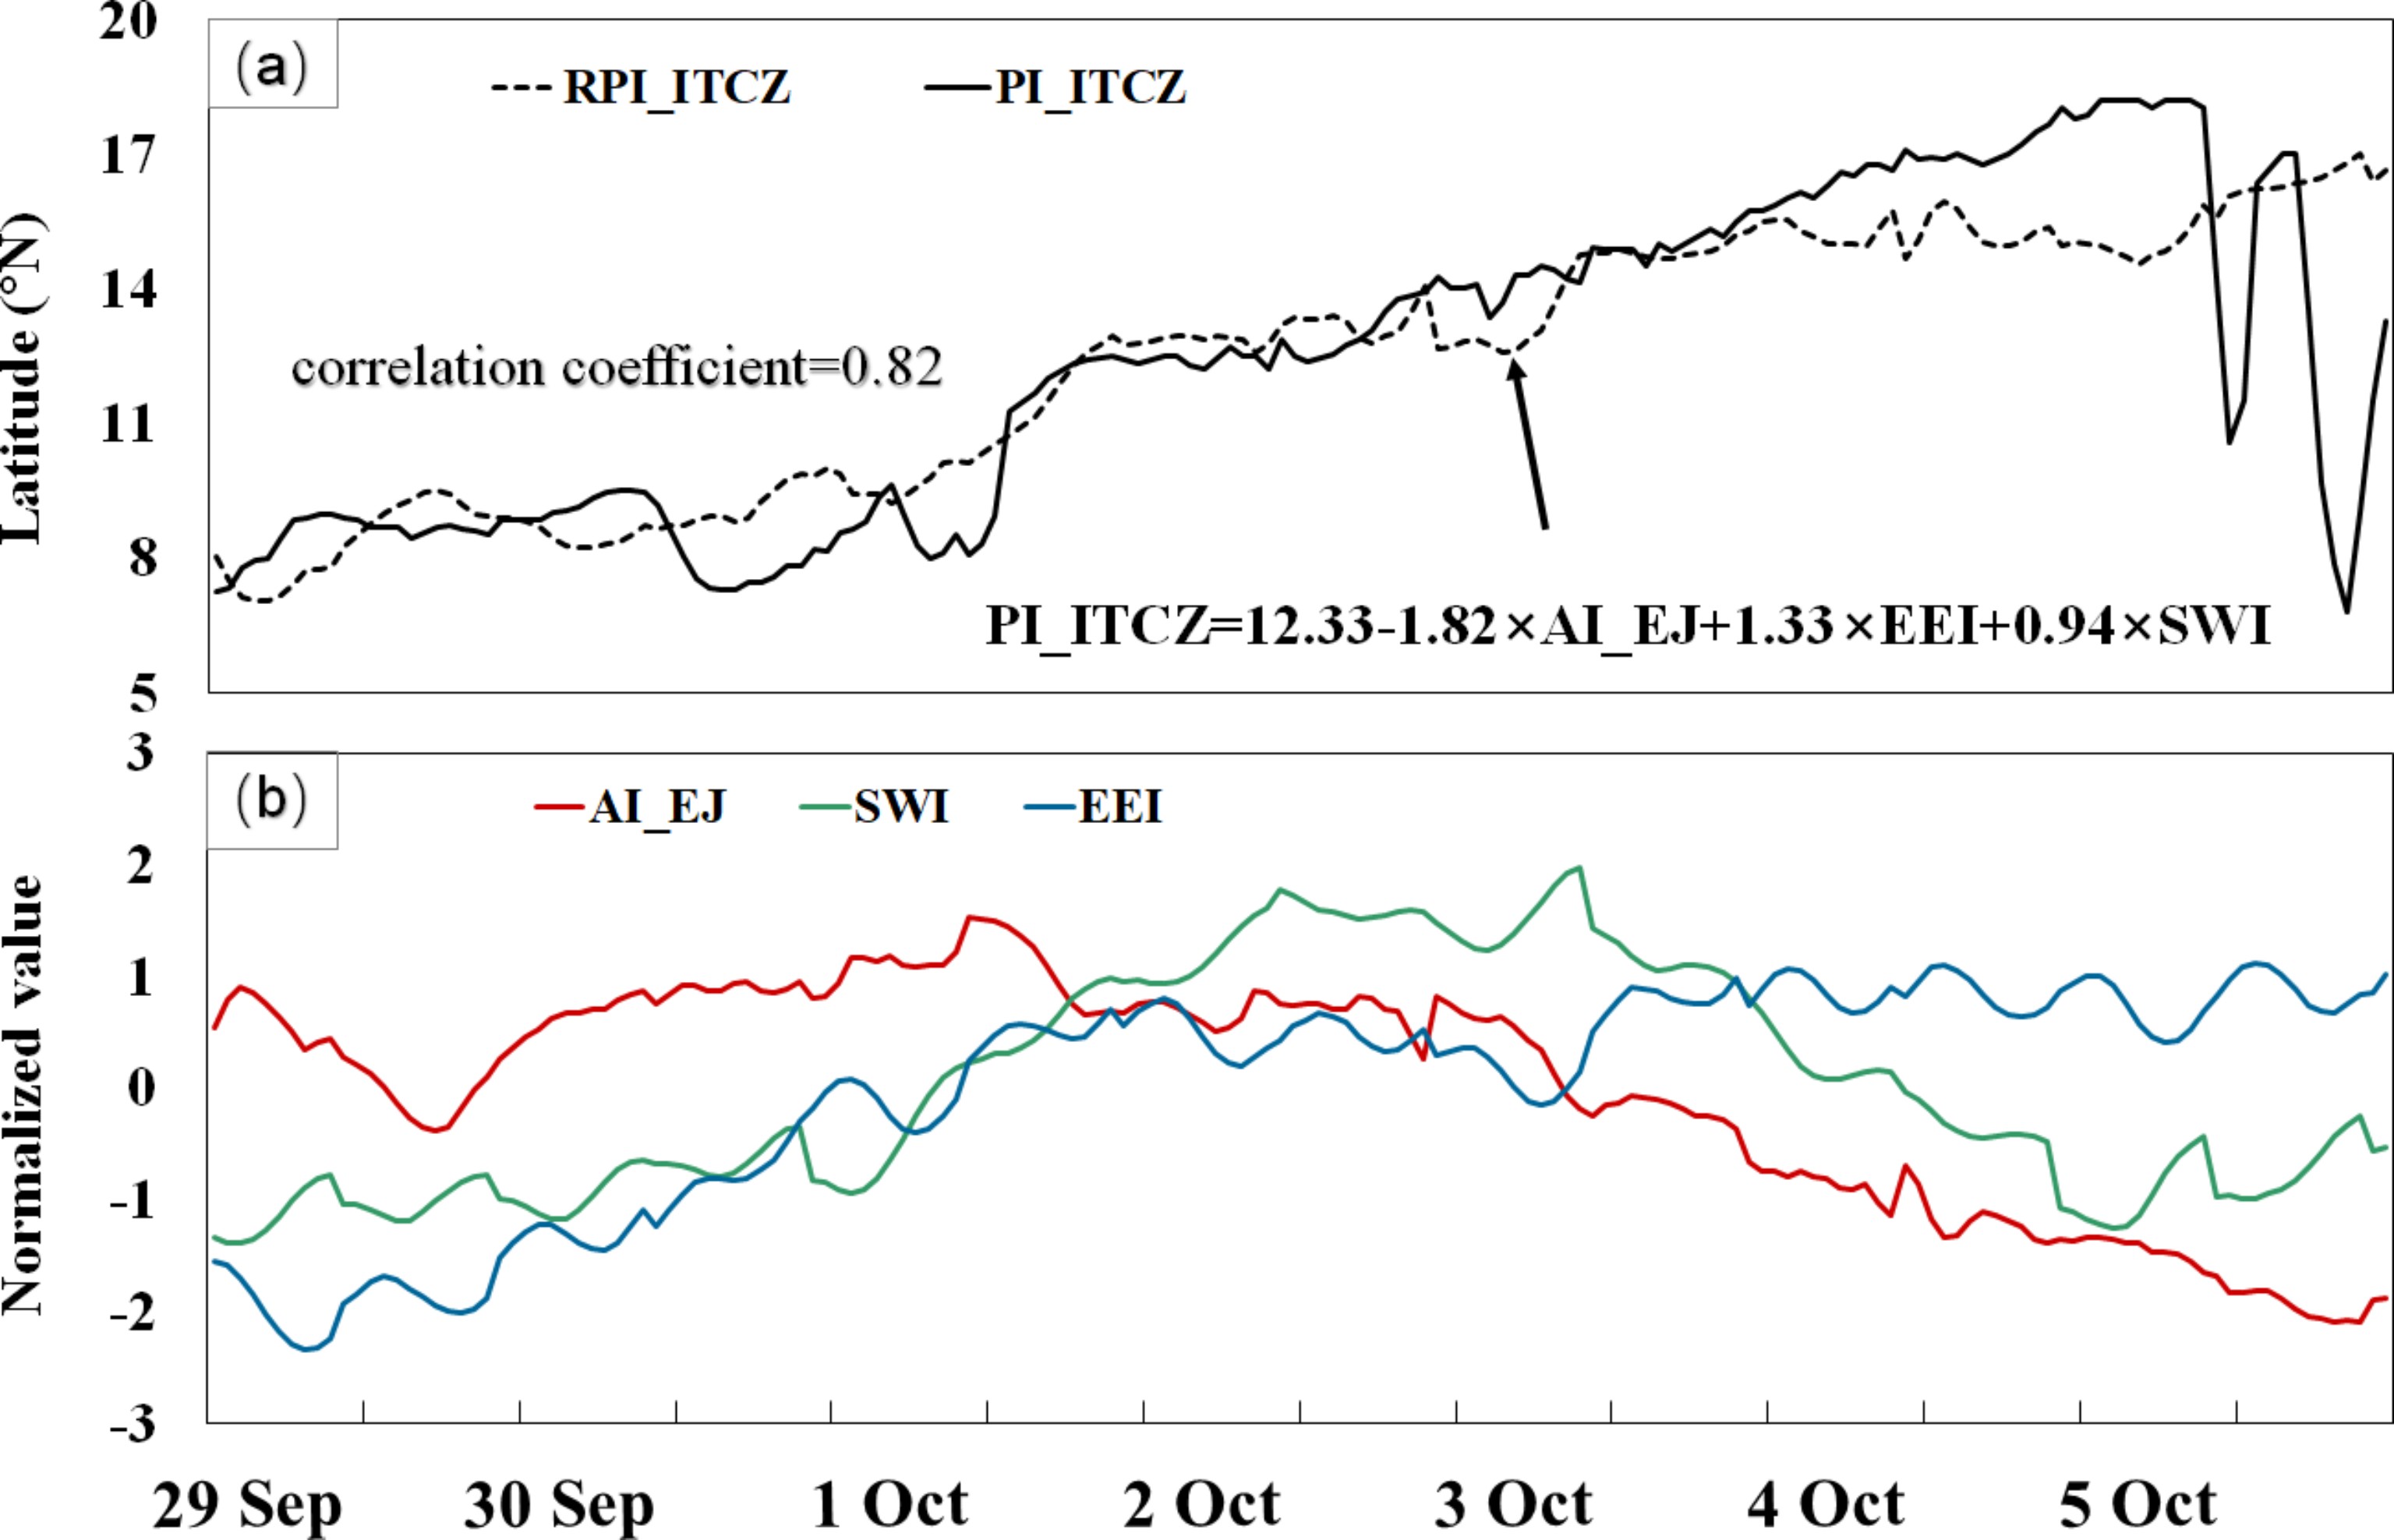 Figure14. Time series of (a) the original PIITCZ (solid) and multiple regression analysis (dashed), and the (b) AIEJ (red), EEI (blue), and SWI (green).
The appropriate position for the ITCZ to influence the NSCS was 12°N. As the ITCZ moved north to around 12°N, it transported moisture from the Bay of Bengal into the NSCS, intensified the dynamic field by transporting the positive vorticity both horizontally and vertically, and increased atmospheric instability after converging with the cold air carried by the CH. This set of circumstances provided favorable conditions for the development and maintenance of heavy rainfall.
The rapid northerly movement of the ITCZ was related to the EE, southwesterly winds, and EJ over the NSCS. Multiple linear regression analysis showed that the reduced area of the EJ in the NSCS and the increased strength of the EE were the two most important factors that drove the northward movement of the ITCZ. The strengthening of the EE preceded the rapid northward movement of the ITCZ by six hours. The strengthening of the EE could be attributed to the enhanced area of high pressure on the east side of Australia and the Walker circulation. The decrease in the EJ area in the NSCS was caused mainly by the eastward retreat and merger of the CH and the WPSH. Consequently, the variation of the area of the EJ over the NSCS and the EE may be the indicators that can be used to predict the movement of the ITCZ and heavy rainfall in the NSCS in autumn.
The contributions of different factors to the northward movement of the ITCZ may vary under different scenarios. However, the events associated with the northward movement of the ITCZ between 2008 and 2017 indicate that the impact of the EE and EJ in the NSCS upon the northward movement of ITCZ is well-defined, especially in La Ni?a years. This differs from our previous understanding of their effects on the ITCZ (i.e., the EE inhibits the development of the ITCZ and the EJ in the NSCS strengthens the ITCZ, Gao et al., 2011). In addition, these events demonstrate that the position where the ITCZ begins to affect the NSCS is about 12°N. Furthermore, in La Ni?a years, some larger-scale factors (e.g., the Madden-Julian Oscillation) may play important roles in non-TC precipitation over the NSCS caused by the northward movement of the ITCZ. We will consider these additional factors in a future study.
Acknowledgements. The research is supported by the Key Laboratory of South China Sea Meteorological Disaster Prevention and Mitigation of Hainan Province (Grant No. SCSF201906), the National Natural Science Foundation of China (Grant No. 41975008), and the Fundamental Research Funds for the Central Universities (Grant No. 201861003). The authors gratefully acknowledge NASA (
