HTML
--> --> -->
A series of investigations suggest that global warming has caused heavy EASR in past decades (e.g. Liu et al., 2016; Ma et al., 2017). It is also suggested that EASR will intensify in the future (Ding et al., 2007; Lu and Fu, 2010; Jiang and Fu, 2012; Chen and Sun, 2013; Seo and Ok, 2013; Seo et al., 2013; Kitoh, 2017; Wang et al., 2018). For example, Chen and Sun (2013) suggested that EASR would increase over nearly all of East Asia in the 21st century. The models of phases 3 and 5 of the Coupled Model Intercomparison Project (CMIP3 and CMIP5) project an increase of approximately 10%–20% in EASR toward the end of the 21st century (Seo and Ok, 2013; Seo et al., 2013). A stronger East Asian summer monsoon (Chen, 2013; Jiang and Tian, 2013; Kitoh, 2017) and increased atmospheric water vapor associated with global warming (Liu et al., 2016) are expected to contribute to a wetter East Asian summer climate in the future.
Additionally, the future interannual variability in EASR is expected to increase (Kripalani et al., 2007; Lu and Fu, 2010; Fu, 2013; Ren et al., 2019). By analyzing the simulation results of CMIP3 models, Lu and Fu (2010) found that interannual variability in EASR is projected to intensify by approximately 10%–17%. Ren et al. (2019) demonstrated that interannual variability in EASR would increase by approximately 20.8% and 26.2% under Representative Concentration Pathway 4.5 (RCP4.5) and 8.5 (RCP8.5), respectively. Furthermore, the interannual variability in EASR would intensify much more markedly in comparison with EASR climatology (Lu and Fu, 2010; Ren et al., 2019), suggesting a higher future probability of HRS.
Extreme summer precipitation is also projected to increase over East Asia (Ding et al., 2007; Chen, 2013; Zhou et al., 2014; Freychet et al., 2015; Li et al., 2016; Wang et al., 2017; Kamizawa and Takahashi, 2018; Zhao et al., 2019). For example, heavy rain events (> 50 mm d?1), maximum five-day precipitation, and annual total precipitation when daily precipitation >95th percentile (R95p) are projected to increase (Chen, 2013; Zhou et al., 2014; Zhao et al., 2019). Freychet et al. (2015) separated daily precipitation into percentiles and found an increase in extreme precipitation frequency of 35%–40% and in intensity of 10%–20%. Bador et al. (2018) also found the seasonal maximum daily precipitation amounts would intensify. At the same time, the seasonal timing of the most severe wet events would change little over East Asia at the end of the 21st century (Marelle et al. 2018; Zhan et al., 2020). These previous studies mainly focused on the seasonality or daily extreme precipitation events, however, which are generally independent and of short duration and cannot reflect the overall changes in EASR. We still have a paucity of knowledge about the projected changes in extreme (e.g., upper 10th percentile) summer-averaged East Asian rainfall. Therefore, the projected changes in the probability of occurrence of HRS will be analyzed in the present study.
Variation in large-scale water vapor transport (WVT) controls variation in EASR (Zhou and Yu, 2005; Lu et al., 2007; Chen and Huang, 2008; Sun and Ding, 2010; Freychet et al., 2015; Jiang et al., 2017; Sun et al., 2020). Anomalous rainfall is directly related to the moisture supply. The origins of WVT related to anomalous rainfall are different from those related to climatological rainfall (Zhou and Yu, 2005). In the context of global warming, the enhanced WVT to East Asia and the western North Pacific (WNP, Lu et al., 2007; Sun and Ding, 2010) and the intensified moisture flux convergence over the region (Seo et al., 2013; Freychet et al., 2015) contribute to increased EASR.
In the present paper, we first show the projected changes in the probability of EASR under RCP4.5 and RCP8.5. We then define a threshold for HRS and investigate the projected changes in HRS probability. Furthermore, we examine the changes in EASR and associated WVT. The organization of this paper is as follows. In section 2, the datasets and methods used in this study are described. The models’ performances in simulating the climatological EASR and WVT are evaluated in section 3. Section 4 shows the changes in EASR/WVT in climatology and HRS, respectively. The anomaly of EASR/WVT in historical climate simulation (HIST) and under RCPs are shown in section 5. Section 6 provides conclusions and discussions.
| Model | Country | Atmospheric Resolution (lon × lat) | |
| CMIP5 | BCC-CSM1.1 | China | ~2.8° × 2.8° |
| CCSM4 | USA | 1.25° × ~0.9° | |
| CanESM2 | Canada | ~2.8° × 2.8° | |
| CNRM-CM5 | France | ~1.4° × 1.4° | |
| CSIRO-MK3.6 | Australia | 1.875° × ~1.9° | |
| FGOALS-g2 | China | ~2.8° × 3.0–6.0° | |
| FGOALS-s2 | China | ~2.8° × 1.7° | |
| GFDL-CM3 | USA | 2.5° × 2.0° | |
| GFDL-ESM2G | USA | 2.5° × 1.5–2.0° | |
| GFDL-ESM2M | USA | 2.5° × 1.5–2.0° | |
| GISS-E2-H | USA | 2.5° × 2° | |
| GISS-E2-R | USA | 2.5° × 2° | |
| HadGEM2-CC | UK | 1.875° × 1.25° | |
| HadGEM2-ES | UK | 1.875° × 1.25° | |
| IPSL-CM5A-LR | France | 3.75° × ~1.9° | |
| MIROC5 | Japan | ~1.4° × 1.4° | |
| MIROC-ESM | Japan | ~2.8° × 2.8° | |
| MIROC-ESM-CHEM | Japan | ~2.8° × 2.8° | |
| MPI-ESM-LR | Germany | 1.875° × ~1.9° | |
| MRI-CGCM3 | Japan | 1.125° × ~1.1° | |
| NorESM1-M | Norway | 2.5° × ~1.9° | |
| CMIP6 | ACCESS-CM2 | Australia | 1.875° × 1.25° |
| ACCESS-ESM1-5 | Australia | 1.875° × 1.25° | |
| BCC-CSM2-MR | China | 1.125° × ~1.1° | |
| CNRM-CM6-1 | France | ~1.4° × 1.4° | |
| CNRM-ESM2-1 | France | ~1.4° × 1.4° | |
| EC-Earth3 | Europe | ~0.7° × 0.7° | |
| EC-Earth3-Veg | Europe | ~0.7° × 0.7° | |
| FGOALS-g3 | China | 2° × ~2°?5° | |
| GFDL-ESM4 | USA | 1.25° × 1° | |
| GISS-E2-1-G | USA | 2.5° × 2° | |
| INM-CM5-0 | Russia | 2° × 1.5° | |
| IPSL-CM6A-LR | France | 2.5° × ~1.3° | |
| MIROC-ES2L | Japan | 2.8125° × ~2.8° | |
| MIROC6 | Japan | ~1.4° × 1.4° | |
| MPI-ESM1-2-HR | Germany | ~0.9° × 0.9° | |
| MPI-ESM1-2-LR | Germany | 1.875° × ~2° | |
| MRI-ESM2-0 | Japan | 1.125° × ~1.1° | |
| NESM3 | China | 1.875° × ~1.9° | |
| NorESM2-MM | Norway | 1.25° × ~0.9° | |
| UKESM1-0-LL | UK | 1.875° × 1.25° |
Table1. Basic information of models used in this study.
The multimodel ensemble (MME) was obtained by simply averaging over the available models with equivalent weight because uncertainty exists among the different models even under the same greenhouse gases and aerosol forcing. The probability density function (PDF) and cumulative density function (CDF) were used to depict the probability. Two changes are defined in the present paper: First, projected changes in EASR and associated WVT in climatology and HRS (i.e., the difference in EASR/WVT between RCPs and HIST, EASR/WVTRCPs?EASR/WVTHIST); Second, the anomaly of EASR and associated WVT in HRS relative to those in climatology (i.e., EASR/WVTHRS?EASR/WVTCLM) in HIST and under RCPs.
To facilitate the quantitative estimation of precipitation, an EASR index (EASRI), defined as the June?July?August mean precipitation averaged over a parallelogram region determined by the following points: (25°N, 100°E), (35°N, 100°E), (30°N, 160°E), and (40°N, 160°E), was used to mimic the East Asian summer rainband, following Lu and Fu (2010). In addition, all abbreviations used in this study are alphabetically listed in Table 2.
| Abbreviation | Full Name |
| CDF | cumulative density function |
| EASR | East Asian summer (June?July?August) rainfall |
| HRS | heavy rainy summer |
| HIST | historical climate simulation |
| MME | multi-model ensemble |
| NSD | normalized standard deviation |
| probability density function | |
| RCP4.5 | Representative Concentration Pathway 4.5 |
| RCP8.5 | Representative Concentration Pathway 8.5 |
| RMSL | root mean square length |
| RMSVD | root mean square vector difference |
| SNP | subtropical North Pacific |
| TIO | tropical Indian Ocean |
| WNP | western North Pacific |
| WVT | water vapor transport |
| VSC | vector similarity coefficient |
Table2. An alphabetical list of abbreviations used in this study and their full names.
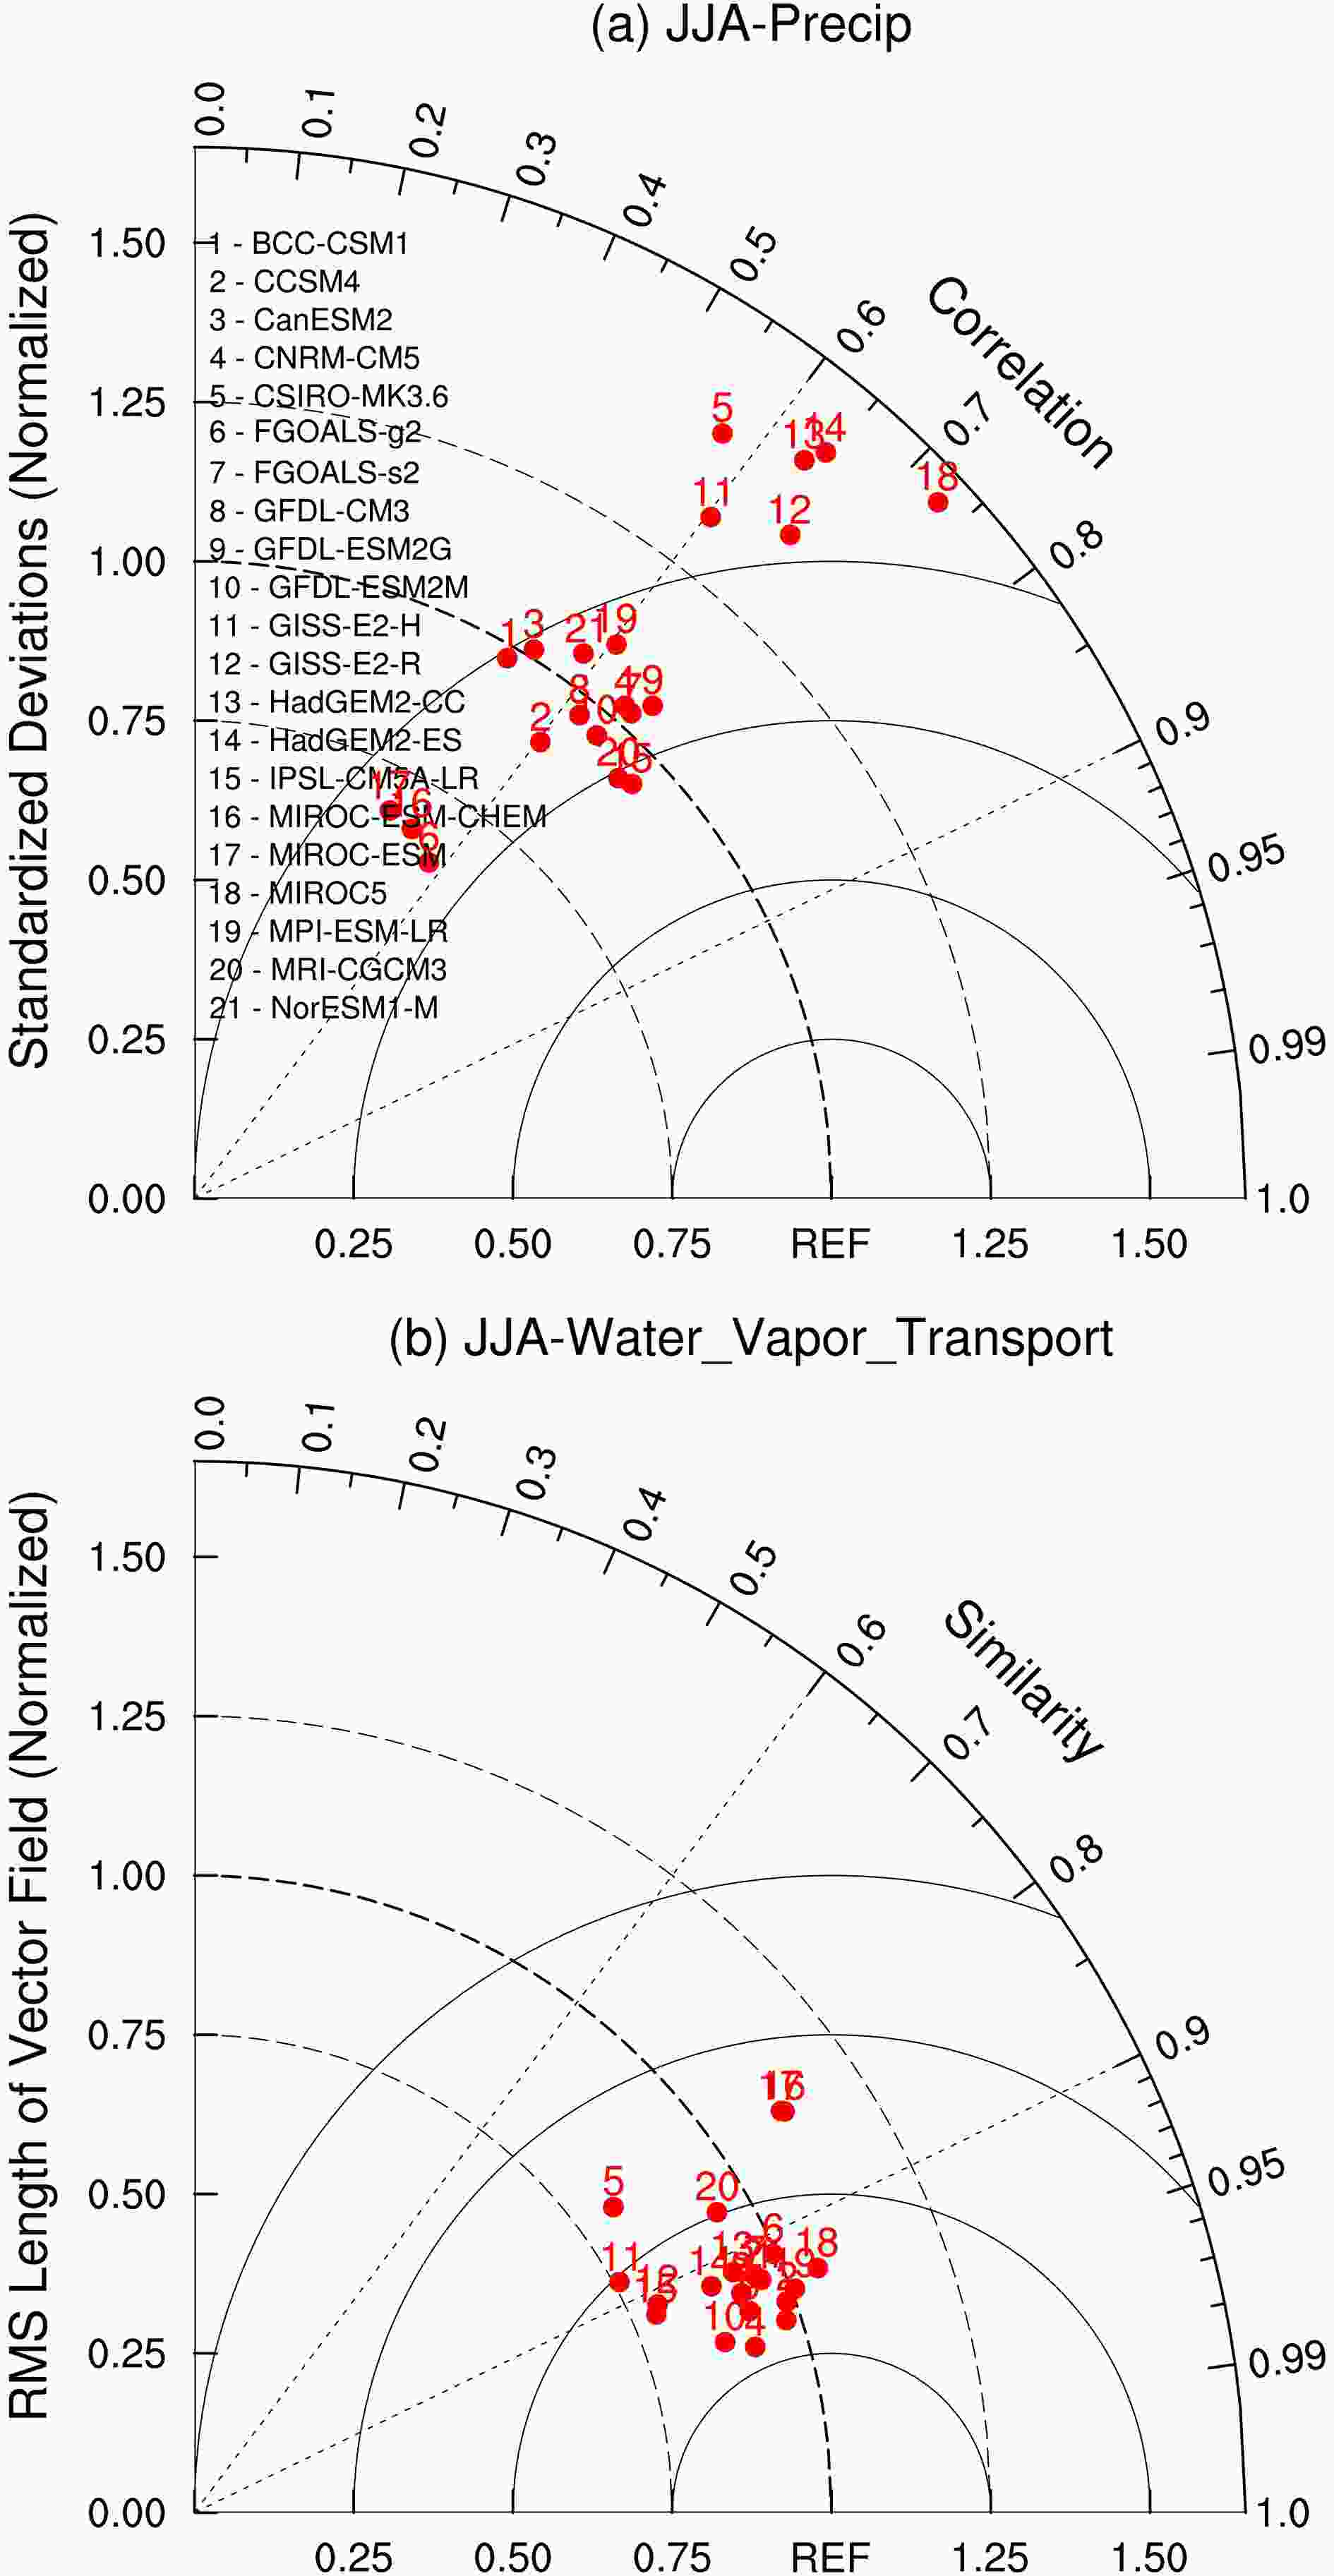 Figure1. (a) Taylor diagram of climatological summer precipitation over (20°–50°N, 100°–160°E) compared between the GPCP precipitation data and 21 CMIP5 model outputs during 1979–2005. (b) as in (a), but for the vector field evaluation diagram of water vapor transport over (20°S–50°N, 30°–180°E) between the NCEP reanalysis data and model outputs.
As mentioned before, the simulated precipitation variation strongly depends on how well models can simulate the variation in WVT. Thus, the simulated vertically integrated WVT over (20°S–50°N, 30°–180°E), which is associated with the moisture supply for EASR (Zhou and Yu, 2005), is further evaluated using a vector field evaluation diagram (Xu et al., 2016). The diagram is a generalized Taylor diagram and is used to evaluate the models’ skill in reproducing the vector field. The vector field evaluation diagram can measure how well two vector fields match each other in terms of three statistical variables: the vector similarity coefficient (VSC), root-mean-square length (RMSL), and root-mean-square vector difference (RMSVD). VSC can identify how close one vector field resembles another, and RMSL is used to measure the vector length. The third variable, RMSVD, is used to identify the magnitude of the overall difference between two vector fields.
The models perform better in simulating the WVT compared to simulating summer precipitation (Fig. 1b). A centralized distribution implies a smaller intermodel spread. Nearly all models (except CSIRO-MK3.6, GISS-E2-H, MIROC-ESM-CHEM, MIROC-ESM, and MRI-CGCM3) can reasonably capture the observed WVT field and have VSCs greater than 0.90. The RMSLs vary from 0.90 to 1.10 in 17 models, clearly suggesting that these model-simulated intensities resemble the observations well. The remaining four models (CSIRO-MK3.6, GISS-E2-H, GISS-E2-R, and IPSL-CM5A-LR) underestimate the RMSL. Additionally, the majority of models cluster within a range of RMSVDs of 0.25 to 0.50, which are close to the observations. Only four models (CSIRO-MK3.6, MIROC-ESM-CHEM, MIROC-ESM, and MRI-CGCM3) have RMSVDs greater than 0.50, indicative of relatively large overall differences. Therefore, 14 models (BCC-CSM1, CCSM4, CanESM2, CNRM-CM5, FGOALS-g2, FGOALS-s2, GFDL-CM3, GFDL-ESM2G, GFDL-ESM2M, HadGEM2-CC, HadGEM2-ES, MIROC5, MPI-ESM-LR, and NorESM1-M) have higher fidelity in reproducing the WVT field.
There are ten models (BCC-CSM1, CCSM4, CanESM2, CNRM-CM5, FGOALS-s2, GFDL-CM3, GFDL-ESM2G, GFDL-ESM2M, MPI-ESM-LR, and NorESM1-M) in the intersection between the two assessments, which have high fidelity in simulating not only the summer precipitation over East Asia and the WNP but also the associated WVT. The results indicate that these ten models reproduce the inherent controlling effect of WVT on EASR well. The consistency of simulated WVT and EASR in a model is the criterion used for distinguishing suitable from unsuitable models. Therefore, the outputs of these ten models are used in the following investigations.
4.1. Projected changes in the probability of EASR
The PDFs of EASRI in individual models are shown in Fig. 2. The projected PDFs of EASRI show clear changes under RCP4.5 and RCP8.5 compared to those in HIST. We calculated the mean EASR, EASR with the highest probability, and standard deviation of EASR in HIST and under RCP4.5 and RCP8.5, as well as changes under RCPs relative to HIST, respectively (Table 3). First, the mean value of EASR would increase by approximately 4%–12% under RCP4.5 and by 9%–18% under RCP8.5 in nearly all models. Second, the projected change in EASR with the highest probability is analyzed, given the PDF curves are not standard normal distributions and thus the EASR with the highest probability does not equal the mean value of EASR in the individual models. It is found that the EASR with the highest probability would intensify in all models (except GFDL-ESM2M). Particularly, CCSM4 and FGOALS-s2 project the strongest increase, with increase ratios of approximately 14% (16%) and 14% (22%) under RCP4.5 (RCP8.5), respectively. As to the standard deviation, it would increase by more than 20% in most models, indicating a larger spread of EASR intensity in the 21st century. All results lead to evident rightward shift and extensions of the PDF curves. These suggest that strong precipitation events as defined by the standard of the 20th century would become normal events and happen more frequently in the 21st century, and heavy precipitation intensity would be strengthened greatly. The HRS would likely occur frequently in the 21st century. At the same time, the probability of weak precipitation would decrease slightly.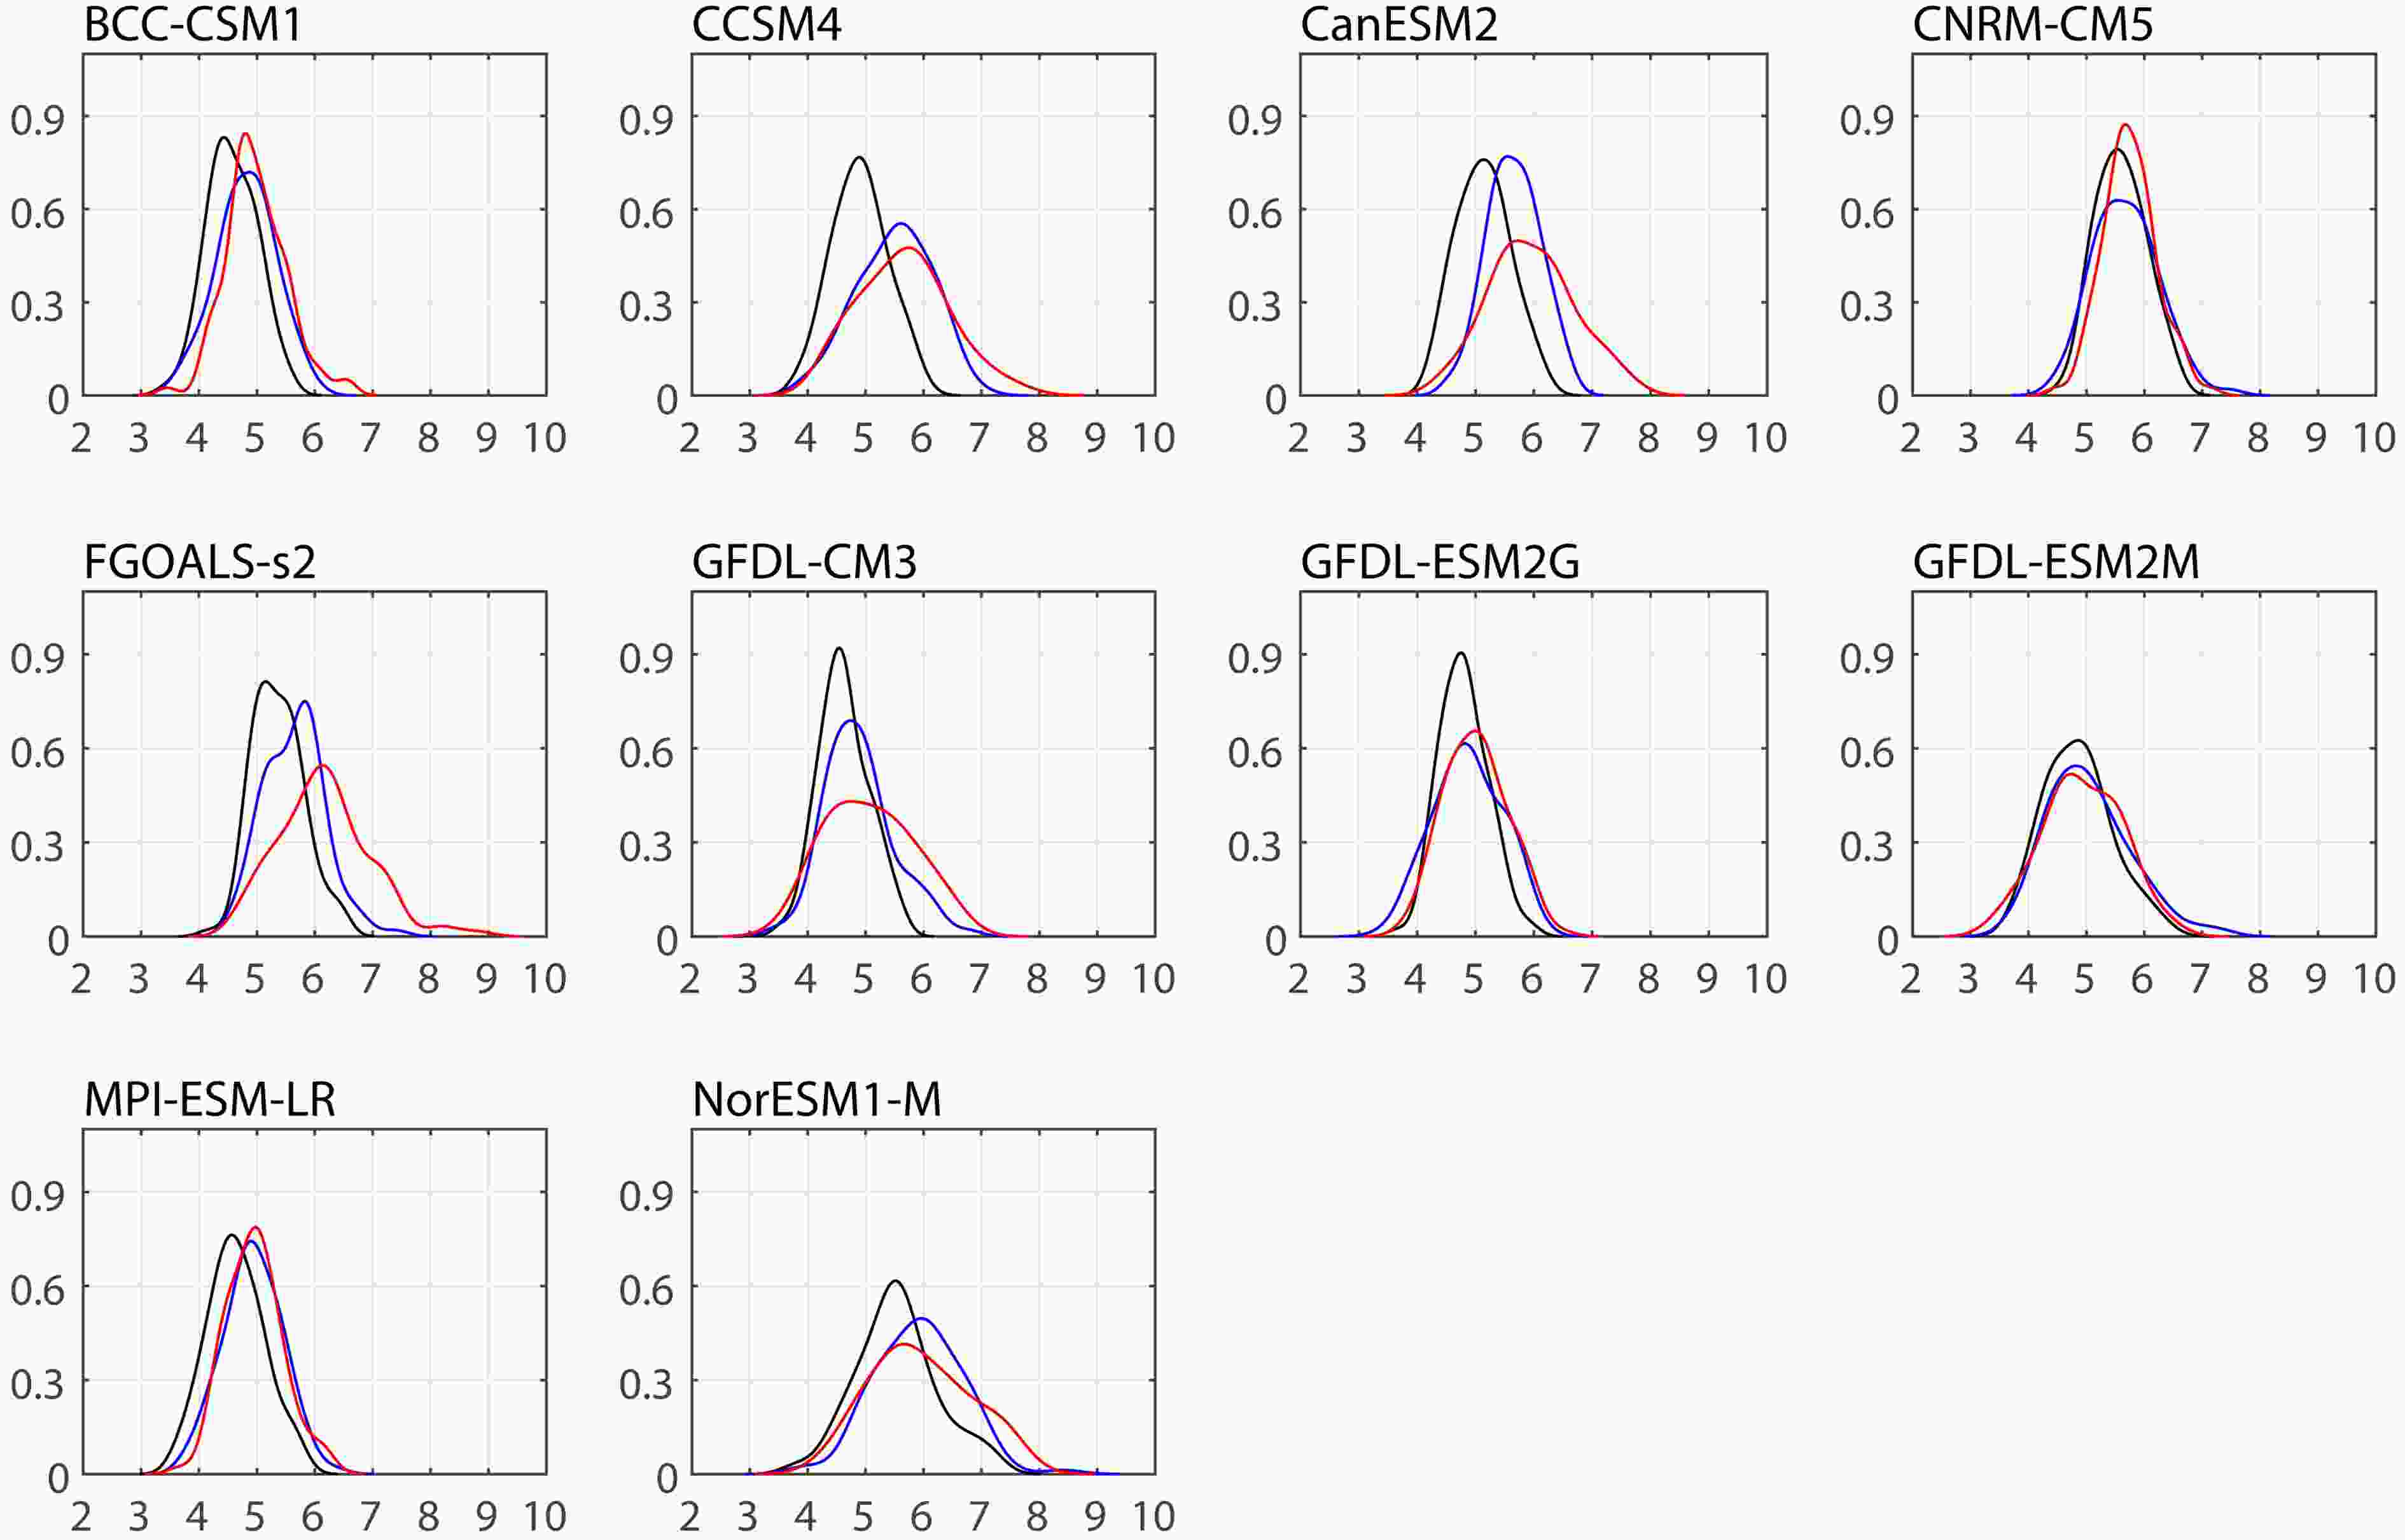 Figure2. PDFs of EASRI in HIST (black line), under RCP4.5 (blue line), and under RCP8.5 (red line) in individual models. The ordinate shows the PDF and the abscissa shows the intensity of EASR (units: mm d?1).
| Model | Mean | Highest Probability | Standard Deviation | ||||||||
| HIST | RCP4.5 | RCP8.5 | HIST | RCP4.5 | RCP8.5 | HIST | RCP4.5 | RCP8.5 | |||
| BCC-CSM1 | 4.6 | 4.8 (4%) | 5.0 (9%) | 4.4 | 4.9 (11%) | 4.8 (9%) | 0.4 | 0.5 (25%) | 0.5 (25%) | ||
| CanESM2 | 4.9 | 5.5 (12%) | 5.7 (16%) | 4.9 | 5.6 (14%) | 5.7 (16%) | 0.5 | 0.6 (20%) | 0.8 (60%) | ||
| CCSM4 | 5.1 | 5.7 (12%) | 6.0 (18%) | 5.1 | 5.5 (8%) | 5.7 (12%) | 0.5 | 0.5 (0%) | 0.7 (40%) | ||
| CNRM-CM5 | 5.6 | 5.7 (2%) | 5.7 (2%) | 5.5 | 5.6 (2%) | 5.7 (4%) | 0.4 | 0.6 (50%) | 0.5 (25%) | ||
| FGOALS-s2 | 5.4 | 5.6 (4%) | 6.2 (15%) | 5.1 | 5.8 (14%) | 6.2 (22%) | 0.4 | 0.5 (25%) | 0.8 (100%) | ||
| GFDL-CM3 | 4.6 | 4.9 (7%) | 5.1 (11%) | 4.5 | 4.7 (4%) | 4.7 (4%) | 0.4 | 0.6 (50%) | 0.7 (75%) | ||
| GFDL-ESM2G | 4.8 | 4.9 (2%) | 5.0 (4%) | 4.7 | 4.8 (2%) | 5.0 (6%) | 0.4 | 0.6 (50%) | 0.5 (25%) | ||
| GFDL-ESM2M | 4.9 | 5.0 (2%) | 4.9 (0%) | 4.8 | 4.8 (0%) | 4.7 (-2%) | 0.6 | 0.7 (17%) | 0.7 (17%) | ||
| MPI-ESM-LR | 4.6 | 4.9 (7%) | 5.0 (9%) | 4.6 | 4.9 (7%) | 5.0 (9%) | 0.5 | 0.5 (0%) | 0.5 (0%) | ||
| NorESM1-M | 5.5 | 5.9 (7%) | 6.0 (9%) | 5.5 | 6.0 (9%) | 5.6 (2%) | 0.7 | 0.7 (0%) | 0.9 (29%) | ||
Table3. The mean EASR, EASR with the highest probability, and standard deviation of EASR in HIST and under RCP4.5 and RCP8.5 (mm d?1). The values in brackets are the relative changes under RCPs relative to HIST, [100 × (RCP?HIST)/HIST]%.
The CDFs of EASRI further suggest a much greater probability of heavy summer rainfall (Fig. 3). The projected CDFs are positioned to the right of historical CDFs in all models. We calculated the projected changes in probability of the 1998-equivalent EASR (Table 4). In 1998, the EASR was 7.6 mm d?1 in GPCP, and the corresponding CDF of EASR greater than or equal to this value is 2%. For the individual CMIP5 models, we first calculated the historical EASR with the CDF of 2% and then the cumulative probability of projected EASR greater than or equal to the historical EASR in the 21st century. Under RCP4.5, the CDF of EASR greater than or equal to the historical threshold would increase to 5%–25% from 2% in HIST in individual models. Under RCP8.5, it would increase to greater than 11%–38% in seven out of ten models.
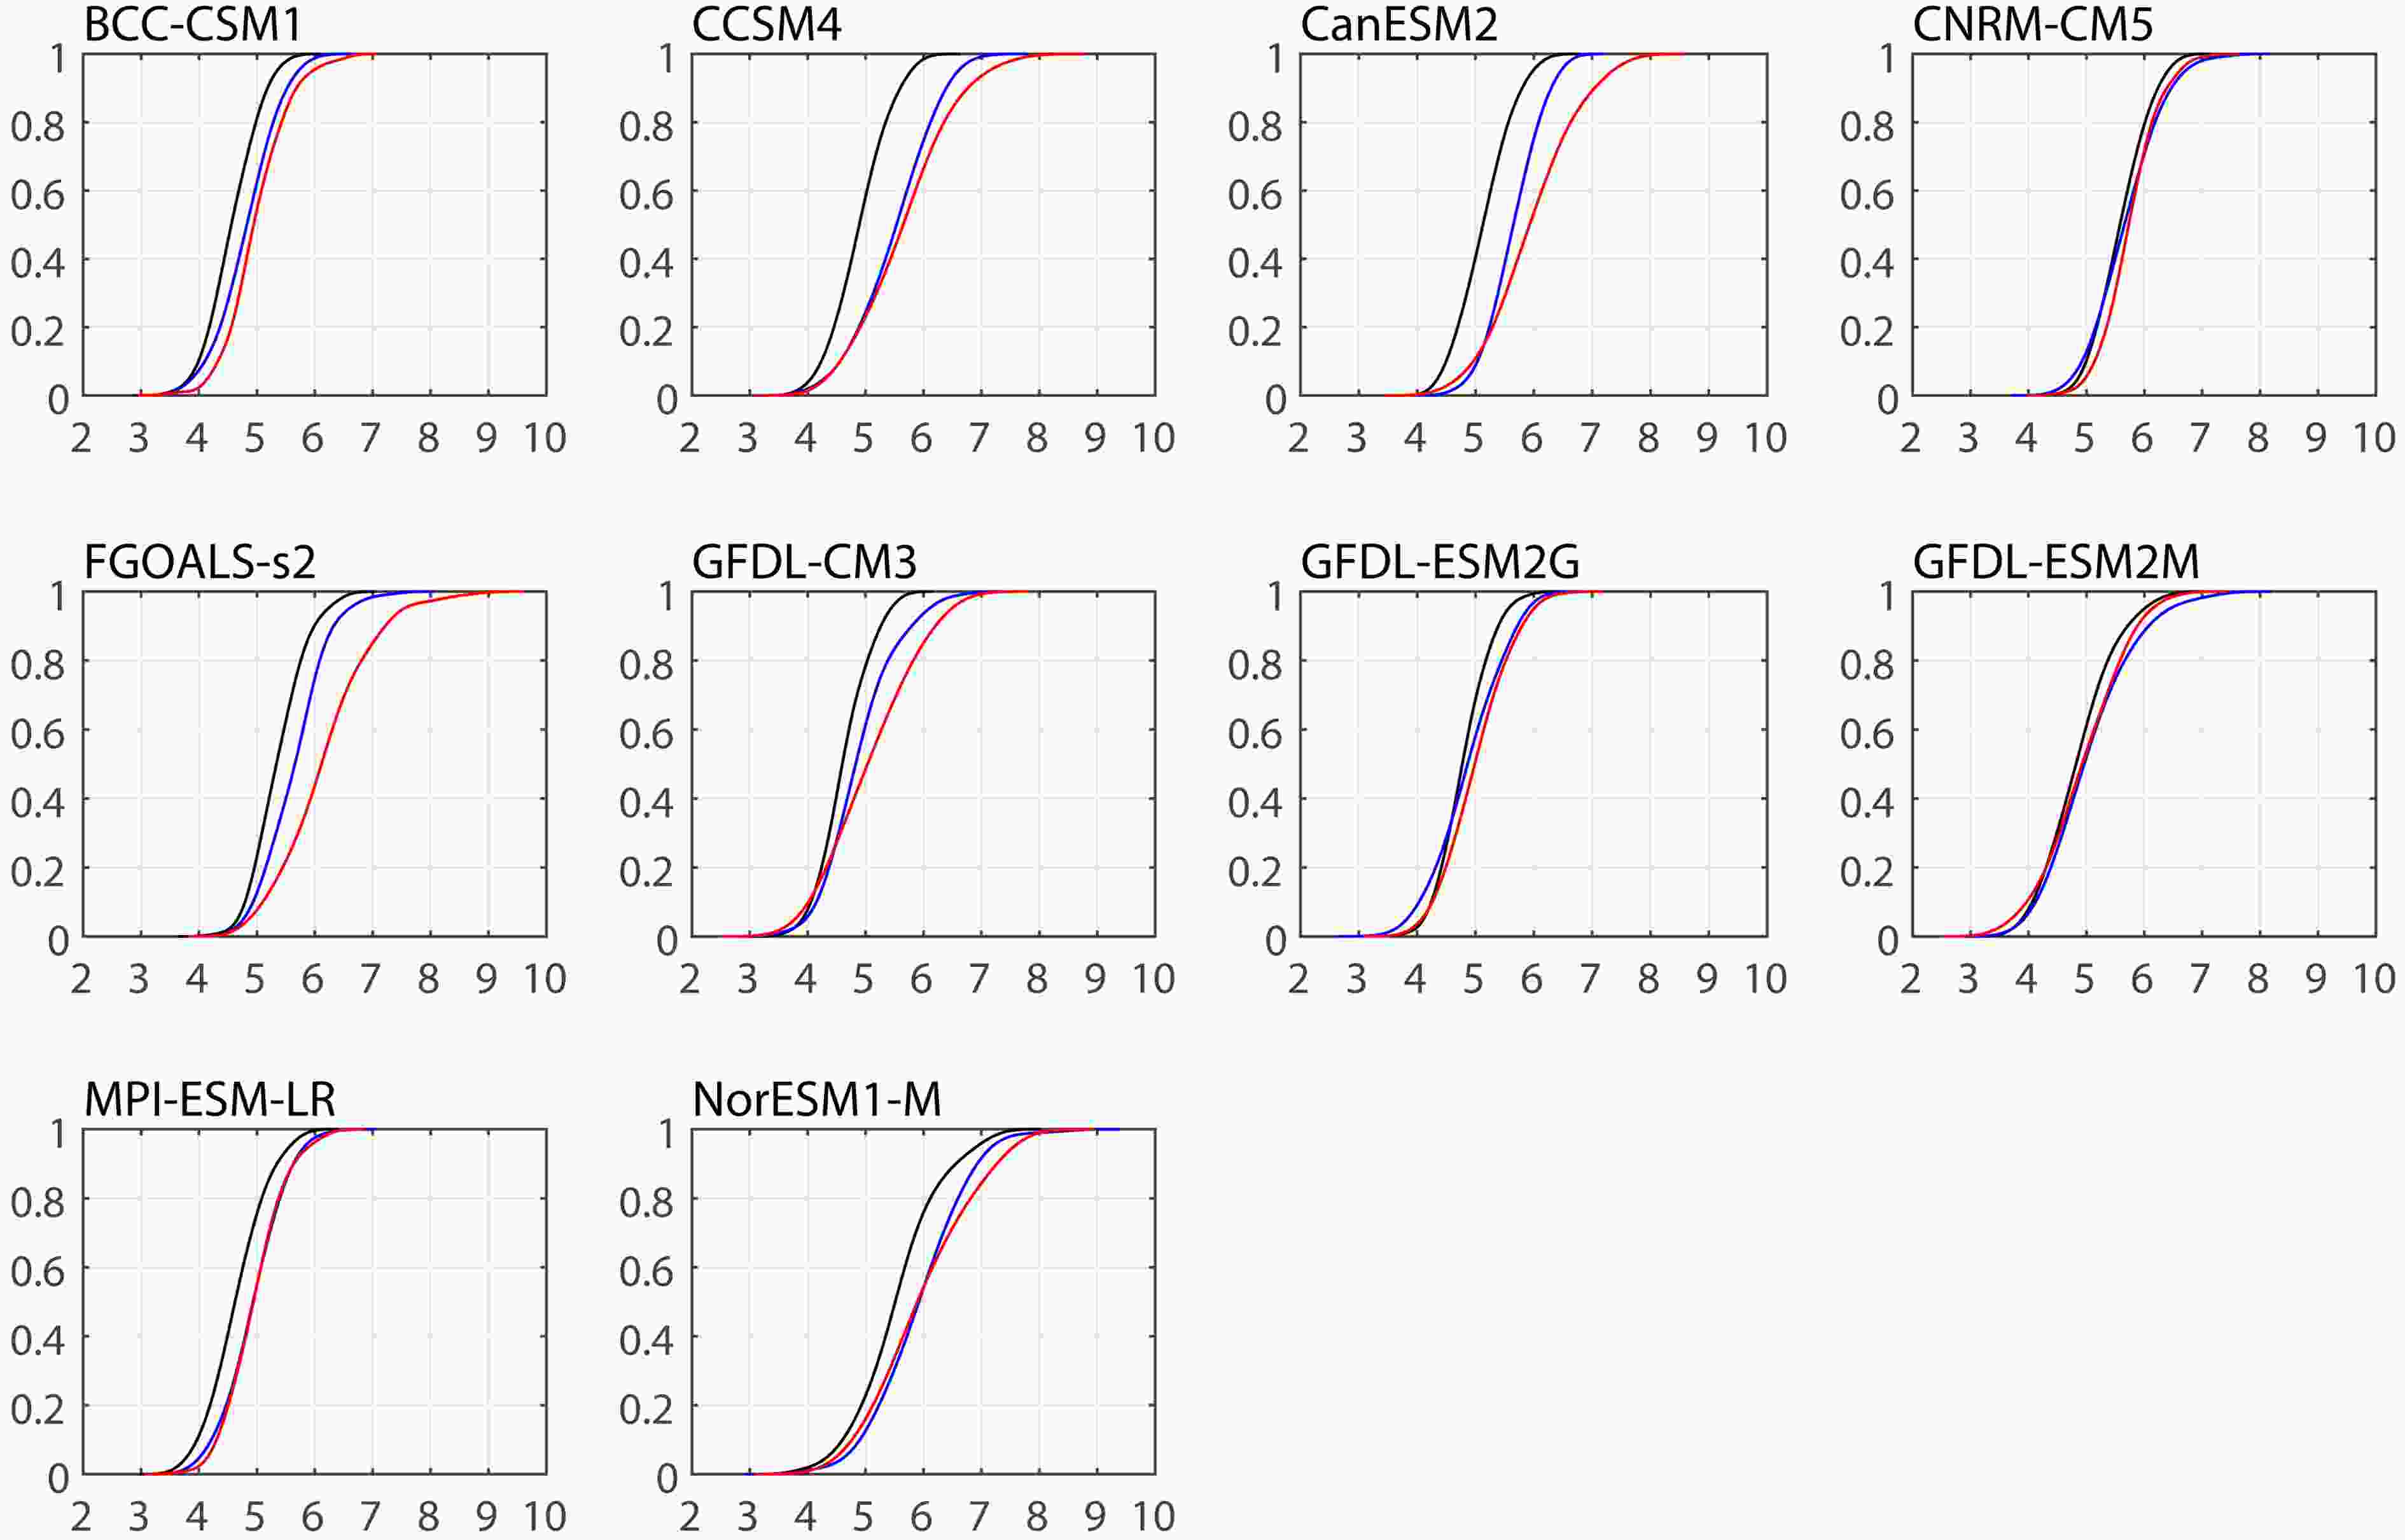 Figure3. As in Fig. 2, but for CDFs in individual models. The ordinate shows the CDF and the abscissa shows the intensity of EASR (units: mm d?1).
| Model | EASR in HIST | RCP4.5 | RCP8.5 |
| BCC-CSM1 | 5.5 | 11% | 17% |
| CanESM2 | 6.1 | 16% | 38% |
| CCSM4 | 6.0 | 25% | 33% |
| CNRM-CM5 | 6.6 | 8% | 6% |
| FGOALS-s2 | 6.5 | 7% | 33% |
| GFDL-CM3 | 5.6 | 14% | 29% |
| GFDL-ESM2G | 5.7 | 9% | 12% |
| GFDL-ESM2M | 6.2 | 7% | 4% |
| MPI-ESM-LR | 5.7 | 7% | 8% |
| NorESM1-M | 7.2 | 5% | 11% |
Table4. The historical 1998-equivalent EASR in models (mm d?1) and projected cumulative probability of EASR greater than or equal to the historical threshold under RCP4.5 and RCP8.5.
Furthermore, considering the availability of fewer samples in the context of a CDF of 2%, we defined the upper 10th percentile CDF of EASR as the threshold of HRS in order to facilitate the following investigation. Taking BCC-CSM1 as an example, when EASR are greater than or equal to 5.2 mm d?1 in HIST, their cumulative probability is 10%. The same probability corresponds to an EASR of 5.5 mm d?1 under RCP4.5, while the cumulative probability of the EASR greater than or equal to 5.2 mm d?1 is approximately 25% under RCP4.5, much higher than 10% in HIST. The CDF curve shifts rightward more evidently under RCP8.5. These projected changes in the cumulative probability of HRS that are greater than or equal to the historical threshold are calculated in individual models (Table 5). In comparison with a value of 10% in HIST, the probability would increase to greater than approximately 20% (30%) under RCP4.5 (RCP8.5) in most models. The projected cumulative probability would even increase to approximately 47% in CanESM2 under RCP4.5 and approximately 57% in FGOALS-s2 under RCP8.5.
| Model | RCP4.5 | RCP8.5 |
| BCC-CSM1 | 25% | 32% |
| CanESM2 | 47% | 51% |
| CCSM4 | 38% | 54% |
| CNRM-CM5 | 18% | 14% |
| FGOALS-s2 | 25% | 57% |
| GFDL-CM3 | 25% | 40% |
| GFDL-ESM2G | 23% | 26% |
| GFDL-ESM2M | 18% | 14% |
| MPI-ESM-LR | 22% | 21% |
| NorESM1-M | 23% | 28% |
Table5. The projected cumulative probability of EASR in HRS greater than or equal to the historical threshold under RCP4.5 and RCP8.5.
We also defined the lower 10th percentile CDF of EASR as the threshold of drought events and calculated the projected changes in their cumulative probability in individual models (Table 6). The results show that in nearly all models, the cumulative probability would decrease to approximately 5%–7% under RCP4.5 and 3%–6% under RCP8.5 from the value of 10% in HIST, indicative of an opposite trend in comparison with that for HRS. Therefore, there would be less probability of drought events in the future.
| Model | RCP4.5 | RCP8.5 |
| BCC-CSM1 | 7% | 2% |
| CanESM2 | 5% | 4% |
| CCSM4 | 1% | 3% |
| CNRM-CM5 | 12% | 6% |
| FGOALS-s2 | 5% | 4% |
| GFDL-CM3 | 7% | 12% |
| GFDL-ESM2G | 18% | 9% |
| GFDL-ESM2M | 9% | 13% |
| MPI-ESM-LR | 4% | 2% |
| NorESM1-M | 5% | 6% |
Table6. The projected cumulative probability of drought events less than or equal to the historical threshold under RCP4.5 and RCP8.5.
2
4.2. Projected changes in EASR in climatology and HRS
The former subsection shows that the probability of HRS would increase remarkably in the 21st century. Therefore, in this subsection, we focus on the projected changes in EASR in HRS. We also examine the projected changes in EASR climatology as a comparison. Considering that there are approximately 100-year simulations in HIST and under RCP4.5 and RCP8.5, the ten summers with strongest precipitation in each experiment are picked as HRS samples with cumulative probabilities of 10%.We first calculate the projected changes in climatological summer precipitation under RCP4.5 and RCP8.5 relative to HIST (EASRRCPs?EASRHIST, Figs. 4a and b). Under RCP4.5, summer precipitation climatology would intensify by approximately 0.3 mm d?1 over the East Asian summer rainband (Fig. 4a). The intensification is stronger under RCP8.5, with a maximum increase of greater than 0.7 mm d?1. The EASRI is approximately 5.0 mm d?1 in HIST and would increase to 5.3 mm d?1 and 5.4 mm d?1 under RCP4.5 and RCP8.5, respectively, with increase ratios of 6% and 8%. Notably, the summer precipitation intensifies mainly over the eastern summer rainfall belt that is east of approximately 125°E, but changes are relatively weak over the land region. Under RCP4.5 (RCP8.5), the climatological summer precipitation increases approximately 0.1 mm d?1 (0.1 mm d?1) over the land region and 0.4 mm d?1 (0.6 mm d?1) over the ocean region. This pattern is consistent with that in previous studies (e.g., Seo et al., 2013; Wang et al., 2018). At the same time, summer precipitation climatology would also increase over the WNP.
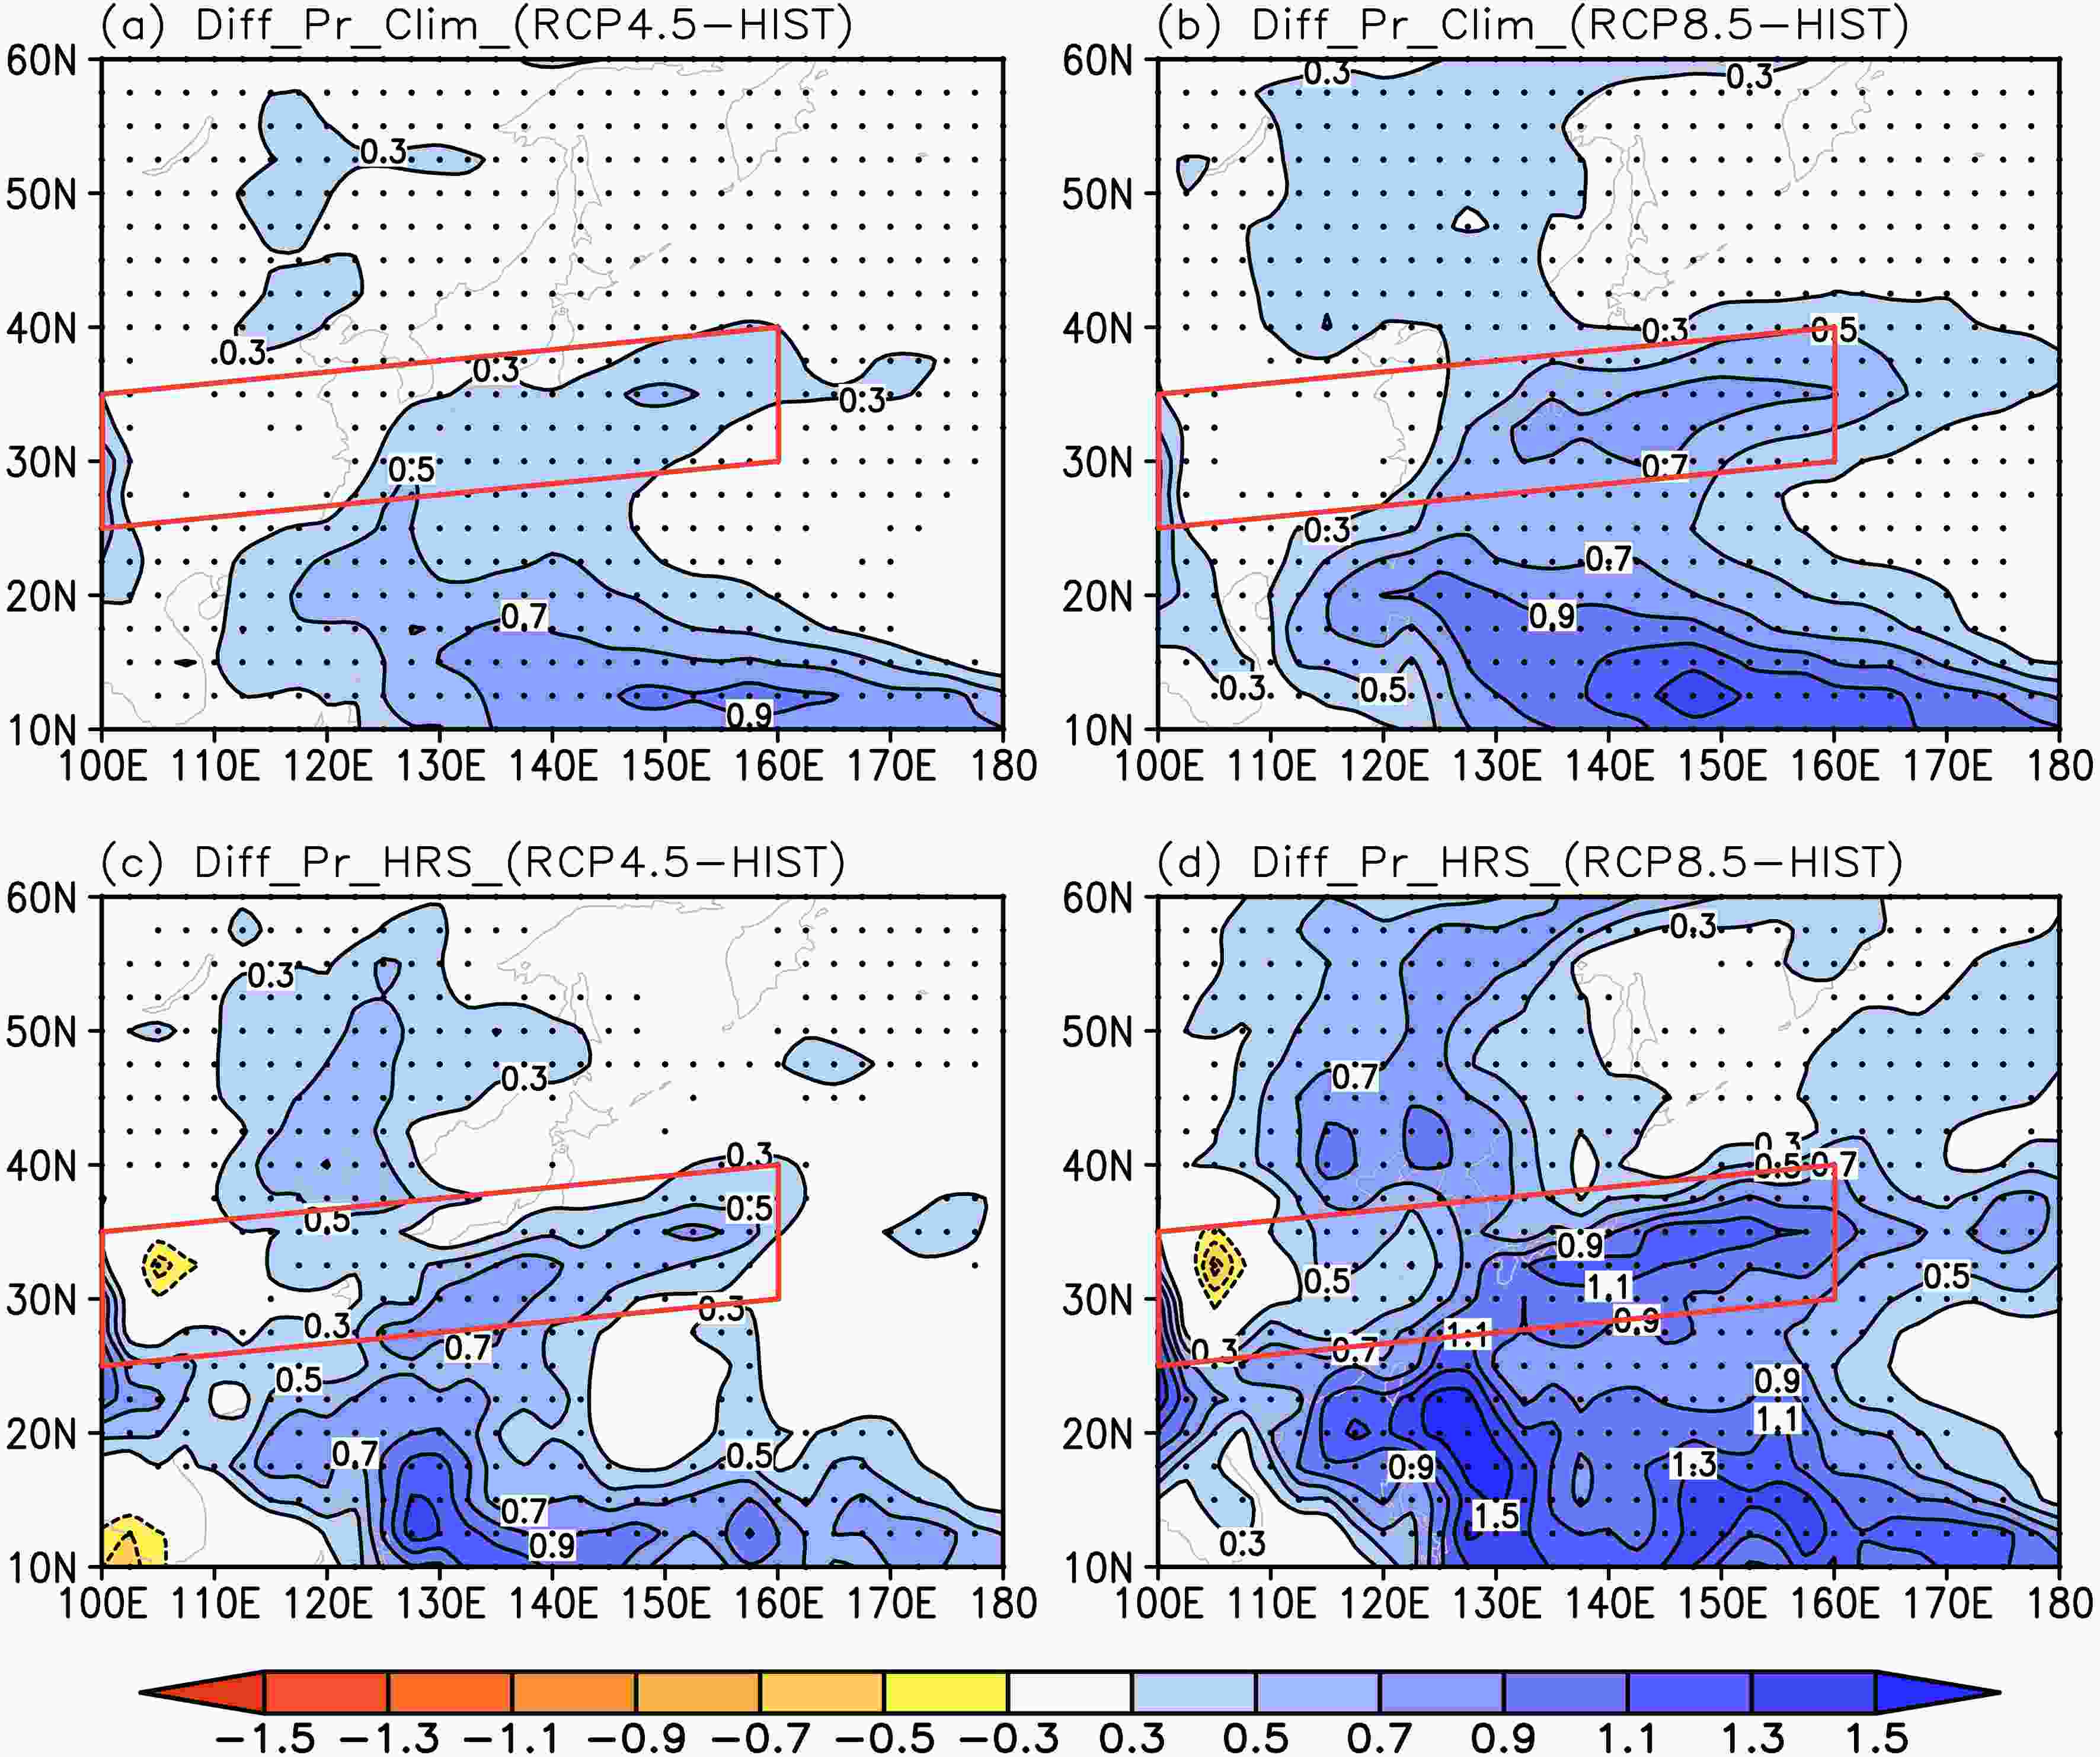 Figure4. MME projected changes in summer precipitation in climatology (EASRRCPs?EASRHIST) under RCP4.5 (a) and RCP8.5 (b), as well as changes in HRS under RCP4.5 (c) and RCP8.5 (d). Red parallelogram indicates the region used to define the EASRI and black dots indicate statistical significance at the 5% level of changes in precipitation by t-test (units: mm d?1).
The intensification of EASR in HRS is more remarkable compared to that in climatology (Figs. 4c and d). The spatial pattern is basically the same as that in climatology. Under RCP4.5, summer precipitation in HRS would intensify significantly by approximately 0.3–0.7 mm d?1 over the East Asian summer rainband (Fig. 4c). Similarly, significantly enhanced summer precipitation would prevail along the rainband under RCP8.5 with an increase of approximately 0.5–1.1 mm d?1 (Fig. 4d). The EASRI is 5.9 mm d?1 in HIST and would increase to 6.3 mm d?1 and 6.6 mm d?1 under RCP4.5 and RCP8.5, respectively, with increase ratios of 7% and 12%. The precipitation in HRS also intensifies much more over the ocean region than the land region, with the intensification being approximately 0.5 mm d?1 (0.9 mm d?1) and 0.2 mm d?1 (0.3 mm d?1) under RCP4.5 (RCP8.5), respectively. These results are similar to those from previous studies (e.g., Zhou et al., 2014; Freychet et al., 2015). Moreover, the precipitation would decrease over the middle reach of the Yangtze River valley.
2
4.3. Changes in associated WVT in climatology and HRS
As mentioned in the introduction, change in EASR is controlled by change in large-scale WVT. The convergence/divergence of WVT contributes to vapor sink/source in the air and finally influences precipitation. Therefore, in this subsection, changes in WVT responsible for changes in EASR are investigated.Under RCP4.5, the climatological WVT would intensify significantly (Fig. 5a). The negative divergence of WVT is projected to weaken significantly, especially over the eastern rainband, which would cause a stronger convergence of water vapor. There are two significantly enhanced positive divergences of WVT located over the southern tropical Indian Ocean (TIO) and the eastern subtropical North Pacific (SNP), respectively. Thus, increased moisture would be transported to the EASR region by two significantly enhanced water vapor flow branches separately from the southwest and southeast. The southwest branch flows from the southern TIO and the southeast one from the eastern SNP. They merge over the Philippine Sea and head northward to the rainband. Furthermore, the southwest branch closely links to the robust cross-equatorial Somali jet and a relatively weak cross-equatorial flow straddling 80°–100°E. The two flows merge over the Bay of Bengal and then transport moisture northeastward across the Indochina Peninsula and the South China Sea to the EASR region. The southeast branch, mainly located within 10°–25°N over the SNP, delivers water vapor by an eastly flow bypassing the south side of the WNP subtropical high. On the other hand, the relatively weak intensification of WVT over the western summer rainfall belt would lead to a weak increase in precipitation. A similar but stronger pattern would appear under RCP8.5, and more moisture would be supplied to EASR (Fig. 5b).
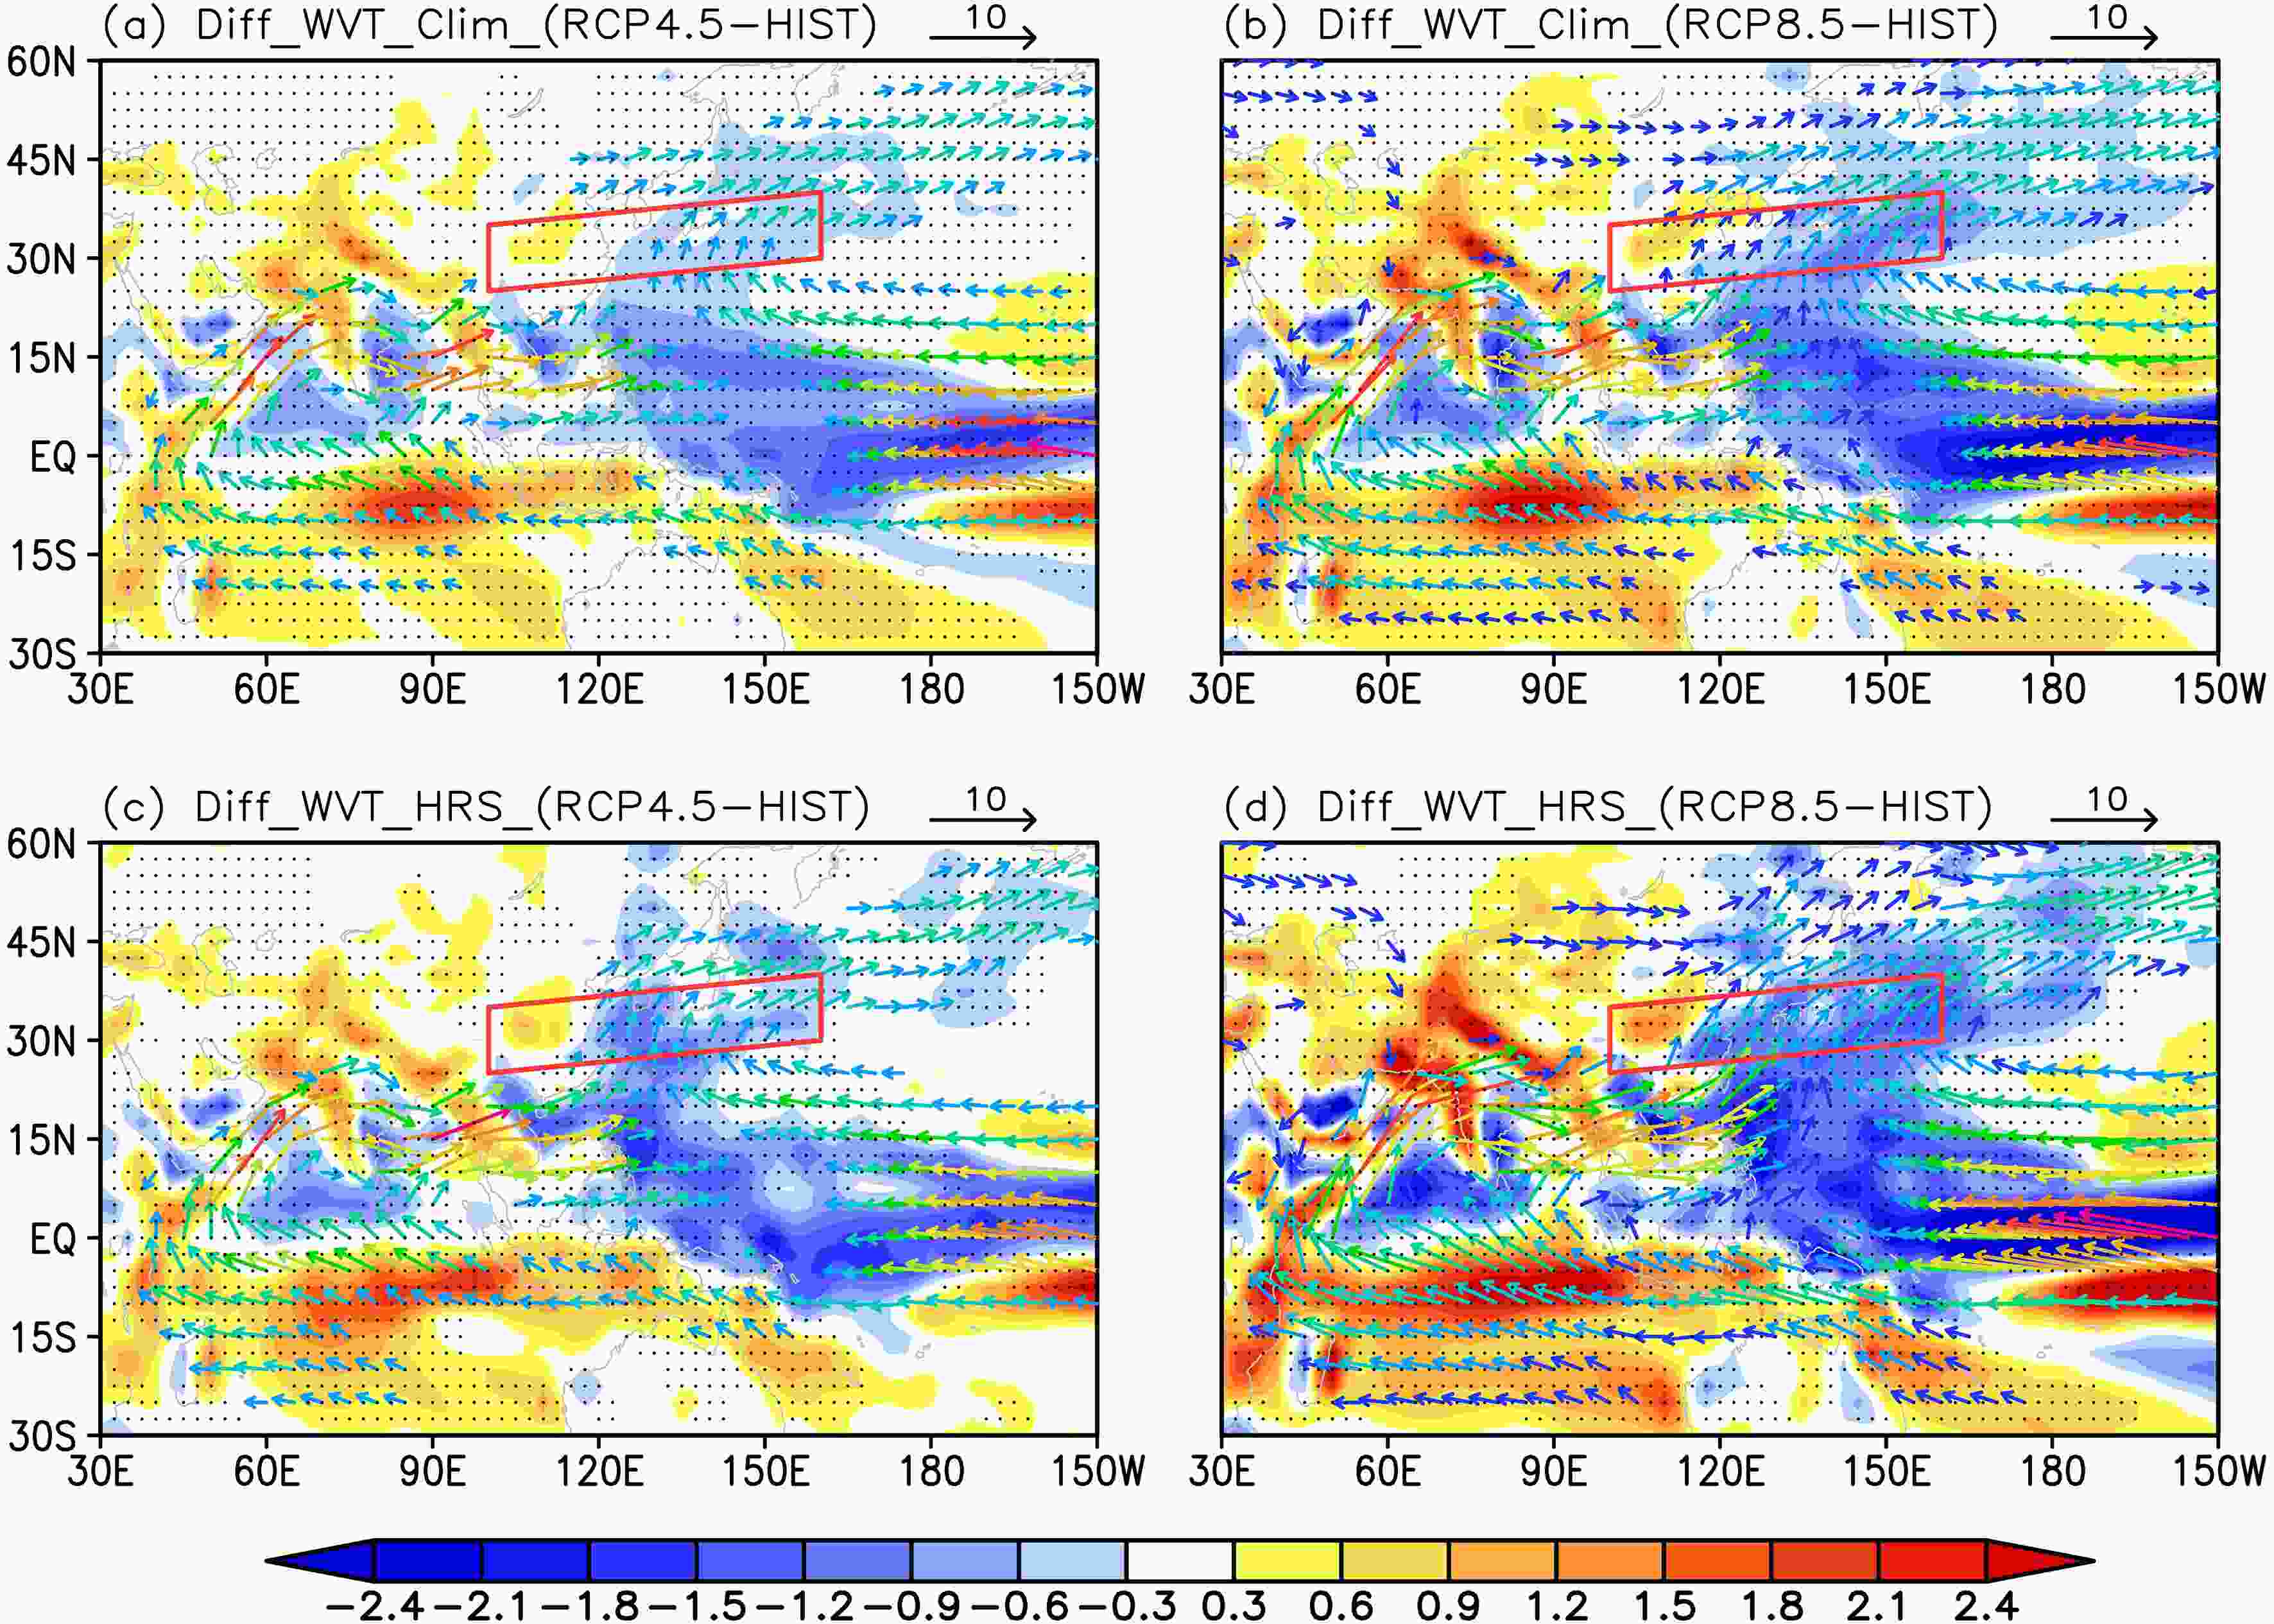 Figure5. As in Fig. 4, but for changes in vertically integrated WVT (vector, units: kg m?1 s?1) and its divergence (shaded, units: 10?6 kg m?2 s?1). Changes in WVT less than 1.5 kg m?1 s?1 are not shown. Black dots indicate statistical significance at the 5% level of changes in WVT by t-test.
To estimate the change in WVT quantitatively, we calculate its intensity on three profiles, respectively, which locate over the Indian Ocean and SNP. In the profile over the Somali jet (10°–25°N, 70°E), the climatological WVT would increase from approximately 33.0 kg m?1 s?1 in HIST to 37.1 kg m?1 s?1 and 38.9 kg m?1 s?1 under RCP4.5 and RCP8.5, respectively, with increase ratios of 12% and 18%. In the profile over the Bay of Bengal (10°–25°N, 90°E), the climatological WVT would increase from approximately 32.9 kg m?1 s?1 in HIST to 37.3 kg m?1 s?1 and 39.2 kg m?1 s?1 under RCP4.5 and RCP8.5, respectively, with increase ratios of 13% and 19%. At the same time, in the profile over the central SNP (10°–25°N, 170°E), the WVT would intensify from approximately 24.9 kg m?1 s?1 in HIST to 28.0 kg m?1 s?1 and 29.2 kg m?1 s?1 under RCP4.5 and RCP8.5, respectively, with increase ratios of 12% and 17%.
Evidently, the WVT in HRS would intensify more significantly than the climatology (Figs. 5c and d). The spatial pattern of the change is almost the same as that in climatology, but the intensification is stronger. The eastward WVT would intensify up to approximately 37.5 kg m?1 s?1 and 41.1 kg m?1 s?1 in the profile (10°–25°N, 70°E) under RCP4.5 and RCP8.5, respectively, compared to 32.9 kg m?1 s?1 in HIST, with increase ratios of 14% and 25%. In the profile over the Bay of Bengal (10°–25°N, 90°E), the eastward WVT would intensify from approximately 33.3 kg m?1 s?1 in HIST to 38.5 kg m?1 s?1 and 42.2 kg m?1 s?1 under RCP4.5 and RCP8.5, respectively, with increase ratios of 15% and 27%. The westward moisture flow from the eastern SNP would increase to approximately 29.9 kg m?1 s?1 and 32.5 kg m?1 s?1 in the profile (10°–25°N, 170°E) under RCP4.5 and RCP8.5 from 26.7 kg m?1 s?1 in HIST, respectively, with increase ratios of 12% and 22%.
The WVT from the TIO has not only a greater intensity but also a faster rate of increase in both climatology and HRS than the WVT from the SNP. The results suggest that the TIO would play a more important role and supply more moisture for EASR than the Pacific in the future.
The WVT is a product of water vapor and atmospheric circulation and can be divided into two parts (Huang et al., 1998; Li et al., 2015):
where


Figure 6 shows the separate contributions of dynamic and thermodynamic components to changes in WVT at 850 hPa (only under RCP8.5 for brevity), given that WVT mainly occurs in lower troposphere. The changes in WVT resulting from the thermodynamic component (Figs. 6a and c) bear great similarities to changes in both the climatology and HRS (Figs. 5b and d). However, the dynamic contribution would clearly decay over the TIO, and the cross-equatorial flow would almost disappear; at the same time, even an eastward flow over the western Pacific would appear (Figs. 6b and d). The dynamic component would lead to inappreciable moisture convergence over the EASR region. Therefore, the intensified WVT would be mainly attributable to the increase in moisture (thermodynamic component).
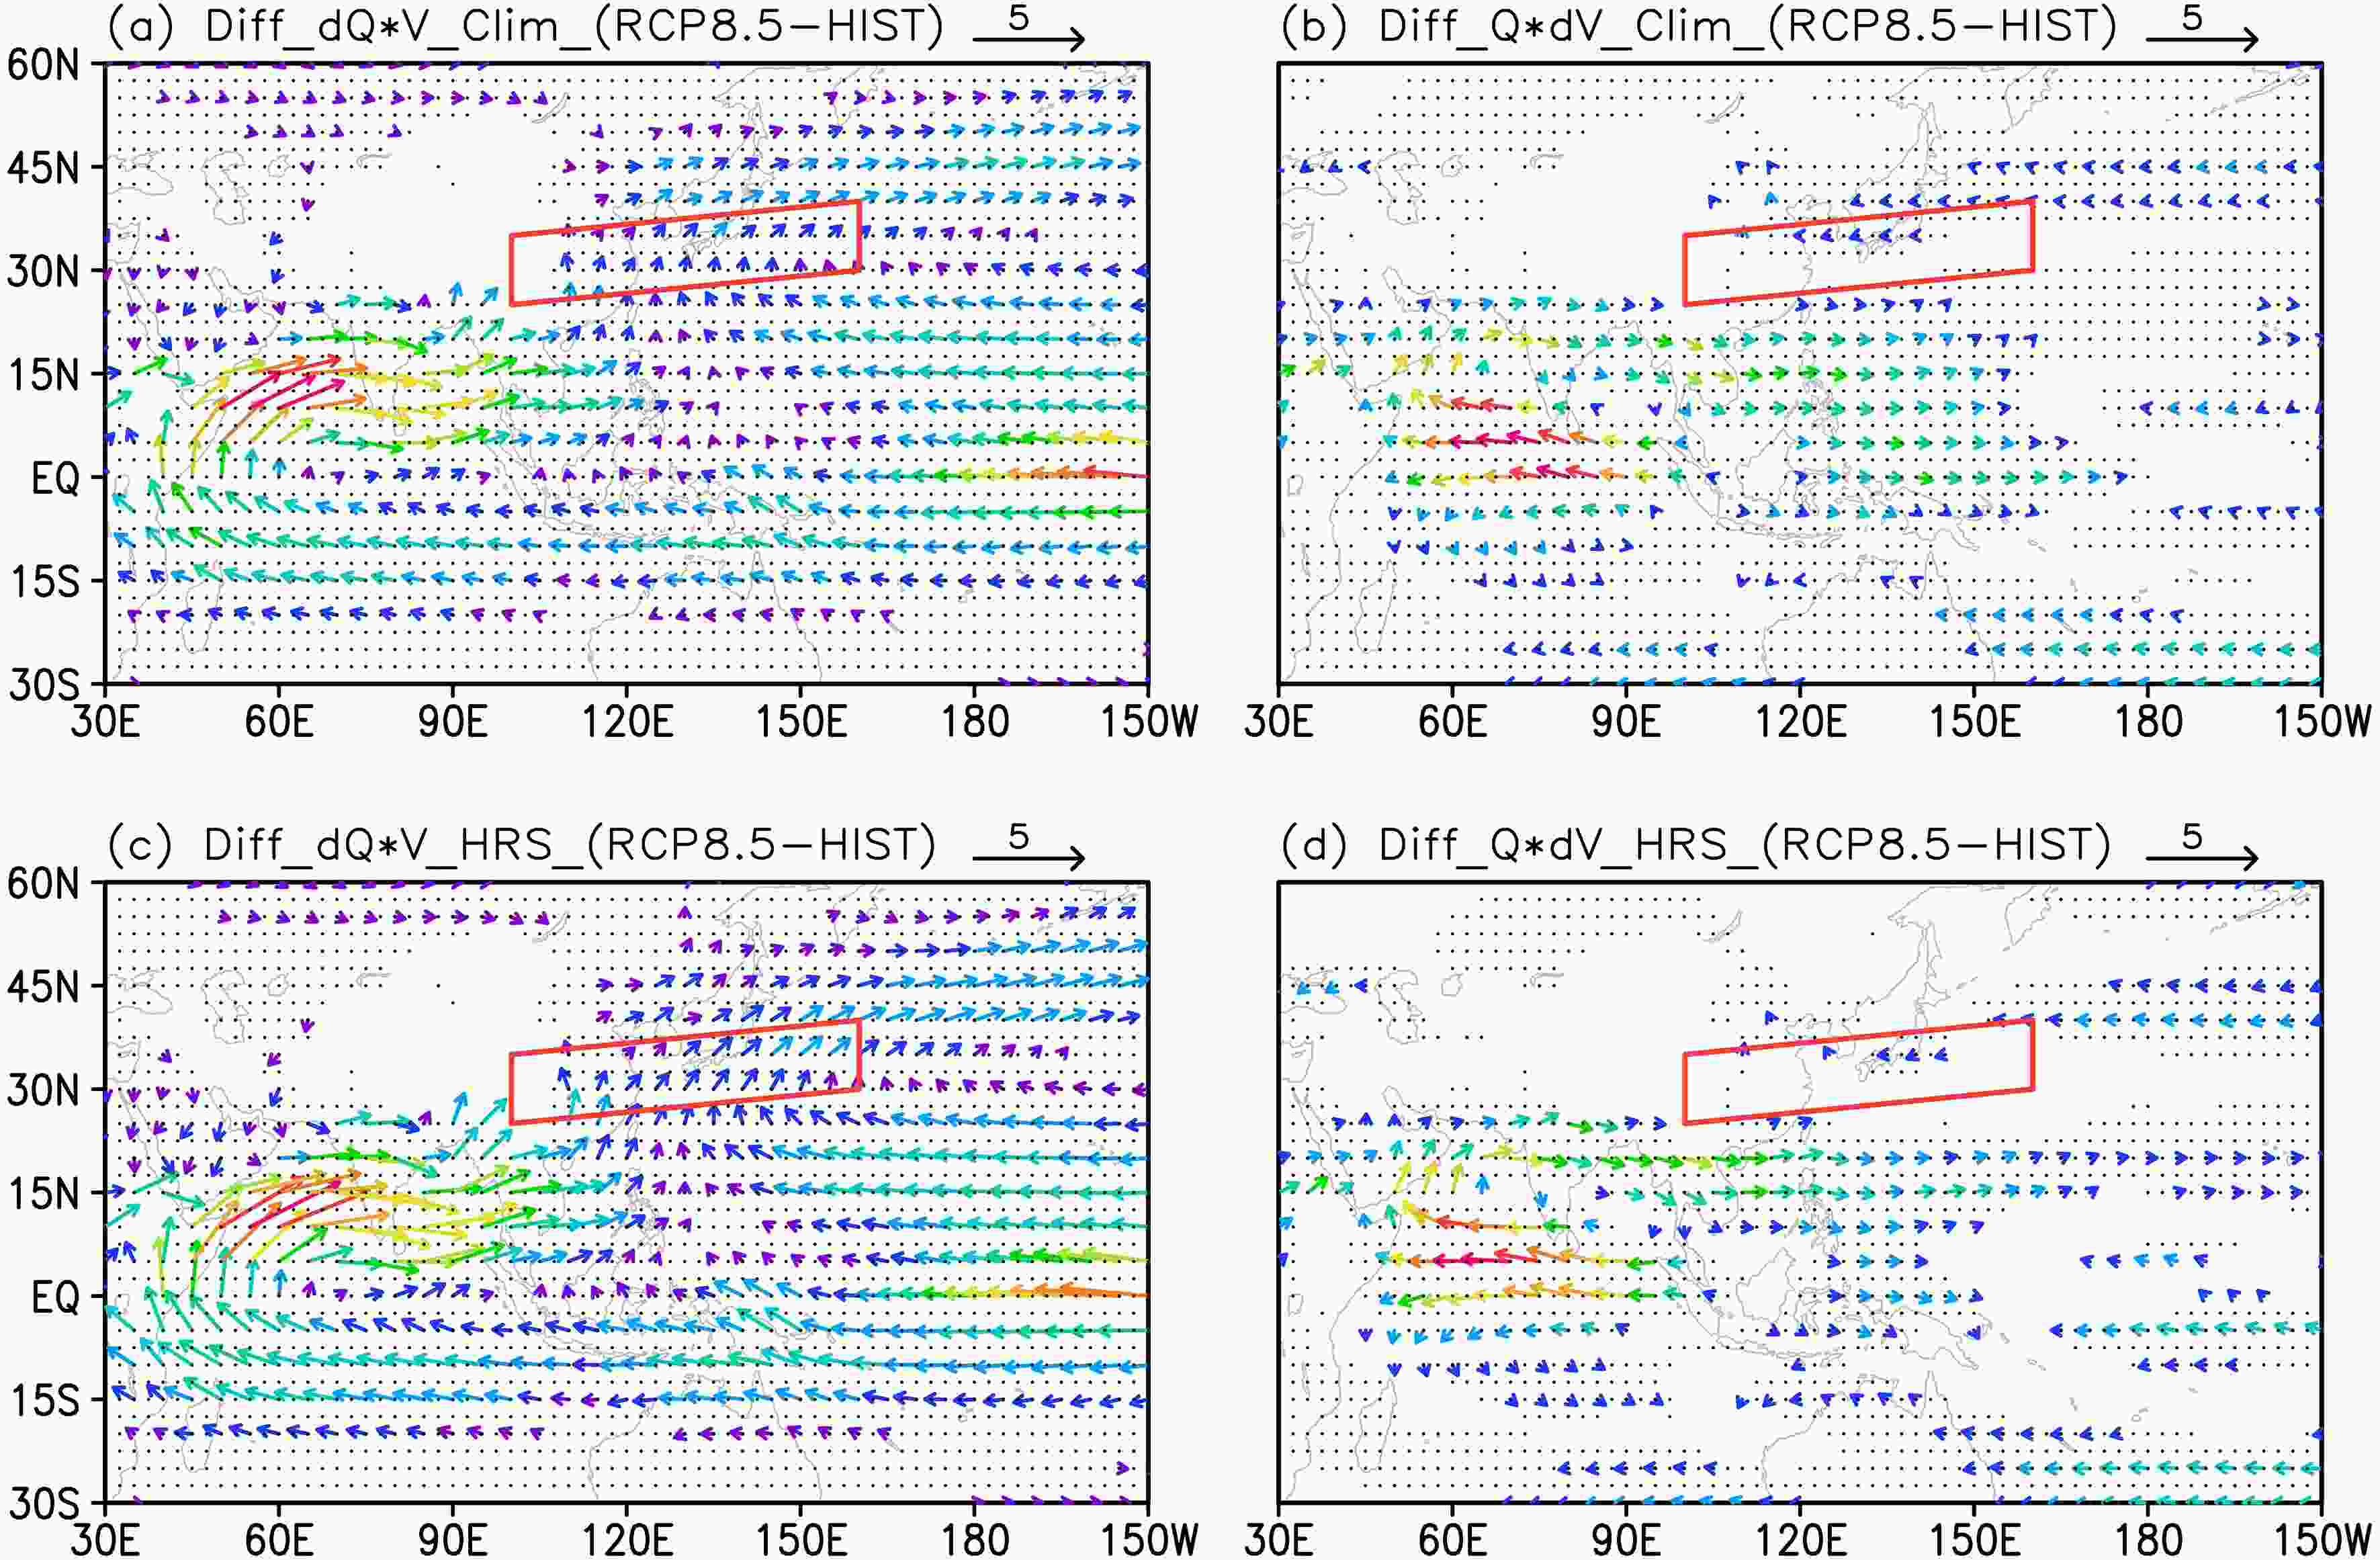 Figure6. Contributions of thermodynamic (a) and dynamic (b) components to changes in WVT at 850 hPa under RCP8.5 in climatology. (c) and (d) as in (a) and (b), but for the contributions in HRS. WVT less than 0.2 kg m?1 s?1 are not shown. Red parallelogram indicates the region used to define the EASRI and black dots indicate statistical significance at the 5% level of changes in specific humidity in (a) and (c), and in zonal wind in (b) and (d) by t-test (units: kg m?1 s?1).
In summary, the WVT in HRS would intensify, with a greater rate than that in climatology. The moisture flow from TIO would increase more remarkably than from SNP, no matter whether in climatology or HRS. The intensified WVT would result from the thermodynamic component.
2
5.1. Difference between summer precipitation in HRS and in climatology
In HIST, the positive precipitation anomaly mainly prevails over the East Asian summer rainband (Fig. 7a), with intensity larger than 0.6 mm d?1 and a maximum of 1.5 mm d?1. Under RCP4.5, the positive precipitation anomaly would be stronger and increase to greater than 0.9 mm d?1, with a maximum greater than 1.8 mm d?1 (Fig. 7b). Under RCP8.5, the EASR in HRS would be 1.2 mm d?1 greater than the climatology over the whole rainband and even be approximately 1.8–2.1 mm d?1 greater over the eastern rainband (Fig. 7c). Furthermore, the EASRI anomaly would increase to approximately 1.0 mm d?1 and 1.2 mm d?1 under RCP4.5 and RCP8.5, respectively, in comparison with 0.9 mm d?1 in HIST, with increase ratios of approximately 11% and 33%.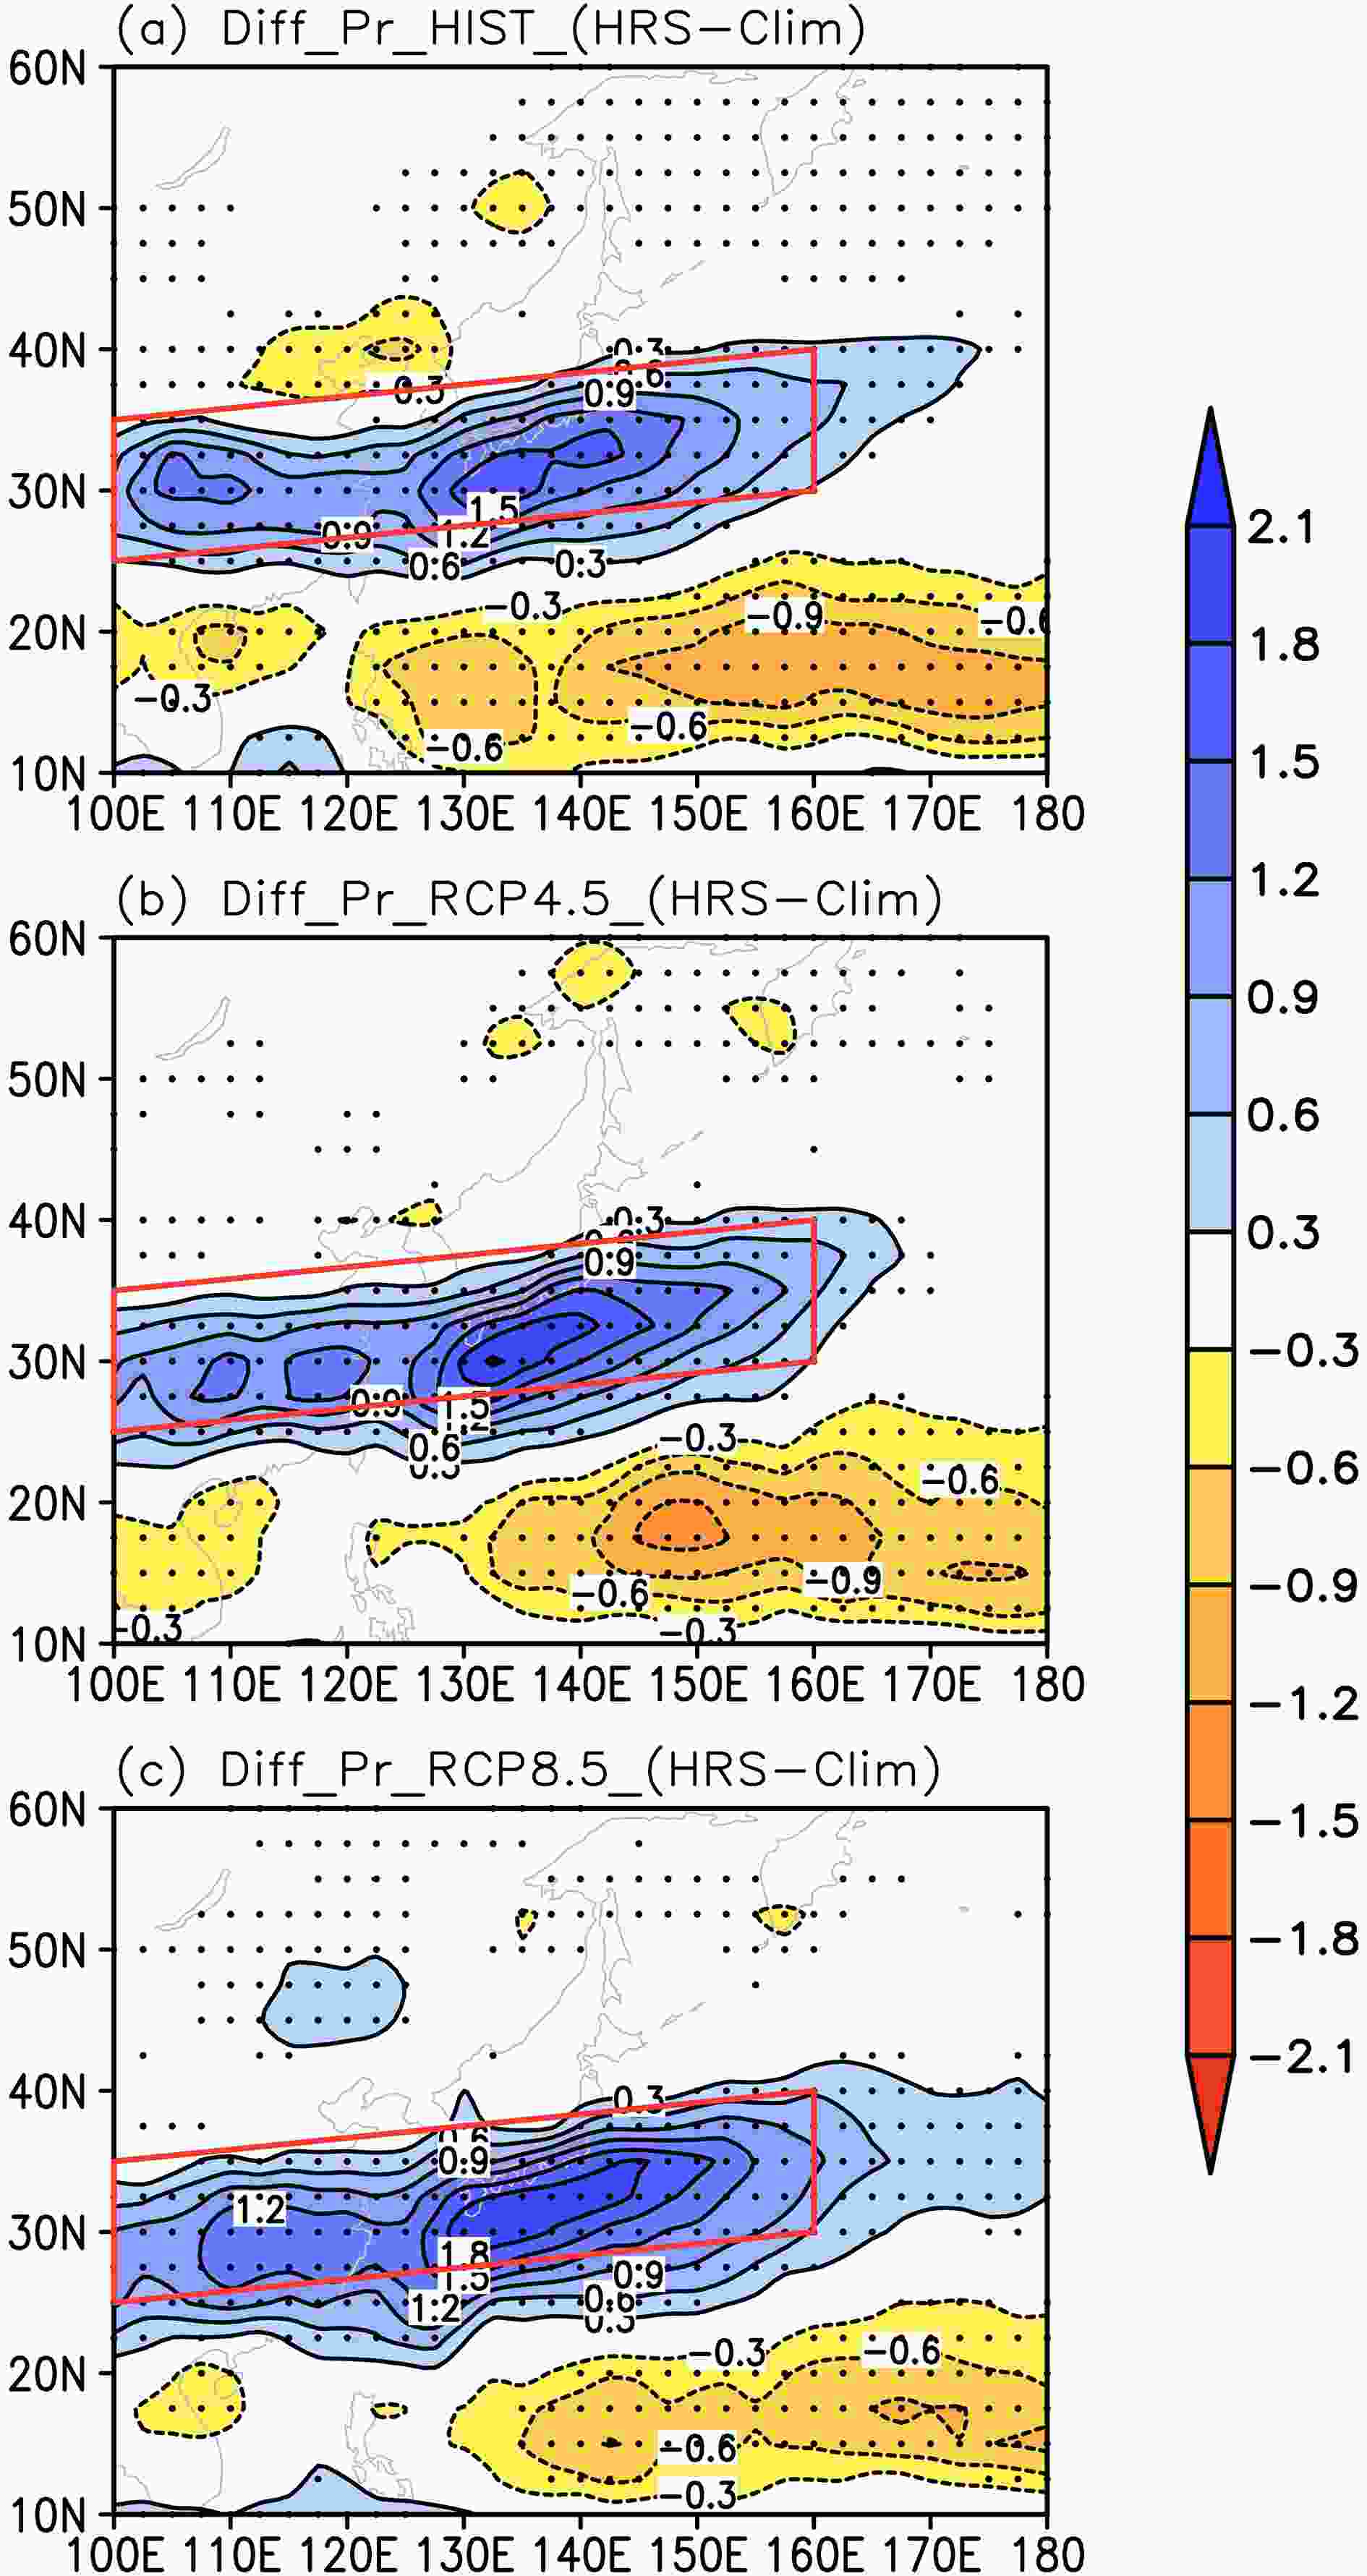 Figure7. Summer precipitation anomaly in HRS relative to climatology in MME (EASRHRS?EASRCLM) in HIST (a), under RCP4.5 (b), and under RCP8.5 (c). Red parallelogram indicates the region used to define the EASRI and black dots indicate statistical significance at the 5% level by t-test (units: mm d?1).
In addition, the summer precipitation anomaly is negative over the WNP in HIST and under the RCPs, showing an opposite trend to that over the rainband, probably because of more concentrated precipitation over the rainband.
2
5.2. Difference between WVT in HRS and in climatology
Corresponding to the positive EASR anomaly in HIST (Fig. 7a), an anomalous water vapor convergence is found above the rainband (Fig. 8a). At the same time, an anomalous water vapor divergence appears over the WNP, causing a negative precipitation anomaly (Fig. 7a) and delivering moisture from the western SNP to the rainband. However, no clear flow from the TIO and Bay of Bengal can be found. This suggests that in HIST, the WVT over the TIO in HRS is almost the same as that in climatology, but WVT over the western SNP is stronger than that in climatology. Thus, the moisture anomaly supplied to the EASR anomaly mainly converges from adjacent East Asia and the WNP.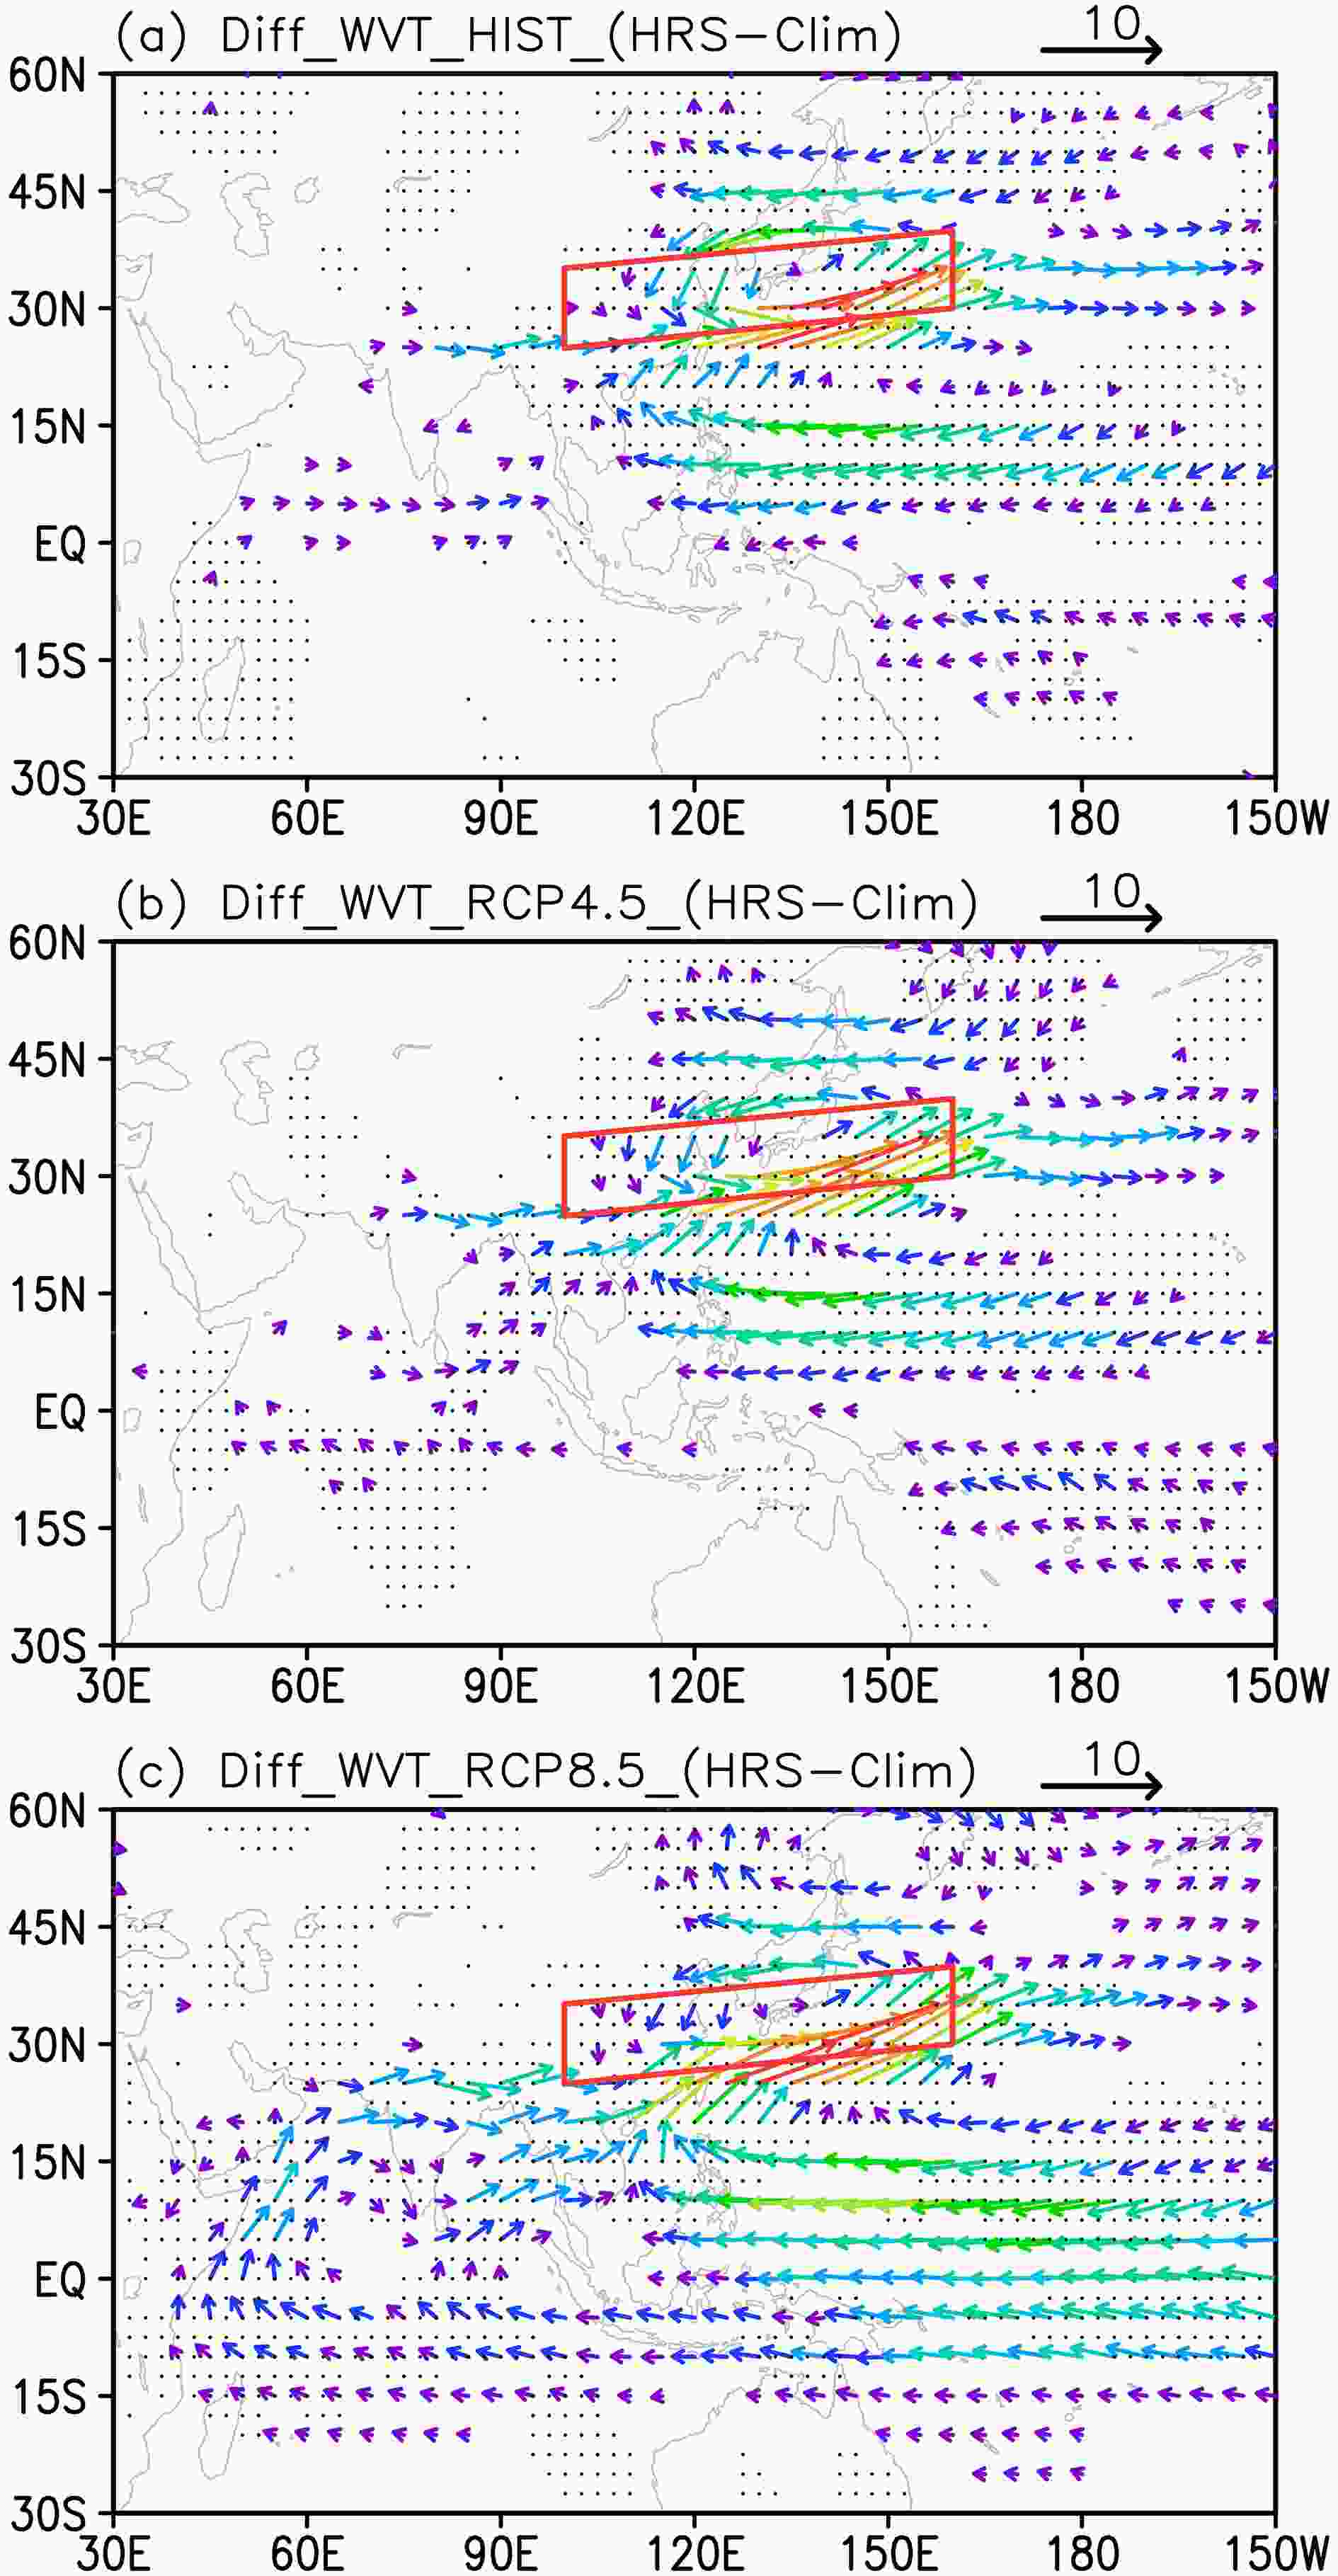 Figure8. As in Fig. 7, but for the vertically integrated WVT anomaly. Anomalies less than 0.5 kg m?1 s?1 are not shown. Black dots indicate statistically significancet at the 5% level of changes in WVT by t-test (units: kg m?1 s?1).
The WVT anomaly would intensify under the RCPs, particularly under RCP8.5 (Figs. 8b and c). A noteworthy change is that the TIO would also supply moisture for the EASR anomaly, most remarkably under RCP8.5. The spatial pattern of the WVT anomaly bears a similarity to that of climatological WVT. That is, the WVT over the TIO and Bay of Bengal in HRS would be stronger than that in climatology. The anomalous cross-equatorial Somali jet and southwesterly flow would bring anomalous moisture from the TIO and Bay of Bengal and finally contribute to the EASR anomaly. At the same time, the branch from the SNP would also intensify and bring moisture to the rainband.
Quantitively, the WVT anomaly is approximately 0.8 kg m?1 s?1 in the profile (10°–25°N, 70°E) in HIST; however, it is westward and contrary to that in climatology, indicating that WVT in HRS is weaker than that in climatology and cannot provide moisture for the EASR anomaly. It would turn eastward and increase up to approximately 0.7 kg m?1 s?1 and 2.3 kg m?1 s?1 under RCP4.5 and RCP8.5, respectively. In the profile over the Bay of Bengal (10°N–25°N, 90°E), the WVT anomaly would increase from approximately 1.2 kg m?1 s?1 in HIST to 1.7 kg m?1 s?1 and 3.5 kg m?1 s?1 under RCP4.5 and RCP8.5, respectively. The WVT anomalies from the Indian Ocean and Bay of Bengal under RCP8.5 would be almost triple those in HIST. At the same time, the westward WVT anomaly in the profile over the central SNP (10°–25°N, 170°E) would change to approximately 2.3 kg m?1 s?1 and 3.5 kg m?1 s?1 under RCP4.5 and RCP8.5, respectively, from 2.4 kg m?1 s?1 in HIST, with a changing ratio of -4% and 46%. The fast increasing WVT anomaly from the TIO would increase to become comparable to the one from the SNP under RCP8.5. Thus, the increasing rate of the WVT anomaly from the TIO would be much faster than that from the SNP, and the moisture from the TIO would be more crucial in affecting the EASR anomaly in HRS, especially under a high emission scenario.
In addition, the WVT divergence anomaly over the WNP (Fig. 8) causes a negative summer precipitation anomaly over the region (Fig. 7). The out-of-phase relationship with the EASR anomaly suggests that the heavy EASR may lead to below normal precipitation over the WNP whether present or future, which may be caused by the EASR’s strong convergence of moisture from adjacent regions.
The separate contributions of dynamic and thermodynamic components to the WVT anomaly are also analyzed (Fig. 9). In HIST, the thermodynamic contribution is inappreciable over the TIO, western Pacific, and the East Asian summer rainband (Fig. 9a); however, the WVT anomaly caused by the dynamic component results in a strong convergence over the rainband as well as a westward moisture flow over the SNP (Fig. 9b). Under RCP8.5, the thermodynamic contribution would intensify remarkably over the Indian Ocean and rainband region, especially the WVT anomaly linked to the cross-equatorial Somali jet (Fig. 9c). However, almost no clear change would be found in the dynamic contribution under RCP8.5 (Fig. 9d) in comparison with that in HIST (Fig. 9b). Therefore, the WVT anomaly is caused by the dynamic component in HIST; while under the RCPs, it would be attributable to both the dynamic contribution from the SNP and the thermodynamic contribution from the Indian Ocean, especially the latter.
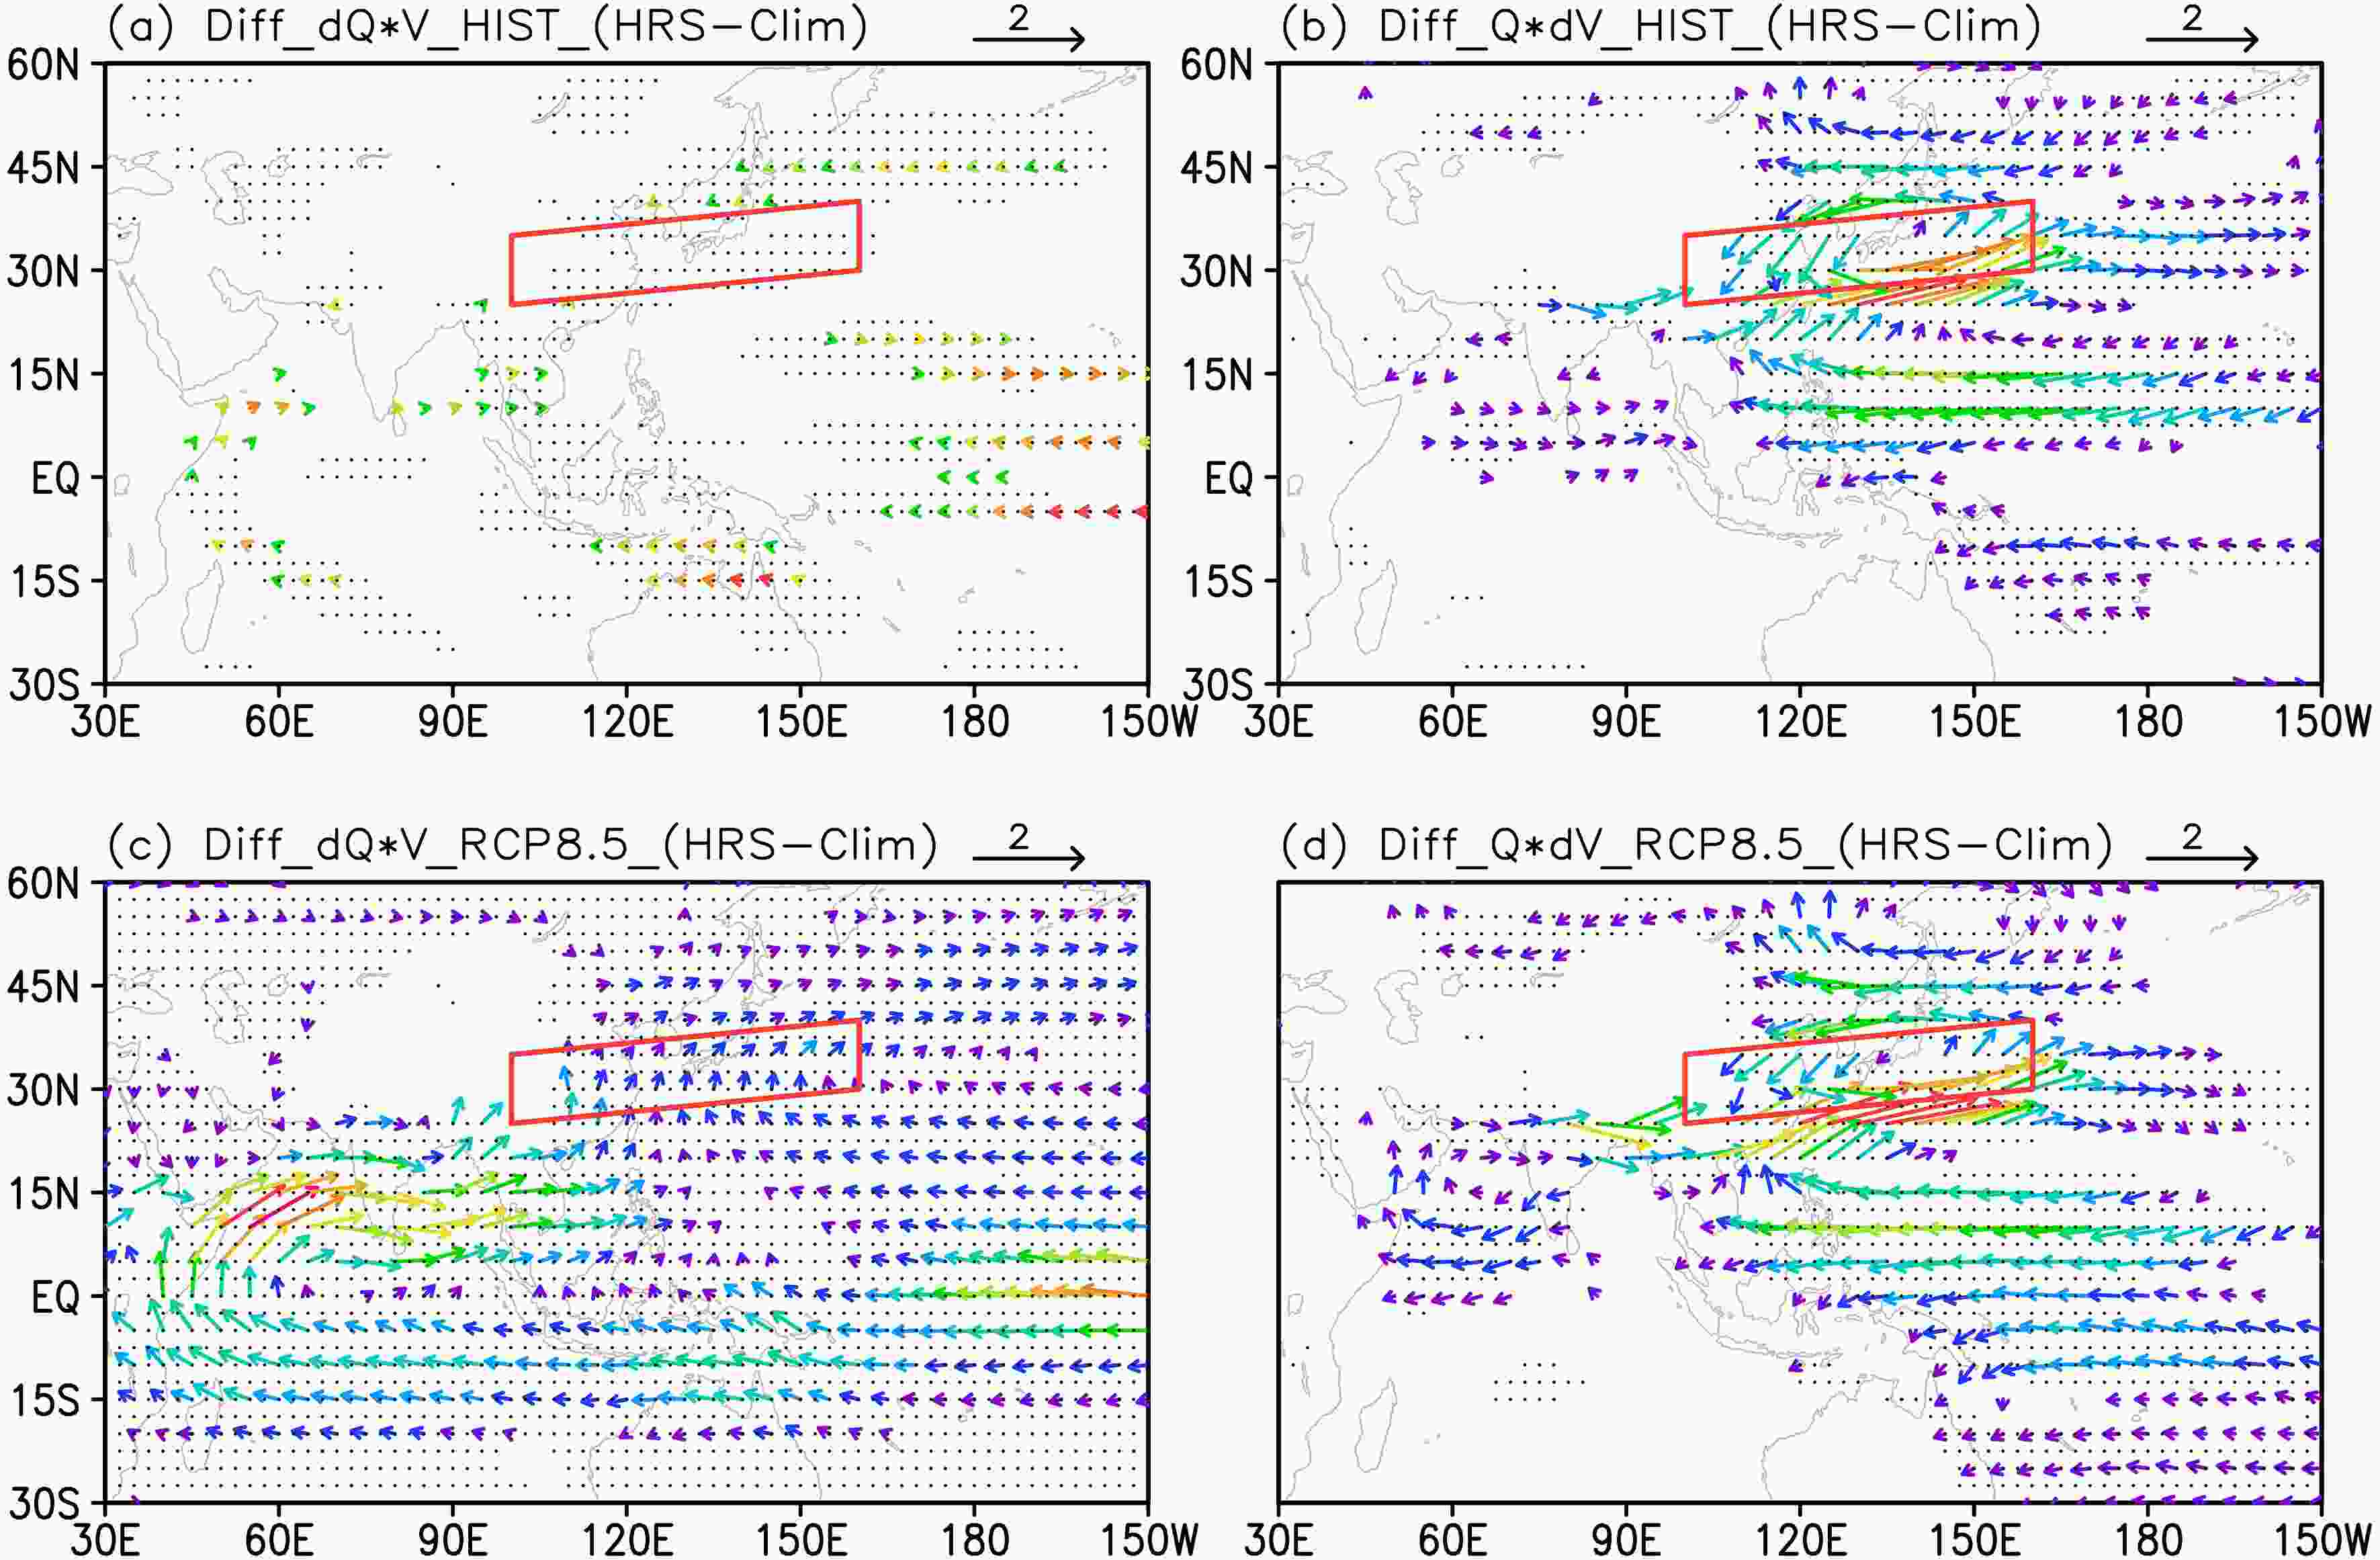 Figure9. Contributions of thermodynamic (a) and dynamic (b) components to WVT anomaly at 850 hPa in HIST. (c) and (d) as in (a) and (b), but for the contributions under RCP8.5. WVT less than 0.1 kg m?1 s?1 are not shown. Red parallelogram indicates the region used to define the EASRI and black dots indicate statistical significance at the 5% level of changes in specific humidity in (a) and (c), and in zonal wind in (b) and (d) by t-test (units: kg m?1 s?1).
First, both the projected changes in EASR (EASRRCPs?EASRHIST) in climatology and HRS would intensify significantly. The climatological EASR would increase by 6% and 8% under RCP4.5 and RCP8.5, respectively, compared with that in HIST; the EASR in HRS would intensify by approximately 7% and 12%. The intensification of EASR would be attributable to a significantly intensified WVT which separately originates from the southern TIO and eastern SNP. In the future, the TIO would supply more moisture for EASR than the Pacific, because of its stronger intensity and faster ratio of increase. Further analyses show that the intensified WVT could be attributed to the thermodynamic component.
On the other hand, the anomaly of EASR in HRS relative to climatology (EASRHRS?EASRCLM) would increase by approximately 11% and 33% under RCP4.5 and RCP8.5, respectively, in comparison with that in HIST. In HIST, the moisture anomaly supplying the EASR anomaly mainly converges from adjacent East Asia and the WNP, but no moisture anomaly from the Indian Ocean contributes to the EASR anomaly. Under the RCPs, the WVT anomaly from the TIO would triple and become comparable to the one from the SNP, which would increase only by half. Furthermore, the WVT anomaly is caused by the dynamic component in HIST; however, it would result from both dynamic contribution from the SNP and thermodynamic contribution from the Indian Ocean in the future, especially the latter.
The present study focuses on future changes in the probability of East Asian summers with record-breaking heavy precipitation and has found that the future probability would almost triple. The summer precipitation is analyzed as a whole in the study, and the changes in extreme (upper 10th percentile) summer-average East Asian rainfall is highlighted, but the changes in the seasonality or daily extreme precipitation events that are studied in previous works are not addressed. However, the EASR and associated circulation exhibit a clear subseasonal variation in the observations (Ding and Hu, 2003; Ye and Lu, 2011; Jiang et al., 2017; Li and Lu, 2018; Zhu et al., 2019). In 1998, the heavy summer precipitation and associated WVT experienced four different stages (Ding and Hu, 2003; Jiang et al., 2017). Li and Lu (2018) noticed that the precipitation over the Yangtze River basin is mainly affected by the tropical circulation during early summer but by the extratropical circulation during mid-summer. Therefore, on the subseasonal timescale, future changes in the probability of EASR remain unclear. This open question requires further investigation.
Some studies have shown that the latest generation models in phase 6 of Coupled Model Intercomparison Project (CMIP6) exhibit progress in simulating the East Asian summer westerly jet (Fu et al., 2020) and extreme events (Zhu et al., 2020). However, other studies have pointed out that CMIP6 models have comparable capacities to CMIP5 models in simulating the East Asian summer monsoon, the relationship between the preceding wintertime El Ni?o–Southern Oscillation and EASR, as well as the intensity and frequency indices of extreme precipitation (Jiang et al., 2020; Kim et al., 2020; Fu et al., 2021). We preliminarily assess the changes in the probability of EASR in CMIP6 models (Table 1). Under both the moderate shared socio-economic pathway 2–4.5 (SSP2–4.5) and the high emission pathway 5–8.5 (SSP5–8.5), the mean EASR, EASR with the highest probability, and standard deviation of EASR would intensify in almost all CMIP6 models (Table 7). In addition, the projected CDFs in CMIP6 models are positioned to the right of historical CDFs in almost all CMIP6 models (Fig. 10). Under SSP2–4.5 and SSP5–8.5, the probability of HRS would increase by approximately a factor of two to three in most CMIP6 models, which is similar to those in CMIP5 models. The CMIP6 models also show that the projected PDFs would clearly shift and extend rightward in the future in almost all CMIP6 models (figure not shown). Thus, the CMIP6 models also project an increase in the probability of HRS in the future, consistent with the CMIP5 models.
| Model | Mean | Highest Probability | Standard Deviation | ||||||||
| HIST | SSP245 | SSP585 | HIST | SSP245 | SSP585 | HIST | SSP245 | SSP585 | |||
| ACCESS-CM2 | 6.9 | 7.6 (10%) | 7.7 (12%) | 6.4 | 7.5 (17%) | 7.6 (19%) | 0.8 | 0.9 (13%) | 1.1 (38%) | ||
| ACCESS-ESM1-5 | 6.7 | 6.9 (3%) | 7.1 (6%) | 6.6 | 6.9 (5%) | 7.1 (8%) | 0.6 | 0.7 (17%) | 0.7 (17%) | ||
| BCC-CSM2-MR | 4.6 | 4.8 (4%) | 4.8 (4%) | 4.5 | 5.0 (11%) | 4.7 (4%) | 0.5 | 0.5 (0%) | 0.6 (20%) | ||
| CNRM-CM6-1 | 6.1 | 6.1 (0%) | 6.1 (0%) | 5.9 | 6.1 (3%) | 6.1 (3%) | 0.5 | 0.5 (0%) | 0.6 (20%) | ||
| CNRM-ESM2-1 | 6.1 | 6.2 (2%) | 6.2 (2%) | 6.1 | 6.1 (0%) | 6.1 (0%) | 0.5 | 0.5 (0%) | 0.6 (20%) | ||
| EC-Earth3 | 5.1 | 5.5 (8%) | 5.6 (10%) | 5.0 | 5.4 (8%) | 5.4 (8%) | 0.5 | 0.6 (20%) | 0.6 (20%) | ||
| EC-Earth3-Veg | 5.1 | 5.5 (8%) | 5.6 (10%) | 5.1 | 5.3 (4%) | 5.4 (6%) | 0.5 | 0.5 (0%) | 0.7 (40%) | ||
| FGOALS-g3 | 5.1 | 5.3 (4%) | 5.4 (6%) | 5.1 | 5.3 (4%) | 5.5 (8%) | 0.4 | 0.4 (0%) | 0.6 (50%) | ||
| GFDL-ESM4 | 5.0 | 4.8 (?4%) | 5.0 (0%) | 4.9 | 4.9 (0%) | 5.0 (2%) | 0.4 | 0.5 (25%) | 0.6 (50%) | ||
| GISS-E2-1-G | 5.4 | 5.8 (7%) | 6.0 (11%) | 5.1 | 5.9 (16%) | 5.9 (16%) | 0.6 | 0.8 (33%) | 0.8 (33%) | ||
| INM-CM5-0 | 6.2 | 6.4 (3%) | 6.6 (6%) | 6.4 | 6.3 (?2%) | 6.7 (5%) | 0.4 | 0.4 (0%) | 0.5 (25%) | ||
| IPSL-CM6A-LR | 5.2 | 5.4 (4%) | 5.5 (6%) | 5.2 | 5.4 (4%) | 5.5 (6%) | 0.3 | 0.4 (33%) | 0.5 (67%) | ||
| MIROC-ES2L | 6.7 | 6.7 (0%) | 6.8 (1%) | 6.5 | 7.0 (8%) | 6.5 (0%) | 0.6 | 0.7 (17%) | 0.7 (17%) | ||
| MIROC6 | 6.2 | 6.2 (0%) | 6.3 (2%) | 6.2 | 6.2 (0%) | 6.1 (?2%) | 0.5 | 0.6 (20%) | 0.7 (40%) | ||
| MPI-ESM1-2-HR | 5.2 | 5.4 (4%) | 5.6 (8%) | 5.2 | 5.2 (0%) | 5.7 (10%) | 0.4 | 0.5 (25%) | 0.5 (25%) | ||
| MPI-ESM1-2-LR | 4.9 | 5.2 (6%) | 5.4 (10%) | 4.8 | 5.2 (8%) | 5.4 (13%) | 0.4 | 0.5 (25%) | 0.6 (25%) | ||
| MRI-ESM2-0 | 5.6 | 5.7 (2%) | 5.8 (4%) | 5.5 | 5.6 (2%) | 5.7 (4%) | 0.5 | 0.6 (20%) | 0.6 (50%) | ||
| NESM3 | 5.3 | 5.6 (6%) | 5.6 (6%) | 5.4 | 5.6 (4%) | 5.5 (2%) | 0.4 | 0.5 (25%) | 0.5 (20%) | ||
| NorESM2-MM | 6.0 | 6.0 (0%) | 6.2 (3%) | 6.1 | 5.9 (?3%) | 6.0 (?2%) | 0.7 | 0.8 (14%) | 0.8 (14%) | ||
| UKESM1-0-LL | 6.6 | 7.0 (6%) | 7.2 (9%) | 6.2 | 6.8 (10%) | 7.2 (16%) | 0.8 | 0.9 (13%) | 1.0 (25%) | ||
Table7. Same as Table 3, but for the results in HIST and under SSP245 and SSP585 in 20 CMIP6 models.
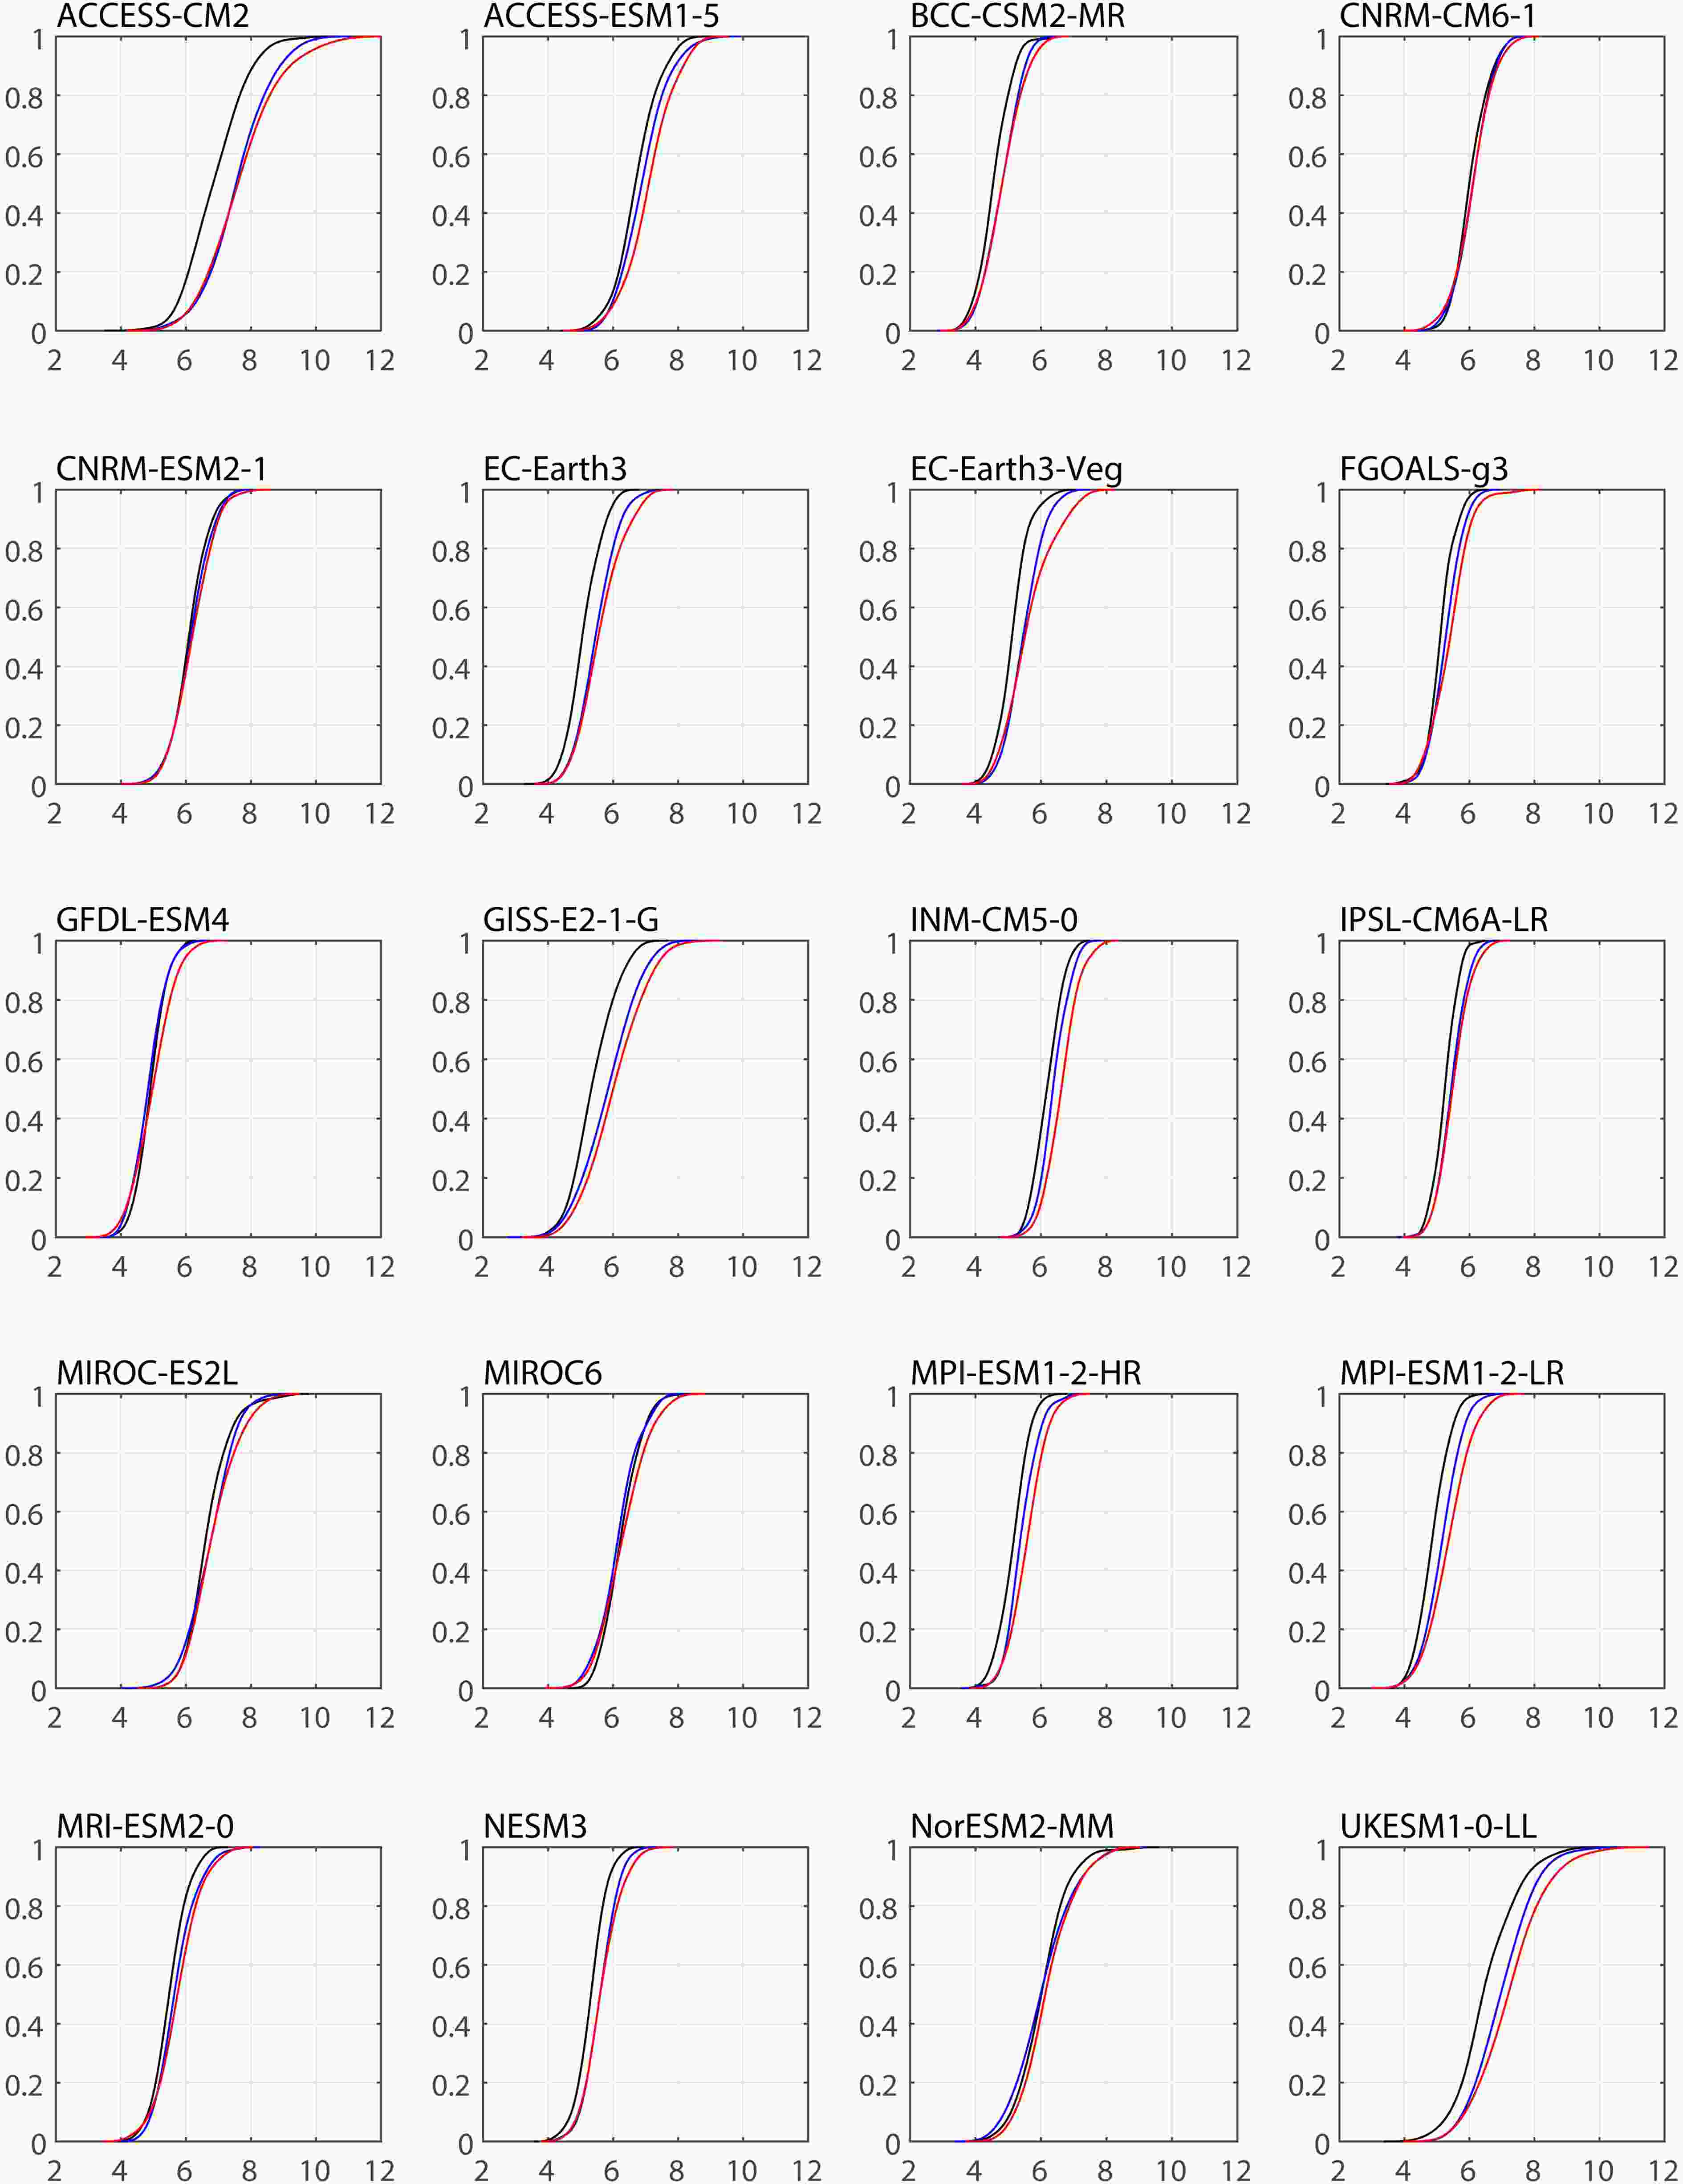 Figure10. As in Fig. 3, but for CMIP6 models.
Acknowledgements. We thank the editor and two anonymous reviewers for their various constructive and detailed comments and suggestions, which have greatly helped us to improve the presentation of this paper. This research was supported by the National Key R&D Program of China (Grant No. 2017YFA0603802), the Strategic Priority Research Program of Chinese Academy of Sciences (Grant No. XDA2006040102), and the National Natural Science Foundation of China (Grant No. 41675084).
