HTML
--> --> -->Typically, ARs occur in the lower troposphere at mid and higher latitudes, with length being at least twice as long as width and orientation pointing from the equator to higher latitudes (Dettinger et al., 2011; Gimeno et al., 2014). Although ARs cover only ~10% of the Earth’s circumference, they contribute over 90% of the total poleward water vapor transport at midlatitudes (Zhu and Newell, 1998). Given the efficiency of ARs on water vapor transport, it is natural to relate it to extreme precipitation and floods, since abundant water vapor is necessary for heavy rainfall. In the western U.S., ARs contribute 30%–50% to annual precipitation, and 60%–100% of the most extreme storms are associated with ARs (Lamjiri et al., 2017). Moreover, half of the extreme precipitation events (top 2%) at midlatitudes are associated with ARs, and 40%–70% of extreme precipitation over 40% of the world’s coastlines are affected by landfalling ARs (Waliser and Guan, 2017).
Previous studies on ARs have mainly focused on the winter season and the west side of continents. However, ARs can also affect other regions, such as Iran, where over 360 ARs occurred during the winters (November to April) of 2007–18 (Esfandiari and Lashkari, 2020). Besides, ARs in East Asia (EA) have significant impacts on the summer precipitation over eastern China, Japan, and the Korean Peninsula. Specifically, ARs during warm seasons (spring, summer, and autumn) were responsible for 20%–90% of the extreme precipitation events in EA during 1958–2007 (Kamae et al., 2017), and 30%–60% of the annual precipitation in EA was associated with ARs, with the highest frequency occurring during summer for the period 1979–2015 (Kim et al., 2020). In terms of the Yangtze River basin (YRB), ARs played an important role in the flood-triggering extreme precipitation events that occurred during summer for the period 1985–2016 by transporting water vapor from the Arabian Sea, Bay of Bengal, and South China Sea to Southeast China and the YRB (Pan and Lu, 2019). In the summer of 2020, the Yangtze-Huaihe River basin (YHRB) in China witnessed a long-lasting mei-yu season, which ran 62 days from 1 June to 2 August (Liu and Ding, 2020), with mean accumulated precipitation of ~759 mm, making 2020 the most severe flood year since 1954 (Chen et al., 2020; Wei et al., 2020; Zhang et al., 2020). This raises the questions: What are the characteristics of the ARs that occurred during the 2020 mei-yu season? And how much did the ARs contribute to the record-breaking rainfall in the summer of 2020?
Thus, the aim of this study is to investigate the relationship between ARs and mei-yu rainfall in 2020. The three-dimensional (3D) structure of ARs during mei-yu periods is also examined. The data and methods are described in section 2, including the AR identification algorithm, the methodology to define AR frequency, AR-related precipitation, and frontogenesis calculation. Section 3 describes the intraseasonal variation of AR frequency in the summer of 2020 and the impacts of ARs on mei-yu rainfall. The statistics of AR geometrics and the spatiotemporal evolution of AR 3D structure are presented in section 4. Finally, conclusions and discussions are given in section 5.
2.1. Data
The daily precipitation variable is retrieved for summer 2020 from the Integrated Multi-satellite Retrievals for Global Precipitation Measurement (IMERG) Late Precipitation L3 V06 dataset (Huffman et al., 2019), which has a spatial resolution of 0.1° × 0.1°. The Global Precipitation Measurement (GPM) mission is an international satellite mission meant to provide next-generation worldwide observations of rain and snow, and it is supported by the National Aeronautics and Space Administration (NASA) and the Japanese Aerospace Exploration Agency (JAXA). The GPM Core Observatory design is an update of the highly successful rain-sensing package of Tropical Rainfall Measuring Mission (TRMM) with the extension of observations to higher latitudes. The precipitation data of IMERG for the summer of 2020 are used in this study.The meteorological variables for the summer of 2020 are retrieved from ERA5 reanalysis (Hersbach et al., 2018b) of the European Center for Medium-Range Weather Forecasts (ECMWF) and include temperature, specific humidity (q), wind speed (u and v), vertical velocity, and geopotential height at multiple levels, with a spatial resolution of 0.25° × 0.25° and a temporal resolution of four times per day (0000, 0600, 1200, and 1800 UTC). ERA5 is the fifth generation ECMWF reanalysis and is available for 1950 to present. The vertical integral of eastward (northward) water vapor flux is also retrieved from ERA5 (Hersbach et al., 2018a), with the same spatiotemporal resolution as wind speed, for June, July, and August (JJA) from 1981 to 2020.
Latent heat data for the summer of 2020 are retrieved from the Japanese 55-year Reanalysis (JRA-55, Kobayashi et al., 2015; Harada et al., 2016), with a spatial resolution of 1.25° × 1.25° and a temporal resolution of four times per day (0000, 0600, 1200, and 1800 UTC). JRA-55 is the second reanalysis project carried out by the Japan Meteorological Agency (JMA) and is a high-quality homogeneous climate dataset based on a sophisticated data assimilation system.
2
2.2. Method
32.2.1. AR identification algorithm
Existing AR detection methods can be categorized into two types according to the data used: i) using total column water vapor (TCWV), or vertically integrated water vapor (IWV), obtained from satellite observations (Neiman et al., 2008; Wick et al., 2013); ii) using vertically integrated water vapor transport (IVT) retrieved from a reanalysis dataset (Guan and Waliser, 2015; Kamae et al., 2017; Pan and Lu, 2019). Detailed comparisons between these two types of methods can be found in previous studies (Shields et al., 2018; Shields et al., 2019). In most studies on ARs in East Asia, IVT was chosen to define ARs (Kamae et al., 2017; Pan and Lu, 2019; Kim et al., 2020), since IVT represents water vapor transport directly and is closely related to precipitation (Rutz et al., 2014). Following these studies, this study employs 6-hourly IVT to detect AR activities and quantify AR geometry. IVT is defined as:where viewvf (vinwvf) denotes the vertical integral of eastward (northward) water vapor flux (units: kg m?1 s?1) retrieved from the ERA5 reanalysis, g is the acceleration of gravity (units: m s?2), p means pressure (units: Pa), p0 is surface pressure (units: Pa), q represents specific humidity (units: kg kg?1), and u (v) is the eastward (northward) component of wind (units: m s?1).
Based on IVT, Pan and Lu (2019) (hereafter PL19) proposed a novel AR identification algorithm to investigate the AR activities in the Yangtze River Basin and proved it is applicable for other regions and the global domain. Herein, this study adopts this algorithm and adjusts the research area to 15°–60°N, 100°–180°E.
The first step of the algorithm is to extract AR pathways from IVT fields based on a dual threshold (combination of local threshold and regional threshold). Following Guan and Waliser (2015) and PL19, the 85th percentile IVT is calculated over all 6-hourly data for JJA during 1981–2010 (Fig. 1a). By applying the Gaussian kernel density smoothing (GKS) technique on the 85th percentile IVT field, the local threshold (Fig. 1b) is obtained. In addition to the local threshold, the regional threshold is defined as the 80th percentile of the IVT magnitude over all grids inside the detection domain for summer (334 kg m?1 s?1 according to PL19). After getting the dual threshold, preliminary AR pathways can be extracted for all time steps. As shown by the example of the IVT field at 0000 UTC 5 July (Fig. 1c), the maximum IVT grid is defined as the initial anchor. From this anchor, all contiguous grids that exceed their dual thresholds are extracted as the first preliminary AR pathway. It should be noted that the second, or even more, preliminary AR pathways at this time step may be detected from the rest of the IVT field. And, all detected ARs in the research domain are taken into consideration in this study.
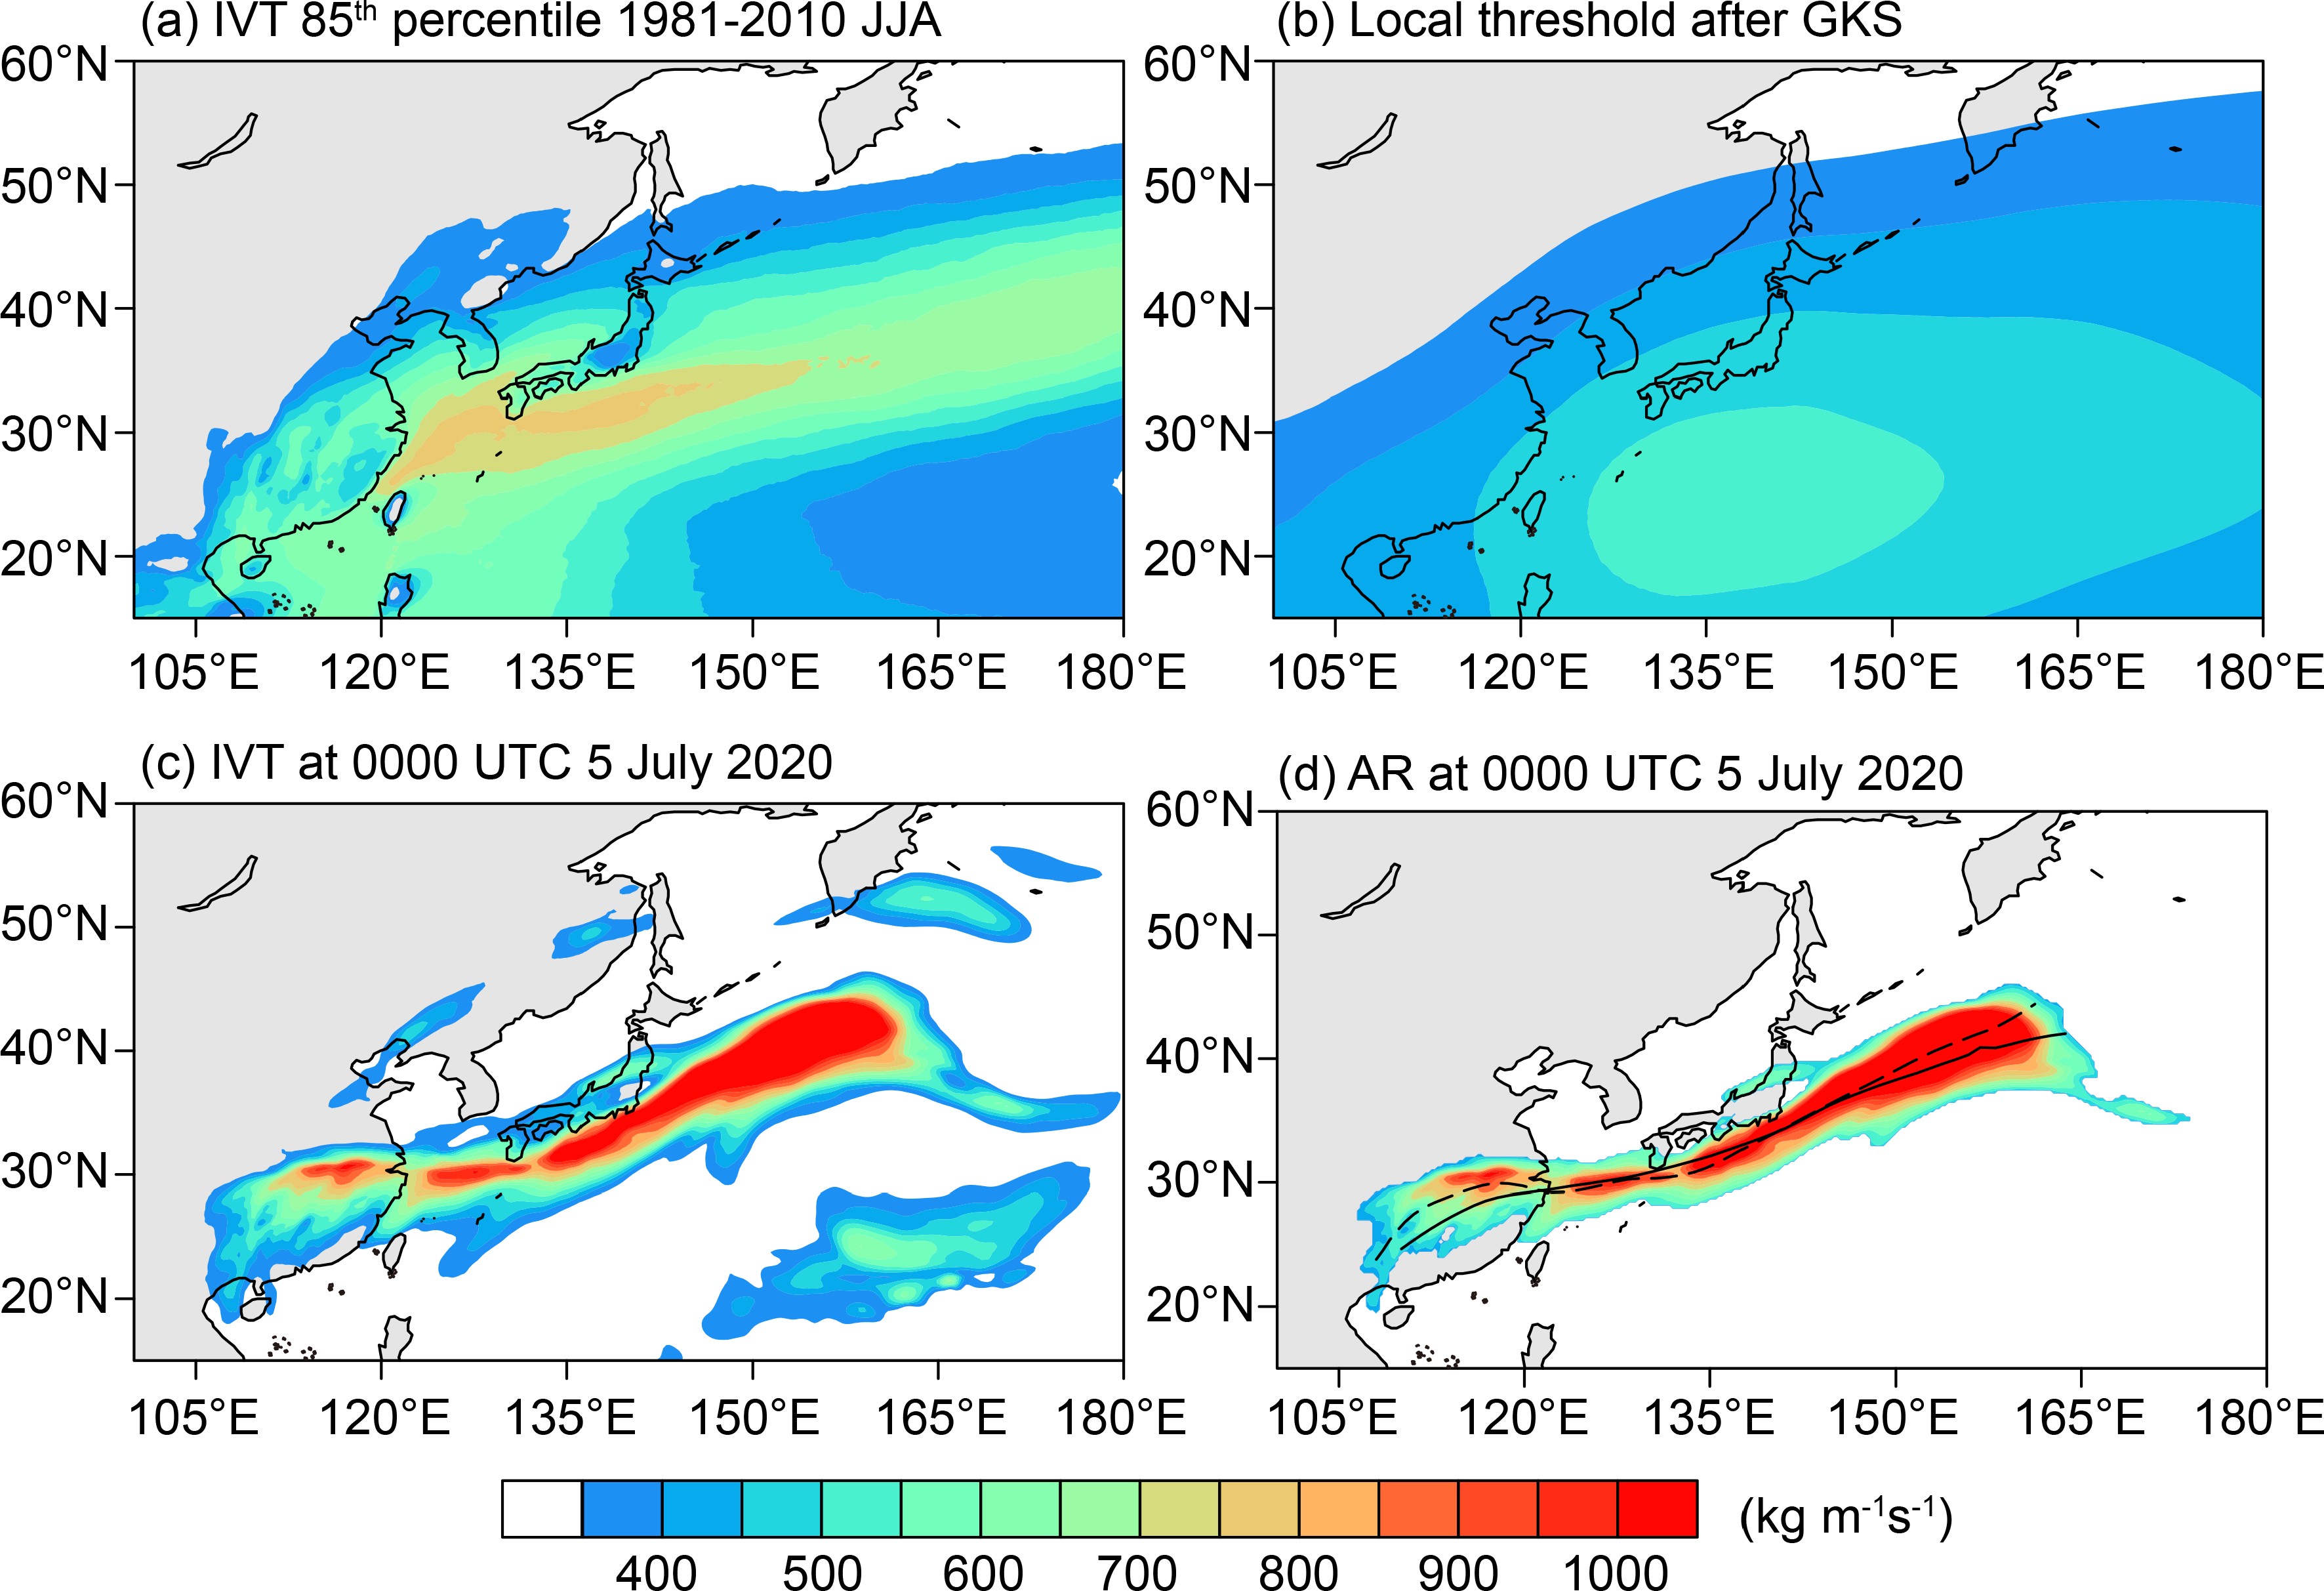 Figure1. The thresholds and algorithm to identify an AR (atmospheric river). (a) The 85th percentile IVT (integrated water vapor transport) field in the AR detection region (100°E to 180°E, 15°N to 60°N) from 1981 to 2010 (JJA, June, July, and August). (b) The local threshold by applying the Gaussian kernel density smoothing method to the 85th percentile of the IVT field. (c) The IVT field at 0000 UTC 5 July 2020. (d) The detected AR pathway based on the IVT field in (c) and its trajectories identified by the method of
 The second step of the algorithm is to generate trajectories of these AR preliminary pathways, as shown in Fig. 1d. Trajectories are regarded as the core of water vapor transport in this study, instead of being representative of the center of AR mass as in PL19. Therefore, four adjustments are made in the process of generating trajectories. 1) In this study, the weights are determined by 10% nearest neighbors (NN10) rather than 30% used by PL19. 2) Both distance-based weight and IVT-based weight are considered while determining the weighted IVT direction, rather than only distance-based weight as in PL19. 3) This algorithm moves 50 km when searching the next reference grid, instead of 100 km as in PL19, providing more smoothing to the trajectory. This difference is mainly due to the different spatial resolutions of IVT, which are 0.25° × 0.25° (this study) and 0.5° × 0.5° (PL19). 4) Only IVT-based weight is considered while determining the location of weighted centroid rather than using both distance-based and IVT-based weights as in PL19. More details about this step and the discussions about these adjustments are provided in the Appendix. The performances of the adjustments are illustrated in Fig. 1d, with the dashed line representing the adjusted algorithm and the solid line for PL19. Apparently, the dashed line (the adjusted algorithm) fits the core of IVT better and longer than the solid line (the original algorithm).
The third step is to compute AR metrics based on the trajectories and eliminate unqualified preliminary AR pathways. The length of the trajectory is regarded as the length of the AR, with the width defined as its total area divided by the length. The ratio of length to width is defined as length/width ratio (L/W ratio), and the mean direction of IVT can be calculated by
where IVTU,i (IVTV,i) is the zonal (meridional) component of IVT at the ith grid of the AR pathway. The preliminary AR pathways with a length less than 2000 km or a L/W ratio less than 2 are regarded as unqualified ARs and are eliminated. More information about the algorithm can be found in PL19. East China frequently experiences typhoon activity in summer. However, issues resulting from typhoon activity are not considered in this study since few typhoons reached the Yangtze-Huaihe River basin during the mei-yu period of 2020.
3
2.2.2. Definition of AR frequency
In this study, AR frequency is defined as the fraction of the number of time steps at which an AR appears to the number of all the time steps, in terms of percentage. For example, the month of June has 30 days with a total of 120 time steps, and if an AR appeared at 60 time steps at one grid in June, then the AR frequency at this point is 50%.3
2.2.3. AR-related precipitation
For each day, an overlapped region is identified where the 24-hour accumulated precipitation is over 15 mm and an AR pathway passes through it. Then this overlapped region is extended outward until the precipitation no longer exceeds 10 mm. This region is identified as the AR-related precipitation region. The solid red contour in Fig. 2 shows the AR-related precipitation on 5 July 2020 as an example. Additionally, the days when 24-hour precipitation is over 0.1 mm are defined as wet days, which include AR-related wet-days and AR-unrelated wet-days. For each grid, AR-related wet-days mean that the precipitation at this grid is determined as AR-related precipitation on those days. The intensity of AR-related precipitation (IAR) and AR-unrelated precipitation (Inon-AR) is defined as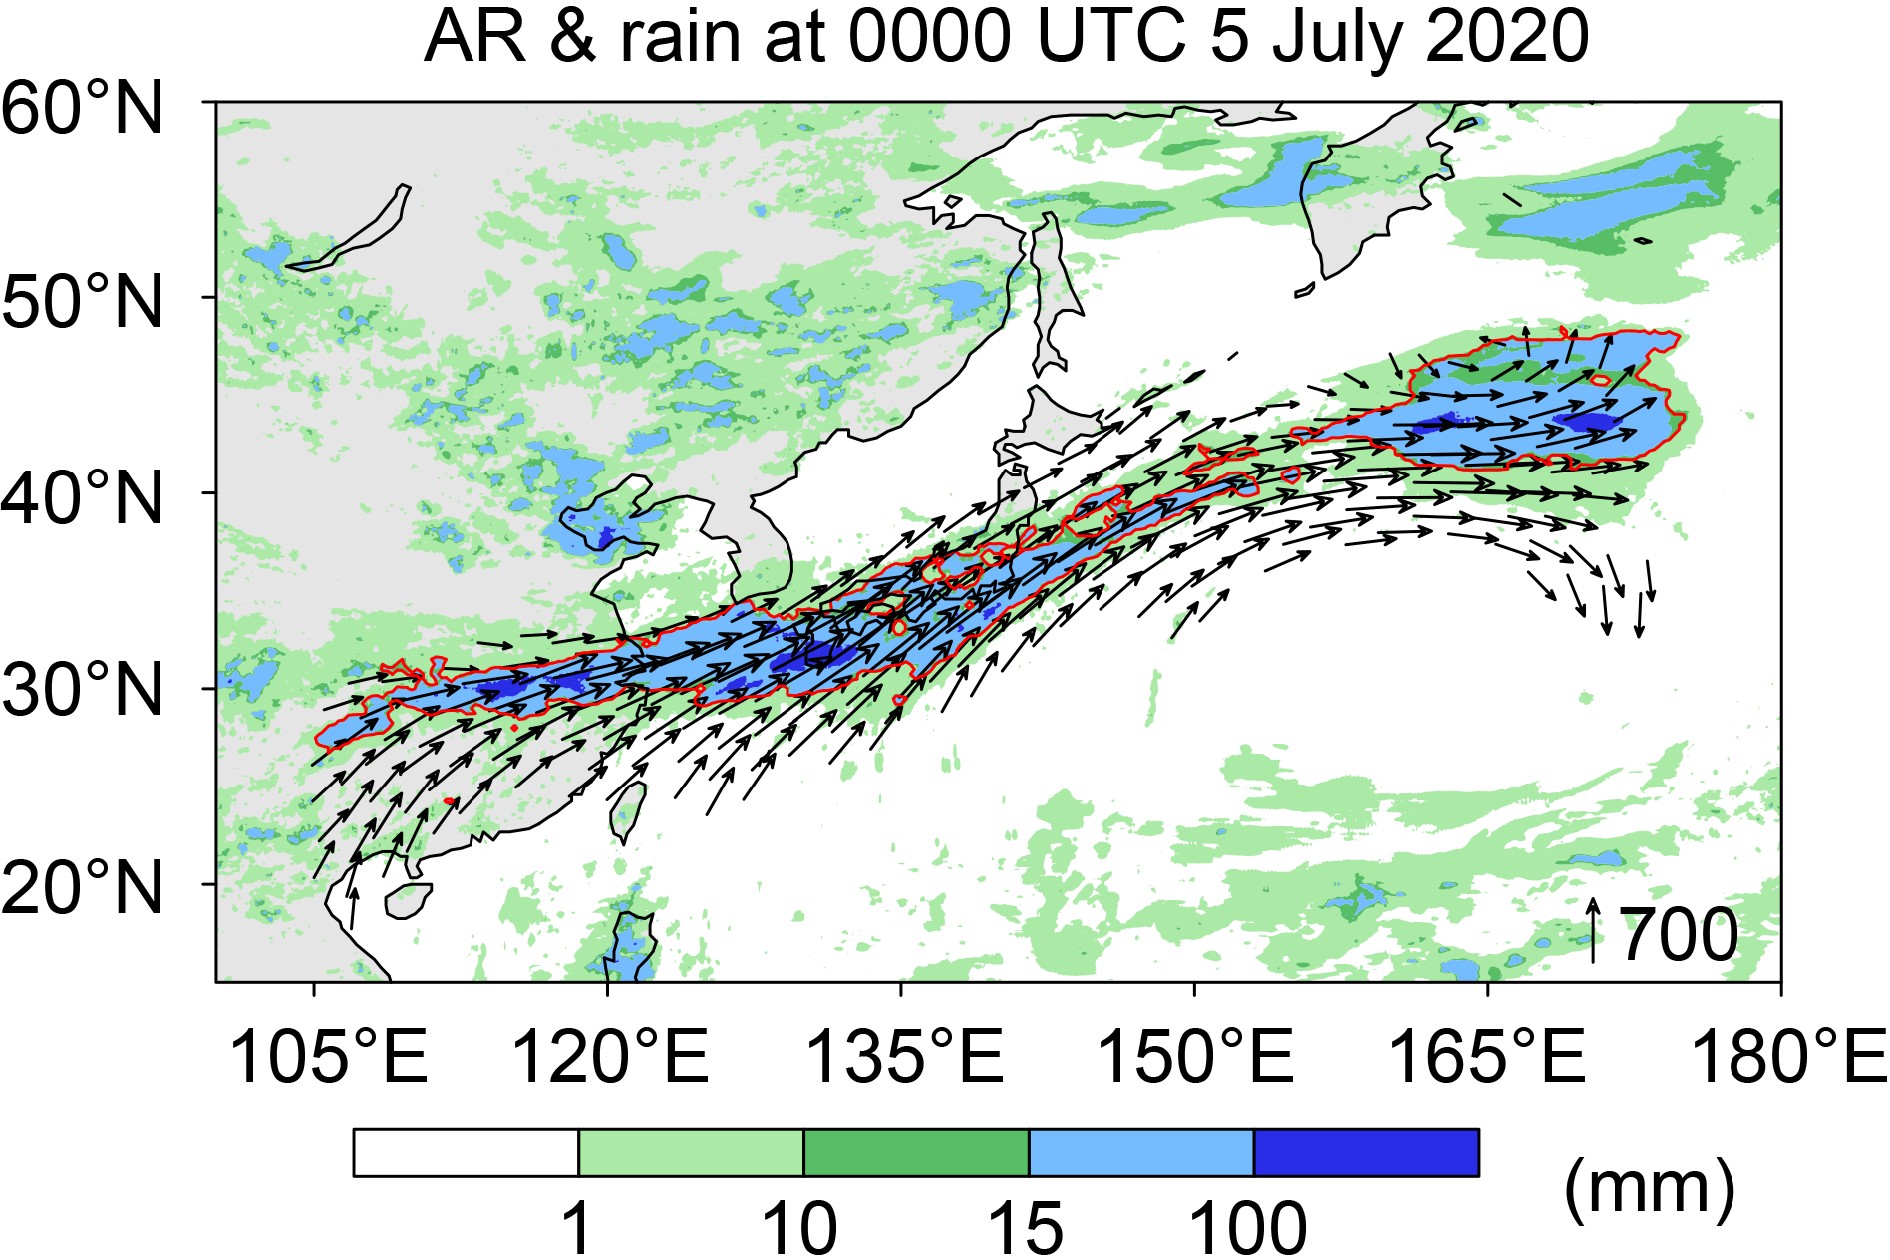 Figure2. The AR and the AR-related rainfall at 1200 UTC 5 July 2020. The AR-related integrated water vapor flux (vectors, units: kg m?1 s?1), the 24-hours accumulated precipitation (shadings, units: mm), and the AR-related rainfall region (red solid contour).
where IAR (Inon-AR) represents the intensity of AR-related (AR-unrelated) precipitation, PAR means the total AR-related precipitation, Ptotal represents total precipitation over all wet-days, DAR is the number of AR-related wet-days, and Dwet-days denotes the number of total wet-days.
3
2.2.4. Frontogenesis
According to the Miller Frontogenesis Formula (Miller, 1948), two-dimensional scalar frontogenesis F is defined aswhere θ is equivalent potential temperature and Vh represents horizontal wind. In practical application, the Petterssen Frontogenesis form (Keyser et al., 1988; Cordeira et al., 2013) is used:
where D denotes horizontal divergence, E represents resultant deformation, and

During the summer of 2020, ARs were active in June with a frequency of 30%–70% (Fig. 3a) and in July with a frequency of 20%–60% in the Yangtze-Huaihe River basin (Fig. 3b). In August, the AR frequency in this area decreased rapidly to 20%–30% (Fig. 3c), with different spatial distribution in Eastern China than in June and July (Fig. 3d), consistent with previous studies (Kim et al., 2020; Liang and Yong, 2020). Kim et al. (2020) suggested that the association between ARs and precipitation in August is not as strong as in June and July. The summer intraseasonal variation of AR activities implies that ARs are more related to the mei-yu season than the whole summer, since mei-yu rainfall happens mainly in June and July.
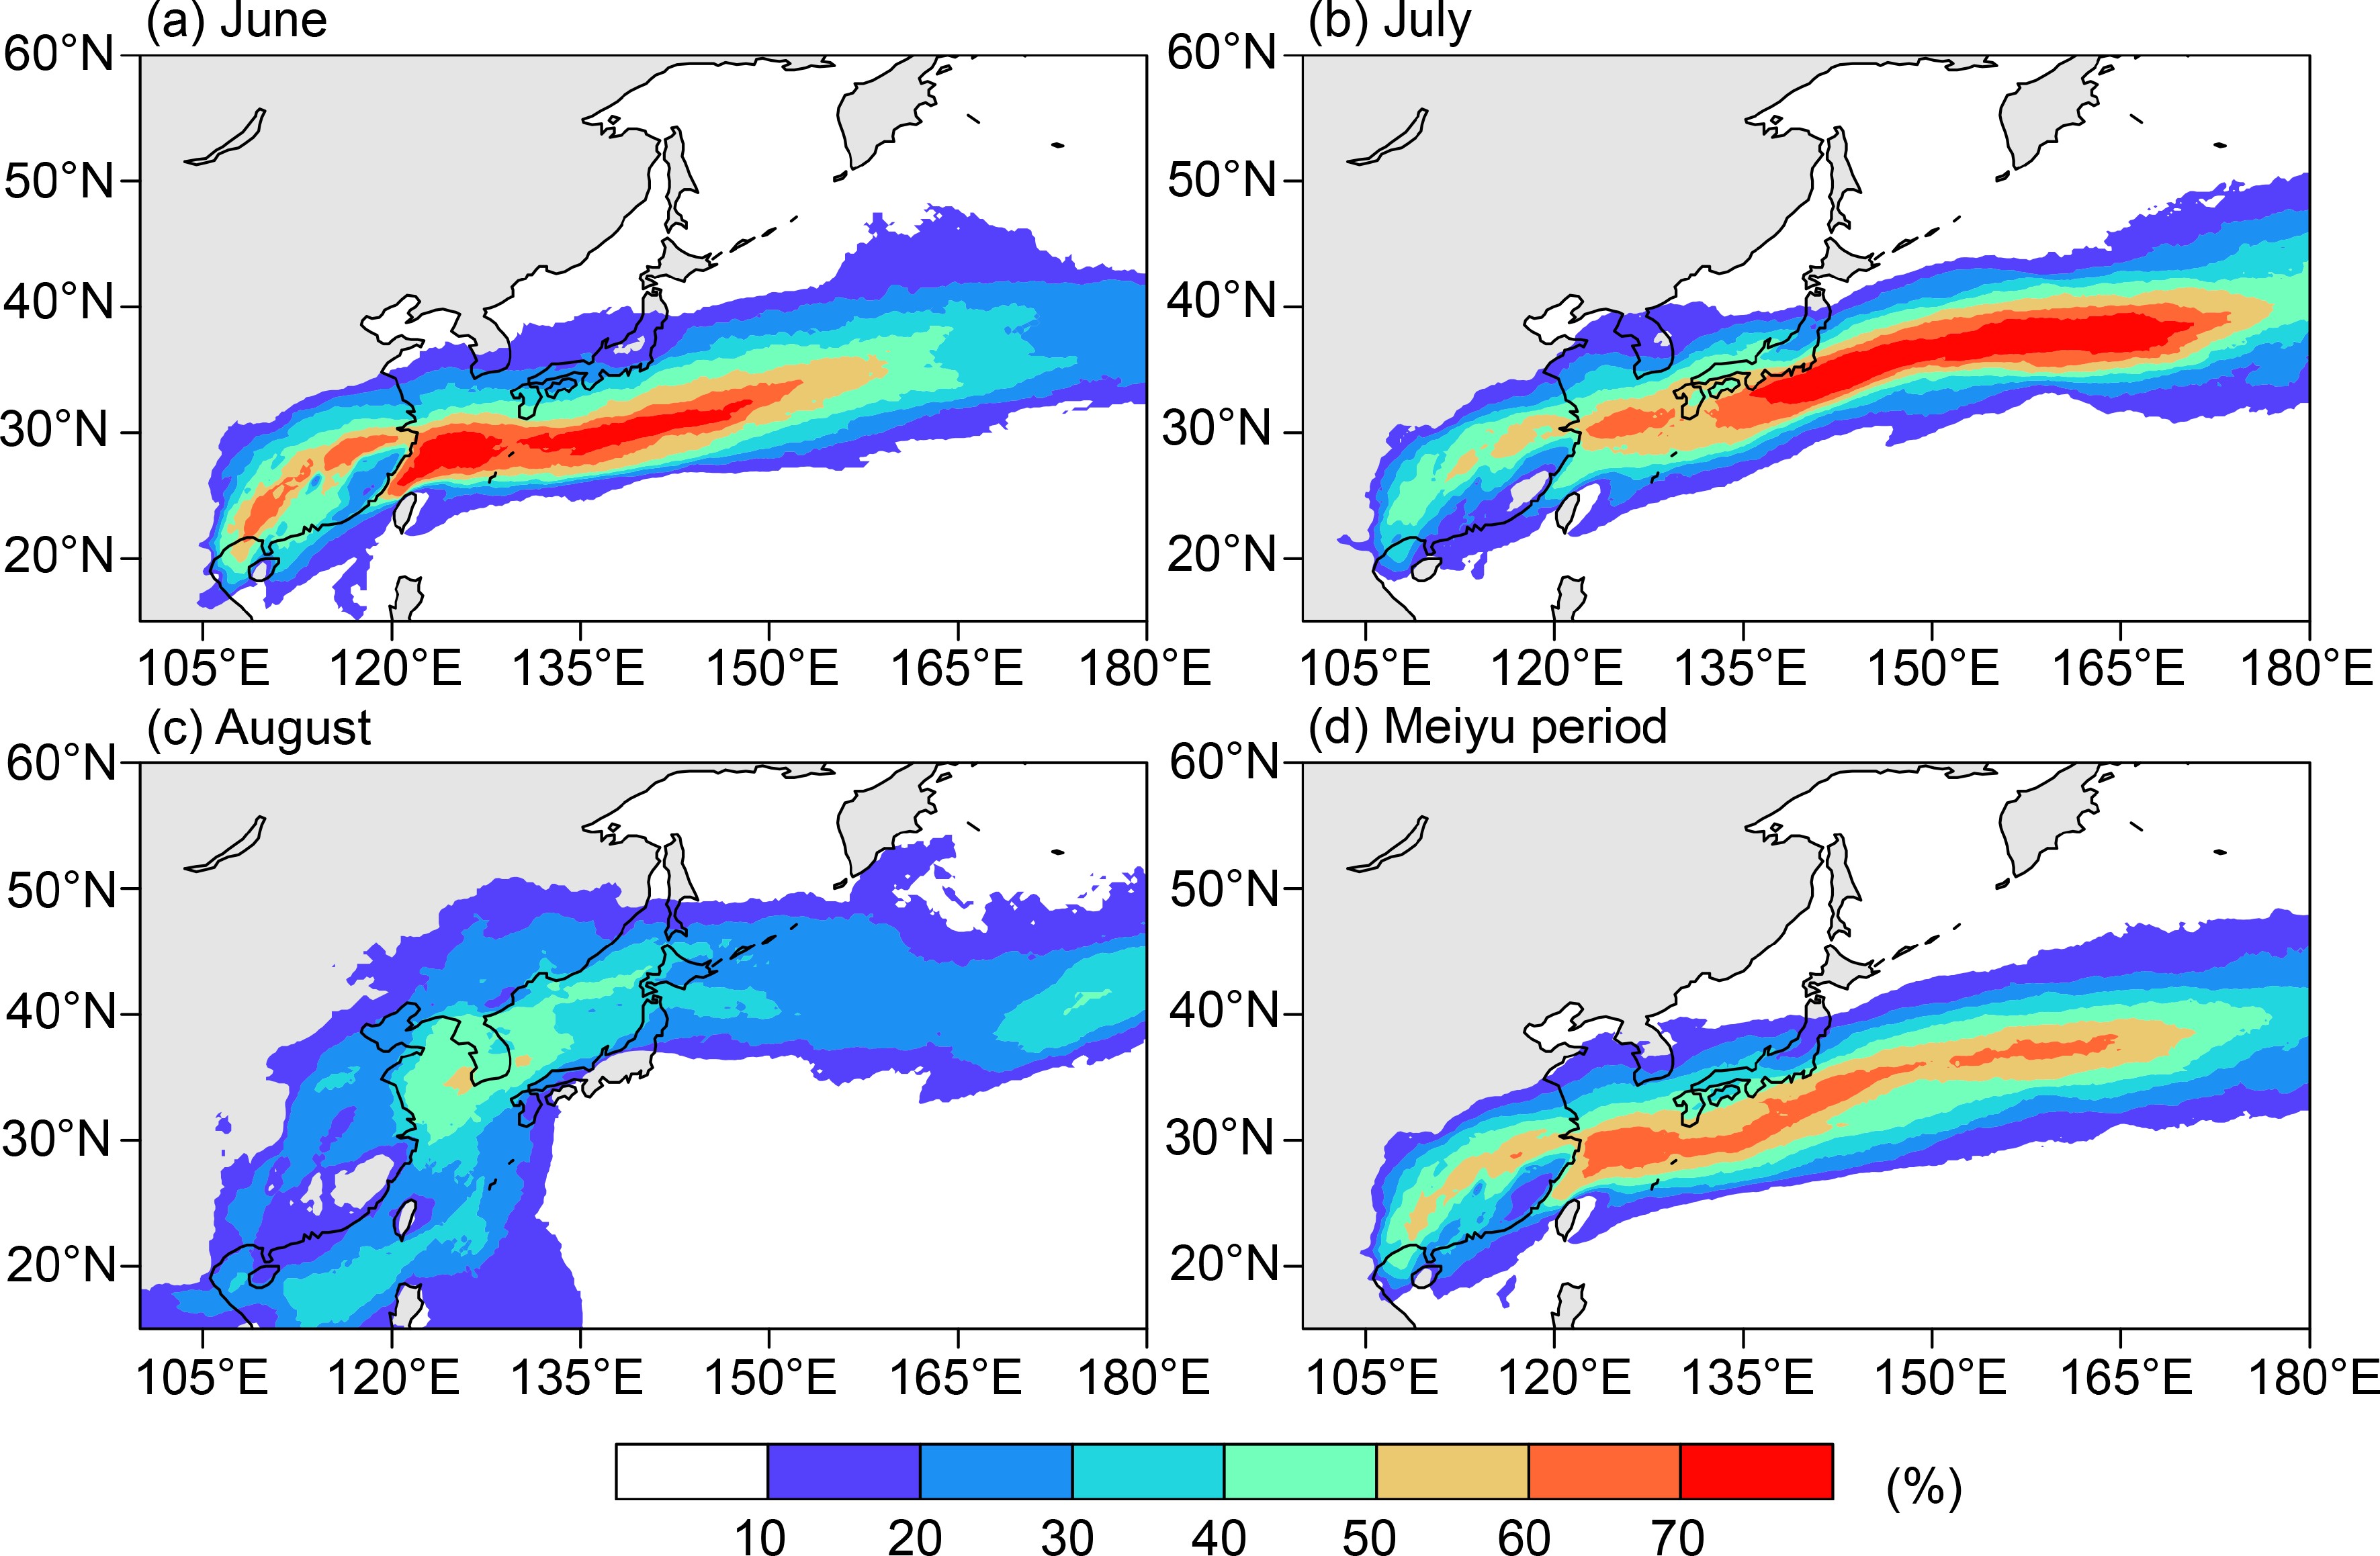 Figure3. Distribution of AR frequency in (a) June, (b) July, (c) August, and (d) June and July 2020. The frequency is defined as the percentage of the number of time steps that an AR appears.
However, according to Kim et al. (2020), the average AR frequency during 1979–2015 was 15%–20% in June and 20%–30% in July in the YHRB. Besides, there were 20 days with AR activity in June and 17 days in July in the YHRB in 2020, while according Liang and Yong (2020), only 14 days had ARs in June and 13 days in July in East Asia (22.5°–55°N, 100°–150°E) during 1979–2017. The frequencies of AR activity reported here are larger than those reported by the two previous studies, and there are two possible reasons: i) the water vapor transport in June and July of 2020 is stronger than climatology in East Asia, which has been confirmed by Liu and Ding (2020); ii) the AR detection algorithm employed here can capture ARs more effectively than the methods used by these two previous studies. For example, the horizontal water vapor transport over East Asia at 0000, 0600, 1200, and 1800 UTC 22 July 2015 was enhanced, with an IVT maximum over 1000 kg m?1 s?1 (S1), far more than the IVT threshold (250 kg m?1 s?1) commonly used for AR detection (Rutz et al., 2014; Shields et al., 2018). The algorithm used in this study could capture ARs at all four time steps (S2), while the methods of the other studies missed the AR at 0000 UTC 22 July 2015 (S3). Apparently, the climatology of AR frequency is highly sensitive to the detection methods chosen by researchers, just as Rutz et al. (2019) have discussed in a study trying to quantify the uncertainties in AR climatology.
In terms of the spatial distribution of AR-related precipitation, Figs. 4a–d show that the rainband extended along the north side of the AR, with a maximum of over 100 mm d?1. Meanwhile, if non ARs passed through the YHRB, the precipitation there was weaker (< 25 mm) with sparse distribution, as shown in Figs. 4e–f. This suggests that ARs are more likely related to high-impact heavy rainfall in East Asia than non ARs, consistent with the conclusion by Kamae et al. (2017). Already, some work has been devoted to improving forecast skill for ARs and understanding the predictability associated with ARs (Cordeira et al., 2017; Cannon et al., 2020; Ralph et al., 2020; Cordeira and Ralph, 2021), which may help us to better forecast extreme mei-yu rainfall in East Asia.
 Figure4. The comparison between the AR-related rainfall (a–d) and AR-unrelated rainfall (e–f). Shadings are the 24-hours accumulated precipitation (units: mm), and vectors are the AR-related integrated water vapor flux (units: kg m?1 s?1). (a) 1200 UTC 12 June 2020, (b) 1200 UTC 27 June 2020, (c) 1200 UTC 5 July 2020, (d) 1200 UTC 6 July 2020, (e) 1200 UTC 9 June 2020, and (f) 1200 UTC 30 July 2020.
During the mei-yu period of 2020, rainfall peaked in the lower reaches of the Yangtze River with accumulated precipitation of over 1000 mm and a maximum of 1776.6 mm, followed by southeast China, the Yunnan-Guizhou Plateau, North China, and Northeast China between 200–400 mm (Fig. 5a). The AR-related precipitation was concentrated in the YHRB, with a maximum of 1707 mm (Fig. 5b). The fraction of AR contribution to total precipitation was 70%–90% (Fig. 5e) in this region, owing to the high frequency of ARs in the mei-yu season of 2020 in the YHRB and the close relationship between ARs and mei-yu rainfall. Moreover, the intensity of AR-related precipitation is larger than that of AR-unrelated precipitation. As shown in Fig. 5c, the former in the YHRB was up to 25–50 mm d?1 with some grids even beyond 50 mm d?1, while the latter was only 2–5 mm d?1 (Fig. 5d). And the former was 6–12 times as much as the latter in the YHRB (Fig. 5f). Therefore, it can be inferred that the AR-related precipitation is heavier and more hazardous than AR-unrelated precipitation, which is also consistent with the results of previous studies (Kim et al., 2020). Here, the contrast (6–12 times) between AR-related and AR-unrelated precipitation in the YHRB in the mei-yu season of 2020 is much more prominent than that reported by Kim et al. (2020), which is only 2–3 times for annual precipitation during 1979–2015. In terms of the climatology, the contribution of AR-related precipitation to total precipitation is 70%–80% during mei-yu seasons over the period 2001–16 (Fig. 6) in the Yangtze-Huaihe River basin, while in summer over these years, this fraction is 60%–70% (not shown). According to Liang and Yong (2020), the AR contribution to total precipitation in summer during 1979–2017 in East Asia was around 44%, and to extreme precipitation (top 1%), the AR contribution was up to 68%. Another study reports this value as 30%–60% (Kim et al., 2020) for summer over 1979–2015. The contribution calculated in this study is higher than the other two previous studies due to different choices of definitions of AR-related precipitation. In the study by Liang and Yong (2020), only the precipitation within 1.5° near AR-condition grids is regarded as AR-related precipitation. And Kim et al. (2020) define AR-related precipitation as the precipitation happening at the AR-condition grids. The comparison here indicates that the valuation of AR contribution to total precipitation is sensitive to the definition of AR-related precipitation, as has been raised by Rutz et al. (2019). More discussions about this definition are needed in the future since there is still no consensus about AR boundaries at present (Shields et al., 2018; Shields et al., 2019).
 Figure5. The contribution of ARs to precipitation in June–July 2020. (a) The total precipitation (units: mm). (b) The AR-related precipitation (units: mm). (c) The AR-related precipitation intensity (units: mm d?1). (d) The AR-unrelated precipitation intensity (units: mm d?1). (e) The percentage of AR-related precipitation to total precipitation (%). (f) The ratio of the AR-related precipitation intensity to the AR-unrelated precipitation intensity.
 Figure6. The contribution of ARs to precipitation during the mei-yu seasons of 2001–16. (a) The percentage of AR-related precipitation to total precipitation (%). (b) The ratio of the AR-related precipitation intensity to the AR-unrelated precipitation intensity.
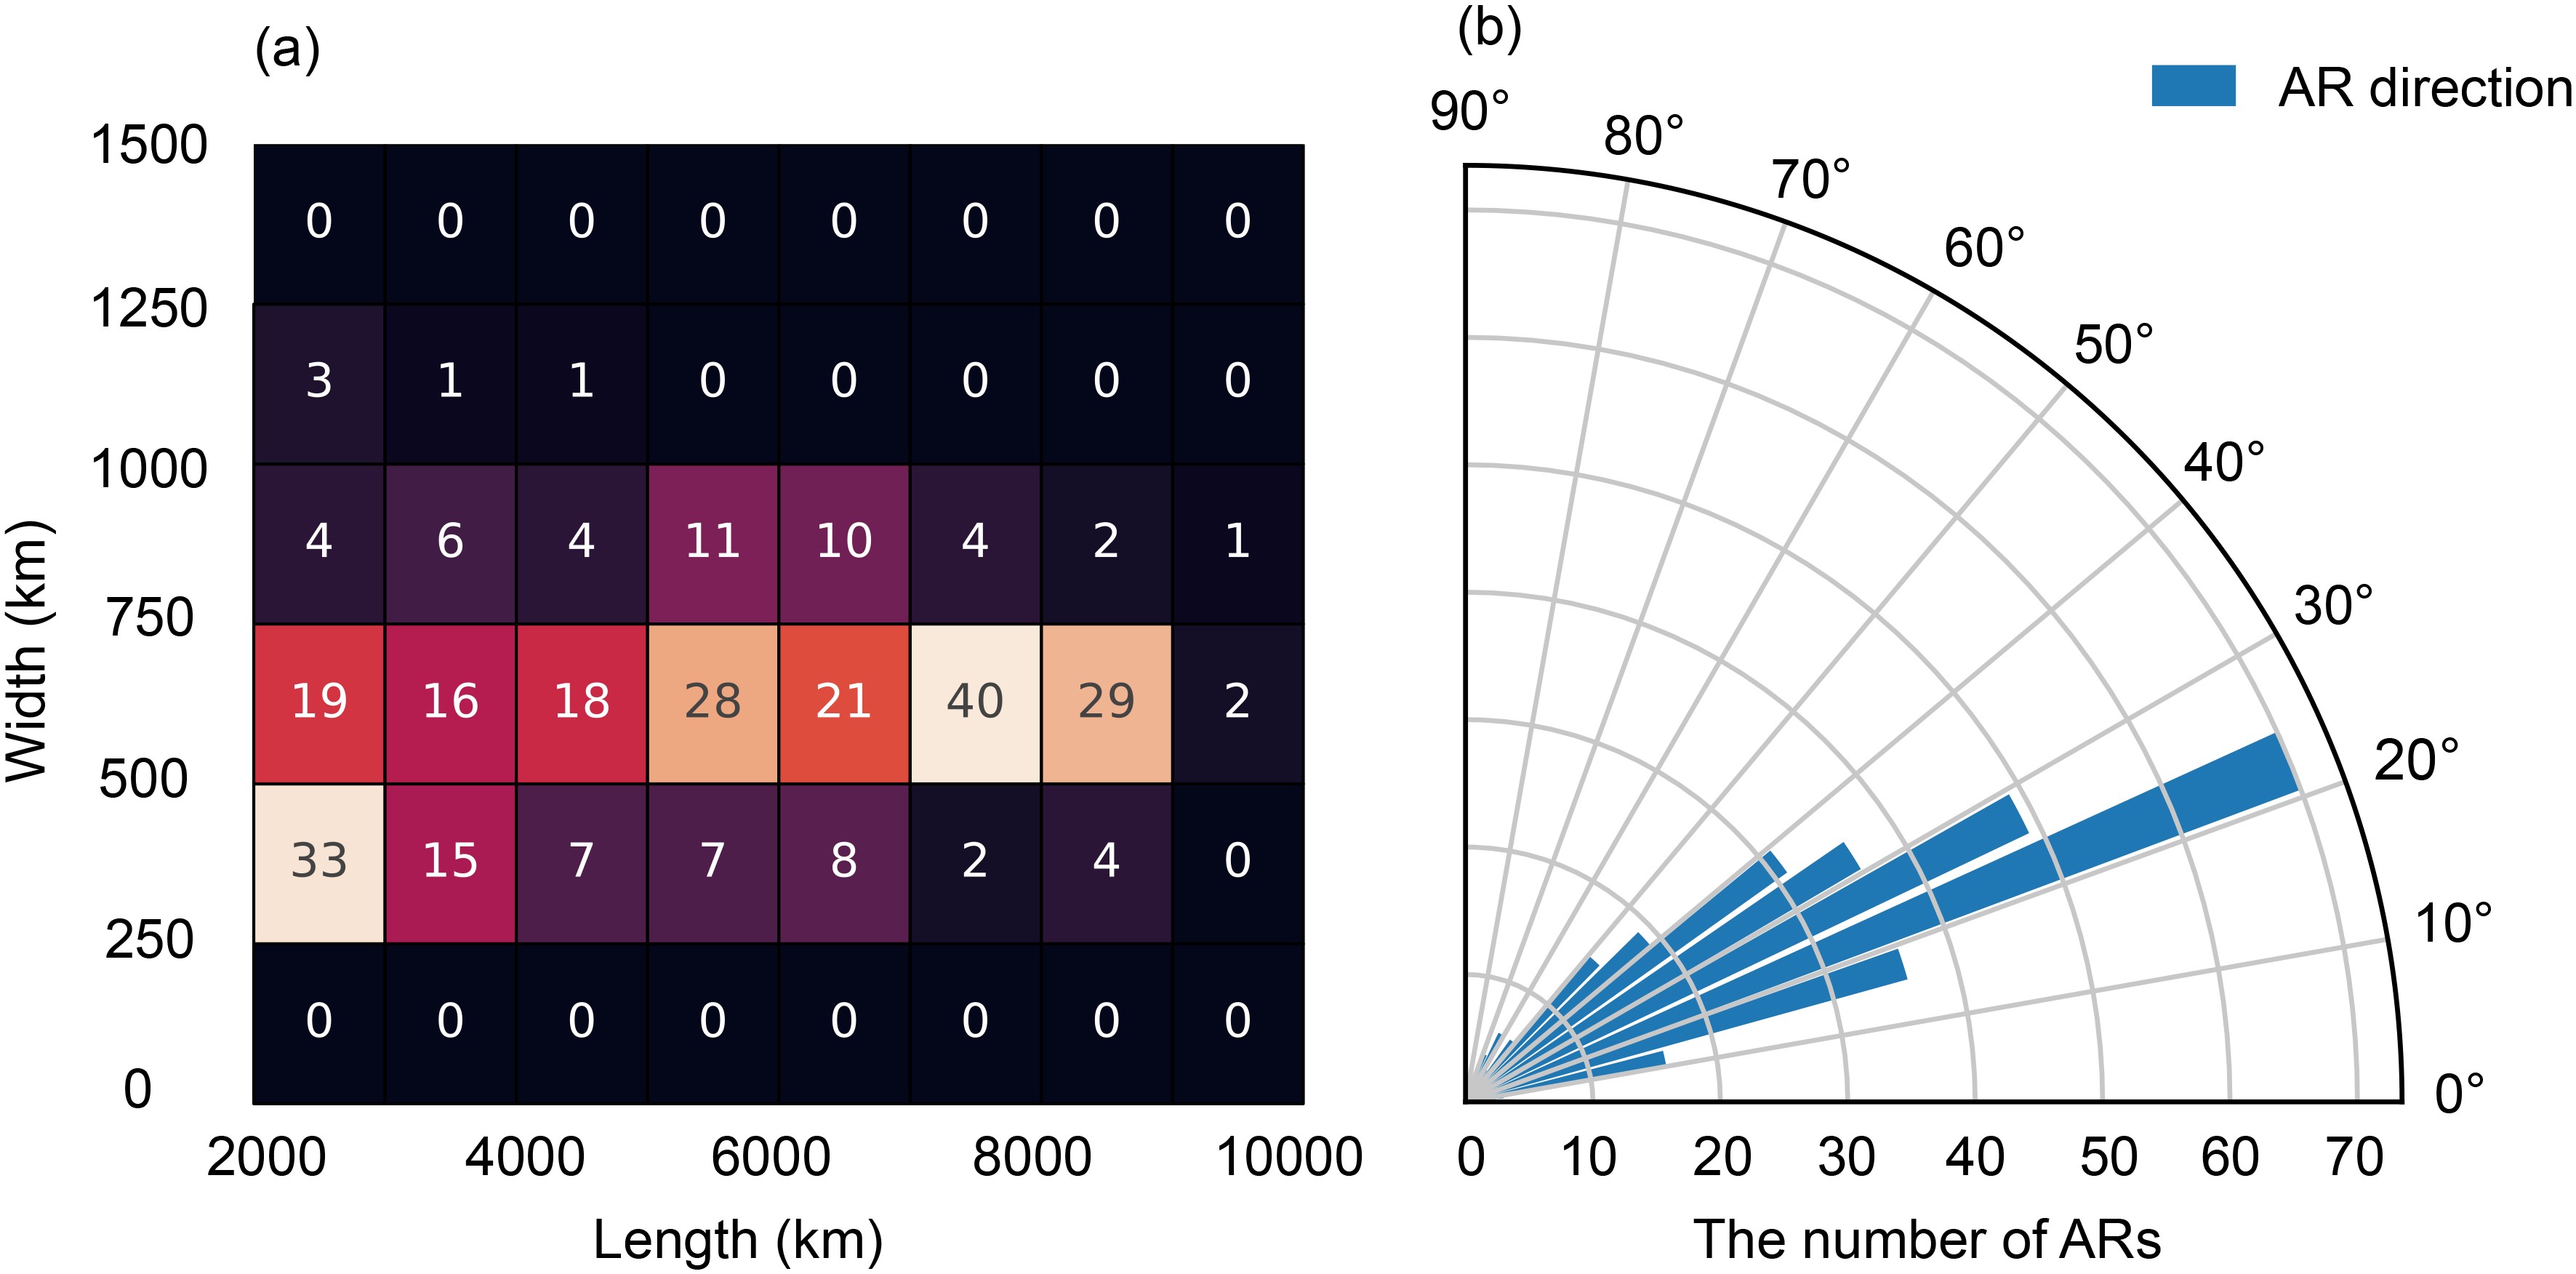 Figure7. The statistic characteristics of AR metrics during June–July 2020. (a) Bivariate density plot of length and width. (b) Polar histogram of mean IVT (integrated water vapor transport) direction.
In 2020, the Yangtze-Huaihe River basin (YHRB) in China witnessed 10 precipitation events during the mei-yu season (Chen et al., 2020). In particular, the rainfall during early July was much heavier than any other precipitation event, and the main rainband resided over the middle and lower reaches of the Yangtze River, which coincided with AR activity. Therefore, this period is chosen as an example for further exploration of the relationship between mei-yu rainfall and East Asian ARs by analyzing the evolution of ARs and their associated environment.
Represented by the magnitude of IVT, ARs reside between 20°–50°N during 2–8 July 2020, extending from the Yangtze-Huaihe River basin, through Japan to central North Pacific (Figs. 8a–o). The maximum AR IVTs, usually used to define the intensity of ARs (Guan and Waliser, 2015; Ralph et al., 2019), all exceeded 1250 kg m?1 s?1. At 1200 UTC 1 July, ARs had not affected the area of the Yangtze-Huaihe River basin yet (not shown). At 1200 UTC 2 July, the AR upstream area dominated Southeast China with a length of 8163 km and a width of 642 km, narrower than it was on 1 July (Fig. 8a). Meanwhile, the downstream area was located in the central North Pacific, with IVT maximum at around 150°E, which represents the core of the AR. The downstream area moved to 165°E and weakened at 1200 UTC 3 July (Fig. 8d) and then faded away by 1200 UTC 4 July (Fig. 8g). At the same time, a new IVT maximum center formed between the estuary of the Yangtze River and southern Japan on 3 July and moved to 150°E at 1200 UTC 4 July (Figs. 8d, 8g). During 5–8 July, the IVT maximum of the AR continuingly moved eastward (Figs. 8j, 8m), and the forward speed of the AR core is about 10° d?1 during 2–8 July.
 Figure8. The AR evolution during 2–8 July 2020. Left column: AR-related IVT (shadings, units: kg m?1 s?1), 850-hPa horizontal wind (pennant = 25 m s?1, long barb = 5 m s-1, and short barb = 2.5 m s?1, plotted with a magnitude > 7 m s?1), and 850-hPa geopotential height (contours). Middle column: AR-related vertical integrated water vapor flux (vectors), latent heat (shadings according to the green-red color bar, units: K d?1), 700-hPa frontogenesis [shadings according to the gray color bar, units: K (100 km)?1 d?1] calculated using equivalent potential temperature, and the WNPSH denoted by the 500-hPa 588 dagpm contour. Right column: AR-related IVT (shadings, units: kg m?1 s?1), 200-hPa irrotational wind (vector, magnitude > 20 m s?1, units: m s?1), and 200-hPa wind speed (contours, CI = 10 m s-1 beginning at 40 m s?1). The A–A’ lines indicate the cross section of Fig. 9.
Meanwhile, low pressure systems such as extratropical cyclones and a short-wave trough dominated the north side of the AR. More specifically, at 1200 UTC 3 July 2020, a trough was located between the East China Sea and southern Japan in conjunction with the IVT maximum of the AR at its south (Fig. 8d). As the trough moved to ~145°E at 1200 UTC 4 July, the IVT maximum moved to 145°E too (Fig. 8g), and then to 165°E at the south of the trough at 1200 UTC 5 July (Fig. 8j). When the trough intensified to be an extratropical cyclone at 1200 UTC 8 July (Fig. 8m), the water vapor transported by the related AR was steered around the extratropical cyclone. In another case study, it was revealed that eastward propagation of extratropical wave packets (EWPs) from western Asia is responsible for the formation of synoptic eddies, such as the trough, in the Pacific (Ralph et al., 2011). These EWPs are able to deeply penetrate toward the equator, which enables poleward water vapor transport along an AR (Knippertz, 2007). Moreover, it has been found that the water vapor transport within ARs is modulated by Rossby wave breaking (Liu and Barnes, 2015; Hu et al., 2017). Therefore, the eastward propagation of East Asian AR cores seems closely related to baroclinic waves in midlatitudes.
At the south side of the AR, the western North Pacific subtropical high (WNPSH, outlined by the contour of 5880 gpm at 500 hPa) maintained its location between 25°–30°N, with the ridge extending westward over 110°E (Figs. 8b, e, 8h, 8k, and 8n). In previous studies, the WNPSH is found to be related to the formation of the mei-yu front and mei-yu rainfall (Dai et al., 2020), since it can steer the moisture from tropical oceans to mei-yu rain belts near the Yantze River (Cheng et al., 2019; Lee et al., 2013). Dai et al. (2021) employed a self-organizing map approach to derive the onset dates of different stages of the East Asian monsoon and found that the WNPSH plays important roles in mei-yu season onset. Apparently, both ARs and mei-yu seasons are the effects of the presence of the WNPSH. Pan and Lu (2020) construct an all-season East Asia Atmospheric River catalog and find that AR main routes march with the northward displacement of the WNPSH during the East Asian summer monsoon season. Therefore, East Asian ARs are not merely the corridor of water vapor transport, but also the key zone of tropical–extratropical interactions in East Asia.
Along the AR was a belt of latent heating (Figs. 8b, 8e, 8h, 8k, and 8n), consistent with the spatial distribution of daily accumulated precipitation (not shown). The maximum latent heating was located at the east of the AR IVT maximum and moved eastward along with the IVT maximum during 3–5 July 2020 over the North Pacific. The latent heating resulted from strong ascent along the AR and, in turn, affected the maintenance and intensity of the AR since it can influence the deepening of the extratropical cyclone (Pirret et al., 2016). Correspondingly, the North Pacific Jet (NPJ) at 200 hPa was located along the north edge of the AR (Figs. 8c, 8f, 8i, 8l, and 8o). Strong upper-tropospheric divergence, indicated by the 200-hPa irrotational wind, occurred within the equatorward entrance region of the NPJ and was responsible for the latent heating over the North Pacific, similar to the results of the study for winter ARs (Cordeira et al., 2013).
For the 3D structure, a cross section A–A’ (A: 38.5°N, 114°E; A’: 18.5°N, 119°E; the distance between A and A’ is 2276 km) in the Yangtze-Huaihe River basin is selected to investigate the AR-related meteorological elements, including water vapor, wind speed, equivalent potential temperature, and frontogenesis during 5–6 July 2020 (Fig. 9). The structure of the AR is indicated by horizontal water vapor transport, and the core of the AR is indicated by the maximum of water vapor on the cross section. The AR core was located near 30°N, 116.4°E, with the water vapor contour of 10 g m?1 s?1 Pa?1 below the 700-hPa level at 1200 UTC 5 July (Fig. 9a). For the following day of 6 July, the AR maintained its location near 30°N and intensified, as determined by the presence of the contour of 25 g m?1 s?1 Pa?1 (Fig. 9b). Obviously, the distribution of lower-level specific humidity (5 g kg?1, and 9 g kg?1) was similar between 5 July and 6 July. Since ARs are defined by both water vapor and wind, the enhancement of the AR on 6 July was mainly due to the intensification of wind speed in the lower troposphere with the presence of a strong low-level jet (>15 m s?1). Given such strong horizontal water vapor transport in the YHRB (near 30°N) on 5–6 July, heavy rainfall impacted this region, with intensities greater than 100 mm d?1 (Figs. 4c, 4d).
 Figure9. Cross sections of A–A′ lines in Fig. 4 during 1–8 July 2020. The left (right) end of the x-axis indicates point A (A′). Shadings according to the green-blue color bar are the horizontal water vapor transport (units: g m?1 s?1 Pa?1), and the shadings according to the gray color bar are the frontogenesis function (units: K (100 km)?1 d?1) calculated using equivalent potential temperature. The purple dashed contours are specific humidity (9 g kg?1, 5 g kg?1, and 1 g kg?1 from the lower-level troposphere to the upper-level troposphere). The red contours are for horizontal wind speed (the solid contours are for 12 m s?1, and the dashed contours are for 10 m s?1, 15 m s?1, 20 m s?1, 30 m s?1, and 40 m s?1), the gray solid contours are for equivalent potential temperature (CI = 4 K), and vectors are for the wind on the cross section (units: m s?1 for horizontal wind speed; 10?2 Pa s?1 for vertical velocity).
The composite AR analysis for 1–8 July 2020 shows that the AR has a length of 6265 km, a width of 670 km, an L/W ratio of 9.3, and a deflection of 24°, and the IVT maximum is over 1000 kg m?1 s?1 (S4). However, based on 21 typical ARs landing at the west coast of North America in winter, the composite AR is 2500 km long, with IVT maximum ~ 500 kg m?1 s?1 (Ralph et al., 2017a), which is much weaker than the composite AR in this study. In addition, the mei-yu front was generated on the north side of the AR where there was rising motion, and an upper-level jet prevailed in the upper-level frontal zone with a maximum speed of >40 m s?1 (S5). And the distribution of water vapor transport was asymmetric, characterized by more significant transport at the south side of the mei-yu front compared to the north. At the cross section A–A’ in the Yangtze-Huaihe River basin, 75% of horizontal water vapor transport in the AR is concentrated below 4 km, which is higher than the value of 3 km reported by Ralph et al. (2017a). However, the average flux of cross section A–A’ is 3.4 × 10⁸ kg s?1, which is weaker than the flux of 5 × 10⁸ kg s?1 reported by Ralph et al. (2017a). The reason for this difference is that they focus on the core of the AR, while this study focuses on the part of the AR in the Yangtze-Huaihe River basin, which is not the core for an East Asian AR. Based on the statistical analysis of AR metrics in June–July 2020 and the composite analysis of ARs over 1–8 July 2020, a schematic summary of the East Asian AR is presented in Fig. 10. Two features are highlighted in the schematic: i) the AR in East Asia is modulated by the WNPSH and coupled with several frontal systems including the quasi-stationary front at the upstream area of the AR, cold front near the core of the AR, and warm front perpendicular to the AR direction (Fig. 10a); ii) in the Yantze-Huaihe River basin, the horizontal distribution of AR water vapor tilts along the mei-yu front, and the core of the AR is characterized by the LLJ (>15 m s?1, Fig. 10b).
 Figure10. Schematic diagrams summarizing the structure and strength of an AR based on statistical analysis of AR metrics during June–July 2020 and composite analysis of ARs during 1–8 July 2020. (a) Plan view including a low pressure system and associated cold, warm, and stationary surface fronts. IVT is shown by color fill (magnitude: kg m?1 s?1) and direction in the core (white arrow). The WNPSH is denoted by the 500-hPa 5880 contour. The LLJ and the ULJ are denoted by the red arrows. The α is the angle between the East direction and the AR direction. The representative length scale of the AR and magnitude scale of IVT are shown. The position of the cross section shown in (b) is denoted by the black dotted line A–A’ in (a). (b) Vertical cross-section perspective, including the core of the water vapor transport in the AR (orange contours and color fill), the LLJ, specific humidity (green dotted contours), and horizontal wind speed (blue contours with the dotted contour for 12 m s?1). Magnitudes of variables represent an average midlatitude AR with lateral boundaries defined using the IVT threshold of 334 kg m?1 s?1 (Pan and Lu 2019). The diagrams are adapted from Ralph et al. (2017a).
Compared to previous studies (Kim et al., 2020; Liang et al., 2020) about East Asian ARs, the frequencies of ARs computed in this study are larger because of the water vapor transport in the 2020 mei-yu season being stronger than climatology (Liu and Ding, 2020). In addition, the climatology of AR frequency is sensitive to the differences in AR-detection methods (Rutz et al., 2019), which may be responsible for the difference here. Meanwhile, the contribution of ARs to mei-yu rainfall is also higher than that to non-mei-yu rainfall (Liang et al., 2020; Kim et al., 2020), due to different choices of definitions of AR-related precipitation. Therefore, both the climatology of AR frequency and AR contribution to precipitation are dependent on the method or definition chosen by researchers and deserves further study in the future.
To further explore the relationship between ARs and mei-yu, the spatiotemporal evolution of the AR that appeared in early July and the associated circulation is analyzed. Lying along the north side of the western North Pacific subtropical high (WNPSH) and modulated by the WNPSH, ARs reach from eastern China, through the Korea Peninsula and Japan, to the central North Pacific, transporting water vapor from tropical areas to mid or higher latitudes. Additionally, East Asian ARs are configured with low pressure systems such as troughs and extratropical cyclones in higher latitudes, and the cores of ARs move eastward with speeds of ~10°d?1, controlled by the low pressure systems. The mei-yu front is generated at the north side of the AR, and an upper-level jet appeared at the upper-level frontal zone. About 75% of the AR water vapor occurs below 600 hPa, with the presence of a low-level jet (LLJ) at 850 hPa.
Based on this study of the 2020 case, it can be concluded that ARs have significant impacts on mei-yu rainfall and are closely associated with mei-yu systems such as the WNPSH, mei-yu front, and LLJ. Although both ARs and LLJs imply strong winds, this does not mean that the concept of ARs can be replaced by the concept of LLJs. There are many benefits to introducing the concept of ARs to the study of mei-yu rainfall. First, detecting ARs from IVT fields is more effective than identifying LLJs from highly variable wind fields. Second, ARs represents water vapor transport directly and have a closer relationship with precipitation. Third, great progress on AR prediction has been made (Cordeira et al., 2017; DeFlorio et al., 2018; Cannon et al., 2020; Ralph et al., 2020; Cordeira and Ralph, 2021), implying great potential for the prediction of mei-yu rainfall. Therefore, the concept of ARs is not a substitute for LLJs, but an important supplement to the present framework of mei-yu rainfall.
The critical importance of AR activities for mei-yu rainfall in China has been emphasized in this study. However, the responsible underlying mechanism remains unclear and is worthy of more scientific attention. In addition, the water vapor of East Asian ARs comes from the Indian Ocean and the western North Pacific (Zhao et al., 2021), which also play vital roles in the precipitation in eastern China. As a bridge, ARs may transfer the variation signal of sea surface temperature from tropical oceans to China. Particularly, under the context of global warming, AR activities in East Asia and the impacts of ARs on mei-yu rainfall may have new characteristics, which could be studied by climate modeling.
Acknowledgements. This research was supported jointly by the National Key Research and Development Program (Grant No. 2016YFA0600604), the National Natural Science Foundation of China (Grant No. 4191101005 and 4181101164), and the Alliance of the International Science Organizations (Grant No. ANSO-CR-KP-2020-01). In this study, the ERA5 data were provided by the ECMWF and are available online at
To calculate the length and other geometric features of an AR, a smooth trajectory of each preliminary AR pathway needs to be generated in advance. Firstly, the maximum IVT grid “M” of the pathway is set as the first reference grid. At the grid “M”, the weighted IVT direction is determined by its 10% nearest neighbors (NN10), which are selected based on their geodistances from grid M. The 10% is the number of grids that account for 10% of all grids of the pathway. The equations to calculate the weighted IVT direction at grid M are:
where θ denotes the weighted IVT direction at grid M and IVTU (IVTV) is the zonal (meridional) weighted average IVT component of the NN10 (n grids in total). For the ith grid (i = 1,…,n), Wi is the weight considering both the IVT intensity and geographical distance; WD,i is the distance-based weight; Di is the distance from the ith grid to A; WIVT,i is the IVT-based weight; IVTi is the IVT intensity at ith grid. Dmax (Dmin) is the maximum (minimum) of {Di}, and IVTmax (IVTmin) is the maximum (minimum) of {IVTi}.
On the cross section, the weighted centroid “P” is identified as follows:
where yc is the location of the weighted centroid P. For the ith grid in the NN10, WIVT,i is the IVT-based weight defined by Eq. (5), WD,i is the distance-based weight defined by Eq. (6), and yi is the projected location on the cross section.
From the weighted centroid P, the algorithm moves 50 km along the weighted IVT direction then finds the second reference grid, which is used to find the second centroid based on the same processes described above. These processes are repeated until all centroids of the preliminary AR pathway are found; the trajectory can be obtained by connecting all the centroids.
To get a better trajectory of the AR pathway, four adjustments are made in this study: 1) In this study, the weights are determined by 10% nearest neighbors (NN10) rather than 30% used by PL19. And, PL19 discussed the sensitivity test about different choices of the percentage for nearest neighbors. In finer spatial resolution, the value of 10% is better than 30% for the trajectory to fit the local geometry of the AR pathway. 2) Both distance-based weight and IVT-based weight are considered while determining the weighted IVT direction, rather than only distance-based weight as in PL19. 3) The algorithm moves 50 km when searching the next reference grid, instead of 100 km as in (Pan and Lu, 2019), providing more smoothing to the trajectory. This difference is mainly due to the different spatial resolutions of IVT, which are 0.25° × 0.25° (this study) and 0.5° × 0.5° (PL19). 4) Only IVT-based weight is concerned while determining the location of weighted centroid rather than using both distance-based and IVT-based weights as in PL19. The performances of the different choices are illustrated in Fig. 1d, with the dashed line representing the adjusted algorithm and the solid line representing the choice in PL19. The results indicate that the adjustments made in this study can identify the AR pathway much closer to the maximum water flux axis (Fig. 1d).
