
 , GONG Qinghua1,2, YUAN Shaoxiong1,2, CHEN Jun1,2
 1. Southern Marine Science and Engineering Guangdong Laboratory(Guangzhou), Guangzhou 511458, China;
2. Guangdong Open Laboratory of Geospatial Information Technology and Application, Guangzhou Institute of Geography, Guangdong Academy of Sciences, Guangzhou 510070, China;
3. Science and Technology Library of Guangdong Province/Institute of Information Research, Guangdong Academey of Sciences, Guangzhou 510070, China
Received 1 November 2019; Revised 2 February 2020
Foundation items: Supported by the Key Special Project for Introduced Talents Team of Southern Marine Science and Engineering Guangdong Laboratory (Guangzhou), China (GML2019ZD0301), National Natural Science Foundation of China (41771024, 41977413), GDAS' Project of Science and Technology Development (2020GDASYL-20200301003, 2020GDASYL-040101, 2020GDASYL-20200102002), and Guangdong Provincial Science and Technology Program (2018B030324002, 2018B030324001)
Corresponding author: YU Yan, E-mail: yuyan10@mails.ucas.ac.cn
Abstract: According to the data from mountain torrent sites, the geospatial distribution regularity of mountain torrents was first explored. Second, six influencing factors such as relative relief, slope gradient, drainage density, stratigraphy, average annual 24-hour rainfall, and distance to rivers, were chosen to explore the relationship between torrents and these factors. The study area was classified into 179 801 grid cells, and each cell data of six factors was collected using ArcGIS software. Then, the statistical analysis of the quantity distribution and occurrence probability of torrents was carried out. The results showed that both the quantity and density of torrents in the Hanjiang River basin were the largest in Guangdong Province. In terms of administrative division, Meizhou has the largest quantity of torrents while Chaozhou has the highest density. Results also showed that relationships between the occurrence probability of torrents and the relative relief/slope/drainage density were described by y=a1eb1x+a2eb2x with different fitting constants while relationships between the occurrence probability and the stratigraphy/average annual 24-hour rainfall/distance to rivers could be described by y=aebx with different fitting parameters. The study results can provide basis for prevention and control of mountain torrents in Guangdong Province.
Keywords: mountain torrentsdistribution characteristicsinfluencing factorprobability methodGuangdong Province
广东省山洪灾害分布特征及关键影响因素分析
王钧1,2, 宇岩3

 , 宫清华1,2, 袁少雄1,2, 陈军1,2
 1. 南方海洋科学与工程广东省实验室(广州), 广州 511458;
2. 广东省科学院广州地理研究所 广东省地理空间信息技术与应用公共实验室, 广州 510070;
3. 广东省科技图书馆/广东省科学院信息研究所, 广州 510070
摘要: 基于已发山洪灾害数据,首先探讨山洪灾害的空间分异规律;其次基于山洪灾害形成的地形、物源、水动力条件,选择相对高差、坡度、水系密度、地层岩性、多年平均24h降雨和距水系距离6大主因子,定量分析山洪灾害与各因子之间的数量和概率相关关系。基于ArcGIS将广东省划分为179 801个网格,按网格分别统计每个因子中山洪灾害的数量和发生概率。结果表明:广东省山洪灾害数量和灾害密度最大的流域为韩江流域;行政区划上,梅州市山洪灾害数量最多,而潮州市山洪灾害密度最高;相对高差、坡度、水系密度与山洪灾害发生概率之间的相关关系可以用y=a1eb1x+a2eb2x模拟;地层岩性、多年平均24h降雨和距水系距离与山洪灾害发生概率之间的相关关系可以用y=aebx模拟。研究成果可以为广东省山洪灾害防治提供依据。
关键词: 山洪灾害分布特征影响因素概率模型广东省
Mountain torrents are sudden surface runoff with severe fluctuations, often caused by rainstorms in small watershed in mountain regions and accompanied by landslides, debris flows and collapses[1]. It is one of the most severe natural hazards around the world posing a severe damage to infrastructure, life, and property in the mountain area[2-3]. Due to the influence of global climate change and development of economy and society, the occurrence frequency and magnitude of mountain torrents have presented an increase trend in recent years[4-5]. For China, mountain torrents cause thousands of people death and hundreds of million yuan economic losses each year. For example, from June 3 to 10, 2019, Guangxi, Jiangxi, Fujian, Guangdong suffered different degrees of torrents induced by heavy rainfall, causing 83 deaths, 6.75 million people affected, more than 15 000 houses damaged and about 10-billion-yuan economic loss[6]. On June 19, 2016, Zhenxiong town, Yunnan Province, a heavy rainfall triggered a large scale of torrents causing more than 300 households and 2 000 people affected and 4 people died[7]. For Guangdong Province, according to the statistics from Guangdong Provincial Hydrographic Bureau, mountain torrents directly threaten 770 000 urban populations and 3.08 million rural populations in hilly and mountain areas, as well as enterprises with fixed assets of 3.12 billion yuan and annual output value of 33.15 billion yuan[8]. For instance, on June 10, 2019, a heavy rainfall caused mountain torrents in Heyuan city, Guangdong Province, resulting in 8 people died and 3 people injured, 114 550 people affected, 956 houses damaged, 14 540 people displaced, and direct economic loss of 600 million yuan[9]. Therefore, the research of distribution characterises and key influencing factors of mountain torrents aimed to mountain torrents mitigation is extremely important.
The extent and magnitude of mountain torrents are controlled by various factors related to geology, lithology, topography, meteorology and hydrology, soil, vegetation, and human activity[10]. The formation mechanism is complicated and still lacking the reasonable theories, which limits the research progress on mountain torrents forecasting[11]. However, mountain torrents are the result of interactions between rainfall and various background factors. Previous researches have highlighted the impact of various factors on the manifestations of mountain torrents, including meteorological, hydrological and geomorphological parameters. Some scholars have found that the meteorological characteristics of heavy rains affect the occurrence of mountain torrents, especially in small mountainous watershed areas[12-13]. The research also showed that hydrological processes, including mountain torrents, were greatly affected by topography, such as slope, watershed area and hydrogeological parameters[14]. For example, Diakakis, et al.[10] tested the statistical correlation between mountain torrents and environmental factors by using the method of binary logistic regression. Lee et al.[15] applied a bivariate statistical analysis method to determine the relationship between environmental factors and the occurrence of mountain torrents. Pradhan et al.[16] studied the relationship between mountain torrents and multivariate variable by using the multivariate regression method. Currently, many researchers have devoted to this issue. However, the distribution characteristics of mountain torrents and their relationships with environmental factors in Guangdong Province have not been discussed in detail.
The overall objective of the study is to explore the geospatial distribution regularity of mountain torrents and relationships between occurrence probability of mountain torrents and various factors in Guangdong Province. The spatial distribution regularity of mountain torrents was explored first from the perspective of river basins, municipal administrative regions and disasters scales. Then, the examined factors on spatial distribution of mountain torrents were selected based on the formation mechanism. Finally, the relationship between occurrence probability of mountain torrents and the examined factors was put forward.
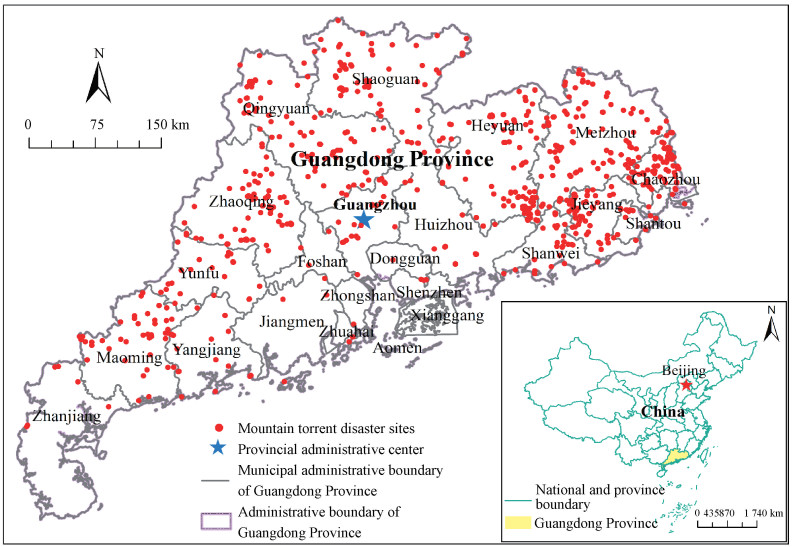
1 Study area1.1 Geographical locationGuangdong Province is located in the southernmost part of mainland China, which extends from 20°13′ N to 25°31′ N latitude and 109°39′ E to 117°19′ E longitude. The geographical location is shown in Fig. 1. The land area of Guangdong Province is approximately 179.80×10³ km2 and the island area is about 1 592.7 km2[17].
Fig. 1
 | Download: JPG larger image |
This map is based on the standard map downloaded from the standard map service website of the Ministry of Natural Resources (No. GS(2019)1671 and GS(2019)3266), and the base map has not been modified. Fig. 1 The location of the study area | |
1.2 TopographyAffected by the combined effect of crustal movements, lithology, faulted structures, and external forces, the landform types in Guangdong Province are complex and diverse, with mountains, hills, terraces, plains, and waters, accounting for 33.6%, 24.8%, 14.3%, 21.8%, and 5.5% of the province’s land area, respectively[18]. The overall terrain of Guangdong Province is high in the north and low in the south. Its northern part is mostly mountainous and high hilly. In the south, it is plain and terraced, with the largest is the Pearl River Delta plain. The slope angles are mainly small than 5°, accounting for 42.92% of the total slope area. The steep slope above 20° is account for 16.36% of the whole land area. Using the digital elevation model (DEM) with 30 m resolution, the statistical analysis of the slope in Guangdong Province can be obtained (Table 1).
Table 1
| Table 1 Slope statistical table of Guangdong Province |
1.3 Geological settingsThe bedrock rocks making up all kinds of landforms are most common in granite, sandstone and metamorphic rocks, and there is a large distribution of limestone in north-western Guangdong. In addition, there are some unique red rock series, such as the famous Danxia Mountain. Danxia Mountain and Huguangyan in western Guangdong have been rated as World Geoparks. The coastal areas along the river are mostly Quaternary sedimentary layers, which are material basis of the cultivated land resources[19].
1.4 ClimateThe study area belongs to the East Asian monsoon region. It is a mid-subtropical, south-subtropical and tropical climate from North to South. The province’s average sunshine hours are 1 745.8 h, and the annual average temperature is 22.3 ℃. Guangdong Province has abundant rainfall, with an average annual precipitation of between 1 300 and 2 500 mm, and an average of 1 777 mm[20]. The rainfall is mostly bimodal during the year. The main peak is in May and the secondary peak is in August. The precipitation is sever unevenly distributed. The precipitation amount of the monsoon season from April to September accounts for more than 80% of the whole year. June to October each year is the main period affected by typhoons and tropical depressions which are generally accompanied by heavy rains triggering landslides, torrents, debris flows, and other disasters in mountainous regions.
1.5 Overview of mountain torrentsControlled by various factors related to geology, lithology, topography, meteorology and hydrology, soil, vegetation, and human activity, mountain torrents are extremely developed and are distributed widely in Guangdong Province. Through extensive data collections and field works of mountain torrents, we eventually identified more than 3 000 recorded disaster sites (Fig. 1). The collected data mainly come from the provincial, municipal, and county government departments. Field works included field investigations, remote sensing image surveys, and unmanned aerial vehicle surveys. We also establish an information database based on GIS, recording the key information of these mountain torrents, such as geographic coordinates, disaster categories, scales, threat objects, potential losses, disaster treatments, and occurred times. The major mountain torrents in recent years are shown in Table 2. For instance, on June 10, 2019, a heavy rainfall caused mountain torrents in Heyuan city, Guangdong Province, resulting in 8 people died and 3 people injured, 114 550 people affected, 956 houses damaged, 14 540 people displaced, and direct economic loss of 600 million yuan[9].
Table 2
| Table 2 Examples of mountain torrents in Guangdong Province |
2 Materials and methods2.1 Geospatial distribution regularity of mountain torrentsWith the support of geographic information system (GIS), the study area was classified into 179 801 grid cells first. According to the identified mountain torrent sites as well as their recorded key information, the mountain torrent information for each grid was determined by using spatial statistical analysis function of ArcGIS. Then, the geospatial distribution regularity of mountain torrents can be further analysed by counting the information of each grid. Due to the short time span, the temporal variability of mountain torrents is not discussed, but the spatial variability characteristics of mountain torrents in river basins, municipal administrative regions and disasters scales is discussed in detail providing a basis for the spatial control of mountain torrents in Guangdong Province.
2.2 Selection of examined factors affecting mountain torrentsGenerally, the formation of mountain torrents is high related with the topographic, material and hydrodynamic conditions. The following is a detailed description of selection of key influencing factors affecting mountain torrents in Guangdong Province.
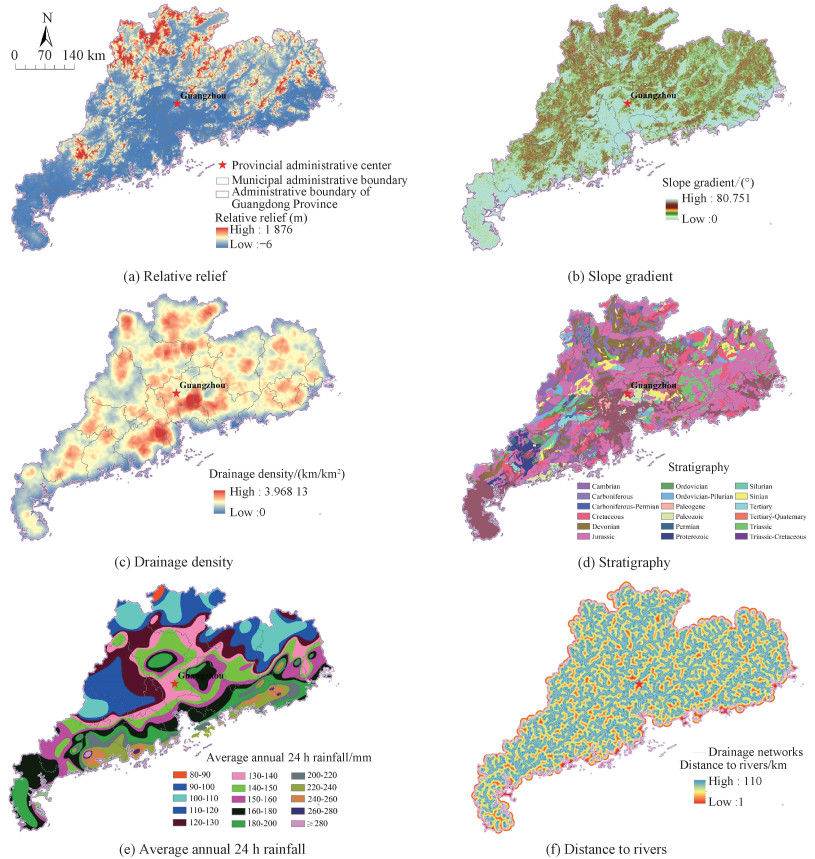
2.2.1 Topographic conditionThe influence of the topographic condition on the convergence process and evolution directly affects the formation of mountain torrents[21]. Among these factors, the relative relief, slope and drainage density are the most important ones. The relative relief is controlling the energy of mountain torrents movement. Slope gradient provides energy conversion for the movement of mountain torrents. The drainage density affects the occurrence possibility of mountain torrents and the ground convergence. The complexity and diversity of landform types of the study area provide the favourable topographic condition for the formation and movement of mountain torrents. In our analysis, the relative relief (Fig. 2(a)), slope gradient (Fig. 2(b)) and drainage density (Fig. 2(c)) are chosen as the key factors to describe the topographic condition which are derived from the DEM with 30 m resolution.
Fig. 2
 | Download: JPG larger image |
Fig. 2 Figures of the six key factors in Guangdong Province | |
2.2.2 Material conditionThe occurrence of mountain torrents must have certain material conditions. The amount of loose solid material is a key factor of material condition because it not only determines whether a torrent could occur, but affects the critical rainfall triggering mountain torrents. In general, the stratigraphic lithology controls the loose solid material formation and affects mountain torrents formation[22]. The soils with weaker corrosion resistance developed by granite weathering, shale, mudstone, sandstone and shale in the hilly areas of Guangdong Province are widely distributed, combined with unreasonable production methods of humans, resulting in a large amount of loose solid materials. Under the combined affection of storms and runoff, it is easy to produce mountain torrents in the mountain region. Therefore, the lithology is chosen as a key factor describing the material condition (Fig. 2(d)). Based on the lithology of the study area, the lithology can be classified into five classes reflecting the resistance to weathering and sensitivity to mountain torrents (Table 3).
Table 3
| Table 3 The divided categories of stratum lithology in Guangdong Province | |||||||||||||||||||||||||||
2.2.3 Hydrodynamic conditionSudden and persistent heavy rain is the basic driving force for the formation, dumping and erosion of mountain torrents. Generally, the 24-hour rainfall is one of the most important rainfall parameters presenting a high correlation with the mountain torrents occurrence[23]. The distance to the river is also an extremely important factor affecting mountain torrents formation. To some extent, it represents the intensity of human activity and the development of mountain torrents. Therefore, the average annual 24-hour rainfall (Fig. 2(e)) and the distance to river (Fig. 2(f)) are selected as key factors to describe the hydrodynamic conditio.[24] and the latter is derived from drainage network vector data derived from the 30 m DEM.
In summary, key factors influencing the formation of mountain torrents in Guangdong Province are selected as relative relief, slope gradient, drainage density, stratum lithology, average annual 24-hour rainfall, and distance to the river in this paper. With the support of GIS, the information of each selected factor for each grid (in total 179 801 grids) can be determined by using the spatial statistical analysis method.
2.3 Relationships between mountain torrents and key influencing factorsThe statistical analysis method was used to analyse the quantity distribution and occurrence probability of mountain torrents. Since the watershed area of mountain torrents ranges from less than 1 km2 to more than 100 km2, it is obviously not appropriate to use the mountain torrent site as a unit of statistical analysis. Therefore, the size of studied grid cell must be conformed first. According to related statistics, the mountain torrents in Guangdong Province mainly occur in a small watershed with a catchment area of less than 10 km2[25]. The result is similar to the study result of the whole China derived from Li et al.[26]. Therefore, the calculated grid cell in this study was fixed into 1 km2 (1 km×1 km) and the whole Guangdong Province was classified into 179 801 grid cells. The information of selected factors for each grid can be obtained in ArcGIS. The probability statistic calculated as follows:
| ${P_i} = \frac{{{N_i}}}{{{S_i}}}, $ | (1) |
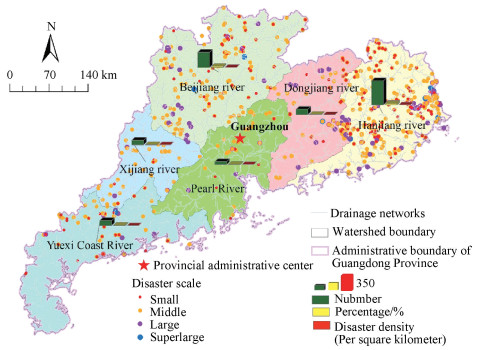
3 Results and discussion3.1 Distribution characteristics of mountain torrents3.1.1 Watershed distribution characteristicsAccording to the drainage network characteristics of Guangdong Province, the area can be divided into six major river basins: Hanjiang River, Beijiang River, Xijiang River, Dongjiang River, Yuexi Coast River, and Pearl River. Then the number, proportion, and disaster density in each river basin were counted, respectively (Fig. 3). It is found that the number of mountain torrents in the Hanjiang River basin is the largest, accounting for 42.16% of the total, followed by the Beijiang River basin, and the Pearl River basin is the least, the number is only 5.13% of the total. In terms of the disaster density, the Hanjiang River basin has the highest disaster density, reaching 0.021/km2, followed by Beijiang River basin, Xijiang River basin, Dongjiang River basin, Yuexi Coast River, and Pearl River Delta.
Fig. 3
 | Download: JPG larger image |
Fig. 3 Statistical result of mountain torrents in six basins | |
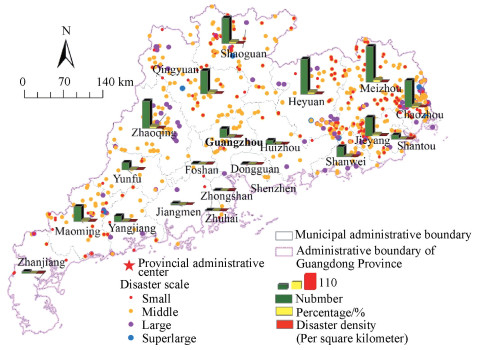
3.1.2 Distribution characteristics of administrative regionsAccording to the municipal administrative boundaries of Guangdong Province, the number, proportion, and disaster density of mountain torrents in each administrative region were counted respectively in ArcGIS (Fig. 4). As shown in Fig. 4, we can find that the number of mountain torrents in Meizhou is the largest, accounting for 14.19% of the total, followed by Heyuan, Zhaoqing, Chaozhou, Shaoguan,and Qingyuan, total accounting for 54.72%, Shenzhen and Zhuhai have the least number. However, in terms of disaster distribution density, Chaozhou has the highest disaster density, reaching 0.045 8/km2, followed by Jieyang, Meizhou, Heyuan, Shanwei, and Shantou.
Fig. 4
 | Download: JPG larger image |
Fig. 4 Statistical result of mountain torrents scale in the municipal administrative regions | |
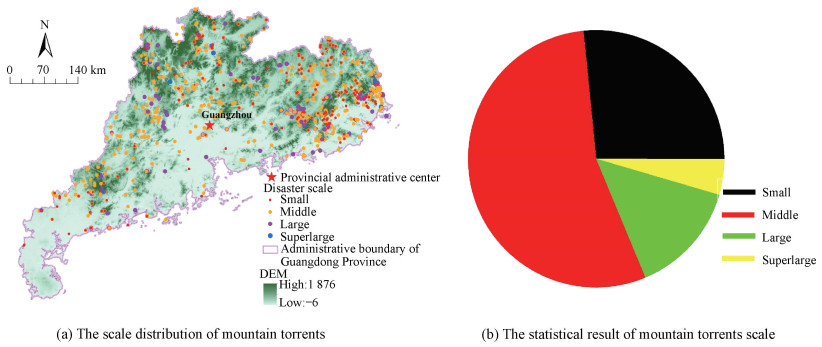
3.1.3 Distribution characteristics of disaster scaleWe counted the scale of occurred mountain torrents which could be divided four categories: small, medium, large, and super large scales (Fig. 5(a)). The statistically analysis result is in Fig. 5(b). It is found that medium-sized mountain torrents are the most, accounting for 54.68% of the total number, and widely distributed throughout the mountain or hill areas. The super large-scale disasters have the least distribution, only accounting for 4.53%.
Fig. 5
 | Download: JPG larger image |
Fig. 5 Statistical analysis figures of mountain torrents in Guangdong Province | |
3.2 Relationships between mountain torrents and key influencing factors3.2.1 Relative reliefThe relative relief of each grid cell was classified into 28 categories with Natural Breaks (Jenks) method in ArcGIS. The number of mountain torrents in each class was counted. It can find that the distribution of mountain torrents by category is skewed showing a trend of increasing first and then decreasing. About 80% mountain torrents are distributed in the relative relief less than 200 m.
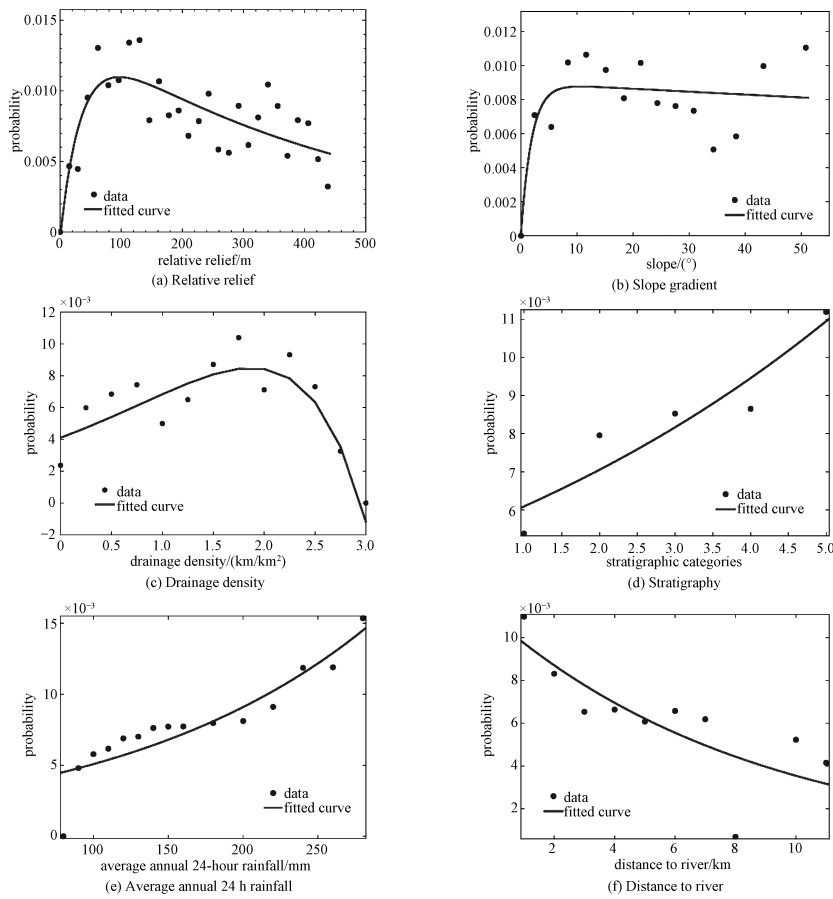
To further explore the most favourable interval of relative relief for mountain torrents, the occurrence probability of mountain torrents under various categories of relative relief can be obtained by using (1), seen in Fig. 6(a). The occurrence probability of mountain torrents increases first and then decreases with the increase of relative relief. The probability has one peak when relative relief reaches about 100 m. When the relative relief reaches about 100 m, the probability reaches maximum and then sudden drops. The relationship between relative relief and occurrence probability can be expressed as
| $y = {a_1}{{\rm{e}}^{{b_1}x}} + {a_2}{{\rm{e}}^{{b_2}x}}, $ | (2) |
 | Download: JPG larger image |
Fig. 6 Relationships between the occurrence probability of mountain torrents and the six key factors | |
where y is the occurrence probability of mountain torrents and x is the relative relief. Eq.(2) is a fitted model using MATLAB software (R2010a). The curve is as Fig. 6(a) when a1=0.014 7, b1=-0.002 2, a2=-0.015 2, b2 =-0.029 2 with 95% confidence bounds and 0.636 9 R2.
3.2.2 Slope gradientThe slope of each grid cell was classified into 15 categories with Natural Breaks (Jenks) method in ArcGIS. The number in each category of slope was counted. It can be found that the distribution of mountain torrents by categories is also skewed and can be expressed by a generalized exponential distribution. About 64% mountain torrents are distributed in grid cells of slope less than 10°.
The probability of mountain torrents under various categories of slope was obtained according to (1) (Fig. 6(b)). When the slope is less than 10°, the probability increases sharply with the increase of slope and then decrease slowly when the slope is more than 10°. The relationship between the slope categories and the probability ca be fitted as
| $y = {a_1}{{\rm{e}}^{{b_1}x}} + {a_2}{{\rm{e}}^{{b_2}x}}, $ | (3) |
3.2.3 Drainage densityThe drainage density can be divided into several categories with the equal range of 0.25 km/km2. The number of torrents increases with the increase of drainage density and then decreases when the value exceeds 1.75 km/km2. About 64% are distributed within the drainage density less than 1.75 km/km2.
The probability of torrents in each category was calculated using (1) which can be seen in Fig. 6(c). The occurrence probability increases with the increase of drainage density and then sudden drops when the value exceeds 1.75 km/km2. The relationship between drainage density and the probability is fitted as
| $y = {a_1}{{\rm{e}}^{{b_1}x}} + {a_2}{{\rm{e}}^{{b_2}x}}, $ | (4) |
3.2.4 StratigraphyThe strata can be divided into five categories according to the Table 2. The number of mountain torrents among these categories was counted in ArcGIS. It is found that the third category has the largest number of torrents and the first category has the least number.
The probability of mountain torrents under each stratigraphic category can be seen in Fig. 6(d). From Fig. 6(d), the probability of torrents increases with the increases of weakness of the stratigraphy. The weak and less resistant rock is more favourable for torrents. The relationship between stratigraphy and probability can be fitted as
| $y = a{{\rm{e}}^{bx}}, $ | (5) |
3.2.5 Average annual 24-hour rainfallThe average annual 24-hour rainfall of each grid cell can be divided into 15 categories based on the values derived from Ref. [24]. The number of mountain torrent in each class was counted in ArcGIS, from which we can find that the average annual 24-hour rainfall presents bimodal. The one peak is between 100 mm and 110 mm, and the other is between 150 mm and 160 mm. About 60% of mountain torrents are distributed with the average annual 24-hour rainfall ranging from 100 mm to 160 mm.
The probability occurring in various categories of average annual 24-hour rainfall is calculated according to (1) (Fig. 6(e)). As shown in Fig. 6(e), the occurrence probability of mountain torrents increases with the average annual 24-hour rainfall, indicating that the greater the rainfall, the more disasters are likely to occur. The relationship between the probability and the average annual 24-hour rainfall can be fitted as a model
| $y = a{{\rm{e}}^{bx}}, $ | (6) |
3.2.6 Distance to the riverDistance to the river can be divided into ten classes with an interval of 1 km. The number of mountain torrents among these categories is counted in ArcGIS. It is found that the number of mountain torrents is significantly decrease with an increase of distance to rivers. The mountain torrents are concentrated in the cells with distance to rivers between 0 km and 5 km, accounting for 65.84% of the total disasters.
The probability of mountain torrents by distance to rivers is calculated using (1), which can be seen in Fig. 6(f). The probability decreases with the increase of distance to rivers. The relationships between the distance to rivers and the probability can be fitted as
| $y = a{{\rm{e}}^{bx}}, $ | (7) |
As described above, the relationships between the occurrence probability of mountain torrents and various background factors in Guangdong Province can be descried by a generalized exponential distribution which can be seen in Table 4. The confidence bounds, RMSE, and R2 are also shown in Table 4.
Table 4
| Table 4 Relationships between mountain torrents occurrence probability and each background factors |
3.3 DiscussionAt present, there are many related researches on the temporal and spatial distribution characteristics and influencing factors of mountain torrents. For example, Xiong et al.[27] found that the spatial differences of mountain torrents in the Southwestern region were significant, and the distribution of disaster number showed a significant spatial positive correlation. Zhang et al.[28] found that the low-altitude small undulating mountains and hilly areas with a height of 200 m and a slope below 15 ° and a hilly area of 1 000 to 1 300 mm rainfall are high incidence areas of mountain torrents in Chongqing. It can be seen that the mountain torrent is closely related to its impact factors. In this paper, we explored the relationships between the number and probability of mountain torrents and impact factors and found that the relationship between probability and impact factors showed a generalized exponential model with different fitting constants. The number of mountain torrents, size of statistical grid, and uncertainty of selecting background factors are the main cause affecting the accuracy of the research result. Therefore, we will continue to collect mountain torrent sites, test the more important factors and modify the model parameters so that they can better reflect the actual situation and can be better applied to disaster mitigation.
4 Conclusions1) The number and disaster density of mountain torrents in the Hanjiang River basin are the largest compared with Beijiang River, Xijiang River, Dongjiang River, Yuexi Coast River, and Pearl River Delta. The number of mountain torrents in Meizhou is the largest, accounting for 14.19 of the total. However, Chaozhou has the highest disaster density. The super large-scale torrents are mainly distributed in the cities of Shaoguan, Heyuan, Zhaoqong, Chaozhou, Yunfu, and Gaozhou.
2) For relative relief, about 80% of mountain torrents are distributed in the grid cells with relative relief less than 200 m. For slope, about 64% of mountain torrents are distributed in cells of the slope less than 10°. For drainage density, the number and probability of mountain torrents increase with increasing drainage density and then drops abruptly when the value exceeds 1.75 km/km2. For stratigraphy, the probability of mountain torrents increases with the increases of weakness of the stratigraphic lithology. For average annual 24-hour rainfall, about 60% of mountain torrents are distributed in cells with average annual 24-hour rainfall ranging from 100 mm to 160 mm. For distance to rivers, mountain torrents are concentrated in the cells with distance to rivers between 0 km and 5 km, accounting for 65.84% of the total.
3) The relationships between the occurrence probability and the relative relief/slope/drainage density can be fitted as the model of y=a1eb1x+a2eb2x with different fitting constants. The relationships between the probability and stratigraphy/average annual 24-hour rainfall/distance to rivers can be described by y=aebx with different fitting constants.
References
| [1] | Tang C, Zhu J. Torrent risk zonation in the Upstream Red River basin based on GIS[J]. Journal of Geographical Sciences, 2006, 16(4): 479-486. DOI:10.1007/s11442-006-0412-8 |
| [2] | Roux H, Labat D, Garambois P A, et al. A physically-based parsimonious hydrological model for flash floods in Mediterranean catchments[J]. Natural Hazards & Earth System Sciences, 2011, 11(9): 2567-2582. |
| [3] | Abuzied S, Yuan M, Ibrahim S, et al. Geospatial risk assessment of flash floods in Nuweiba area, Egypt[J]. Journal of Arid Environments, 2016, 133: 54-72. DOI:10.1016/j.jaridenv.2016.06.004 |
| [4] | Cendrero A, Remondo J, Bonachea J, et al. Sensitivity of landscape evolution and geomorphic processes to direct and indirect human influence[J]. Geografia Fisica E Dinamica Quaternaria, 2006, 29(2): 125-137. |
| [5] | Jakob M, Lambert S. Climate change effects on landslides along the southwest coast of British Columbia[J]. Geomorphology, 2009, 107(3/4): 275-284. |
| [6] | Yuege. Flood update for 2019[EB/OL]. (2019-06-15)[2019-12-15]. https://www.ferts.cn/agriculture/129/201906/3797.html(in Chinese). |
| [7] | Sohu. Many people have been killed or missing in natural disasters such as floods and mudslides in zhaotong[EB/OL]. (2016-06-21)[2019-12-16]. https://m.sohu.com/a/84893527_350164(in Chinese). |
| [8] | Baidu. Guangdong Province small watershed comprehensive management plan[EB/OL]. (2019-03-20)[2019-12-16]. https://wenku.baidu.com/view/a5b17fba590216fc700abb68a98271fe910eafe0.html?pn=51(in Chinese). |
| [9] | Tencent. Guangdong Heyuan floods have killed 11 people, with direct economic losses exceeding 600 million yuan[EB/OL]. (2019-06-11)[2019-12-16]. https://new.qq.com/omn/20190611/20190611A0A6DH.html(in Chinese). |
| [10] | Diakakis M, Deligiannakis G, Pallikarakis A, et al. Factors controlling the spatial distribution of flash flooding in the complex environment of a metropolitan urban area: the case of Athens 2013 flash flood event[J]. International Journal of Disaster Risk Reduction, 2016, 18: 171-180. DOI:10.1016/j.ijdrr.2016.06.010 |
| [11] | Wei F Q, Gao K C, Hu K H, et al. Relationships between debris flows and earth surface factors in Southwest China[J]. Environmental Geology, 2008, 55(3): 619-627. DOI:10.1007/s00254-007-1012-3 |
| [12] | Bracken(née Bull) L J, Cox N J, Shannon J. The relationship between rainfall inputs and flood generation in south-east Spain[J]. Hydrological Processes, 2008, 22(5): 683-696. DOI:10.1002/hyp.6641 |
| [13] | Moussa R. On morphometric properties of basins, scale effects and hydrological response[J]. Hydrological Processes, 2003, 17(1): 33-58. DOI:10.1002/hyp.1114 |
| [14] | Bhatt S, Ahmed S A. Morphometric analysis to determine floods in the Upper Krishna basin using Cartosat DEM[J]. Geocarto International, 2014, 29(8): 878-894. DOI:10.1080/10106049.2013.868042 |
| [15] | Lee M J, Kang J E, Jeon S. Application of frequency ratio model and validation for predictive flooded area susceptibility mapping using GIS[C]//Proceedings of IEEE International Geoscience and Remote Sensing Symposium (IGARSS). 22-27 July, 2012, Munich, Germany. IEEE, 2012: 895-898. |
| [16] | Pradhan B, Oh H J, Buchroithner M. Weights-of-evidence model applied to landslide susceptibility mapping in a tropical hilly area[J]. Geomatics Natural Hazards & Risk, 2010, 1(3): 199-223. |
| [17] | Zhou C S, Shi C Y, Wang S J, et al. Estimation of eco-efficiency and its influencing factors in Guangdong Province based on Super-SBM and panel regression models[J]. Ecological Indicators, 2018, 86: 67-80. DOI:10.1016/j.ecolind.2017.12.011 |
| [18] | Zhou Q, Wang W, Pang Y, et al. Temporal and spatial distribution characteristics of water resources in Guangdong Province based on a cloud model[J]. Water Science and Engineering, 2015, 8(4): 263-272. DOI:10.1016/j.wse.2015.09.001 |
| [19] | Pu H X, Luo K L, Zhang S X, et al. Relationship between lifespan indicators and elemental background values: a case study in Guangdong Province, China[J]. The Science of the Total Environment, 2018, 624: 1658-1668. DOI:10.1016/j.scitotenv.2017.10.046 |
| [20] | Shen W J, Li M S, Huang C Q, et al. Annual forest aboveground biomass changes mapped using ICESat/GLAS measurements, historical inventory data, and time-series optical and radar imagery for Guangdong Province, China[J]. Agricultural & Forest Meteorology, 2018, 259: 23-38. |
| [21] | Bezak N, Grigillo D, Urban?i? T, et al. Geomorphic response detection and quantification in a steep forested torrent[J]. Geomorphology, 2017, 291: 33-44. DOI:10.1016/j.geomorph.2016.06.034 |
| [22] | Chen X Z, Chen H, Yong Y, et al. Susceptibility assessment of debris flows using the analytic hierarchy process method: a case study in Subao river valley, China[J]. Journal of Rock Mechanics and Geotechnical Engineering, 2015, 7(4): 404-410. DOI:10.1016/j.jrmge.2015.04.003 |
| [23] | Wang J, Yu Y, Pan H L, et al. Debris flow formation process and critical hydrodynamic conditions in the meizoseismal area of the Wechchuan Earthquake[J]. Journal of Mountain Science, 2015, 12(3): 699-710. DOI:10.1007/s11629-014-3370-0 |
| [24] | Baidu. Guangdong Province rainstorm runoff chart user manual[EB/OL]. (2018-06-30)[2019-12-16]. https://wenku.baidu.com/view/6b6bf7114431b90d6c85c777.html(in Chinese). |
| [25] | Gong Q H, Li X H, Yuan S X. Study on classification and mountain geological hazard mapping of slope-gully system in small watershed[J]. Journal of Anhui Agricultural Science, 2010, 38(3): 1411-1413. |
| [26] | Li Y, Hu K H, Cui P. Morphology of basin of debris flow[J]. Journal of Mountain Science, 2002, 20(1): 1-11. |
| [27] | Xiong J N, Li J, Cheng W M, et al. Spatial-temporal distribution and the influencing factors of mountain flood disaster in southwest China[J]. Acta Geographica Sinica, 2019, 74(7): 1374-1391. |
| [28] | Zhang Q Z, Lu Y, Qin W, et al. Spatial distribution pattern and impacting factor of mountain torrent disasters in Chongqing[J]. Yangtze River, 2018, 49(1): 13-19. |
