 ,1, 邓洪涛,1, 李丽2, 崔顺立1, Charles Y.Chen3, 侯名语1, 杨鑫雷,1, 刘立峰,1
QTL Mapping for Lateral Branch Angle Related Traits of Cultivated Peanut (Arachis hypogaea L.)
MENG XinHao,1, DENG HongTao,1, LI Li2, CUI ShunLi1, Charles Y. CHEN3, HOU MingYu1, YANG XinLei,1, LIU LiFeng,1通讯作者:
责任编辑: 李莉
收稿日期:2020-09-23接受日期:2020-12-7网络出版日期:2021-04-16
| 基金资助: |
Received:2020-09-23Accepted:2020-12-7Online:2021-04-16
作者简介 About authors
孟鑫浩,E-mail:
邓洪涛,E-mail:

摘要
关键词:
Abstract
Keywords:
PDF (4162KB)元数据多维度评价相关文章导出EndNote|Ris|Bibtex收藏本文
本文引用格式
孟鑫浩, 邓洪涛, 李丽, 崔顺立, Charles Y.Chen, 侯名语, 杨鑫雷, 刘立峰. 栽培种花生株型相关性状的QTL定位[J]. 中国农业科学, 2021, 54(8): 1599-1612 doi:10.3864/j.issn.0578-1752.2021.08.003
MENG XinHao, DENG HongTao, LI Li, CUI ShunLi, Charles Y. CHEN, HOU MingYu, YANG XinLei, LIU LiFeng.
开放科学(资源服务)标识码(OSID):

0 引言
【研究意义】花生(Arachis hypogaea L.)是世界上重要的油料作物之一,也是植物蛋白质的来源,具有较高的经济价值。花生侧枝夹角(第一对侧枝与主茎间的夹角)是重要的株型性状,与产量和机械化收获密切相关[1]。为了使农机农艺更好地结合,降低劳动成本,生产上选育适合机械化采收、高产株型品种是花生增产增效的重要方面。因此,开展株型相关性状的遗传研究对选育理想株型的花生品种具有重要的理论意义和实际参考价值。【前人研究进展】不同****对植物株型持有不同的观点,尽管目前对株型的度量没有统一的标准,但合理的株型,不仅要求具有理想的组织形态,同时在空间上也要有最佳的排布方式,使其最大限度获得太阳光,达到最适的叶面积指数。为了探究理想的花生株型,许多研究人员对花生主茎高、第一对侧枝长度、和总分枝数进行了研究[2,3,4,5]。在花生种质中存在直立型、匍匐型和几种中间类型等不同的株型。直立型品种具有紧凑的株型,结果部位集中在底部,适合高密度种植,匍匐型品种侧枝扩展较大,与地面有更大的接触面积,更有利于果针下扎。姜慧芳[6]根据匍匐枝与第一对侧枝的长度比以及主茎与第一对侧枝间的角度,将花生株型从匍匐到直立连续分为6个等级。KAYAM等[7]将栽培种花生的株型划分为匍匐、半匍匐、半直立和直立4种类型。曹敏建等[8]根据株型指数(即第一对侧枝长度与主茎高度的比值)将花生的生长习性分为3类:株型指数在2.0左右为匍匐型,株型指数在1.5左右为半匍匐型,株型指数在1.1—1.2为直立型。尽管有很多方法定义花生生长习性,但仍然很难区分这些类别。与其他作物不同,花生是地上开花、地下结果的作物,所以侧枝夹角是其重要的特征,这不但影响果针下扎形成荚果,而且与种植密度密切相关。因此,侧枝夹角便成为描述花生株型结构特征的重要指标[9]。此外,花生的主茎高和第一对侧枝长度也是影响生长习性的重要农艺性状[3]。花生是双子叶植物,其生长习性的分子遗传基础尚不明确。早期,研究者利用孟德尔定律,基于不同的遗传方式分析了花生生长习性的遗传规律。近年来,许多研究者对花生生长习性的相关性状进行QTL定位。FONCEKA等[10]利用染色体片段置换系检测到14个与花生株型相关的QTL。SHIRASAWA等[11]使用F2群体定位到3个与主茎高相关的QTL和2个与第一对侧枝长相关的主效QTL。HUANG等[12]以F2:3群体为材料,在A03、B04和B07上检测到3个与主茎高相关的QTL。KAYAM等[7]利用一个F2:3群体在B05染色体上定位到1个与株型性状相关的QTL,LI等[13]的研究也在B05染色体上定位获得与生长习性相关的共定位群,但QTL位置区别于KAYAM等的研究。Lü等[4]利用2个遗传背景不同的重组自交系群体为试验材料,在A09、B03和B04上同时检测到与主茎高相关的QTL。【本研究切入点】目前,对花生株型相关性状的研究仍较少,不足以揭示其复杂的遗传机制。【拟解决的关键问题】本研究以直立型花生品种冀花5号和匍匐型种质M130构建的重组自交系F6群体为试验材料,采用传统标记方法SSR、AhTE、SRAP和TRAP技术,挖掘与花生侧枝夹角性状相关且能在多环境下稳定表达QTL。明确花生侧枝夹角性状的遗传特性,挖掘与花生侧枝夹角性状连锁的标记位点,促进侧枝夹角性状的遗传解析及适宜机械采收、高产理想株型花生品种的选育。1 材料与方法
1.1 试验材料
以直立型花生品种冀花5号为母本,匍匐型种质M130为父本[13]。采用单粒传法,构建包含321个家系的F6重组自交系群体为试验材料。2016年分别种植在保定市(BD,38o40'N和115o30'E)和海南市(HN,18o590'N和109o110'E),每个家系种植一行,行长1.5 m,行距为0.9 m,株距为0.17 m。每行种植10株。随机区组设计,2次重复,常规田间管理。2017年分别种植在邯郸市(HD,35o57'N和115o09'E)和保定市;2018年在唐山市(TS,39o99'N和118o70'E)、邯郸市和保定市等地分别种植亲本和群体,种植方法同2016年。1.2 性状考察和数据分析
试验材料收获后每个家系选择3个典型单株,参考LI等[13]提出的株型性状考察标准对花生株型相关性状进行室内考种,主要性状包括侧枝夹角(lateral branch angle,LBA)、主茎高度(main stem height,MSH)、侧枝长度(lateral branch length,LBL)、株型指数(index of plant type,IOPT)和扩展半径(extent radius,ER)等5项指标。采用公式hB2=VG/VP计算亲本和RIL群体在7个环境下的广义遗传力,VP=VG+VE。其中,VP表示表型方差,VG表示遗传方差,VE表示环境方差。采用GraphPad Prism 8(1.3 DNA提取与引物筛选
在田间取亲本和RIL群体代表性株系的幼嫩叶片,采用改良SDS-CTAB法[14]提取花生基因组总DNA。利用3 964对SSR和AhTE花生标记(http:www.peanutbase.org),238对SRAP引物组合[15]和155对TRAP引物组合[16]对亲本行多态性筛选。PCR体系及PCR扩增的反应程序参考崔顺立等[17]方法进行,PCR的产物通过8%非变性聚丙烯酰胺凝胶电泳进行分子标记的多态性检测。1.4 群体基因型统计及连锁图谱构建
基因型数据统计时,母本带型记为“a”,父本带型记为“b”,杂合带型记为“h”。带型模糊不清或数据缺失均用“-”表示。采用Join Map 4.0[18]对群体基因型进行遗传连锁分析,设置步长为0.5,LOD>3,在LOD值在3—10范围内将所得到的标记进行分组,随后利用Kosambi函数将重组率转化为遗传距离[19]。利用Mapchart 2.3[20]绘制遗传连锁图谱。连锁群所属染色体通过与Kazusa Marker Database(http://marker. kazusa.or.jp/Peanut/)上的整合图谱进行比对后确定。1.5 QTL定位分析
利用QTL IciMapping 4.2 [21]中的ICIM-ADD方法对不同环境下各个性状进行QTL定位和效应估计,采用ICIM-EPI方法计算上位性QTL。QTL的命名以“q”开头,加上性状名称和染色体名称,如果同一连锁群上出现2个或2个以上相同性状的QTL,则在连锁群后面加上“.”和数字进行区分[22],如在A05染色体上有2个与侧枝夹角相关的QTL,则分别命名为qLBAA05.1和qLBAA05.2。2 结果
2.1 表型变异分析
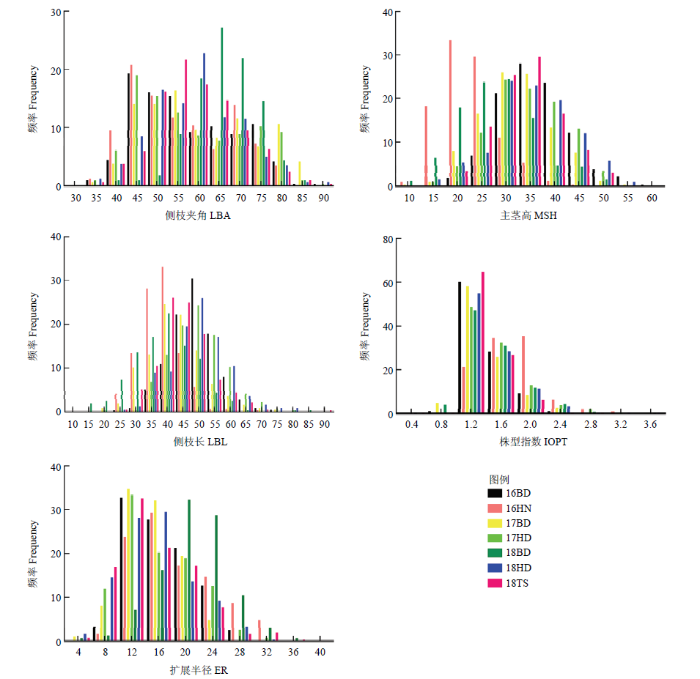
对2016—2018年7个环境下花生株型相关性状的表型数据进行统计分析(表1),发现5个性状在亲本之间表现出显著差异,而且在RIL群体中的变异范围较大,最大值和最小值均超过亲本表型值,表明5个株型相关性状同时具有正向或者负向超亲优势。W-test表现出不同程度的显著性,各性状在7环境下均呈现连续分布(图1)且偏度、峰度均趋向0,说明适合进行QTL定位。图1
 新窗口打开|下载原图ZIP|生成PPT
图17个环境下RIL群体与亲本的5个性状的正态检验和频率分布图
环境16BD、16HN、17BD、17HD、18BD、18HD和18TS分别代
Fig. 1Normal test and frequency distribution map for five traits of the RILs and their parents in seven environments
Environments 16BD, 16HN, 17BD, 17HD, 18BD, 18HD and 18TS represent sampling in 2016, 2017 and 2018 from Baoding (BD), Hainan (HD), Handan (HD) and Tangshan (TS); LBA: Lateral branch angle; MSH: Main stem height; LBL: Lateral branch length; IOPT: Index of plant type; ER: Extent radius
Table 1
表1
表1亲本及RIL群体表型数据统计分析
Table 1
| 性状 Trait | 环境 Env. | 亲本 Parent | RIL群体RILs population | ||||||||
|---|---|---|---|---|---|---|---|---|---|---|---|
| 冀花5号 Jihua 5 | M130 | 最小值 Minimum | 最大值 Maximum | 平均值 Mean | 标准差 SD | 变异系数 CV (%) | Shapiro- wilk (w) | 偏度 Skewness | 峰度 Kurtosis | ||
| 侧枝夹角 LBA (°) | 16BD | 45.93 | 81.22 | 34.15 | 87.08 | 57.61 | 11.64 | 20.20 | 0.955*** | 0.330 | -0.993 |
| 16HN | 37.41 | 77.05 | 34.03 | 80.07 | 55.90 | 11.75 | 21.02 | 0.953*** | 0.362 | -1.094 | |
| 17BD | 43.50 | 83.43 | 33.07 | 87.52 | 60.47 | 12.80 | 21.17 | 0.964*** | 0.277 | -1.050 | |
| 17HD | 39.20 | 79.01 | 35.35 | 90.10 | 58.63 | 13.09 | 22.33 | 0.949*** | 0.344 | -1.128 | |
| 18BD | 37.23 | 72.47 | 39.01 | 85.73 | 65.93 | 7.64 | 11.58 | 0.996 | -0.344 | 0.408 | |
| 18HD | 45.30 | 81.83 | 35.05 | 88.38 | 58.78 | 10.53 | 17.91 | 0.989 | 0.252 | -0.246 | |
| 18TS | 47.50 | 78.73 | 36.05 | 89.00 | 58.93 | 9.87 | 16.76 | 0.989 | 0.327 | -0.136 | |
| 主茎高 MSH (cm) | 16BD | 45.05 | 23.71 | 19.10 | 59.57 | 36.33 | 6.97 | 19.18 | 0.988** | 0.348 | 0.221 |
| 16HN | 35.05 | 17.31 | 10.36 | 45.00 | 22.67 | 5.82 | 25.66 | 0.969*** | 0.702 | 0.415 | |
| 17BD | 38.40 | 19.37 | 10.15 | 56.62 | 32.25 | 7.17 | 22.25 | 0.996 | 0.120 | -0.038 | |
| 17HD | 45.26 | 25.52 | 13.37 | 52.34 | 34.30 | 7.62 | 22.22 | 0.991 | -0.039 | -0.481 | |
| 18BD | 38.00 | 19.70 | 10.71 | 52.52 | 27.96 | 7.94 | 28.38 | 0.977** | 0.475 | 0.164 | |
| 18HD | 45.05 | 23.36 | 12.28 | 55.76 | 34.89 | 8.04 | 23.04 | 0.992 | -0.102 | -0.087 | |
| 18TS | 45.23 | 24.38 | 17.06 | 51.10 | 33.87 | 6.69 | 19.74 | 0.99 | 0.161 | -0.297 | |
| 侧枝长 LBL (cm) | 16BD | 49.76 | 61.42 | 24.56 | 75.71 | 49.20 | 7.56 | 15.36 | 0.995 | 0.144 | 0.642 |
| 16HN | 38.81 | 36.26 | 23.52 | 70.33 | 38.13 | 6.51 | 17.08 | 0.966*** | 0.689 | 2.532 | |
| 17BD | 40.36 | 46.26 | 19.43 | 76.87 | 42.85 | 9.30 | 21.69 | 0.991 | 0.534 | 0.954 | |
| 17HD | 47.68 | 55.30 | 23.00 | 83.00 | 49.71 | 8.74 | 17.59 | 0.979** | 0.409 | 0.576 | |
| 18BD | 41.00 | 76.71 | 14.27 | 87.81 | 39.25 | 10.13 | 25.80 | 0.996 | 0.462 | 1.660 | |
| 18HD | 49.76 | 61.38 | 25.52 | 79.31 | 49.52 | 9.01 | 18.19 | 0.988 | 0.316 | 0.623 | |
| 18TS | 51.53 | 61.67 | 24.05 | 90.00 | 44.83 | 8.29 | 18.50 | 0.955*** | 0.813 | 2.377 | |
| 株型指数 IOPT | 16BD | 1.02 | 2.76 | 0.95 | 2.75 | 1.39 | 0.27 | 19.67 | 0.932*** | 1.174 | 1.470 |
| 16HN | 1.01 | 2.21 | 1.05 | 3.27 | 1.73 | 0.38 | 21.80 | 0.958*** | 0.892 | 1.533 | |
| 17BD | 1.05 | 2.23 | 0.76 | 2.86 | 1.37 | 0.34 | 24.63 | 0.93*** | 1.197 | 1.632 | |
| 17HD | 1.03 | 2.29 | 1.01 | 3.02 | 1.51 | 0.39 | 25.96 | 0.879*** | 1.479 | 2.665 | |
| 18BD | 1.07 | 3.79 | 0.68 | 3.45 | 1.46 | 0.40 | 27.27 | 0.933*** | 1.297 | 2.645 | |
| 18HD | 1.05 | 2.76 | 1.02 | 3.51 | 1.48 | 0.39 | 26.41 | 0.829*** | 1.961 | 5.759 | |
| 18TS | 1.15 | 2.42 | 1.06 | 2.57 | 1.34 | 0.29 | 21.41 | 0.917*** | 0.654 | 3.582 | |
| 扩展半径 ER (cm) | 16BD | 8.52 | 22.35 | 7.75 | 27.06 | 16.50 | 4.49 | 27.20 | 0.974*** | 0.411 | -0.747 |
| 16HN | 16.13 | 31.57 | 8.05 | 33.08 | 18.52 | 5.80 | 31.34 | 0.965*** | 0.593 | -0.562 | |
| 17BD | 9.37 | 21.30 | 5.02 | 25.06 | 15.05 | 3.98 | 26.46 | 0.99 | 0.181 | -0.517 | |
| 17HD | 10.29 | 19.39 | 6.51 | 33.05 | 15.89 | 5.32 | 33.47 | 0.971*** | 0.52 | -0.451 | |
| 18BD | 9.33 | 34.71 | 5.38 | 36.38 | 21.00 | 5.01 | 23.83 | 0.996 | -0.035 | 0.345 | |
| 18HD | 8.67 | 21.17 | 5.01 | 30.02 | 15.11 | 5.16 | 34.15 | 0.978** | 0.477 | -0.283 | |
| 18TS | 9.50 | 24.13 | 5.71 | 34.05 | 15.07 | 5.49 | 36.44 | 0.961*** | 0.742 | 0.357 | |
新窗口打开|下载CSV
花生的侧枝夹角、主茎高度、侧枝长、株型指数和扩展半径等5个性状在各环境下均表现出两两显著或极显著的正相关或者负相关关系(表2),主茎高和扩展半径在7个环境下均表现出极显著(P<0.01)正相关关系(R16BD=0.820、R16HN=0.761、R17BD=0.736、R17HD=0.820、R18BD=0.815、R18HD=0.897、R18TS=0.878),表明植株扩展半径随主茎高的增加而变大,生产上可能会造成植株倒伏;主茎高与侧枝夹角的相关性在所有环境下表现出显著(P<0.05)或极显著(P<0.01)负相关关系(R16BD=-0.323、R16HN=-0.172、R17BD=-0.278、R17HD=-0.372、R18BD=-0.118、R18HD=-0.184、R18TS= -0.117),说明侧枝夹角可能受主茎高的反向调节。方差分析结果(表3)表明,除了侧枝基角的基因型×环境外(P>0.05),所有性状的基因型、环境和基因型×环境均存在显著差异(P<0.01)。广义遗传力计算结果表明,LBA、MSH、LBL、IOPT和ER等5个性状均呈现出较高的遗传力(0.86—0.92),推测单个性状可能会定位到主效QTL。
Table 2
表2
表2栽培种花生株型相关性状的相关分析
Table 2
| 环境Env. | 性状Trait | 侧枝夹角LBA | 主茎高MSH | 侧枝长LBL | 株型指数IOPT |
|---|---|---|---|---|---|
| 16BD | 主茎高MSH | -0.323** | |||
| 侧枝长LBL | 0.323** | 0.456** | |||
| 株型指数IOPT | 0.604** | -0.631** | 0.374** | ||
| 扩展半径ER | 0.820** | -0.262** | 0.450** | 0.646** | |
| 16HN | 主茎高MSH | -0.127* | |||
| 侧枝长LBL | -0.009* | 0.584** | |||
| 株型指数IOPT | 0.205** | -0.706** | 0.061* | ||
| 扩展半径ER | 0.761** | 0.086* | 0.223** | 0.129* | |
| 17BD | 主茎高MSH | -0.278** | |||
| 侧枝长LBL | 0.429** | 0.450** | |||
| 株型指数IOPT | 0.683** | -0.539** | 0.473** | ||
| 扩展半径ER | 0.736** | -0.093* | 0.589** | 0.651** | |
| 17HD | 主茎高MSH | -0.372** | |||
| 侧枝长LBL | 0.333** | 0.394** | |||
| 株型指数IOPT | 0.595** | -0.687** | 0.349** | ||
| 扩展半径ER | 0.820** | -0.270** | 0.496** | 0.638** | |
| 18BD | 主茎高MSH | -0.118* | |||
| 侧枝长LBL | 0.557** | 0.547** | |||
| 株型指数IOPT | 0.457** | -0.506** | 0.408** | ||
| 扩展半径ER | 0.815** | 0.303** | 0.748** | 0.455** | |
| 18HD | 主茎高MSH | -0.184** | |||
| 侧枝长LBL | 0.458** | 0.466** | |||
| 株型指数IOPT | 0.537** | -0.666** | 0.281** | ||
| 扩展半径ER | 0.897** | -0.155** | 0.546** | 0.577** | |
| 18TS | 主茎高MSH | -0.117* | |||
| 侧枝长LBL | 0.380** | 0.538** | |||
| 株型指数IOPT | 0.465** | -0.532** | 0.352** | ||
| 扩展半径ER | 0.878** | -0.044 | 0.512** | 0.518** |
新窗口打开|下载CSV
Table 3
表3
表3RIL群体各性状方差分析及广义遗传力
Table 3
| 性状 Trait | 变异来源 Variables | 自由度 df | 均方 MS | F值 F-value | P值 P-value | 广义遗传力 h2B |
|---|---|---|---|---|---|---|
| 侧枝夹角 LBA | 基因型Genotype | 320 | 616.890 | 14.658 | <0.01 | 0.86 |
| 环境Environment | 6 | 3124.760 | 74.247 | <0.01 | ||
| 基因型×环境G×E | 1877 | 42.086 | 1.036 | >0.05 | ||
| 主茎高 MSH | 基因型Genotype | 320 | 240.144 | 11.943 | <0.01 | 0.92 |
| 环境Environment | 6 | 7341.320 | 365.118 | <0.01 | ||
| 基因型×环境G×E | 1877 | 20.107 | 1.723 | <0.01 | ||
| 侧枝长 LBL | 基因型Genotype | 320 | 270.164 | 6.924 | <0.01 | 0.90 |
| 环境Environment | 6 | 7396.938 | 189.580 | <0.01 | ||
| 基因型×环境G×E | 1779 | 39.017 | 1.836 | <0.01 | ||
| 株型指数 IOPT | 基因型Genotype | 320 | 0.466 | 7.433 | <0.01 | 0.91 |
| 环境Environment | 6 | 4.097 | 65.320 | <0.01 | ||
| 基因型×环境G×E | 1779 | 0.063 | 1.896 | <0.01 | ||
| 扩展半径 ER | 基因型Genotype | 320 | 121.227 | 12.600 | <0.01 | 0.89 |
| 环境Environment | 6 | 1599.042 | 166.201 | <0.01 | ||
| 基因型×环境G×E | 1881 | 9.621 | 2.265 | <0.01 |
新窗口打开|下载CSV
2.2 遗传连锁图构建
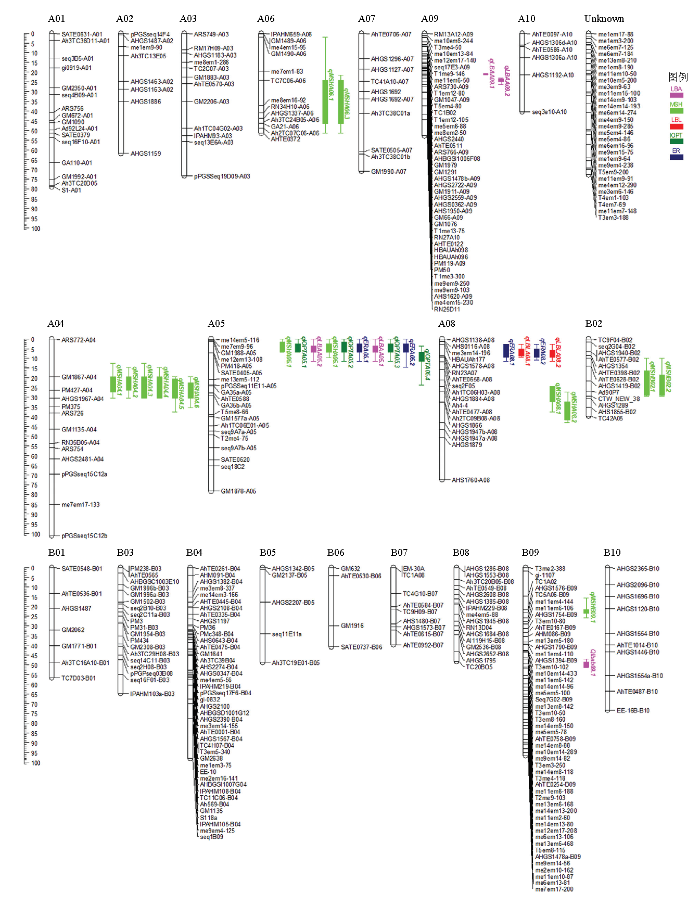
利用SSR、AhTE、SRAP和TRAP等分子标记对亲本进行多态性筛选,获得640对条带清晰、多态性好的分子标记用于RIL群体基因分型。将分型后的基因型数据通过Join Map 4.0软件(设置LOD=3.0—10.0)进行连锁分析,获得1张包含21个连锁群的遗传连锁图谱(图2),该图谱包含363个标记位点,单条连锁群长度为39.599—101.056 cM,包含4—50个分子标记,标记间平均距离为3.75 cM,标记位点最少的染色体为B06(4个),标记位点最多的染色体为B09(50个),29个标记位点未匹配到染色体上,命名为Unknown连锁群。图2
 新窗口打开|下载原图ZIP|生成PPT
图2栽培种花生遗传连锁图谱
Fig. 2Genetic linkage map of cultivated peanut
2.3 QTL定位
将2016—2018年7个环境下株型相关性状的表型数据在已构建的遗传连锁图谱上进行加性QTL定位分析,结果表明,在7个环境下共获得30个QTL(表4和图2),分布在A04、A05、A06、A08、A09、B02、B09等7条染色体上,单条染色体上QTL的数量为2—19个。与侧枝夹角相关的QTL有5个,PVE为3.48%—11.22%,LOD值为2.89—7.44;15个QTL与主茎高相关,PVE为3.58%—10.05%,LOD值为2.96—7.92;与第一对侧枝长度相关的QTL有2个,PVE为6.03%—8.56%,LOD值为4.86—6.13;4个QTL与株型指数相关,PVE为4.68%—15.08%,LOD值为3.23—10.15;与扩展半径相关的QTL有4个,PVE为3.30%—9.33%,LOD值为3.01—6.63。其中,主效QTL有4个,2个与侧枝夹角相关(qLBAA05.1和qLBAA05.2),位于A05染色体me14em5-116—PM418-A05标记区间上,PVE为10.23%—11.22%,LOD值为6.99—7.44;1个与主茎高相关(qMSHA04.2),位于A04染色体GM1867-A04—AHGS1967-A04区间上,PVE为10.05%(LOD=7.49);1个与株型指数相关(qIOPTA05.1),位于A05染色体me14em5-116—PM418-A05区间上,PVE为15.08%(LOD=10.15)。Table 4
表4
表4株型相关性状的QTL定位结果
Table 4
| 性状 Trait | QTL | 环境 Env. | 染色体 Chr. | 位置 Position | 标记区间 Marker interval | LOD | 贡献率 PVE (%) | 加性效应 Additive |
|---|---|---|---|---|---|---|---|---|
| 侧枝夹角 LBA | qLBAA05.1 | 16BD | A05 | 6.00 | me14em5-116—PM418 | 7.44 | 11.22 | -3.9527 |
| 17BD | A05 | 6.00 | me14em5-116—PM418 | 6.99 | 10.59 | -4.2307 | ||
| 18HD | A05 | 6.00 | me14em5-116—PM418 | 6.37 | 8.17 | -3.2618 | ||
| qLBAA05.2 | 16HN | A05 | 5.00 | me14em5-116—PM418 | 5.37 | 8.62 | -3.6198 | |
| 17HD | A05 | 5.00 | me14em5-116—PM418 | 7.22 | 10.23 | -4.8094 | ||
| qLBAA09.1 | 18BD | A09 | 20.98 | GM66—GM1076 | 3.13 | 4.34 | -2.0477 | |
| qLBAA09.2 | 16HN | A09 | 24.98 | RN27A10—AHTE0122 | 2.91 | 3.48 | -2.3139 | |
| qLBAB09.1 | 18HD | B09 | 50.00 | me5em5-100—me13em8-142 | 2.89 | 4.51 | 2.4198 | |
| 主茎高 MSH | qMSHA04.1 | 17BD | A04 | 21.00 | GM1867—AHGS1967 | 4.94 | 6.23 | 1.9109 |
| qMSHA04.2 | 18BD | A04 | 22.00 | GM1867—AHGS1967 | 7.49 | 10.05 | 2.7157 | |
| qMSHA04.3 | 18HD | A04 | 23.00 | GM1867—AHGS1967 | 3.55 | 5.22 | 1.9577 | |
| qMSHA04.4 | 16BD | A04 | 24.00 | GM1867—AHGS1967 | 3.11 | 3.58 | 1.6317 | |
| qMSHA04.5 | 16HN | A04 | 26.00 | GM1867—AHGS1967 | 3.99 | 5.24 | 1.4725 | |
| qMSHA04.6 | 17HD | A04 | 28.00 | GM1867—AHGS1967 | 6.54 | 6.34 | 2.4193 | |
| qMSHA05.1 | 16BD | A05 | 4.00 | me14em5-116 - PM418 | 4.54 | 6.43 | 2.1285 | |
| qMSHA05.2 | 17HD | A05 | 5.00 | me14em5-116—PM418 | 4.73 | 5.26 | 2.1268 | |
| qMSHA06.1 | 16HN | A06 | 36.41 | TC7C06—AHTE0372 | 4.54 | 4.90 | 1.3824 | |
| 17BD | A06 | 36.41 | TC7C06—AHTE0372 | 3.46 | 4.23 | 1.5366 | ||
| qMSHA06.2 | 18BD | A06 | 46.21 | TC7C06—AHTE0372 | 3.21 | 3.67 | 1.5995 | |
| qMSHA08.1 | 17BD | A08 | 30.00 | Ah4-4—TC9B08 | 3.58 | 4.62 | -1.6048 | |
| qMSHA08.2 | 18BD | A08 | 35.00 | TC9B08—AHGS1947b | 3.36 | 4.47 | -1.7650 | |
| qMSHB02.1 | 17HD | B02 | 25.00 | AHTE0398—CTW_NEW_38 | 4.00 | 4.48 | -1.9683 | |
| qMSHB02.2 | 18HD | B02 | 29.00 | AHTE0398—CTW_NEW_38 | 2.96 | 3.74 | -1.6183 | |
| qMSHB09.1 | 16HN | B09 | 22.00 | AHGS1576—me11em4-144 | 7.92 | 9.44 | -1.9154 | |
| 侧枝长 LBL | qLBLA08.1 | 18BD | A08 | 8.40 | HBAUAh177—AhTE0658 | 4.86 | 6.03 | -3.2587 |
| qLBLA08.2 | 17BD | A08 | 9.12 | HBAUAh177—AhTE0658 | 5.27 | 7.53 | -2.5945 | |
| 18HD | A08 | 9.12 | HBAUAh177—AhTE0658 | 6.13 | 8.56 | -2.6868 | ||
| 株型指数 IOPT | qIOPTA05.1 | 16BD | A05 | 4.00 | me14em5-116—PM418 | 10.15 | 15.08 | -0.1151 |
| 17HD | A05 | 4.00 | me14em5-116—PM418 | 5.18 | 9.35 | -0.1308 | ||
| qIOPTA05.2 | 18TS | A05 | 5.00 | me14em5-116—PM418 | 3.84 | 5.85 | -0.0757 | |
| qIOPTA05.3 | 17BD | A05 | 6.00 | me14em5-116—PM418 | 6.25 | 8.58 | -0.1006 | |
| 18BD | A05 | 6.00 | me14em5-116—PM418 | 3.23 | 4.68 | -0.1121 | ||
| qIOPTA05.4 | 18HD | A05 | 7.00 | PM418—pPGSSeq11E11 | 4.48 | 6.47 | -0.1012 | |
| 扩展半径 ER | qERA05.1 | 16BD | A05 | 5.00 | me14em5-116—PM418 | 6.63 | 9.33 | -1.5728 |
| 16HN | A05 | 5.00 | me14em5-116—PM418 | 5.03 | 7.41 | -1.7923 | ||
| 17BD | A05 | 5.00 | me14em5-116—PM418 | 3.16 | 3.86 | -0.9281 | ||
| 17HD | A05 | 5.00 | me14em5-116—PM418 | 6.15 | 8.55 | -1.8270 | ||
| 18HD | A05 | 5.00 | me14em5-116—PM418 | 5.14 | 7.38 | -1.5946 | ||
| qERA05.2 | 18TS | A05 | 6.00 | me14em5-116—PM418 | 3.96 | 5.92 | -1.3923 | |
| qERA08.1 | 17BD | A08 | 7.69 | HBAUAh177—AhTE0658 | 3.01 | 3.30 | -0.8612 | |
| qERA08.2 | 18BD | A08 | 8.40 | HBAUAh177—AhTE0658 | 5.18 | 5.53 | -1.3478 |
新窗口打开|下载CSV
共获得3个QTL聚集区(表5),分布在A04染色体的GM1867-A04—AHGS1967-A04区间、A05的me14em5-116—PM418-A05区间和A08染色体的HBAUAh177—AhTE0658-A08区间,涉及MSH、LBA、IOPT、ER和LBL等5个性状。如在A05的me14em5- 116—PM418-A05区间上共检测到9个QTL,其中,2个与侧枝夹角相关的QTL(qLBAA05.1和qLBAA05.2),2个与主茎高相关的QTL(qMSHA05.1和qMSHA05.2),5个与株型指数相关的QTL(qIOPTA05.1、qIOPTA05.4、qIOPTA05.2、qIOPTA05.5和qIOPTA05.3),2个与扩展半径相关的QTL(qERA05.1和qERA05.2),说明该区段上可能存在控制侧枝夹角、主茎高、株型指数和扩展半径等性状的多个基因或者是存在“一因多效”现象。
Table 5
表5
表5不同性状在相同标记区间的QTL分析结果
Table 5
| 染色体 Chr. | 标记区间 Marker interval | QTL | LOD | 贡献率 PVE (%) | |||
|---|---|---|---|---|---|---|---|
| A04 | GM1867-A04—AHGS1967-A04 | qMSHA04.1 | qMSHA04.2 | qMSHA04.3 | qMSHA04.4 | 3.11—7.49 | 3.25—10.05 |
| qMSHA04.5 | qMSHA04.6 | ||||||
| A05 | me14em5-116—PM418-A05 | qLBAA05.1 | qLBAA05.2 | qMSHA05.1 | qMSHA05.2 | 3.16—10.15 | 3.86—15.08 |
| qIOPTA05.1 | qIOPTA05.2 | qIOPTA05.3 | qERA05.1 | ||||
| qERA05.2 | |||||||
| A08 | HBAUAh177—AhTE0658-A08 | qLBLA08.1 | qLBLA08.2 | qERA08.1 | qERA08.2 | 3.01—6.13 | 3.30—8.56 |
新窗口打开|下载CSV
对7个环境下株型相关性状的表型数据进行上位性QTL定位分析,结果表明,在7个环境下共检测到59对上位性QTL(表6),涉及侧枝长、株型指数和扩展半径等3个性状,LOD值为5.06—27.99,上位性效应值为0.25%—12.25%。其中,与侧枝长相关的上位性QTL有6对,LOD值为7.81—13.76,上位性效应值为2.23%—2.78%;与株型指数相关的上位性QTL有50对,LOD值为5.06—27.99,PVE为0.25%—1.44%;与扩展半径相关的上位性QTL有3对,LOD值为5.83—6.59,上位性效应值为7.28%—12.25%。
Table 6
表6
表6株型相关性状的上位性QTL定位结果
Table 6
| 性状 Trait | 上位性QTL Epi-QTL | 环境 Env. | 染色体 Chr. | 位置 Position | 标记区间 Marker interval | 染色体 Chr. | 位置 Position | 标记区间 Marker interval | LOD | 贡献率 PVE (%) | |
|---|---|---|---|---|---|---|---|---|---|---|---|
| 侧枝长 LBL | Epi-qLBLA04.1 | 18BD | A04 | 15.000 | ARS772—GM1867 | A04 | 20.000 | GM1867—AHGS1967 | 13.760 | 2.420 | |
| Epi-qLBLA02.1 | 18BD | A02 | 35.000 | AHGS1163—AHGS1886 | A02 | 40.000 | AHGS1886—AHGS1159 | 9.620 | 2.230 | ||
| Epi-qLBLA05.1 | 18BD | A05 | 35.000 | AhTE0588—T5me8-66 | A05 | 40.000 | T5me8-66—T2me4-75 | 10.420 | 2.250 | ||
| Epi-qLBLA03.1 | 18BD | A03 | 25.000 | GM1883—AhTE0570 | A03 | 30.000 | AhTE0570—TC4G02 | 11.900 | 2.280 | ||
| Epi-qLBLB03.1 | 18BD | B03 | 7.165 | AHBGSC1003E10—GM1996 | B03 | 8.609 | AHBGSC1003E10—GM1996 | 9.750 | 2.230 | ||
| Epi-qLBLA08.1 | 18BD | A08 | 6.255 | HBAUAh177—AhTE0658 | A08 | 10.000 | AhTE0658—TC6H03 | 7.810 | 2.780 | ||
| 株型 指数 IOPT | Epi-qIOPTB04.1 | 16BD | B04 | 64.814 | me2em16-141—me9em4-125 | B04 | 69.814 | me2em16-141—me9em4-125 | 8.920 | 1.360 | |
| Epi-qIOPTB07.1 | 16BD | B07 | 5.000 | TC1A08—TC9H09 | B07 | 10.000 | TC1A08—TC9H09 | 7.280 | 1.200 | ||
| Epi-qIOPTA02.4 | 16BD | A02 | 45.000 | AHGS1886—AHGS1159 | A02 | 50.000 | AHGS1886—AHGS1159 | 8.510 | 1.420 | ||
| Epi-qIOPTA03.4 | 16BD | A03 | 40.000 | AhTE0570—TC4G02 | A03 | 45.000 | AhTE0570—TC4G02 | 8.530 | 1.160 | ||
| Epi-qIOPTB03.1 | 16BD | B03 | 7.165 | AHBGSC1003E10—GM1996 | B03 | 17.351 | GM1996—seq2H08 | 8.760 | 1.440 | ||
| Epi-qIOPTA10.2 | 16BD | A10 | 20.000 | AhTE0586—AHGS1192 | A10 | 25.000 | AHGS1192—seq3e10 | 5.500 | 0.850 | ||
| Epi-qIOPTA04.5 | 17BD | A04 | 50.000 | GM1135—pPGSseq15C12a | A04 | 55.000 | GM1135—pPGSseq15C12a | 8.300 | 0.800 | ||
| Epi-qIOPTB07.3 | 17BD | B07 | 10.000 | TC1A08—TC9H09 | B07 | 15.000 | TC1A08—TC9H09 | 9.440 | 0.860 | ||
| Epi-qIOPTA02.3 | 17BD | A02 | 40.000 | AHGS1886—AHGS1159 | A02 | 45.000 | AHGS1886—AHGS1159 | 8.670 | 0.850 | ||
| Epi-qIOPTA08.1 | 17BD | A08 | 10.827 | me3em14-196—Ah4-4 | A08 | 15.544 | me3em14-196—Ah4-4 | 8.720 | 0.920 | ||
| Epi-qIOPTA05.1 | 17BD | A05 | 5.000 | me7em9-96—me13em5-112 | A05 | 10.000 | me7em9-96—me13em5-112 | 6.020 | 0.810 | ||
| Epi-qIOPTA03.1 | 17BD | A03 | 25.000 | GM1883—AhTE0570 | A03 | 35.000 | AhTE0570—TC4G02 | 7.840 | 0.720 | ||
| Epi-qIOPTA06.1 | 17BD | A06 | 10.164 | me4em15-95—me7em1-83 | A06 | 15.078 | me4em15-95—me7em1-83 | 7.270 | 0.830 | ||
| Epi-qIOPTB03.2 | 17BD | B03 | 7.165 | AHBGSC1003E10—GM1996 | B03 | 17.351 | GM1996—seq2H08 | 8.660 | 0.820 | ||
| Epi-qIOPTA10.3 | 17BD | A10 | 20.000 | AhTE0586—AHGS1192 | A10 | 25.000 | AHGS1192—seq3e10 | 7.930 | 0.780 | ||
| 性状 Trait | 上位性QTL Epi-QTL | 环境 Env. | 染色体 Chr. | 位置 Position | 标记区间 Marker interval | 染色体 Chr. | 位置 Position | 标记区间 Marker interval | LOD | 贡献率 PVE (%) | |
| Epi-qIOPTB07.6 | 17HD | B09 | 10.000 | T3me2-388—AHGS1576 | B09 | 15.000 | T3me2-388—AHGS1576 | 10.480 | 1.360 | ||
| Epi-qIOPTA04.4 | 17HD | A04 | 40.000 | AHGS1967—GM1135 | A04 | 50.000 | GM1135—pPGSseq15C12a | 11.580 | 1.280 | ||
| Epi-qIOPTB07.4 | 17HD | B07 | 10.000 | TC1A08—TC9H09 | B07 | 15.000 | TC1A08—TC9H09 | 10.810 | 1.330 | ||
| Epi-qIOPTA02.5 | 17HD | A02 | 50.000 | AHGS1886—AHGS1159 | A02 | 55.000 | AHGS1886—AHGS1159 | 10.100 | 1.410 | ||
| Epi-qIOPTA05.2 | 17HD | A05 | 5.000 | me14em5-116—PM418 | A05 | 10.000 | PM418—seq11E11 | 9.100 | 1.380 | ||
| Epi-qIOPTA08.4 | 17HD | A08 | 15.543 | me3em14-196—Ah4-4 | A08 | 20.260 | me3em14-196—Ah4-4 | 11.350 | 1.360 | ||
| Epi-qIOPTA05.3 | 17HD | A05 | 5.000 | me7em9-96—me13em5-112 | A05 | 10.000 | me7em9-96—me13em5-112 | 11.390 | 1.300 | ||
| Epi-qIOPTB07.5 | 17HD | B08 | 20.000 | me4em5-88—AI119H15 | B08 | 25.000 | me4em5-88—AI119H15 | 8.550 | 1.230 | ||
| Epi-qIOPTA03.2 | 17HD | A03 | 30.000 | AhTE0570—TC4G02 | A03 | 35.000 | AhTE0570—TC4G02 | 11.840 | 1.280 | ||
| Epi-qIOPTB03.3 | 17HD | B03 | 7.165 | AHBGSC1003E10—GM1996 | B03 | 8.609 | AHBGSC1003E10—GM1996 | 14.290 | 1.430 | ||
| Epi-qIOPTA08.2 | 17HD | A08 | 15.000 | AhTE0658—TC6H03 | A08 | 20.000 | TC6H03—AhTE0477 | 5.460 | 1.000 | ||
| Epi-qIOPTA04.2 | 17HD | A04 | 25.000 | GM1867—AHGS1967 | A08 | 25.000 | TC6H03—AhTE0477 | 5.640 | 0.480 | ||
| Epi-qIOPTA10.4 | 17HD | A10 | 20.000 | AhTE0586—AHGS1192 | A10 | 25.000 | AHGS1192—seq3e10 | 11.310 | 1.200 | ||
| Epi-qIOPTA04.3 | 18BD | A04 | 25.000 | GM1867—AHGS1967 | A04 | 30.000 | GM1867—AHGS1967 | 27.990 | 0.900 | ||
| Epi-qIOPTA02.1 | 18BD | A02 | 20.000 | Ah3TC13E05—AHGS1463 | A02 | 25.000 | AHGS1463—AHGS1163 | 25.850 | 0.760 | ||
| Epi-qIOPTA05.5 | 18BD | A05 | 25.000 | seq11E11—AhTE0588 | A05 | 30.000 | AhTE0588—T5me8-66 | 25.060 | 0.770 | ||
| Epi-qIOPTA03.5 | 18BD | A03 | 40.000 | AhTE0570—TC4G02 | A03 | 45.000 | AhTE0570—TC4G02 | 25.170 | 1.230 | ||
| Epi-qIOPTA06.2 | 18BD | A06 | 15.078 | me4em15-95—me7em1-83 | A06 | 20.000 | me7em1-83—me8em16-92 | 25.390 | 0.780 | ||
| Epi-qIOPTB03.5 | 18BD | B03 | 31.542 | seq2H08—GM1954 | B03 | 31.236 | GM1954—IPAHM103 | 24.970 | 0.770 | ||
| Epi-qIOPTA10.1 | 18BD | A10 | 15.000 | AhTE0586—AHGS1192 | A10 | 20.000 | AhTE0586—AHGS1192 | 21.990 | 0.770 | ||
| Epi-qIOPTB07.7 | 18HD | B09 | 15.000 | T3me2-388—AHGS1576 | B09 | 20.000 | T3me2-388—AHGS1576 | 13.540 | 0.870 | ||
| Epi-qIOPTA04.6 | 18HD | A04 | 70.000 | pPGSseq15C12a—me7em17-133 | A04 | 75.000 | pPGSseq15C12a—me7em17-133 | 18.600 | 0.850 | ||
| Epi-qIOPTB07.2 | 18HD | B07 | 5.000 | TC1A08—TC9H09 | B07 | 10.000 | TC1A08—TC9H09 | 13.000 | 0.890 | ||
| Epi-qIOPTA02.2 | 18HD | A02 | 35.000 | AHGS1163—AHGS1886 | A02 | 45.000 | AHGS1886—AHGS1159 | 14.530 | 0.850 | ||
| Epi-qIOPTA05.6 | 18HD | A05 | 50.000 | T2me4-75—seq18C2 | A05 | 55.000 | T2me4-75—seq18C2 | 16.160 | 0.950 | ||
| Epi-qIOPTA08.5 | 18HD | A08 | 20.260 | me3em14-196—Ah4-4 | A08 | 30.000 | Ah4-4—TC9B08 | 12.330 | 0.830 | ||
| Epi-qIOPTA05.4 | 18HD | A05 | 15.000 | me7em9-96—me13em5-112 | A05 | 20.000 | me7em9-96—me13em5-112 | 15.600 | 1.120 | ||
| Epi-qIOPTA03.6 | 18HD | A03 | 45.000 | AhTE0570—TC4G02 | A03 | 50.000 | TC4G02—IPAHM93 | 15.850 | 0.840 | ||
| Epi-qIOPTA06.3 | 18HD | A06 | 35.000 | me7em1-83—me8em16-92 | A06 | 40.000 | me8em16-92—AHGS1337 | 15.200 | 0.840 | ||
| Epi-qIOPTB03.4 | 18HD | B03 | 31.236 | GM1954—IPAHM103 | B03 | 45.139 | GM1954—IPAHM103 | 19.630 | 0.840 | ||
| Epi-qIOPTA08.3 | 18HD | A08 | 15.000 | AhTE0658—TC6H03 | A08 | 20.000 | TC6H03—AhTE0477 | 17.200 | 0.830 | ||
| Epi-qIOPTA10.5 | 18HD | A10 | 20.000 | AhTE0586—AHGS1192 | A10 | 25.000 | AHGS1192—seq3e10 | 19.290 | 0.830 | ||
| Epi-qIOPTA04.1 | 18TS | A04 | 5.000 | ARS772—GM1867 | A04 | 10.000 | ARS772—GM1867 | 5.060 | 0.260 | ||
| Epi-qIOPTA08.6 | 18TS | A08 | 20.260 | me3em14-196—Ah4-4 | A08 | 25.000 | Ah4-4—TC9B08 | 5.410 | 0.260 | ||
| Epi-qIOPTA03.3 | 18TS | A03 | 30.000 | AhTE0570—TC4G02 | A03 | 35.000 | AhTE0570—TC4G02 | 6.150 | 0.250 | ||
| 扩展 半径 ER | Epi-qERA09.1 | 17BD | A09 | 25.976 | AHTE0122—HBAUAh098 | A08 | 10.827 | me3em14-196—Ah4-4 | 5.830 | 12.110 | |
| Epi-qERB04.2 | 18HD | B04 | 64.814 | me2em16-141—me9em4-125 | B08 | 5.000 | AHGS1286—TC20B05 | 5.880 | 12.250 | ||
| Epi-qERB04.1 | 18TS | B04 | 24.814 | AHTE0445—PM36 | B04 | 29.814 | PM36—PMc348 | 6.590 | 7.280 | ||
新窗口打开|下载CSV
3 讨论
尽管不同****对花生株型度量持有不同的观点[23,24,25],但对于花生侧枝夹角的研究尚少。本研究参考LI等[13]对株型的考察标准对花生侧枝夹角进行测量,具体测量方法是花生收获时,在花生秧自然状态下,使用数显量角器测量第一对侧枝与主茎间的夹角。该方法可将花生株型进行数字化度量,从而将花生株型的直观定性转变为数值定量,为以后花生株型的遗传解析提供了理论支撑。花生株型相关性状是花生重要的农艺性状之一,直接关系到花生的株型结构,进而影响花生产量。因此,研究株型相关性状的分子遗传机制对选育花生新品种具有重要的现实意义和理论价值。此前,国内外研究人员已对花生株型相关性状进行了QTL定位研究,SHIRASAWA等[11]在A01、A03、A05、A06、A07、B04、B05和B06等染色体上检测到与花生生长习性相关的QTL。成良强等[26]在A06染色体TC1A2—AHGS0153和AHGS1375—PM377区间、A09染色体GM2839—EM87和AHGS1478—GM2839区间、A10染色体AHGS0288—pPGPseq3E10区间和B01染色体AC2C8—AHGS2027区间上检测到与主茎高相关的QTL。HUANG等[27]在A03、A04、A09、B03和B06等染色体上检测到与花生植株高度相关的QTL。ZHOU等[28]在A05染色体的Ahsnp1180—Ahsnp1133和Ahsnp1338—Ahsnp213区间、A09的Ahsnp1103—Ahsnp1059和Ahsnp902—Ahsnp1167区间、A10的Ahsnp77—Ahsnp787和Ahsnp712—GM692区间、B03的Ahsnp1331—Ahsnp1308、Ahsnp586—Ahsnp1194和Ahsnp1236—Ahsnp1549区间以及B06的Ahsnp227—Ahsnp295上定位到与花生主茎高的QTL。本研究检测到与主茎高相关的QTL分布在A04染色体GM1867—AHGS1967区间、A05染色体me14em5-116—PM418区间、A06染色体TC7C06-A06—AHTE0372区间、A08染色体TC9B08—AHGS1947b和Ah4-4—TC9B08区间、B02染色体AHTE0398—CTW_NEW_ 38区间和B09染色体AHGS1576—me11em4-144区间上,与侧枝夹角相关的QTL分布在A05染色体的me14em5-116—PM418-A05区间、A09的GM66-A09—GM1076和RN27A10—AHTE0122区间以及B09的me5em5-100—me13em8-142区间上。综合比较分析这些QTL定位结果发现,部分QTL定位在相同的染色体上,但其在染色体上的具体的位置是不相同的,可能由于每个研究中所使用的材料、作图群体、图谱标记密度、QTL作图方法以及试验所在的环境不相同,加上栽培花生染色体数目较多,所以导致其定位结果也不同。值得关注的是,A05染色体上关于株型相关性状的QTL鲜有报道,可以推断,本研究中A05染色体上的QTL是新的QTL。本研究共获得4个主效QTL,涉及侧枝夹角(qLBAA05.1和qLBAA05.2)、主茎高(qMSHA04.2)和株型指数(qIOPTA05.1)等性状,因此,这些QTL对于花生株型育种研究具有重要价值。
本研究发现3个QTL聚集区(表5),与前人的研究略有相似,分布在A04、A05和A08染色体上。值得注意的是,在A05的me14em5-116—PM418区间上,共检测到qLBAA05.1、qLBAA05.2、qMSHA05.1、qIOPTA05.1、qIOPTA05.2、qIOPTA05.3和qERA05.2等7个QTL,涉及侧枝夹角、主茎高、株型指数和扩展半径等4个性状,说明在此区段上可能存在“一因多效”现象,这也可以通过性状之间的相关性得到验证。因此,应该重点关注此区间,可进一步进行精细定位研究。
目前,对花生上位性QTL的研究仅涉及蛋白质、脂肪[29]和荚果等产量相关性状[30],但对于株型相关性状的上位性QTL的研究鲜有报道。本研究检测到59对上位性QTL,涉及侧枝长、株型指数和扩展半径等3个性状,可以推测控制该3个性状的QTL是相互作用,且3个性状可能有一定协同关系,但对于侧枝夹角和主茎高,本研究未检测到相关上位性QTL,推测这两个性状在本研究中可能是独立遗传,且与其他性状无互作现象。
4 结论
共获得41个加性QTL,8个与侧枝夹角相关,16个与主茎高相关,3个与侧枝长度相关,6个与株型指数相关,8个与扩展半径相关,其中,主效QTL有5个,涉及侧枝夹角、主茎高和株型指数等性状。4个QTL聚集区,分布在A04、A05、A06和A08等染色体上。在7个环境下共得到59对上位性QTL,涉及侧枝长、株型指数和扩展半径等3个性状,可解释表型变异的0.25%—12.25%。参考文献 原文顺序
文献年度倒序
文中引用次数倒序
被引期刊影响因子
[D].
[本文引用: 1]
[D].
[本文引用: 1]
DOI:10.1371/journal.pone.0186113URLPMID:29040293 [本文引用: 1]

A mapping population of recombinant inbred lines (RILs) derived from TMV 2 and its mutant, TMV 2-NLM was employed for mapping important taxonomic and productivity traits using genic and non-genic transposable element markers in peanut. Single nucleotide polymorphism and copy number variation using RAD-Sequencing data indicated very limited polymorphism between TMV 2 and TMV 2-NLM. But phenotypically they differed significantly for many taxonomic and productivity traits. Also, the RIL population showed significant variation for a few additional agronomic traits. A genetic linkage map of 1,205.66 cM was constructed using 91 genic and non-genic Arachis hypogaea transposable element (AhTE) markers. Using single marker analysis and QTL analysis, the markers with high phenotypic variance explained (PVE) were identified for branching pattern (32.3%), number of primary and secondary branches (19.9% and 28.4%, respectively), protein content (26.4%), days to 50% flowering (22.0%), content of oleic acid (15.1%), test weight (13.6%) and pod width (12.0%). Three genic markers (AhTE0357, AhTE0391, AhTE0025) with Arachis hypogaea miniature inverted-repeat transposable element (AhMITE1) activity in the genes Araip.TG1BL (B02 chromosome), Aradu.7N61X (A09 chromosome) and Aradu.7065G (A07 chromosome), respectively showed strong linkage with these taxonomic, productivity and quality traits. Since TMV 2 and TMV 2-NLM differed subtly at DNA level, the background noise in detecting the marker-trait associations was minimum; therefore, the markers identified in this study for the taxonomic and productivity traits may be significant and useful in peanut molecular breeding.
DOI:10.1007/s10681-017-1847-yURL [本文引用: 2]
DOI:10.3389/fpls.2018.00684URLPMID:29887872 [本文引用: 2]
The peanut (Arachis hypogaea L.) is an important grain legume extensively cultivated worldwide, supplying edible oil and protein for human consumption. As in many other crops, plant height is a crucial factor in determining peanut architecture traits and has a unique effect on resistance to lodging and efficiency of mechanized harvesting as well as yield. Currently, the genetic basis underlying plant height remains unclear in peanut, which have hampered marker-assisted selection in breeding. In this study, we conducted a quantitative trait locus (QTL) analysis for peanut plant height by using two recombinant inbred line (RIL) populations including
DOI:10.3389/fpls.2018.00827URLPMID:29997635 [本文引用: 1]
High-density genetic maps (HDGMs) are very useful for genomic studies and quantitative trait loci (QTL) mapping. However, the low frequency of DNA polymorphisms in peanut has limited the quantity of available markers and hindered the construction of a HDGM. This study generated a peanut genetic map with the highest number of high-quality SNPs based on specific locus amplified fragment sequencing (SLAF-seq) technology and a newly constructed RIL population (
[本文引用: 1]
[本文引用: 1]
[本文引用: 2]
[本文引用: 1]
[本文引用: 1]
[本文引用: 1]
[本文引用: 1]
DOI:10.1371/journal.pone.0051130URLPMID:23226478 [本文引用: 1]
Several polarity proteins, including Scribble (Scrb) have been implicated in control of vesicle traffic, and in particular the endocytosis of E-cadherin, but through unknown mechanisms. We now show that depletion of Scrb enhances endocytosis of E-cadherin by weakening the E-cadherin-p120catenin interaction. Unexpectedly, however, the internalized E-cadherin is not degraded but accumulates in the Golgi apparatus. Silencing p120-catenin causes degradation of E-cadherin in lysosomes, but degradation is blocked by the co-depletion of Scrb, which diverts the internalized E-cadherin to the Golgi. Loss of Scrb also enhances E-cadherin binding to retromer components, and retromer is required for Golgi accumulation of Scrb, and E-cadherin stability. These data identify a novel and unanticipated function for Scrb in blocking retromer-mediated diversion of E-cadherin to the Golgi. They provide evidence that polarity proteins can modify the intracellular itinerary for endocytosed membrane proteins.
DOI:10.1186/1471-2229-12-80URLPMID:22672714 [本文引用: 2]
BACKGROUND: Peanut (Arachis hypogaea) is an autogamous allotetraploid legume (2n = 4x = 40) that is widely cultivated as a food and oil crop. More than 6,000 DNA markers have been developed in Arachis spp., but high-density linkage maps useful for genetics, genomics, and breeding have not been constructed due to extremely low genetic diversity. Polymorphic marker loci are useful for the construction of such high-density linkage maps. The present study used in silico analysis to develop simple sequence repeat-based and transposon-based markers. RESULTS: The use of in silico analysis increased the efficiency of polymorphic marker development by more than 3-fold. In total, 926 (34.2%) of 2,702 markers showed polymorphisms between parental lines of the mapping population. Linkage analysis of the 926 markers along with 253 polymorphic markers selected from 4,449 published markers generated 21 linkage groups covering 2,166.4 cM with 1,114 loci. Based on the map thus produced, 23 quantitative trait loci (QTLs) for 15 agronomical traits were detected. Another linkage map with 326 loci was also constructed and revealed a relationship between the genotypes of the FAD2 genes and the ratio of oleic/linoleic acid in peanut seed. CONCLUSIONS: In silico analysis of polymorphisms increased the efficiency of polymorphic marker development, and contributed to the construction of high-density linkage maps in cultivated peanut. The resultant maps were applicable to QTL analysis. Marker subsets and linkage maps developed in this study should be useful for genetics, genomics, and breeding in Arachis. The data are available at the Kazusa DNA Marker Database (http://marker.kazusa.or.jp).
DOI:10.1007/s00122-015-2493-1URLPMID:25805315 [本文引用: 1]
KEY MESSAGE: SSR-based QTL mapping provides useful information for map-based cloning of major QTLs and can be used to improve the agronomic and quality traits in cultivated peanut by marker-assisted selection. Cultivated peanut (Arachis hypogaea L.) is an allotetraploid species (AABB, 2n = 4x = 40), valued for its edible oil and digestible protein. Linkage mapping has been successfully conducted for most crops, and it has been applied to detect the quantitative trait loci (QTLs) of biotic and abiotic traits in peanut. However, the genetic basis of agronomic and quality-related traits remains unclear. In this study, high levels of phenotypic variation, broad-sense heritability and significant correlations were observed for agronomic and quality-related traits in an F 2:3 population. A genetic linkage map was constructed for cultivated peanut containing 470 simple sequence repeat (SSR) loci, with a total length of 1877.3 cM and average distance of 4.0 cM between flanking markers. For 10 agronomic traits, 24 QTLs were identified and each QTL explained 1.69-18.70 % of the phenotypic variance. For 8 quality-related traits, 12 QTLs were identified that explained 1.72-20.20 % of the phenotypic variance. Several QTLs for multiple traits were overlapped, reflecting the phenotypic correlation between these traits. The majority of QTLs exhibited obvious dominance or over-dominance effects on agronomic and quality traits, highlighting the importance of heterosis for breeding. A comparative analysis revealed genomic duplication and arrangement of peanut genome, which aids the assembly of scaffolds in genomic sequencing of Arachis hypogaea. Our QTL analysis results enabled us to clearly understand the genetic base of agronomic and quality traits in cultivated peanut, further accelerating the progress of map-based cloning of major QTLs and marker-assisted selection in future breeding.
DOI:10.3389/fpls.2019.00745URLPMID:31263472 [本文引用: 4]
Plant growth habit is an important and complex agronomic trait and is associated with yield, disease resistance, and mechanized harvesting in peanuts. There are at least two distinct growth habits (erect and prostrate) and several intermediate forms existing in the peanut germplasm. A recombinant inbred line population containing 188 individuals was developed from a cross of
[本文引用: 1]
[本文引用: 1]
DOI:10.1111/pbr.2005.124.issue-2URL [本文引用: 1]
DOI:10.1111/j.1744-7909.2007.00459.xURL [本文引用: 1]
A high-density linkage map was constructed for an F2 population derived from an interspecific cross of cultivated allotetraploid species between Gossypium hirsutum L. and G. barbadense L. A total of 186 F2 individuals from the interspecific cross of 揅RI 36 ?Hai 7124?were genotyped at 1 252 polymorphic loci including a novel marker system, target region amplification polymorphism (TRAP). The map consists of 1 097 markers, including 697 simple sequence repeats (SSRs), 171 TRAPs, 129 sequence-related amplified polymorphisms, 98 amplified fragment length polymorphisms, and two morphological markers, and spanned 4 536.7 cM with an average genetic distance of 4.1 cM per marker. Using 45 duplicated SSR loci among chromosomes, 11 of the 13 pairs of homologous chromosomes were identified in tetraploid cotton. This map will provide an essential resource for high resolution mapping of quantitative trait loci and molecular breeding in cotton.
URL [本文引用: 1]
【Objective】 In order to assess the genetic diversity of peanut landraces from Hebei province and provide a theoretical basis for peanut breeding. 【Method】 Genetic diversity of 75 accessions of peanut landraces with different botanical types, collected from Hebei province, was evaluated by 20 SSR molecular markers. 【Result】 Sixty-five alleles were detected. The average number of alleles per locus was 3.25 with a range from 2 to 6. Total Shannon information index of per locus varied widely from 0.1680 (7G02) -1.3617 (PM15) with an average value of 0.5448; Total Nei’s genetic diversity index of Nei per locus varied widely from 0.3385 (7G02) -0.9013 (PM384) with an average value of 0.6458; The accessions of A. hypogaea showed higher genetic diversity than those of A. vulgaris and A. fastigiata. Cluster analysis with UPGMA showed that the materials tested could be divided into 2 groups: the first group was A. vulgaris and A. fastigiata group, the second was A. hypogaea group and the genetic relationship among these landraces was not in accord with their geographical origins. 【Conclusion】 The peanut landraces from Hebei province showed higher genetic diversity revealed by SSR markers.
[本文引用: 1]
[本文引用: 1]
[本文引用: 1]
DOI:10.1016/j.cj.2015.01.001URL [本文引用: 1]
[D].
[本文引用: 1]
[D].
[本文引用: 1]
DOI:10.1371/journal.pone.0186113URLPMID:29040293 [本文引用: 1]
A mapping population of recombinant inbred lines (RILs) derived from TMV 2 and its mutant, TMV 2-NLM was employed for mapping important taxonomic and productivity traits using genic and non-genic transposable element markers in peanut. Single nucleotide polymorphism and copy number variation using RAD-Sequencing data indicated very limited polymorphism between TMV 2 and TMV 2-NLM. But phenotypically they differed significantly for many taxonomic and productivity traits. Also, the RIL population showed significant variation for a few additional agronomic traits. A genetic linkage map of 1,205.66 cM was constructed using 91 genic and non-genic Arachis hypogaea transposable element (AhTE) markers. Using single marker analysis and QTL analysis, the markers with high phenotypic variance explained (PVE) were identified for branching pattern (32.3%), number of primary and secondary branches (19.9% and 28.4%, respectively), protein content (26.4%), days to 50% flowering (22.0%), content of oleic acid (15.1%), test weight (13.6%) and pod width (12.0%). Three genic markers (AhTE0357, AhTE0391, AhTE0025) with Arachis hypogaea miniature inverted-repeat transposable element (AhMITE1) activity in the genes Araip.TG1BL (B02 chromosome), Aradu.7N61X (A09 chromosome) and Aradu.7065G (A07 chromosome), respectively showed strong linkage with these taxonomic, productivity and quality traits. Since TMV 2 and TMV 2-NLM differed subtly at DNA level, the background noise in detecting the marker-trait associations was minimum; therefore, the markers identified in this study for the taxonomic and productivity traits may be significant and useful in peanut molecular breeding.
DOI:10.1007/s10681-017-1847-yURL [本文引用: 1]
DOI:10.1007/BF00056241URL [本文引用: 1]
DOI:10.3724/SP.J.1006.2015.00979URL [本文引用: 1]
Peanut is an allotetraploid crop with a large genome. The construction of genetic linkage map and QTL mapping of related traits has little progress for peanut. In the present study, a genetic map consisting of 20 linkage groups was constructed with 234 SSR markers based on 2653 published SSR markers by using the F2 population derived from the cross between Fuchuan Dahuasheng and ICG6375. The genetic map covers 1683.43 cM, and the length of each linkage group varies from 36.11 to 131.48 cM, the number of markers in each linkage group varies from 6 to 15, with an average distance of 7.19 cM. Combining with the data of main stem height and number of total branches of F3 population in the environments of Wuhan and Yangluo, we performed QTL mapping and genetic effects analysis of QTLs by software WinQTLCart 2.5 using CIM (Composite Interval Mapping) method. As a result, 17 QTLs related to main stem height and number of total branches on eight linkage groups were detected with contribution percentage of 0.10%–10.22%. Comparing the QTLs detected in the environments of Wuhan and Yangluo, qMHA061.1 and qMHA062.1 were in the same linkage region of markers TC1A2–AHGS0153 of linkage group LG06 with contribution percentage of 5.49%–8.95%, qMHA061.2 and qMHA062.2 were between the markers AHGS1375 and PM377 on linkage group LG06 with contribution ratio of 2.93%–5.83%, qMHA092.2 and qMHA091.1 were in the same linkage region of the markers GM2839–EM87 in linkage group LG09 with contribution percentage of 0.53%–9.43%. The QTLs repeatedly detected are important for molecular breeding of peanut.
DOI:10.1038/srep39478URLPMID:27995991 [本文引用: 1]
Plant height is one of the most important architecture traits in crop plants. In peanut, the genetic basis of plant height remains ambiguous. In this context, we genotyped a recombinant inbred line (RIL) population with 140 individuals developed from a cross between two peanut varieties varying in plant height, Zhonghua 10 and ICG 12625. Genotyping data was generated for 1,175 SSR and 42 transposon polymorphic markers and a high-density genetic linkage map was constructed with 1,219 mapped loci covering total map length of 2,038.75 cM i.e., accounted for nearly 80% of the peanut genome. Quantitative trait locus (QTL) analysis using genotyping and phenotyping data for three environments identified 8 negative-effect QTLs and 10 positive-effect QTLs for plant height. Among these QTLs, 8 QTLs had a large contribution to plant height that explained >/=10% phenotypic variation. Two major-effect consensus QTLs namely cqPHA4a and cqPHA4b were identified with stable performance across three environments. Further, the allelic recombination of detected QTLs proved the existence of the phenomenon of transgressive segregation for plant height in the RIL population. Therefore, this study not only successfully reported a high-density genetic linkage map of peanut and identified genomic region controlling plant height but also opens opportunities for further gene discovery and molecular breeding for plant height in peanut.
DOI:10.1371/journal.pone.0166873URLPMID:27870916 [本文引用: 1]
Late leaf spot (LLS) is one of the most serious foliar diseases affecting peanut worldwide leading to huge yield loss. To understand the genetic basis of LLS and assist breeding in the future, we conducted quantitative trait locus (QTL) analysis for LLS and three plant-type-related traits including height of main stem (HMS), length of the longest branch (LLB) and total number of branches (TNB). Significant negative correlations were observed between LLS and the plant-type-related traits in multi-environments of a RIL population from the cross Zhonghua 5 and ICGV 86699. A total of 20 QTLs were identified for LLS, of which two QTLs were identified in multi-environments and six QTLs with phenotypic variation explained (PVE) more than 10%. Ten, seven, fifteen QTLs were identified for HMS, LLB and TNB, respectively. Of these, one, one, two consensus QTLs and three, two, three major QTLs were detected for HMS, LLB and TNB, respectively. Of all 52 unconditional QTLs for LLS and plant-type-related traits, 10 QTLs were clustered in five genetic regions, of which three clusters including five robust major QTLs overlapped between LLS and one of the plant-type-related traits, providing evidence that the correlation could be genetically constrained. On the other hand, conditional mapping revealed different numbers and different extent of additive effects of QTLs for LLS conditioned on three plant-type-related traits (HMS, LLB and TNB), which improved our understanding of interrelationship between LLS and plant-type-related traits at the QTL level. Furthermore, two QTLs, qLLSB6-7 and qLLSB1 for LLS resistance, were identified residing in two clusters of NB-LRR-encoding genes. This study not only provided new favorable QTLs for fine-mapping, but also suggested that the relationship between LLS and plant-type-related traits of HMS, LLB and TNB should be considered while breeding for improved LLS resistance in peanut.
DOI:10.2135/cropsci1999.0011183X003900010018xURL [本文引用: 1]
DOI:10.2135/cropsci1998.0011183X003800010008xURL [本文引用: 1]
