 ,1,2,3, 徐凯悦2,3, 王晓华2,3, 郭九信2,3, 吴良泉2,3, 苏达,1,3
Spatial Distribution of Phytic Acid and Minerals’ Availability in Pomelo Fruit
SONG Biao,1,2,3, XU KaiYue2,3, WANG XiaoHua2,3, GUO JiuXin2,3, WU LiangQuan2,3, SU Da,1,3通讯作者:
责任编辑: 赵伶俐
收稿日期:2020-06-17接受日期:2020-09-24网络出版日期:2021-03-16
| 基金资助: |
Received:2020-06-17Accepted:2020-09-24Online:2021-03-16
作者简介 About authors
宋彪,E-mail:

摘要
关键词:
Abstract
Keywords:
PDF (1952KB)元数据多维度评价相关文章导出EndNote|Ris|Bibtex收藏本文
本文引用格式
宋彪, 徐凯悦, 王晓华, 郭九信, 吴良泉, 苏达. 蜜柚果实不同空间部位植酸及矿质营养有效性的分布特征[J]. 中国农业科学, 2021, 54(6): 1229-1242 doi:10.3864/j.issn.0578-1752.2021.06.013
SONG Biao, XU KaiYue, WANG XiaoHua, GUO JiuXin, WU LiangQuan, SU Da.
开放科学(资源服务)标识码(OSID):

0 引言
【研究意义】我国是蜜柚的起源、栽培和遗传变异中心,拥有丰富的种质资源[1]。相较于其他柑橘类果实(如橘子和香橼)而言,蜜柚具有果形大、果皮厚、易保存、维生素含量高、风味独特等特点。近年来,平和县琯溪蜜柚的产量逐年上升,种植面积已近4.67×10⁴ hm2[2,3]。在农业提质增效和可持续发展的背景下,进一步促进蜜柚果实优质化,已成为产业发展的新目标。【前人研究进展】前人关于柑橘属果实的品质性状已有较多研究,主要集中在果肉品质的基础参数(糖、有机酸、膳食纤维、果胶、维生素和氨基酸等)、初级和次级代谢物中的有益组分、生物活性物质谱(酚类、类黄酮、类胡萝卜素和抗坏血酸)等方面[1,4-7]。临床试验和流行病学研究表明,柑橘类果实中生化活性物质的组分、含量及比例与其抗氧化特性密切相关。这些抗氧化物质通过抗脂质过氧化和消除氧自由基在预防基础代谢疾病过程中发挥作用[8,9]。此外,柑橘类果实的果皮也富含人体健康有益的成分,通常比果肉组织更有效[10,11]。果皮中的矿质元素如钙等,除参与细胞壁组成及维持果实紧实度外,还作为信号调控因子参与蜜柚成熟和贮藏过程中的生理调控[12]。这也意味着蜜柚果实中矿质元素的合成和积累除与果实品质密切相关外,对果实的成熟、采后贮藏也有一定的影响。蜜柚果实中的矿质营养除决定果树的生长发育和产量形成外,也是评价其品质的重要参量[13]。蜜柚果实以钾(K)、钙(Ca)、镁(Mg)的含量最为丰富[14]。传统饮食结构中增加柑橘类水果摄入,可显著改善以精淀粉为主食的人群的矿质营养。然而,矿质元素在人体内的有效性(即真正被人体有效吸收的部分),除与果实中矿质元素的含量直接相关外,同时还受到果实中其他组分,如植酸(myo- inositol-1,2,3,4,5,6-hexakis phosphoric acid,PA)、多酚或果胶等的影响。禾谷类作物、豆科、油料作物籽粒中的PA积累水平、组成形态(如不同价位磷酸肌醇)、生理代谢以及环境调控效应已被广泛报道[15,16,17]。【本研究切入点】蜜柚果实中的PA浓度处于什么范围,PA如何影响蜜柚果实中矿质元素的有效性等,尚未见相关报道。【拟解决的关键问题】本研究选用平和蜜柚产区5个代表性蜜柚品种,即白肉蜜柚(传统优质品种)、红肉蜜柚和三红蜜柚(特色品种)、黄金蜜柚和红棉蜜柚(普通品种),拟在明确蜜柚果实不同部位(黄皮层、白皮层、囊衣、果肉)中PA、矿质营养含量的基础上,进一步对矿质元素有效性的空间分布特征进行研究。相关结果为蜜柚矿质营养的生物强化、蜜柚品质资源筛选和功能食品开发提供参考。1 材料与方法
1.1 供试材料
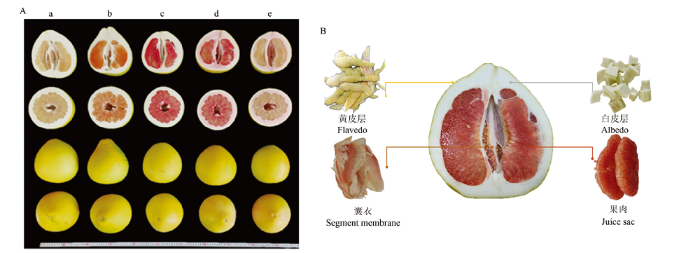
试验地为福建省漳州市平和县蜜柚试验区。供试5个蜜柚品种(白肉蜜柚、黄金蜜柚、红肉蜜柚、三红蜜柚、红棉蜜柚)的果皮和果肉颜色存在显著差异,但单果重等基本外观指标相近(图1-A)。图1
 新窗口打开|下载原图ZIP|生成PPT
图1供试蜜柚果实的全果剖面(A)及不同部位剖面图(B)
a:白肉蜜柚,b:黄金蜜柚,c:红肉蜜柚,d:三红蜜柚,e:红棉蜜柚
Fig. 1The whole and cross section and different tissues of pomelo fruit
a: White-fleshed pomelo, b: Golden-pomelo, c: Red-fleshed pomelo, d: Three-red pomelo, e: Red-albedo pomelo
1.2 取样方法
每个品种设3个种植小区,生育期内统一施肥及田间管理。2019年10月中下旬于果实成熟时统一采集样果。具体取样标准如下:每个小区内随机选择长势相近的2株果树,固定树位取样(统一选树冠外围中上部成熟度、大小、果皮颜色一致且无损伤的蜜柚果实,即5个品种×3个小区×2个重复)。样品取回实验室当天,先用自来水洗净,再用去离子水润洗3次。每个果实纵切,取1/4果实并细分为黄皮层、白皮层、囊衣和果肉(图1-B)。每个小区的2个蜜柚果实各部位分别等量混匀后归为一个重复。用于测定PA和矿质元素的各组织样品切小块后先105℃杀青30 min,然后在80℃的烘箱内烘干至恒重。烘干后的样品粉碎成均质后过40目孔筛,并置于干燥器中用于随后的生化分析。取样、处理及分析过程中所用玻璃器具需预先在30%的HNO3里浸泡。试验过程全程避免手、金属或玻璃等试验材料可能造成的污染。1.3 分析和测定方法
可食率计算方法为:可食率=食用果肉重/单果重×100%;果皮厚度、纵径与横径用游标卡尺测量,并根据纵径与横径的比值计算果形指数;
可溶性固形物含量(%)用便携式折射计测定(型号为Instrutherm, model RT-30 ATC);
可滴定酸(%)测定采用NaOH中和滴定法;
Vc含量(mg·kg-1)用2,6-二氯酚靛酚氧化还原法测定;
用ICP-MS测定矿质元素Ca、Mg、Fe、Zn和Mn含量[18];
P组分主要分析P(总磷)、PA(植酸)、PAP(植酸磷)和Pi(无机磷)含量,其中P含量测定采用ICP-MS,具体参考文献[18],PA和Pi含量测定采用分光光度法,具体参考文献[19];PAP含量为=PA×0.2818,并在此基础上计算PAP/P和 Pi/P。
矿质元素的有效性以PA与矿质元素的摩尔比来表示[20]。
此外,锌的有效性(TAZ,mg Zn?d-1)同时还参照MILLER等[21]的三元模型进行分析:
$TAZ=0.5\times 65\times 100\times \left\{ {{A}_{MAX}}+TDZ+{{K}_{R}}\times (1+\frac{TDP}{{{K}_{P}}})-\sqrt{{{[{{A}_{MAX}}+TDZ+{{K}_{R}}\times (1+\frac{TDP}{{{K}_{P}}})]}^{2}}-4\times {{A}_{MAX}}\times TDZ} \right\}$
式中,每日摄入锌的生物有效性(TAZ,mg Zn?d-1),即有效锌指数,将根据每日膳食中植酸(TDP,mmol PA?d-1)和锌(TDZ,mmol Zn?d-1)的含量拟合后获得。与肠内锌稳态和生物利用率相关的3个常数为AMAX(最大锌吸收)=0.091;KR(Zn受体结合反应的平衡解离常数)=0.680;Kp(Zn和PA结合反应的平衡解离常数)=0.033。以一天食用一个蜜柚作为Zn和PA的唯一来源(即果肉干重150 g为计)。
1.4 统计分析
数据最终结果以平均数±标准差表示。使用Microsoft Excel 2019对数据进行整理和计算,同时运用IBM SPSS Statistics 21对数据进行方差分析、相关性分析和聚类分析(Tukey’s test(P<0.05);Pearson’s correlation;Wards(square Euclidian distance)),并用RStudio绘制相关性图。2 结果
2.1 不同蜜柚果实的外观性状和基本品质性状
外观性状中,单果重、横纵比(果实、果肉)、果形指数、含水率(果皮、果肉)在供试蜜柚品种之间差异均不显著。红棉蜜柚的果皮重低、果皮厚度小,可食率较高。红肉蜜柚的果皮厚度最高,对应的可食率最低。白肉蜜柚、黄金蜜柚和三红蜜柚的果皮厚度、可食率相对较低(表1)。Table 1
表1
表1供试蜜柚品种果实基本外观和品质性状
Table 1
| 品种 Cultivar | 白肉蜜柚 White-fleshed pomelo | 黄金蜜柚 Golden-pomelo | 红肉蜜柚 Red-fleshed pomelo | 三红蜜柚 Three-red pomelo | 红棉蜜柚 Red-albedo pomelo | 平均值 Mean | 变异系数 CV |
|---|---|---|---|---|---|---|---|
| 单果重 Mean fruit weight (g) | 1717.6±97.7a | 2028.7±502.9a | 1624.3±164.1a | 1456.7±243.6a | 1577.6±244.7a | 1681 | 0.19 |
| 果皮重 Peel weigh (g) | 526.6±2.0a | 469.4±146.8a | 547.8±20.8a | 403.0±61.2ab | 176.9±129.1b | 424.7 | 0.37 |
| 果实横纵比 Fruit aspect ratio | 0.94±0.04a | 0.91±0.11a | 0.91±0.05a | 0.88±0.01a | 0.92±0.03a | 0.91 | 0.06 |
| 果肉横纵比 Flesh aspect ratio | 1.00±0.07a | 1.01±0.09a | 1.06±0.11a | 1.01±0.04a | 1.02±0.11a | 1.02 | 0.08 |
| 果皮厚度 Peel thick (mm) | 15.8±0.8b | 13.3±0.8b | 22.2±1.8a | 16.5±1.8b | 16.3±1.8b | 16.8 | 0.19 |
| 果形指数 Fruit shape index | 1.08±0.05a | 1.07±0.11a | 1.10±0.06a | 1.13±0.02a | 1.09±0.04a | 1.09 | 0.05 |
| 果皮含水率 Peel moisture content (%) | 0.80±0.01a | 0.79±0.01a | 0.80±0.01a | 0.79±0.00a | 0.78±0.00a | 0.79 | 0.01 |
| 果肉含水率 Pulp moisture rate (%) | 0.87±0.00a | 0.87±0.01a | 0.86±0.00a | 0.86±0.00a | 0.86±0.00a | 0.86 | 0.01 |
| 可食率 Edible rate (%) | 0.69±0.01b | 0.77±0.02ab | 0.66±0.03b | 0.72±0.01b | 0.88±0.10a | 0.75 | 0.12 |
| 可溶性固形物含量 TSS (%) | 12.6±1.1a | 10.5±0.6b | 11.8±0.7ab | 11.8±0.5ab | 11.7±0.4ab | 11.7 | 0.08 |
| 可滴定酸 TA (%) | 0.64±0.03a | 0.37±0.00c | 0.54±0.03ab | 0.46±0.04bc | 0.54±0.09ab | 0.51 | 0.19 |
| 维生素C含量 Vc (mg·kg-1) | 198.2±0.0ab | 215.1±11.7a | 199.9±7.8ab | 194.8±11.7ab | 191.4±5.9b | 199.9 | 0.06 |
| 固酸比 TSS/TA ratio | 20.4±1.8c | 27.4±1.3a | 22.0±0.6bc | 25.9±2.1ab | 21.9±3.0bc | 23.5 | 0.14 |
新窗口打开|下载CSV
基本品质性状中,可溶性固形物、可滴定酸、Vc、固酸比在不同蜜柚品种中均存在显著差异。其中三红蜜柚、黄金蜜柚的可滴定酸相对较低,固酸比相对较高。白肉蜜柚、红肉蜜柚和红棉蜜柚呈现相反的变化趋势。红棉蜜柚果肉中的Vc含量相对较低。
2.2 蜜柚果实中磷组分(P、PA、Pi)的空间分布
从P组分在果实不同部位的丰度来看,P、Pi和Pi/P在果肉中含量最高。PA和PAP/P在黄皮层含量最高,在果肉中含量最低,总体从外(黄皮层)到内(果肉)表现为持续性降低的趋势。从变异系数角度,总体表现为P、Pi以及Pi/P的变异系数在果皮(黄皮层、白皮层、囊衣)中相对较高,而在果肉中相对较低,这与PA和PA/P的分布规律相反。具体表现为P在黄皮层中变异最大,Pi和Pi/P在囊衣中变异最大,PA和PA/P在果肉中变异最大。从P组分在果实不同部位的变异系数角度看,PA或PA/P在果实不同部位中的变异均较大,而P或Pi在不同部位的变异均最小。
果皮(黄皮层、白皮层和囊衣)中P组分含量及比例在不同品种之间的差异均达到显著水平(白皮层中的Pi和Pi/P除外)。果肉中,PA和PA/P表现出显著的基因型差异,而P、Pi、Pi/P在不同蜜柚品种之间的差异不显著。其中不同蜜柚品种果肉中PA含量为0.14—0.37 g·kg-1,以红肉蜜柚最高,三红蜜柚和白肉蜜柚最低,最大相差2.6倍;PAP/P为2.55%—6.09%,以黄金蜜柚和红肉蜜柚最高,白肉蜜柚和三红蜜柚最低,总体趋势与不同品种间PA变化相似(表2)。
Table 2
表2
表25种蜜柚果实中磷组分的空间分布(DW)
Table 2
| 果实部位 Fruit location | 品种 Cultivar | 磷 P (g·kg-1) | 植酸 PA (g·kg-1) | 无机磷 Pi (g·kg-1) | 植酸磷/磷 PAP/P (%) | 无机磷/磷 Pi/P(%) |
|---|---|---|---|---|---|---|
| 黄皮层 Flavedo | 白肉蜜柚 White-fleshed pomelo | 1.37±0.08c | 1.25±0.05c | 0.88±0.06bc | 25.9±2.5c | 64.7±6.8ab |
| 黄金蜜柚 Golden-pomelo | 1.07±0.02d | 1.39±0.06c | 0.77±0.05c | 36.6±0.9a | 71.3±3.9a | |
| 红肉蜜柚 Red-fleshed pomelo | 1.72±0.02a | 1.29±0.04c | 1.13±0.05a | 21.1±0.6d | 65.7±2.4ab | |
| 三红蜜柚 Three-red pomelo | 1.60±0.03ab | 1.75±0.12b | 0.90±0.04bc | 30.9±1.8b | 56.1±2.8b | |
| 红棉蜜柚 Red-albedo pomelo | 1.54±0.10b | 2.16±0.09a | 0.97±0.05b | 39.4±2.0a | 63.2±4.2ab | |
| 平均数 Mean | 1.46 | 1.57 | 0.93 | 30.8 | 64.2 | |
| 变异系数 CV | 0.16 | 0.23 | 0.14 | 0.23 | 0.10 | |
| 白皮层 Albedo | 白肉蜜柚 White-fleshed pomelo | 0.57±0.01ab | 0.76±0.01a | 0.28±0.02a | 37.7±0.5a | 50.1±3.7a |
| 黄金蜜柚 Golden-pomelo | 0.51±0.04b | 0.59±0.02b | 0.27±0.03a | 32.6±2.2ab | 52.9±4.0a | |
| 红肉蜜柚 Red-fleshed pomelo | 0.61±0.00a | 0.57±0.03b | 0.31±0.03a | 26.2±1.5c | 50.4±5.2a | |
| 三红蜜柚 Three-red pomelo | 0.59±0.01a | 0.61±0.07b | 0.28±0.00a | 29.1±3.2bc | 46.8±1.3a | |
| 红棉蜜柚 Red-albedo pomelo | 0.63±0.04a | 0.58±0.06b | 0.31±0.01a | 26.1±3.0c | 49.7±4.1a | |
| 平均数 Mean | 0.58 | 0.62 | 0.29 | 30.3 | 50.0 | |
| 变异系数 CV | 0.08 | 0.13 | 0.09 | 0.16 | 0.08 | |
| 囊衣 Segment membrane | 白肉蜜柚 White-fleshed pomelo | 0.76±0.02c | 0.49±0.02ab | 0.38±0.04bc | 18.0±0.45a | 50.0±6.3ab |
| 黄金蜜柚 Golden-pomelo | 0.75±0.01c | 0.38±0.04bc | 0.31±0.01c | 14.2±1.5ab | 41.1±2.2b | |
| 红肉蜜柚 Red-fleshed pomelo | 0.89±0.01a | 0.33±0.03c | 0.49±0.02a | 10.4±1.0b | 55.6±2.2a | |
| 三红蜜柚 Three-red pomelo | 0.82±0.01b | 0.47±0.05ab | 0.45±0.03ab | 16.1±1.9a | 54.6±3.8a | |
| 红棉蜜柚 Red-albedo pomelo | 0.77±0.04bc | 0.50±0.04a | 0.41±0.04ab | 18.3±2.0a | 53.5±2.2a | |
| 平均数 Mean | 0.80 | 0.43 | 0.41 | 15.4 | 51.0 | |
| 变异系数 CV | 0.07 | 0.18 | 0.17 | 0.21 | 0.12 | |
| 果肉 Juice sac | 白肉蜜柚 White-fleshed pomelo | 1.59±0.07a | 0.14±0.02d | 1.22±0.01a | 2.55±0.31c | 76.8±4.1a |
| 黄金蜜柚 Golden-pomelo | 1.60±0.01a | 0.29±0.03b | 1.22±0.06a | 5.21±0.50a | 76.5±4.1a | |
| 红肉蜜柚 Red-fleshed pomelo | 1.70±0.06a | 0.37±0.01a | 1.14±0.07a | 6.09±0.41a | 67.4±6.7a | |
| 三红蜜柚 Three-red pomelo | 1.59±0.05a | 0.17±0.01d | 1.19±0.03a | 2.98±0.19c | 75.0±3.9a | |
| 红棉蜜柚 Red-albedo pomelo | 1.58±0.04a | 0.23±0.01c | 1.15±0.02a | 4.12±0.15b | 73.2±3.0a | |
| 平均数 Mean | 1.61 | 0.24 | 1.19 | 4.18 | 73.8 | |
| 变异系数 CV | 0.04 | 0.36 | 0.04 | 0.33 | 0.07 |
新窗口打开|下载CSV
2.3 蜜柚果实中矿质元素的空间分布
从果实不同部位矿质元素的丰度来看,果皮表现为Ca>Mg>P>Fe>Zn>Mn(仅黄皮层中Mn>Zn)。果肉中,P>Ca>Mg>Fe>Zn>Mn。从矿质元素在果实不同部位的浓度来看,P在果肉中浓度较高,而Ca、Mg、Fe和Mn在不同果皮空间(黄皮层,白皮层和囊衣)中的浓度均显著高于果肉。进一步对不同部位的果皮进行分析,Ca、Mg和Mn在外果皮层分布较多(黄皮层>囊衣>白皮层),而Fe表现为囊衣>白皮层>黄皮层。Zn在果实中的分布表现为黄皮层>果肉,而果皮其他部位(白皮层和囊衣)小于果肉。从矿质元素在果实不同空间部位的变异系数角度看,P、Mg在黄皮层中变异最大,在果肉和囊衣中变异最小。Fe在果肉中变异最大,在囊衣中变异最小。Zn和Mn在白皮层中变异最大,在黄皮层中变异最小。从同一部位不同矿质元素含量的变异系数角度看,微量元素(Zn、Fe、Mn)的变异程度总体高于大量/中量元素(P、Ca、Mg)(黄皮层中的Zn和Mn除外)。其中,黄皮层和果肉中变异最大的是Fe,变异最小的是Mg和P。白皮层和囊衣中变异最大的是Zn,最小的是P、Mg(白皮层)和Ca、Mg(囊衣)。
果皮中(黄皮层、白皮层和囊衣)矿质元素含量在不同品种之间的差异均达到显著水平。而果肉中P和Mn含量的差异不显著。分析可食部位果肉矿质元素含量可知,P含量为1.59—1.70 g·kg-1。Ca含量为0.76—1.02 g·kg-1,以黄金蜜柚显著高于其他蜜柚品种。Mg含量为0.64—0.71 g·kg-1,以黄金蜜柚和红肉蜜柚显著高于三红蜜柚。Fe含量为15.9—76.7 mg·kg-1,以红棉蜜柚最高,黄金蜜柚最低,两者相差近4.8倍。Zn含量为3.90—9.85 mg·kg-1,平均含量仅为Fe含量的1/4,以红肉蜜柚和三红蜜柚最高,红棉蜜柚最低,两者相差2.5倍。Mn的含量为1.91—2.58 mg·kg-1(表3)。
Table 3
表3
表35种蜜柚果实中矿质元素的空间分布(DW)
Table 3
| 果实部位 Fruit location | 品种 Cultivar | 磷 P (g·kg-1) | 钙 Ca (g·kg-1) | 镁 Mg (g·kg-1) | 铁 Fe (mg·kg-1) | 锌 Zn (mg·kg-1) | 锰 Mn (mg·kg-1) |
|---|---|---|---|---|---|---|---|
| 黄皮层 Flavedo | 白肉蜜柚 White-fleshed pomelo | 1.37±0.08c | 8.08±0.41bc | 1.98±0.12b | 30.0±1.0c | 12.5±1.1bc | 12.5±0.8c |
| 黄金蜜柚Golden-pomelo | 1.07±0.02d | 7.62±0.72c | 1.95±0.01b | 111.6±3.0a | 10.9±0.1c | 12.8±0.2c | |
| 红肉蜜柚Red-fleshed pomelo | 1.72±0.02a | 7.70±0.31c | 2.19±0.07ab | 38.2±1.4b | 13.3±0.4ab | 15.6±0.4ab | |
| 三红蜜柚Three-red pomelo | 1.60±0.03ab | 9.28±0.35ab | 2.17±0.07ab | 34.5±0.6b | 14.7±0.5a | 15.7±0.6a | |
| 红棉蜜柚Red-albedo pomelo | 1.54±0.10b | 10.4±0.6a | 2.43±0.16a | 25.6±0.3d | 13.8±0.6ab | 14.3±0.4b | |
| 平均数Mean | 1.46 | 8.61 | 2.14 | 48.0 | 13.0 | 14.2 | |
| 变异系数CV | 0.16 | 0.14 | 0.09 | 0.69 | 0.11 | 0.10 | |
| 白皮层 Albedo | 白肉蜜柚White-fleshed pomelo | 0.57±0.01ab | 2.56±0.03bc | 0.86±0.01bc | 77.5±0.3a | 2.01±0.21c | 3.62±0.22b |
| 黄金蜜柚Golden-pomelo | 0.51±0.04b | 3.03±0.17a | 0.94±0.07a | 70.6±2.9b | 2.84±0.24b | 0.96±0.12c | |
| 红肉蜜柚Red-fleshed pomelo | 0.61±0.00a | 2.31±0.16c | 0.79±0.04c | 78.1±3.4a | 2.98±0.18b | 4.25±0.21a | |
| 三红蜜柚Three-red pomelo | 0.59±0.01a | 2.61±0.08bc | 0.84±0.01bc | 23.9±0.4c | 7.80±0.10a | 3.89±0.23ab | |
| 红棉蜜柚Red-albedo pomelo | 0.63±0.04a | 2.82±0.01ab | 0.93±0.00ab | 81.1±0.6a | 2.84±0.24b | 4.01±0.04ab | |
| 平均数Mean | 0.58 | 2.66 | 0.87 | 66.3 | 3.69 | 3.34 | |
| 变异系数CV | 0.08 | 0.10 | 0.08 | 0.34 | 0.58 | 0.38 | |
| 囊衣 Segment membrane | 白肉蜜柚White-fleshed pomelo | 0.76±0.02c | 3.76±0.09a | 1.12±0.02c | 83.5±3.1a | 2.34±0.27d | 4.40±0.25ab |
| 黄金蜜柚Golden-pomelo | 0.75±0.01c | 3.69±0.10a | 1.18±0.00ab | 85.5±2.7a | 6.60±0.18b | 4.09±0.39ab | |
| 红肉蜜柚Red-fleshed pomelo | 0.89±0.01a | 3.45±0.01b | 1.22±0.02a | 70.9±5.4b | 9.39±0.24a | 4.49±0.51ab | |
| 三红蜜柚Three-red pomelo | 0.82±0.01b | 3.69±0.04a | 1.16±0.02bc | 84.2±2.0a | 4.59±0.21c | 4.99±0.52a | |
| 红棉蜜柚Red-albedo pomelo | 0.77±0.04bc | 3.75±0.02a | 1.18±0.01b | 88.9±0.6a | 6.51±0.04b | 3.86±0.22b | |
| 平均数Mean | 0.80 | 3.67 | 1.17 | 82.6 | 5.89 | 4.37 | |
| 变异系数CV | 0.07 | 0.03 | 0.03 | 0.08 | 0.41 | 0.12 | |
| 果肉 Juice sac | 白肉蜜柚White-fleshed pomelo | 1.59±0.07a | 0.88±0.14ab | 0.67±0.04ab | 19.8±2.2bc | 8.66±0.13b | 1.97±0.36a |
| 黄金蜜柚Golden-pomelo | 1.60±0.01a | 1.02±0.00a | 0.71±0.00a | 15.9±0.8c | 9.51±0.26ab | 1.91±0.08a | |
| 红肉蜜柚Red-fleshed pomelo | 1.70±0.06a | 0.82±0.01b | 0.70±0.02a | 29.3±1.3b | 9.85±0.15a | 2.11±0.23a | |
| 三红蜜柚Three-red pomelo | 1.59±0.05a | 0.76±0.01b | 0.64±0.02b | 20.4±2.3bc | 9.75±0.62a | 2.13±0.47a | |
| 红棉蜜柚Red-albedo pomelo | 1.58±0.04a | 0.82±0.03b | 0.70±0.01ab | 76.7±9.4a | 3.90±0.12c | 2.58±0.06a | |
| 平均数Mean | 1.61 | 0.86 | 0.68 | 32.4 | 8.33 | 2.14 | |
| 变异系数CV | 0.04 | 0.13 | 0.05 | 0.73 | 0.28 | 0.16 |
新窗口打开|下载CSV
2.4 蜜柚果实中矿质元素的有效性的空间分布
在明确蜜柚果实不同空间部位PA和矿质元素含量的基础上,进一步对果实不同部位矿质元素的有效性进行分析(有效性用PA和矿质元素的摩尔比表示)(表4)。Table 4
表4
表45种蜜柚果实中PA与矿质元素摩尔比空间分布(DW)
Table 4
| 部位 Fruitlocation | 品种 Genotype | [PA]/[Ca] | [PA]/[Mg] | [PA]/[Fe] | [PA]/[Zn] | [PA]/[Mn] |
|---|---|---|---|---|---|---|
| 黄皮层 Flavedo | 白肉蜜柚 White-fleshed pomelo | 0.0094±0.0009c | 0.0234±0.0023cd | 3.54±0.25c | 10.0±0.7cd | 8.37±0.88b |
| 黄金蜜柚 Golden-pomelo | 0.0111±0.0008abc | 0.0263±0.0010bc | 1.06±0.03e | 12.6±0.5b | 9.09±0.27b | |
| 红肉蜜柚 Red-fleshed pomelo | 0.0102±0.0001bc | 0.0217±0.0003d | 2.85±0.05d | 9.6±0.6d | 6.88±0.07c | |
| 三红蜜柚 Three-red pomelo | 0.0115±0.0008ab | 0.0297±0.0019ab | 4.30±0.35b | 11.9±0.8bc | 9.27±0.46b | |
| 红棉蜜柚 Red-albedo pomelo | 0.0126±0.0008a | 0.0328±0.0022a | 7.12±0.38a | 15.5±1.1a | 12.60±0.5a | |
| 平均数 Mean | 0.0110 | 0.0268 | 3.77 | 11.9 | 9.24 | |
| 变异系数 CV | 0.1167 | 0.1660 | 0.55 | 0.19 | 0.22 | |
| 白皮层 Albedo | 白肉蜜柚 White-fleshed pomelo | 0.0179±0.0004a | 0.0323±0.0002a | 0.83±0.01b | 37.4±3.3a | 17.5±1.3b |
| 黄金蜜柚 Golden-pomelo | 0.0118±0.0004c | 0.0231±0.0016b | 0.71±0.04b | 20.7±2.4b | 51.6±7.6a | |
| 红肉蜜柚 Red-fleshed pomelo | 0.0150±0.0011b | 0.0266±0.0019b | 0.62±0.03b | 19.0±0.5b | 11.2±0.9b | |
| 三红蜜柚 Three-red pomelo | 0.0143±0.0015bc | 0.0269±0.0028b | 2.17±0.26a | 7.8±0.8c | 13.2±1.8b | |
| 红棉蜜柚 Red-albedo pomelo | 0.0126±0.0012bc | 0.0231±0.0023b | 0.61±0.06b | 20.4±2.1b | 12.1±1.1b | |
| 平均数 Mean | 0.0143 | 0.0264 | 0.98 | 21.1 | 21.1 | |
| 变异系数 CV | 0.1655 | 0.1464 | 0.63 | 0.47 | 0.77 | |
| 囊衣 Segment membrane | 白肉蜜柚 White-fleshed pomelo | 0.0079±0.0002ab | 0.0160±0.0005a | 0.50±0.01a | 20.9±3.4a | 9.23±0.20ab |
| 黄金蜜柚 Golden-pomelo | 0.0062±0.0007bc | 0.0118±0.0012bc | 0.37±0.03b | 5.69±0.70bc | 7.79±1.46bc | |
| 红肉蜜柚 Red-fleshed pomelo | 0.0057±0.0006c | 0.0099±0.0009c | 0.39±0.04ab | 3.45±0.35c | 6.10±0.78c | |
| 三红蜜柚 Three-red pomelo | 0.0077±0.0010ab | 0.0149±0.0019ab | 0.47±0.06ab | 10.2±1.6b | 7.83±0.37bc | |
| 红棉蜜柚 Red-albedo pomelo | 0.0081±0.0007a | 0.0156±0.0014a | 0.48±0.04ab | 7.59±0.68bc | 10.70±0.50a | |
| 平均数 Mean | 0.0071 | 0.0137 | 0.44 | 9.56 | 8.34 | |
| 变异系数 CV | 0.1596 | 0.1977 | 0.14 | 0.68 | 0.21 | |
| 果肉 Juice sac | 白肉蜜柚 White-fleshed pomelo | 0.0102±0.0023d | 0.0079±0.0012d | 0.62±0.12c | 1.65±0.20c | 6.28±1.69b |
| 黄金蜜柚 Golden-pomelo | 0.0175±0.0017b | 0.0154±0.0015b | 1.57±0.15a | 3.07±0.31b | 12.8±0.7a | |
| 红肉蜜柚 Red-fleshed pomelo | 0.0273±0.0011a | 0.0192±0.0011a | 1.06±0.06b | 3.69±0.13b | 14.6±2.0a | |
| 三红蜜柚 Three-red pomelo | 0.0135±0.0011cd | 0.0096±0.0007cd | 0.71±0.14c | 1.72±0.24c | 6.80±1.63b | |
| 红棉蜜柚 Red-albedo pomelo | 0.0170±0.0003bc | 0.0122±0.0004c | 0.26±0.02d | 5.86±0.35a | 7.42±0.21b | |
| 平均数 Mean | 0.0171 | 0.0129 | 0.84 | 3.20 | 9.58 | |
| 变异系数 CV | 0.3547 | 0.3312 | 0.56 | 0.51 | 0.39 |
新窗口打开|下载CSV
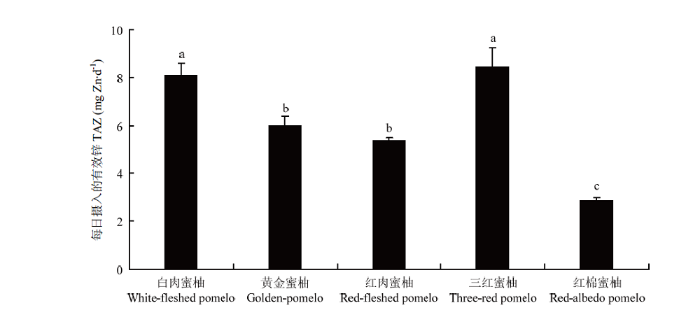
各矿质元素的摩尔比在果实不同部位的结果表明,[PA]/[Ca]最高的是果肉,最低的是囊衣;[PA]/[Mg]最高的是黄皮层,最低的是果肉;[PA]/[Fe]最高的是黄皮层,最低的是囊衣;[PA]/[Zn]最高的是白皮层,最低的是果肉;[PA]/[Mn]最高的是白皮层,最低的是囊衣。具体在可食部位的果肉中,不同矿质元素的摩尔比在不同蜜柚品种中均表现出显著的基因型差异。其中[PA]/[Ca]为10.2×10-3—27.3×10-3;[PA]/[Mg]为9.6×10-3—19.2×10-3,以红肉蜜柚最高,白肉蜜柚最低。[PA]/[Fe]为0.26—1.57,以黄金蜜柚最高,红棉蜜柚最低,最高相差近6倍。[PA]/[Zn]为1.65—5.86,TAZ为2.86—8.09。两种表征锌有效性的结果一致,均以红棉蜜柚锌的有效性最低,白肉蜜柚和三红蜜柚锌的有效性最高(表4,图2)。[PA]/[Mn]为6.28—14.56,以黄金蜜柚和红肉蜜柚显著高于其他蜜柚品种。
图2
 新窗口打开|下载原图ZIP|生成PPT
图2不同蜜柚品种的果肉锌有效性(TAZ)
不同小写字母表示差异显著(P<0.05)
Fig. 2Zn availability (TAZ) in the juice sac of five pommel fruits
Different lowercase letters indicate signi?cant difference (P<0.05)
从摩尔比在果实不同部位的变异系数角度看,[PA]/[Ca]和[PA]/[Mg]在果肉中变异最大,在黄皮层([PA]/[Ca])和白皮层([PA]/[Mg])中变异最小。[PA]/[Fe]和[PA]/[Mn]在白皮层中变异最大,在囊衣中变异最小。[PA]/[Zn]在囊衣中变异最大,在黄皮层中变异最小。从同一部位不同矿质元素摩尔比的变异系数角度看,黄皮层和果肉中[PA]/[Fe]变异最大;白皮层中[PA]/[Mn]最大;囊衣中[PA]/[Zn]最大;果肉中[PA]/[Fe]最大,[PA]/[Mg]最小。
2.5 蜜柚果实中P组分、矿质元素及其摩尔比之间的相关性
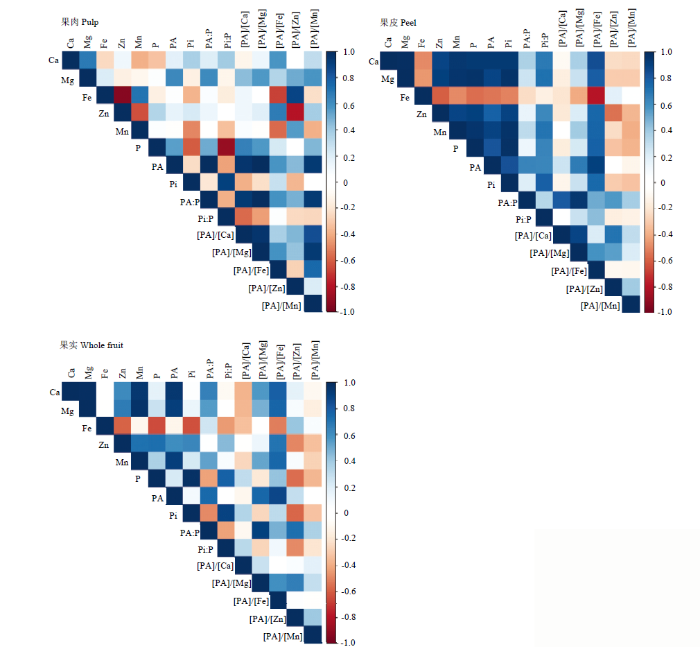
蜜柚果实中P组分、矿质元素及其摩尔比的相关性在果实不同部位的结果有所不同(图2、表5)。相关性总体表明,果皮中待测指标达到显著或极显著水平的结果要多于果肉和全果。Table 5
表5
表5果实不同部位磷组分、矿质元素及其摩尔比之间的相关性分析
Table 5
| 指标 Index | 果肉 Pulp | 果皮 Peel | 全果实 Whole fruit |
|---|---|---|---|
| PA×P | 0.547* | 0.825** | 0.225 |
| PA×Ca | 0.182 | 0.931** | 0.943** |
| PA×Mg | 0.620* | 0.889** | 0.917** |
| PA×Fe | 0.043 | -.534** | -0.113 |
| PA×Zn | 0.167 | 0.778** | 0.600** |
| PA×Mn | -0.045 | 0.892** | 0.912** |
| PA×[PA]/[Ca] | 0.950** | 0.263 | -0.101 |
| PA×[PA]/[Mg] | 0.997** | 0.671** | 0.752** |
| PA×[PA]/[Fe] | 0.575* | 0.903** | 0.870** |
| PA×[PA]/[Zn] | 0.452 | 0.016 | 0.290* |
| PA×[PA]/[Mn] | 0.934** | -0.112 | -0.005 |
| Zn×Fe | -0.930** | -0.596** | -0.589** |
| Zn×Mg | -0.145 | 0.901** | 0.678** |
| Zn×Ca | 0.121 | 0.883** | 0.618** |
| Zn×[PA]/[Zn] | -0.795** | -0.543** | -0.499** |
| Zn×[PA]/[Fe] | 0.678** | 0.757** | 0.704** |
| Zn×[PA]/[Mg] | 0.192 | 0.212 | 0.131 |
| Zn×[PA]/[Ca] | 0.129 | -0.186 | -0.036 |
| Fe×Mg | 0.217 | -0.460** | -0.039 |
| Fe×Ca | -0.245 | -0.490** | -0.010 |
| Fe×[PA]/[Zn] | 0.887** | 0.187 | 0.419** |
| Fe×[PA]/[Fe] | -0.672** | -0.787** | -0.518** |
| Fe×[PA]/[Mg] | 0.022 | -0.409** | 0.005 |
| Fe×[PA]/[Ca] | 0.127 | -0.206 | -0.334** |
| Mg×Zn | -0.145 | 0.901** | 0.678** |
| Mg×Fe | 0.217 | -0.460** | -0.039 |
| Mg×Ca | 0.687** | 0.986** | 0.987** |
| Mg×[PA]/[Zn] | 0.502 | -0.294* | 0.089 |
| Mg×[PA]/[Fe] | 0.343 | 0.791** | 0.767** |
| [PA]/[Mg]×[PA]/[Fe] | 0.581* | 0.587** | 0.596** |
| [PA]/[Mg]×[PA]/[Ca] | 0.959** | 0.880** | 0.274* |
| [PA]/[Zn]×[PA]/[Fe] | -0.275 | -0.091 | 0.048 |
新窗口打开|下载CSV
其中,蜜柚果肉中,PA与P、Mg、[PA]/[Ca]、[PA]/[Mg]、[PA]/[Fe]和[PA]/[Mn]呈显著正相关,而与[PA]/[Zn]的相关性不显著。Zn与Fe含量、[PA]/[Zn] 之间呈极显著负相关,而与[PA]/[Fe]呈显著正相关。Fe与[PA]/[Fe]呈极显著负相关,而与[PA]/[Zn]呈极显著正相关。Mg与Ca呈极显著正相关,[PA]/[Mg]与[PA]/[Ca]、[PA]/[Fe]呈显著正相关。[PA]/[Zn]与[PA]/ [Fe]之间的相关性不显著。
果皮(黄皮层、白皮层和囊衣)中,PA与P、Ca、Mg、Zn、Mn、[PA]/[Mg]、[PA]/[Fe]呈极显著正相关,而与Fe呈极显著负相关。Zn与Mg、Ca、[PA]/[Fe]之间呈极显著正相关,而与Fe含量、[PA]/[Zn]之间为极显著负相关。Fe与Mg、Ca、[PA]/[Fe]、[PA]/[Mg]之间呈极显著负相关。Mg与Ca、Zn、[PA]/[Fe]的含量呈显著正相关,而与Fe和[PA]/[Zn]呈显著负相关。[PA]/[Mg]与[PA]/[Fe]、[PA]/[Ca]极显著正相关。[PA]/[Zn]与[PA]/[Fe]之间的相关性不显著。
对全果实而言,PA与Ca、Mg、Zn、Mn、[PA]/[Mg]、[PA]/[Fe]、[PA]/[Zn]呈极显著正相关。Zn和Mg、Ca、[PA]/[Fe]呈极显著正相关,而与Fe、[PA]/[Zn]呈极显著负相关。Fe和[PA]/[Fe]、[PA]/[Ca]呈极显著负相关,而与[PA]/[Zn]呈极显著正相关。Mg与Zn和[PA]/[Fe]呈极显著正相关。[PA]/[Mg]与[PA]/[Fe]、[PA]/[Ca]显著正相关。[PA]/[Zn]与[PA]/[Fe]之间的相关性不显著。
2.6 聚类分析
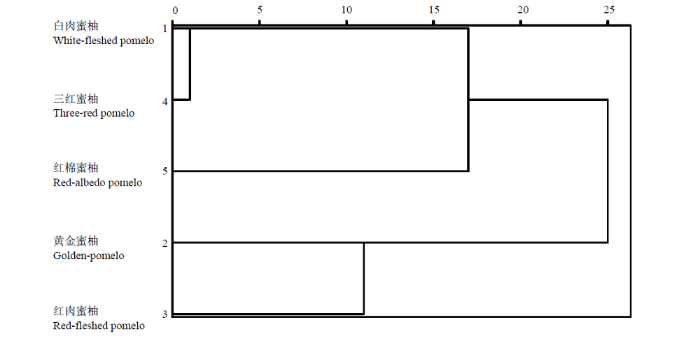
以蜜柚果肉中P组分、矿质元素的含量和摩尔比为变量的树状聚类结果如图4所示。黄金蜜柚和红肉蜜柚可归为一类,并与白肉蜜柚和三红蜜柚有明显的分离,红棉蜜柚为单独一类。图3
 新窗口打开|下载原图ZIP|生成PPT
图3果实不同部位磷组分、矿质元素及其摩尔比之间的相关性
Fig. 3Correlation coefficients among the contents of P components, minerals, and their molar ratio among various fruit location
图4
 新窗口打开|下载原图ZIP|生成PPT
图4以果肉中磷组分、矿质元素及摩尔比为变量的SPSS Ward法树状聚类图
Fig. 4Dendrogram calculated by the SPSS Ward method based on concentration of grain P components, minerals, and their molar ratio
3 讨论
营养学及流行病学的研究表明,水果的抗氧化特性与慢性疾病的发生表现为显著的负相关关系[9,22]。此外,水果中还富含人体营养所必需的矿物质。以柑橘为例,果实中富含的K、Mg、Ca和P等[23]是以谷类精淀粉为主食的人群矿质营养的有效补充。为明确蜜柚果实PA、矿质元素含量及其有效性的基因型以及空间区位分布差异,本研究在气候、土壤类型、肥料运筹和栽培管理条件一致的背景下,选择果实成熟度一致的蜜柚样果进行分析,有效排除了生态、气候因素以及果型大小对果实PA及矿物质积累可能产生的影响。3.1 蜜柚果实中PA的空间分布
蜜柚果实除富含诸多“有益元素”外,还存在“抗营养组分”。研究表明水果果实中抗坏血酸、果胶以及多酚等可显著抑制有益元素在人体内的有效吸收[9]。此外,PA也是一种不可忽视的抗营养成分。PA具有多羟基、多磷酸根的结构特点,其磷酸基团上的负氧离子可螯合矿质阳离子(K+、Mg2+、Ca2+、Zn2+、Fe2+、Mn2+、Cu2+等),并最终以植酸盐(phytate)的形式贮存在籽粒或果实中[19]。由于人或单胃动物消化系统(肠)内缺乏可降解PA的内源植酸酶,大量PA的存在会显著抑制矿质元素、Pi以及活性蛋白被人体的有效吸收[24]。因此,从品质营养角度看,PA是一种典型的抗营养因子。禾谷类作物(如水稻、玉米和小麦)、豆科作物和油料作物种子中P主要以PA的形式存在[19,24]。然而PA在蜜柚果实不同空间部位的分布特征、果实中植酸磷(PAP)是否是果实P的主要存在形式,相关信息还未见文献报道。本研究结果表明,PA在果皮中的含量高于果肉。进一步分析发现PA在果实不同空间部位具有较强的组织特异性,总体表现为从外(黄皮层)到内(果肉)持续性降低的趋势,其中黄皮层的PA含量是果肉中的6.5倍。从果实不同部位PAP的比例看,蜜柚黄皮层和白皮层中的PAP/P为30%左右,囊衣中占15.4%,而果肉中的比例仅为4.18%。说明蜜柚果实果肉中的磷组分比例与禾谷类、豆科、油料作物籽粒相比存在明显差异[25,26,27]。蜜柚果肉中Pi(73.8%)是P的最主要储存形式,而非PA。
本试验中,供试蜜柚果实的植酸含量(0.14—0.37 g·kg-1)低于MALIK等[28]在葡萄柚、橘子和酸橙果肉中测得的植酸含量(1.18—1.34 g·kg-1)。分析原因,除与柑橘属间遗传多样性、种植区域及其环境差异有关外,可能还与植酸的分析方法不同有关。同样采用盐酸提取法,本试验中蜜柚果皮植酸含量(黄皮层:1.57 g·kg-1、白皮层:0.62 g·kg-1)与前人在柠檬果皮(0.61 g·kg-1)、柑橘果皮(0.61 g·kg-1)、脐橙果皮(0.81 g·kg-1)、酸橙果皮(1.27 g·kg-1)中的结果相近[29,30]。
蜜柚果肉中PA含量虽然远低于谷物、豆类、坚果或其他籽粒[25],但PA(或PAP)在蜜柚果实各部位(黄皮层、白皮层、囊衣和果肉)中的变异均高于P或Pi,尤其以果肉最为明显。此外,蜜柚果实中PA含量存在显著的基因型差异。本试验中,果肉中富含矿质元素的红肉蜜柚,PA含量也最高。因此,进一步分析蜜柚果实矿质元素的有效性仍具有参考意义。
3.2 蜜柚果实中矿质元素含量及其有效性的空间分布分析
近年来,蜜柚集约化栽培体系中过量肥料投入(以N、P为主)造成的土壤酸化现象较为突出,已直接影响了土壤中Ca和Mg的有效利用。LI等[3]的调查表明,平和蜜柚产区有82.1%的土壤P过量、65.8%的土壤钙缺乏。本试验结果表明,蜜柚果肉(汁胞)中大/中量元素的含量表现为P>Ca>Mg,与CZECH等[14]的结果(Mg>P>Ca)有所不同。分析原因,除与柑橘属果树类型差异有关外,可能还与平和果园Mg、Ca缺乏影响了矿质养分在蜜柚果实中的转运和积累有关[31]。基于此,在平和蜜柚果园减施N、P的同时,增施Mg、Ca等中微量肥料,在缓解土壤酸化特性的同时,或可进一步改善蜜柚果实中Ca、Mg营养。在微量元素方面,本试验供试蜜柚果肉中Fe含量是Zn含量的4倍。这与CZECH等[14]发现不同柑橘属(橙、柚子、橘子、柠檬、青柠和葡萄柚)中柚果Fe含量较为丰富的结论相似。但本研究中,蜜柚果肉中的Fe含量显著低于MALIK等[28]在葡萄柚、橘子和酸橙果肉中的Fe含量,且Fe在本试验不同供试品种之间的变异相较其他矿质元素大,说明通过品种选育筛选高Fe蜜柚品种或通过生物强化进一步增加蜜柚果实中的Fe含量将具有一定的可行性。果皮作为蜜柚副产品深加工的主要原料,也是一种优质的矿质营养原料[32,33]。BARROS等[9]对巴西4种柑橘果实中果皮和果肉的营养品质进行比较,表明果皮中的矿物质、抗坏血酸、总酚和抗氧化能力均高于果肉。CZECH等[14]的结果也表明,柚果果皮中矿质元素含量高于果肉,以Ca为例,不同柑橘类果实中均表现为果皮高于果肉(50%以上),其中在蜜柚中的差异可到100%。与前人结果相似,本试验也表明蜜柚果皮中Ca的含量最高,总体表现为Ca>Mg>P>Fe>Zn>Mn,果皮中大量Ca的积累可能有利于其在果肉形成过程中发挥骨架支撑的作用[34]。但本试验果皮中Mg的含量显著高于P,这与?ZCAN等[35]在其他常见果实中的结论有所不同。这可能是蜜柚区别于其他水果矿质营养的积累特征之一。在微量元素方面,BARROS等[9]的研究表明Fe在柑橘类果实的不同部位中存在显著差异,果皮中的Fe含量比果肉中高6倍以上。本试验也得出相似的结论,但在果皮和果肉中的差异幅度相比其他柑橘类果实要小(表3)。
进一步对果实不同空间部位进行细分,结果表明矿质元素并不总是表现为果皮>果肉。P在果肉中含量最高,Ca、Mg、Mn和Fe虽然在不同果皮空间(黄皮层、白皮层和囊衣)的浓度均显著高于果肉,但峰值出现在果皮中的具体位置有所不同(其中Ca、Mg和Mn在黄皮层较多)。本试验与BARROS等[9]和GORINSTEIN等[36]的结果相似,Fe在蜜柚果实中的分布也表现为果皮>果肉,但最高值位于囊衣部位。Zn在蜜柚果实表现为黄皮层>果肉>白皮层或囊衣,而P在蜜柚果实表现为果肉>黄皮层>白皮层或囊衣。这些结果说明,与蜜柚果实中植酸从外果皮(黄皮层)到果肉逐渐降低的规律性变化有所不同,矿质元素在蜜柚果实内的合成和积累表现出一定的器官特异性。LADO等[37]的研究结果表明,果实营养成分的生理变化与其成熟度密切相关,而成熟过程同时还受到营养信号、转录因子(TFs)、内源激素和环境调控效应的综合影响[37,38,39]。同时,柑橘类果实的果皮和果肉成熟过程并不完全协调[40]。因此,柑橘类果实内外表现为相互独立的生理代谢过程和变化特征,可能是本试验中矿质营养表现出空间特异性的原因之一。
PA与矿质元素的摩尔比通常用来表征矿质元素在吸收过程中被抑制的程度[20],摩尔比值越高,该矿质元素的有效性越低。研究表明,当[PA]/[Zn]的摩尔比>15、5—15以及<5时,分别代表Zn的有效性被显著抑制(10%—15%)、中等抑制(30%—35%)以及高效抑制(50%—55%)状态;[PA]/[Fe]的摩尔比<10时,Fe元素被PA抑制的效应相对较小[41,42,43]。在此基础上,利用MILLER等[21]的三元模型,通过模拟Zn在人体(或单胃动物)肠胃内的真实消化吸收过程,进一步对供试蜜柚品种果肉的锌有效性(TAZ)进行了分析。本研究中不同矿质元素的摩尔比,在不同蜜柚品种以及不同果实部位中均表现为显著差异。其中供试蜜柚品种果肉中Zn和Fe的有效性都处于高效水平(红棉蜜柚果肉中的Zn除外)。相关分析结果也表明,PA与Mg、[PA]/[Mg]、[PA]/[Fe]在果实不同部位中(果肉、果皮、全果)都呈显著的正相关,其中在果皮中呈极显著正相关,而PA与[PA]/[Ca]只在果肉中呈极显著正相关。从这些结果可以推测,在蜜柚果皮深加工过程中,通过外源添加植酸酶的方式,可在减少植酸积累的同时同步提高果皮中Mg、Fe、Zn和Mn的有效性。
以果肉中P组分、矿质元素及其有效性为变量的聚类结果显示,三红蜜柚和白肉蜜柚属低PA、高矿质元素有效性品种。这与黄金蜜柚和红肉蜜柚的矿质营养有效性表现正好相反。而红棉蜜柚果肉中富Fe缺Zn的特点,使其果肉中元素有效性也表现为高Fe、低Zn。聚类分析的结果与平和各蜜柚品种目前的种植面积以及市场选择具有一定的吻合性,说明植酸、矿质营养的有效性可作为品种品质筛选的依据之一。
4 结论
蜜柚果实的PA、矿质营养及其有效性在不同蜜柚品种间以及果实不同空间区位(黄皮层、白皮层、囊衣和果肉)均存在显著差异。黄皮层中富含Ca,而果肉中P的含量最高。果实内的PA从外到内表现为持续性降低的趋势,且果肉部位的P主要以Pi的形式存在,而非PA。推测果肉的低PA背景对矿质元素的抑制效应相对有限。但需注意的是,蜜柚果皮(黄皮层、白皮层)中PA含量相对较高。因此,在果皮食品深加工过程中,为保证矿质元素有效性的高效发挥,可能需要预先脱PA处理。参考文献 原文顺序
文献年度倒序
文中引用次数倒序
被引期刊影响因子
URL [本文引用: 2]
URL [本文引用: 2]
[本文引用: 1]
[本文引用: 1]
[本文引用: 2]
[本文引用: 1]
URL
URL
URL
[本文引用: 1]
URL [本文引用: 1]
URLPMID:23442635 [本文引用: 6]
DOI:10.1016/j.foodchem.2018.11.146URLPMID:30611501 [本文引用: 1]

Bulky hard peel of Citrus natsudaidai is discarded and not utilized enough in Japan. In this study, the nutritional composition and volatile components of three cultivars of C. natsudaidai peel were determined. Considering the proximate composition and minerals, C. natsudaidai peels showed good carbohydrate and potassium content. The peel color varied probably due to the difference of cultivars. C. natsudaidai peels were extracted and analyzed for free amino acids and for fatty acids and volatile compounds. The amount of free amino acids in the extracts was not enough to affect the taste of extracts. The proportion of individual fatty acid was not comparable to other plant oils, however, typical aroma compounds with citrusy smell were identified. C. natsudaidai extracts could contribute for the utilization as flavoring additives without affecting taste.
URL [本文引用: 1]
[本文引用: 1]
[本文引用: 1]
DOI:10.1007/s12011-019-01727-1URLPMID:31030384 [本文引用: 4]
The aim of the study was to compare the mineral content between the peel and the pulp of citrus fruits and to determine which citrus fruit, among orange (Citrus sinensis), pomelo (Citrus maxima), mandarin (Citrus reticulata Blanco), lemon (Citrus limon), key lime (Citrus aurantifolia), and red, yellow, or green grapefruit (Citrus paradisi), is the richest in minerals. The research material consisted of fresh citrus fruits belonging to the genus Citrus L in the family Rutaceae. The fruits were purchased at a supermarket at one time. To prepare laboratory samples, each fruit was cut in half, and one half was homogenized, treating the sample as a whole (peel + flesh), while the other half was peeled and the pulp (F) and peel (P) were homogenized separately. To determine the content of minerals (Na(+), K(+), Ca(+2), Mg(+2), Fe(+2), Zn(+2), Cu(+2), Mn(+2), and Se(+2)), the samples were mineralized and analyzed using an Analytik Jena PlasmaQuant PQ 9000 inductively coupled plasma optical emission spectrometer. The content of macro- and micronutrients in the peel of most of the fruits far exceeded their quantity in the pulp. Oranges and pomelos are the fruits richest in iron and copper, so they could be recommended in cases such as hemoglobin production disorders resulting from a deficiency of these elements. Oranges can additionally enrich the body with potassium, phosphorus, and manganese, while lime can be a source of calcium, zinc, sodium, and especially potassium. It should also be noted that all citrus fruits are a very valuable source of potassium, which is needed to ensure the water and electrolyte balance.
DOI:10.1038/nbt1322URLPMID:17676037 [本文引用: 1]
Phytic acid in cereal grains and oilseeds is poorly digested by monogastric animals and negatively affects animal nutrition and the environment. However, breeding programs involving mutants with less phytic acid and more inorganic phosphate (P(i)) have been frustrated by undesirable agronomic characteristics associated with the phytic acid-reducing mutations. We show that maize lpa1 mutants are defective in a multidrug resistance-associated protein (MRP) ATP-binding cassette (ABC) transporter that is expressed most highly in embryos, but also in immature endosperm, germinating seed and vegetative tissues. Silencing expression of this transporter in an embryo-specific manner produced low-phytic-acid, high-Pi transgenic maize seeds that germinate normally and do not show any significant reduction in seed dry weight. This dominant transgenic approach obviates the need for incorporating recessive lpa1 mutations to create maize hybrids with reduced phytic acid. Suppressing the homologous soybean MRP gene also generated low-phytic-acid seed, suggesting that the strategy might be feasible for many crops.
URLPMID:23090587 [本文引用: 1]
DOI:10.1016/j.foodchem.2017.05.110URLPMID:28764025 [本文引用: 1]
Diets very rich in cereals have been associated with micronutrient malnutrition, and the biofortification of them, has been proposed as one of the best approaches to alleviate the problem. Durum wheat is one of the main sources of calories and protein in many developing countries. In this study, 46 durum varieties grown under full and reduced irrigation, were analyzed for micronutrients and phytate content to determine the potential bioavailability of the micronutrients. The variation was 25.7-40.5mg/kg for iron and of 24.8-48.8mg/kg for zinc. For phytate determination (0.462-0.952 %), a modified methodology was validated in order to reduce testing costs while speeding up testing time. Variation was detected for phytate:iron and zinc molar ratios (12.1-29.6 and 16.9-23.6, respectively). The results could be useful to generate varieties with appropriate levels of phytate and micronutrients, which can lead to the development of varieties rich in micronutrients to overcome malnutrition.
URLPMID:23083412 [本文引用: 2]
URLPMID:29401375 [本文引用: 3]
DOI:10.1016/j.foodchem.2008.02.064URLPMID:26047266 [本文引用: 2]
Rice is an important staple food in Asian countries. In rural areas it is also a major source of micronutrients. Unfortunately, the bioavailability of minerals, e.g. zinc from rice, is low because it is present as an insoluble complex with food components such as phytic acid. We investigated the effects of soaking, germination and fermentation with an aim to reduce the content of phytic acid, while maintaining sufficient levels of zinc, in the expectation of increasing its bioavailability. Fermentation treatments were most effective in decreasing phytic acid (56-96% removal), followed by soaking at 10 degrees C after preheating (42-59%). Steeping of intact kernels for 24h at 25 degrees C had the least effect on phytic acid removal (<20%). With increased germination periods at 30 degrees C, phytic acid removal progressed from 4% to 60%. Most wet processing procedures, except soaking after wet preheating, caused a loss of dry mass and zinc (1-20%). In vitro solubility, as a percentage of total zinc in soaked rice, was significantly higher than in untreated brown rice while, in steeped brown rice, it was lower (p<0.05). Fermentation and germination did not have significant effects on the solubility of zinc. The expected improvement due to lower phytic acid levels was not confirmed by increasing levels of in vitro soluble zinc. This may result from zinc complexation to other food components.
DOI:10.1093/jn/137.1.135URLPMID:17182814 [本文引用: 2]
The quantities of zinc and phytate in the diet are the primary factors determining zinc absorption. A mathematical model of zinc absorption as a function of dietary zinc and phytate can be used to predict dietary zinc requirements and, potentially, enhance our understanding of zinc absorption. Our goal was to develop a model of practical and informative value based on fundamental knowledge of the zinc absorption process and then fit the model to selected published data to assess its validity and estimate parameter values. A model of moderate mathematical complexity relating total zinc absorption to total dietary zinc and total dietary phytate was derived and fit to 21 mean data from whole day absorption studies using nonlinear regression analysis. Model validity, goodness of fit, satisfaction of regression assumptions, and quality of the parameter estimates were evaluated using standard statistical criteria. The fit had an R(2) of 0.82. The residuals were found to exhibit a normal distribution, constant variance, and independence. The parameters of the model, A(MAX), K(R), and K(P), were estimated to have values of 0.13, 0.10, and 1.2 mmol/d, respectively. Several of these estimates had wide CI attributable in part to the small number and the scatter of the data. The model was judged to be valid and of immediate value for studying and predicting absorption. A version of the model incorporating a passive absorption mechanism was not supported by the available data.
DOI:10.1021/jf9000132URLPMID:19719126 [本文引用: 1]
Mom's conventional wisdom of eating fruits and vegetables to lead a healthy life has evolved with scientific, fact-finding research during the past four decades due to advances in science of
[本文引用: 1]
[本文引用: 2]
[本文引用: 2]
URLPMID:29327163 [本文引用: 1]
DOI:10.1007/s13197-013-0978-yURLPMID:25694676 [本文引用: 1]
More than half of the world populations are affected by micronutrient malnutrition and one third of world's population suffers from anemia and zinc deficiency, particularly in developing countries. Iron and zinc deficiencies are the major health problems worldwide. Phytic acid is the major storage form of phosphorous in cereals, legumes, oil seeds and nuts. Phytic acid is known as a food inhibitor which chelates micronutrient and prevents it to be bioavailabe for monogastric animals, including humans, because they lack enzyme phytase in their digestive tract. Several methods have been developed to reduce the phytic acid content in food and improve the nutritional value of cereal which becomes poor due to such antinutrient. These include genetic improvement as well as several pre-treatment methods such as fermentation, soaking, germination and enzymatic treatment of grains with phytase enzyme. Biofortification of staple crops using modern biotechnological techniques can potentially help in alleviating malnutrition in developing countries.
[本文引用: 2]
DOI:10.34133/2021/3565791URLPMID:33629070 [本文引用: 1]
Conjugated polymers and oligomers have great potentials in various fields, especially in materials and biological sciences because of their intriguing electronic and optoelectronic properties. In recent years, the through-space conjugation system has emerged as a new assembled pattern of multidimensional polymers. Here, a novel series of structurally condensed multicolumn/multilayer 3D polymers and oligomers have been designed and synthesized through one-pot Suzuki polycondensation (SPC). The intramolecularly stacked arrangement of polymers can be supported by either X-ray structural analysis or computational analysis. In all cases, polymers were obtained with modest to good yields, as determined by GPC and (1)H-NMR. MALDI-TOF analysis has proven the speculation of the step-growth process of this polymerization. The computational study of ab initio and DFT calculations based on trimer and pentamer models gives details of the structures and the electronic transition. Experimental results of optical and AIE research confirmed by calculation indicates that the present work would facilitate the research and applications in materials.
[本文引用: 1]
[本文引用: 1]
[本文引用: 1]
DOI:10.1016/j.nut.2016.09.006URLPMID:28063510 [本文引用: 1]
Citrus fruits, including oranges, grapefruits, lemons, limes, tangerines, and mandarins, are among the most widely cultivated fruits around the globe. Its production is increasing every year due to rising consumer demand. Citrus-processing industries generate huge amounts of wastes every year, and citrus peel waste alone accounts for almost 50% of the wet fruit mass. Citrus waste is of immense economic value as it contains an abundance of various flavonoids, carotenoids, dietary fiber, sugars, polyphenols, essential oils, and ascorbic acid, as well as considerable amounts of some trace elements. Citrus waste also contains high levels of sugars suitable for fermentation for bioethanol production. However, compounds such as D-limonene must be removed for efficient bioethanol production. The aim of the present article was to review the latest advances in various popular methods of extraction for obtaining value-added products from citrus waste/byproducts and their potential utility as a source of various functional compounds.
[本文引用: 1]
[本文引用: 1]
URLPMID:21409363 [本文引用: 1]
[本文引用: 1]
[本文引用: 2]
URLPMID:25802366 [本文引用: 1]
URLPMID:23394500 [本文引用: 1]
[本文引用: 1]
URL [本文引用: 1]
[本文引用: 1]
URL [本文引用: 1]
