 ,, 项超, 吴列洪,, 李兵, 罗志高浙江省农业科学院作物与核技术利用研究所,杭州 310021
Analysis on the Characteristics of Soluble Sugar Components in Sweetpotato Storage Root and Its Relationship with Taste
SHEN ShengFa,, XIANG Chao, WU LieHong,, LI Bing, LUO ZhiGaoInstitute of Crops and Nuclear Technology Utilization, Zhejiang Academy of Agricultural Sciences, Hangzhou 310021通讯作者:
责任编辑: 李莉
收稿日期:2020-05-21接受日期:2020-07-6网络出版日期:2021-01-01
| 基金资助: |
Received:2020-05-21Accepted:2020-07-6Online:2021-01-01
作者简介 About authors
沈升法,E-mail:

摘要
关键词:
Abstract
Keywords:
PDF (479KB)元数据多维度评价相关文章导出EndNote|Ris|Bibtex收藏本文
本文引用格式
沈升法, 项超, 吴列洪, 李兵, 罗志高. 甘薯块根可溶性糖组分特征及其与食味的关联分析[J]. 中国农业科学, 2021, 54(1): 34-45 doi:10.3864/j.issn.0578-1752.2021.01.003
SHEN ShengFa, XIANG Chao, WU LieHong, LI Bing, LUO ZhiGao.
开放科学(资源服务)标识码(OSID):

0 引言
【研究意义】甘薯(Ipomoea batatas (L.) Lam.)是继水稻、小麦、马铃薯、玉米和木薯之后的第六大世界粮食作物,是许多发展中国家农民粮食、营养和收入的主要来源,根据联合国粮农组织(food and agriculture organization,FAO)2017年统计,全球甘薯年产量超过1.05亿t,主产国为中国、尼日利亚、坦桑尼亚、埃塞俄比亚、莫桑比克和印度尼西亚[1]。在许多非洲国家,甘薯不仅在粮食安全上具有重要作用,而且是克服儿童维生素A缺乏症的主要营养强化作物[2,3,4]。甘薯不仅含有大量的淀粉、可溶性糖、膳食纤维等碳水化合物,而且含有丰富的胡萝卜素、花青素、多酚类等功能活性物质,近年来,橘红肉、紫肉甘薯优质食用新品种日益受到消费者欢迎[5,6,7,8]。可溶性糖含量是甘薯块根食用品质和加工性能的重要指标,是影响甘薯甜度、黏度、质地、薯香味等食味指标的重要因子[8,9,10]。【前人研究进展】研究表明,甘薯甜度和食味与生薯可溶性糖含量关系不显著,而与熟薯可溶性糖含量呈显著正相关(P<0.01),熟薯可溶性糖含量是食用甘薯的重要品质指标[8,10-11]。生薯可溶性糖主要包括蔗糖、果糖、葡萄糖,另外还有微量的麦芽糖[12,13]。在甘薯块根生长发育过程中,不同品种的生薯可溶性糖组分含量变化是不同的,但蔗糖含量是主要的,占可溶性糖比例始终不低于68%[9,14]。在贮藏期间,块根的可溶性糖含量变化主要来源于麦芽糖,在贮藏约42 d时,出现麦芽糖含量高峰,但蔗糖含量始终是主要的[15,16]。在聚乙二醇(polyethylene glycol,PEG)诱导干旱的生长条件下或低温(4—6℃)诱导冻害后的贮藏条件下,块根的蔗糖含量快速升高,甚至成倍增加[17,18,19]。在熟化过程中块根主要由于淀粉酶催化淀粉水解产生大量的麦芽糖,而其他可溶性糖变化较小,因此,熟薯可溶性糖主要含有麦芽糖、蔗糖、果糖、葡萄糖4种可溶性糖[20]。2013年,LAI等[21]对7个食用品种烤制后发现甘薯麦芽糖糖含量从生薯含量的0—0.39%上升至8.81%—13.97%,占熟薯可溶性糖含量的68.48%—75.38%。2017年,WEI等[10]发现不同的熟化方法均可以产生大量的麦芽糖而大幅度提升甜度,但不同食用品种最佳糖化效果的熟化方法是不同的,心香和渝紫薯263适于蒸熟,金玉适于烤制,紫美适于煮熟。【本研究切入点】前人的研究主要聚焦于商用品种在甘薯块根生长发育、贮藏和抗逆条件下以及不同品种的不同熟化方法下可溶性糖组分和食味变化,由于研究的品种群体小,对甘薯熟化前后的可溶性糖组分变化与食味关联的研究仍鲜见报道。【拟解决的关键问题】本研究通过对102份甘薯块根的果糖、葡萄糖、蔗糖、麦芽糖4种可溶性糖与甜度及食味的相关性和逐步线性回归分析,明确可溶性糖组分对甜度和各项食味指标的作用以及与干物率相关性,为甘薯鲜食与加工的品种选择、专用品种选育和种质资源利用提供依据。1 材料与方法
1.1 试验材料
102份参试品种来自2019年浙江省农业科学院在杭州的甘薯种质资源鉴定保存圃。其中79份种质来源于2017—2018年浙江省第三次全国农作物种质资源普查与征集,其余23份来源于浙江省农业科学院长期保存的种质资源。收获的新鲜块根储藏45 d后,每份种质选取中等大小约150 g典型块根3个用作检测样品。1.2 可溶性糖测定方法
1.2.1 样品处理 新鲜块根纵切两半,一半用于生薯可溶性糖测定,另一半蒸熟后用于熟薯可溶性糖测定。生薯从纵切面均匀刮取1.000 g,在研钵中加1 mL水研磨匀浆,用4 mL水分2次冲洗入离心管中,室温放置2 h后涡旋振荡均匀,4 000 r/min离心10 min,吸取上清液1 mL,加3 mL乙腈,用0.22 μm微孔滤膜过滤后待色谱分析。熟薯从纵切面均匀刮取1.000 g,与5 mL水混匀置于离心管中,4℃过夜,间隔30 min涡旋振荡3次,4 000 r/min离心10 min,取上清液0.1 mL,加0.57 mL水和2 mL乙腈,用0.22 μm微孔滤膜过滤后待色谱分析。1.2.2 色谱分析 检测设备为Agilent 1260 InfintiyⅡ高效液相色谱仪、AllChrom ELSD 6000蒸发光散射检测器。固定相采用PrevailTM Carb ES Coumn-W 250 mm×4.6 mm柱,流动相为乙腈-水(体积比65﹕35),流速0.8 mL·min-1,柱温30℃,漂移管温度95℃,氮气流量2.4 mL·min-1,进样量4.0 μL。
1.3 干物率测定方法
测定可溶性糖的半块生薯取样1 g后剩余部分用于干物率测定。生薯刨丝后用80℃烘干至恒重。1.4 食味指标评价
测定可溶性糖的半块熟薯取样1 g后趁薯块温热即采用人工品尝打分法,食味先分为甜度、黏度、质地、香味、纤维5个指标打分,并最终给予食味总评,各指标评分采用100分制;以徐薯18为对照,对照食味指标分值均为75分,每份种质根据品尝食味与徐薯18的差异,给出相应的分值,分值高者为优。1.5 计算公式
生化甜度(biochemical sweetness,Bcs)=果糖含量值×1.75+葡萄糖含量值×0.7+蔗糖含量值×1+麦芽糖含量值×0.35[22]。可溶性糖含量=果糖含量+葡萄糖含量+蔗糖含量+麦芽糖含量。
1.6 数据处理
利用DPS v3.01统计软件进行相关性分析、回归分析。2 结果
2.1 干物率分布
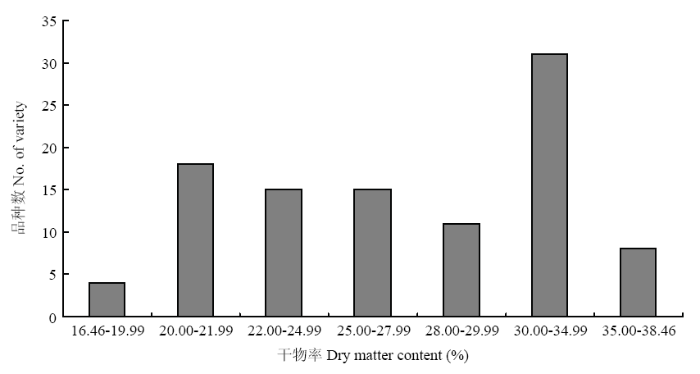
试验群体的块根干物率为16.46%—38.46%(图1),平均干物率为27.54%。低干物率(<25.00%)品种37份,其中干物率<22%的品种较多,有22份;中干(25.00%—29.99%)品种26份;高干(≥30.00%)品种39份,其中,干物率为30.00%—34.99%的品种较多,有31份。说明浙江省第三次全国农作物种质资源普查收集的甘薯种质以高干物率淀粉型品种和低干物率高产型品种较多,食饲两用和淀粉加工仍然是浙江省山区甘薯的重要用途。图1
 新窗口打开|下载原图ZIP|生成PPT
图1试验群体的干物率分布
Fig. 1Distribution of dry matter content of the test group
2.2 可溶性糖组分含量
由表1可知,所有参试品种不论是生薯还是熟薯,均含有果糖(fructose,Fru)、葡萄糖(glucose,Glu)、蔗糖(sucrose,Suc)和麦芽糖(maltose,Mal)4种可溶性糖。在生薯中,可溶性糖(soluble sugar,Sol)含量为34.27—82.99 mg·(g·FW)-1,平均含量为56.91 mg·(g·FW)-1,干物率类型间存在干物率低的品种生薯可溶性糖含量反而高的趋势。其中,蔗糖含量最高,平均含量为25.79 mg·(g·FW)-1,占生薯可溶性糖的45.31%,干物率类型间存在干物率高的品种蔗糖含量也高的趋势,但不同类型间含量差距较小。葡萄糖和果糖含量依次居中,平均含量分别为12.76和11.58 mg·(g·FW)-1,两者含量相近,干物率类型间存在干物率低的品种葡萄糖和果糖含量反而高的趋势,不同类型间含量差距较大。麦芽糖含量最低,平均含量为6.79 mg·(g·FW)-1,仅占生薯可溶性糖的11.92%,与蔗糖一样,干物率类型间存在干物率高的品种麦芽糖含量也高的趋势。Table 1
表1
表1不同干物率类型的生薯和熟薯可溶性糖组分含量
Table 1
| 类型 Type | 项目 Item | 生薯Raw (mg·(g·FW)-1) | 熟薯Steamed (mg·(g·FW)-1) | ||||||||
|---|---|---|---|---|---|---|---|---|---|---|---|
| Fru | Glu | Suc | Mal | Sol | Fru | Glu | Suc | Mal | Sol | ||
| 试验群体 Test group | 最小值Min | 1.82 | 1.58 | 6.49 | 0.92 | 34.27 | 1.88 | 1.09 | 7.24 | 14.80 | 56.70 |
| 最大值Max | 26.05 | 30.46 | 59.21 | 24.67 | 82.99 | 25.14 | 27.09 | 60.23 | 136.16 | 172.95 | |
| 平均值Mean | 11.58 | 12.76 | 25.79 | 6.79 | 56.91 | 10.09 | 10.75 | 26.38 | 63.85 | 111.07 | |
| 变异系数CV(%) | 50.46 | 55.35 | 37.93 | 61.08 | 15.50 | 53.99 | 57.73 | 38.36 | 43.80 | 21.92 | |
| 比例Proportion (%) | 20.34 | 22.43 | 45.31 | 11.92 | 100.00 | 9.08 | 9.68 | 23.75 | 57.49 | 100.00 | |
| 低干物率 Low dry matter content | 最小值Min | 9.75 | 10.05 | 7.90 | 0.92 | 45.18 | 8.30 | 8.35 | 8.35 | 14.80 | 56.70 |
| 最大值Max | 26.05 | 30.46 | 59.21 | 10.13 | 82.99 | 25.14 | 27.09 | 60.23 | 82.03 | 138.44 | |
| 平均值Mean | 16.86 | 18.63 | 23.17 | 4.00 | 62.67 | 14.87 | 15.79 | 24.08 | 46.35 | 101.08 | |
| 变异系数CV(%) | 23.87 | 28.01 | 44.81 | 53.85 | 11.57 | 29.48 | 31.49 | 44.51 | 36.34 | 16.55 | |
| 比例Proportion (%) | 26.91 | 29.73 | 36.98 | 6.38 | 100.00 | 14.71 | 15.62 | 23.82 | 45.85 | 100.00 | |
| 中干物率 Medium dry matter content | 最小值Min | 1.82 | 1.58 | 12.41 | 3.00 | 38.55 | 1.92 | 1.42 | 11.64 | 28.15 | 65.33 |
| 最大值Max | 19.60 | 26.28 | 41.05 | 14.12 | 71.26 | 17.78 | 21.43 | 44.68 | 121.62 | 162.76 | |
| 平均值Mean | 11.29 | 12.85 | 25.29 | 7.26 | 56.69 | 9.82 | 10.91 | 25.56 | 70.70 | 117.00 | |
| 变异系数CV(%) | 38.63 | 44.42 | 29.53 | 45.51 | 13.61 | 39.83 | 44.94 | 29.63 | 37.49 | 21.43 | |
| 比例Proportion (%) | 19.92 | 22.66 | 44.61 | 12.81 | 100.00 | 8.39 | 9.33 | 21.85 | 60.43 | 100.00 | |
| 高干物率 High dry matter content | 最小值Min | 2.33 | 2.33 | 6.49 | 2.48 | 34.27 | 1.88 | 1.09 | 7.24 | 18.93 | 66.53 |
| 最大值Max | 15.32 | 21.22 | 43.34 | 24.67 | 64.99 | 12.53 | 16.86 | 47.21 | 136.16 | 172.95 | |
| 平均值Mean | 6.75 | 7.14 | 28.60 | 9.11 | 51.60 | 5.73 | 5.87 | 29.10 | 75.88 | 116.59 | |
| 变异系数CV(%) | 49.04 | 59.71 | 34.12 | 49.29 | 14.21 | 49.53 | 61.58 | 35.46 | 38.18 | 22.99 | |
| 比例Proportion (%) | 13.08 | 13.83 | 55.42 | 17.66 | 100.00 | 4.91 | 5.04 | 24.96 | 65.09 | 100.00 | |
新窗口打开|下载CSV
在熟薯中,可溶性糖含量为56.70—172.95 mg·(g·FW)-1,平均含量为111.07 mg·(g·FW)-1,低、中干物率类型间含量差距大,但中、高干物率的品种类型间含量相近。其中,麦芽糖含量是最高的,平均含量63.85 mg·(g·FW)-1,占熟薯可溶性糖的57.49%,约65%的品种麦芽糖含量占比超过50.00%,干物率类型间存在干物率高的品种麦芽糖糖含量也高的趋势,不过在中、低干物率类型间平均含量差距高达24.35 mg·(g·FW)-1,而高、中干物率类型间平均含量差距仅5.18 mg·(g·FW)-1。蔗糖、葡萄糖和果糖在熟薯中的可溶性糖含量占比依次减小,均与生薯中的含量差距较小。
在变异系数上,无论在生薯还是熟薯中,果糖、葡萄糖、蔗糖、麦芽糖4种组分的变异系数均较高,品种间含量差异较大,但可溶性糖的变异系数较小,不过块根蒸熟后品种间可溶性糖含量差异有所扩大。低干物率品种的果糖和葡萄糖含量较高,品种间差异较小。
综上所述,在甘薯的生薯可溶性糖中,蔗糖含量最高,但干物率类型间的可溶性糖含量差异主要由果糖和葡萄糖含量决定,低干物率类型中相对容易筛选出生薯高可溶性糖、高果糖品种;在甘薯的熟薯可溶性糖中,麦芽糖含量占主导地位,中、高干物率类型中相对容易筛选出熟薯高可溶性糖、高麦芽糖品种。
2.3 在蒸熟过程中块根可溶性糖含量的变化
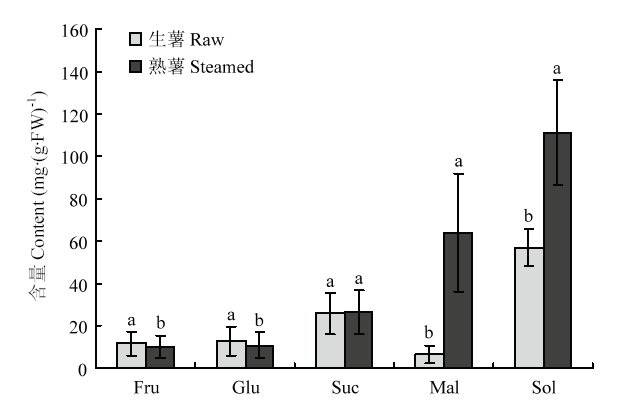
在蒸熟过程中块根可溶性糖含量发生了明显的变化(图2和表2),蒸熟后块根平均可溶性糖含量在生薯56.91 mg·(g·FW)-1的基础上增加了54.73 mg·(g·FW)-1,占熟薯可溶性糖含量的46.62%,在102份种质中仅有1份蒸熟后含量反而变小。在可溶性糖组分中,麦芽糖含量变化非常大,蒸熟后平均含量增加了57.51 mg·(g·FW)-1,即约90%的麦芽糖是在蒸熟过程中产生的,甚至有81份品种的麦芽糖增量超过了可溶性糖含量变化。果糖、葡萄糖的含量变化同样是显著的,85%以上的品种含量是降低的,不过果糖、葡萄糖与麦芽糖相比变化有限,平均含量分别下降了1.46和1.97 mg·(g·FW)-1,仅分别占熟薯可溶性糖含量的1.4%和1.9%。蔗糖含量由于增加和下降的品种均较多,因此,群体平均含量变化不明显,仅增加了0.64 mg·(g·FW)-1,但含量变化范围比果糖和葡萄糖大。综上所述,甘薯蒸熟过程中淀粉酶作用下产生了大量的麦芽糖,从而大幅提升了可溶性糖含量,而果糖、葡萄糖、蔗糖主要来源于生薯可溶性糖,蒸熟过程中含量变化较小。图2
 新窗口打开|下载原图ZIP|生成PPT
图2在群体水平上可溶性糖组分含量蒸熟前后差异
不同小写字母表示差异显著(P<0.05)
Fig. 2The content difference of soluble sugar components between before and after steaming at group level
Different letters indicated significant difference (P<0.05)
Table 2
表2
表2蒸熟后可溶性糖组分含量的增量
Table 2
| 组分 Component | 增量Increment (mg·(g·FW)-1) | 正向增量Positive increment | |||||
|---|---|---|---|---|---|---|---|
| 最小值 Min | 最大值 Max | 平均值 Mean | 含量占比 Proportion of content (%) | 品种数 No. of variety | 品种数占比 Proportion of variety No. (%) | ||
| Fru | -4.95 | 1.86 | -1.46 | -1.40 | 15 | 14.71 | |
| Glu | -6.42 | 2.04 | -1.97 | -1.90 | 8 | 7.84 | |
| Suc | -6.03 | 8.80 | 0.64 | 0.51 | 60 | 58.82 | |
| Mal | 5.21 | 122.41 | 57.51 | 49.41 | 102 | 100.00 | |
| Sol | -3.46 | 123.94 | 54.73 | 46.62 | 101 | 99.02 | |
新窗口打开|下载CSV
2.4 可溶性糖、干物率、食味之间的相关性
由表3可知,在生薯中,果糖与葡萄糖含量的相关系数r=0.976,关系密切,果糖含量(y)与葡萄糖含量(x)的拟合方程为y=0.807x+1.275;果糖、葡萄糖含量与蔗糖、麦芽糖含量均呈极显著负相关(P<0.01),而麦芽糖含量与蔗糖含量无明显相关性。生薯可溶性糖含量与果糖、葡萄糖、蔗糖含量均呈极显著正相关(P<0.01),但与果糖、葡萄糖含量关系较大,相关系数分别为0.509和0.518,而且干物率类型间果糖、葡萄糖含量差距大,蔗糖含量差距小,因此,生薯可溶性糖含量高低主要由果糖和葡萄糖含量决定。熟薯可溶性糖与麦芽糖含量的相关系数r=0.931,关系密切,与果糖含量呈显著负相关(P<0.05),与葡萄糖、蔗糖含量均无明显相关性,因此,熟薯可溶性糖含量高低是由麦芽糖含量决定的。生薯与熟薯之间的可溶性糖含量无明显相关性。Table 3
表3
表3可溶性糖组分、干物率、食味之间的相关系数
Table 3
| 品质性状 Quality trait | 生薯Raw | 熟薯Steamed | 干物率 Dry matter content | 食味Taste | ||||||||||||||||
|---|---|---|---|---|---|---|---|---|---|---|---|---|---|---|---|---|---|---|---|---|
| Fru | Glu | Suc | Mal | Sol | Bcs | Fru | Glu | Suc | Mal | Sol | Bcs | Swe | Vis | Tex | Fra | Fib | ||||
| 生薯 Raw | Glu | 0.976** | ||||||||||||||||||
| Suc | -0.624** | -0.623** | ||||||||||||||||||
| Mal | -0.517** | -0.507** | 0.155 | |||||||||||||||||
| Sol | 0.509** | 0.518** | 0.269** | -0.107 | ||||||||||||||||
| Bcs | 0.742** | 0.732** | 0.049 | -0.437** | 0.927** | |||||||||||||||
| 熟薯 Steamed | Fru | 0.974** | 0.947** | -0.592** | -0.504** | 0.509** | 0.734** | |||||||||||||
| Glu | 0.960** | 0.978** | -0.607** | -0.510** | 0.507** | 0.722** | 0.975** | |||||||||||||
| Suc | -0.584** | -0.589** | 0.953** | 0.188 | 0.287** | 0.065* | -0.535** | -0.560** | ||||||||||||
| Mal | -0.393** | -0.353** | -0.099 | 0.540** | -0.399** | -0.538** | -0.394** | -0.351** | -0.097 | |||||||||||
| Sol | -0.232* | -0.189 | -0.005 | 0.456** | -0.096 | -0.243* | -0.203* | -0.162 | 0.042 | 0.931** | ||||||||||
| Bcs | 0.346** | 0.362** | 0.037 | 0.017 | 0.568** | 0.517** | 0.422** | 0.426** | 0.154 | 0.331** | 0.647** | |||||||||
| 干物率 Dry matter content | -0.810** | -0.774** | 0.280** | 0.599** | -0.565** | -0.769** | -0.787** | -0.764** | 0.265** | 0.541** | 0.361** | -0.267** | ||||||||
| 食味 Taste | Swe | -0.080 | -0.053 | 0.170 | 0.308** | 0.238* | 0.093 | -0.070 | -0.039 | 0.135 | 0.563** | 0.677** | 0.567** | 0.101 | ||||||
| Vis | 0.317** | 0.328** | -0.177 | -0.037 | 0.259** | 0.279** | 0.301** | 0.332** | -0.235* | 0.392** | 0.504** | 0.541** | -0.274** | 0.684** | ||||||
| Tex | -0.235* | -0.213* | 0.187 | 0.366** | 0.052 | -0.100 | -0.226* | -0.197* | 0.144 | 0.643** | 0.698** | 0.445** | 0.251* | 0.827** | 0.673** | |||||
| Fra | -0.141 | -0.108 | 0.084 | 0.298** | 0.053 | -0.065 | -0.128 | -0.092 | 0.045 | 0.649** | 0.712** | 0.486** | 0.193 | 0.875** | 0.654** | 0.817 ** | ||||
| Fib | 0.138 | 0.131 | -0.078 | -0.018 | 0.101 | 0.115 | 0.143 | 0.130 | -0.073 | 0.235* | 0.304** | 0.327** | -0.044 | 0.464** | 0.380** | 0.416** | 0.537** | |||
| Tts | -0.014 | 0.008 | 0.077 | 0.247* | 0.199* | 0.091 | -0.014 | 0.017 | 0.029 | 0.604** | 0.707** | 0.576** | 0.060 | 0.957** | 0.785** | 0.855** | 0.917** | 0.543** | ||
新窗口打开|下载CSV
在生薯中,生化甜度与可溶性糖含量的相关系数r=0.927,关系密切,与果糖、葡萄糖含量均呈极显著正相关(P<0.01),与蔗糖呈极显著负相关(P<0.01),因此,生薯可溶性糖含量是反映甘薯生薯甜度的最适宜指标。由于果糖是所有糖分中甜度最高的,若蔗糖的甜度为1.00,则果糖、葡萄糖、麦芽糖的甜度分别为1.75、0.70和0.35,所以果糖含量是反映甘薯生薯甜度的另一重要指标。在熟薯中,生化甜度与可溶性糖、果糖、葡萄糖、麦芽糖含量均呈极显著正相关(P<0.01),但与可溶性糖含量关系最大,熟薯可溶性糖含量是反映甘薯甜度的最适宜指标。甘薯食味甜度与熟薯生化甜度相关系数r=0.567,呈极显著的正相关(P<0.01),因此,食味甜度可以较好地反映甘薯熟薯生化甜度的品种间差异。
在可溶性糖与食味的关系上,熟薯可溶性糖含量与各项食味指标的相关系数均最大,均呈极显著的正相关(P<0.01),因此,熟薯可溶性糖含量是反映甘薯块根甜度和食味的重要指标。熟薯麦芽糖含量与食味的香味、质地、总评、甜度及黏度均呈极显著的正相关(P<0.01),能较好地反映甘薯块根食味的品种间差异,因此,熟薯麦芽糖含量也是反映甘薯块根食味的重要指标。各食味指标之间均呈极显著的正相关(P<0.01),与食味总评相关系数大小依次为甜度、香味、质地、黏度、纤维,其中,甜度、香味与食味总评的相关系数分别为0.957和0.917,因此,甜度、香味与食味关系比较密切。
干物率与果糖、葡萄糖、生薯可溶性糖含量均呈极显著的负相关(P<0.01),与蔗糖、麦芽糖、熟薯可溶性糖含量均呈极显著的正相关(P<0.01)。干物率与食味关系不大,仅与质地呈显著正相关(P<0.05),与黏度呈极显著负相关(P<0.01)。不过,由表4可知,在低、中干物率类型中,干物率与麦芽糖、可溶性糖含量均呈极显著正相关(P<0.01),与食味总评、香味、质地均呈极显著正相关(P<0.01),与甜度呈显著正相关(P<0.05)。在高干物率类型中,干物率与熟薯可溶性糖、麦芽糖含量均无明显相关性,因而干物率与食味无关。
Table 4
表4
表4不同干物率类型中干物率与可溶性糖及食味的相关系数
Table 4
| 类型 | 熟薯Steamed | 食味Taste | ||||||||
|---|---|---|---|---|---|---|---|---|---|---|
| Type | Fru | Glu | Suc | Mal | Sol | Swe | Vis | Tex | Fra | Tts |
| 低干物率和中干物率 | -0.661** | -0.617** | 0.23 | 0.626** | 0.496** | 0.306* | 0.231 | 0.557** | 0.429** | 0.324** |
| Low and medium dry matter content | ||||||||||
| 高干物率 High dry matter content | -0.372* | -0.385* | 0.019 | 0.277 | 0.216 | -0.006 | -0.203 | -0.111 | -0.03 | -0.025 |
新窗口打开|下载CSV
2.5 蒸熟过程产生的可溶性糖对食味的贡献
将熟薯可溶性糖分解成生薯可溶性糖(x1)和蒸熟后可溶性糖增量(x2)2部分作为自变量,以食味指标(y)为因变量,自变量数据用z-score标准化后进行多元线性逐步回归分析,偏相关系数和贡献率(表5)表明,蒸熟后可溶性糖增量对食味增量的贡献率超过60%,处于主导地位,其中对甜度、黏度的贡献率均超过55%,对质地和香味的贡献率更大,均超过67%。说明可溶性糖对块根食味的影响主要来自于蒸熟过程产生的糖分,而不是生薯可溶性糖,熟薯可溶性糖含量是反映甘薯食味的重要指标。Table 5
表5
表5蒸熟后可溶性糖增量对食味的贡献率
Table 5
| 食味指标 Taste index | 最优标准化回归方程 Optimal standardized regression equation | 偏相关系数Partial correlation coefficient | 贡献率Contribution rate(%) | ||
|---|---|---|---|---|---|
| x1 | x2 | x1 | x2 | ||
| Tts | y = 76.817+1.567x1+2.418x2 | 0.548** | 0.707** | 39.32 | 60.68 |
| Swe | y = 76.606+1.418x1+2.016x2 | 0.564** | 0.692** | 41.29 | 58.71 |
| Vis | y = 75.762+2.444x1+3.000x2 | 0.459** | 0.531** | 44.89 | 55.11 |
| Tex | y = 77.319+1.240x1+2.599x2 | 0.445** | 0.718** | 32.30 | 67.70 |
| Fra | y = 77.378+1.134x1+2.341x2 | 0.423** | 0.689** | 32.63 | 67.37 |
新窗口打开|下载CSV
2.6 可溶性糖组分对食味的贡献
以熟薯中的果糖(x1)、葡萄糖(x2)、蔗糖(x3)、麦芽糖(x4)4种可溶性糖组分为自变量,以食味指标(y)为因变量,自变量数据用z-score标准化后进行多元线性逐步回归分析,偏相关系数(表6)表明,麦芽糖、果糖、蔗糖3种组分对食味总评、甜度、黏度、质地、香味5个指标均有极显著的正面影响,而葡萄糖对食味影响不显著。可溶性糖组分对食味的贡献大小依次为:麦芽糖>果糖>蔗糖>葡萄糖。麦芽糖对香味、质地的贡献率均超过50%,处于主导地位,超过了对甜度和黏度的贡献。果糖对黏度贡献最大,而蔗糖对质地的贡献超过了果糖,处于第2位。Table 6
表6
表6熟薯可溶性糖组分对食味的贡献率
Table 6
| 食味指标 Taste index | 最优标准化回归方程 Optimal standardized regression equation | 偏相关系数Partial correlation coefficient | 贡献率Contribution rate (%) | ||||
|---|---|---|---|---|---|---|---|
| Fru (x1) | Suc (x3) | Mal (x4) | Fru (x1) | Suc (x3) | Mal (x4) | ||
| Tts | y = 77.053+1.676x1+1.206x3+2.644x4 | 0.494** | 0.398** | 0.716** | 30.33 | 21.82 | 47.85 |
| Swe | y = 76.796+1.276x1+1.161x3+2.118x4 | 0.432** | 0.419** | 0.672** | 28.01 | 25.49 | 46.50 |
| Vis | y = 76.198+3.961x1+1.259x3+3.818x4 | 0.626** | 0.261** | 0.662** | 43.83 | 13.93 | 42.24 |
| Tex | y = 77.527+1.192x1+1.359x3+2.762x4 | 0.374** | 0.438** | 0.730** | 22.44 | 25.58 | 51.99 |
| Fra | y = 77.548+1.055x1+0.893x3+2.436x4 | 0.330** | 0.300** | 0.678** | 24.06 | 20.37 | 55.57 |
新窗口打开|下载CSV
2.7 可溶性糖特异种质
根据102份种质的生薯和熟薯可溶性糖组分含量、食味及干物率,筛选出11份可溶性糖特异种质(表7)。雪梨番薯、南瓜番薯、浙薯81为生薯高可溶性糖品种,干物率低,其中,雪梨番薯、南瓜番薯果糖含量高;浙薯81是一个高胡萝卜素品种,蔗糖含量达59.21 mg·(g·FW)-1,在所有种质中最高,比蔗糖含量第2高的杭州番薯高15.31 mg·(g·FW)-1,因而生薯可溶性糖含量和生薯甜度均是最高的,另外,由于兼具果糖、葡萄糖等还原糖含量低和胡萝卜素、蔗糖含量高的特点,油炸时不易焦片、色彩亮丽、风味好,浙薯81是一个优异的油炸薯片用品种。蜜东、金瓜番薯、心香、梓桐黄心、浙薯13为熟薯高可溶性糖的优质食用品种,其中,蜜东、金瓜番薯均为中干物率品种,蜜东在中干物率种质中麦芽糖糖含量最高,金瓜番薯在所有种质中熟薯生化甜度最高;心香、梓桐黄心、浙薯13为高干物率品种,心香的熟薯可溶性糖和果糖含量均较高,食味甜、糯,香味浓郁,目前是国内优异的精品鲜食品种之一,浙薯13熟薯可溶性糖和麦芽糖含量在所有种质中均最高,同时干物率也是最高的,是国内优异的淀粉、鲜食、薯脯加工兼用品种,占浙江省甘薯种植面积的1/4以上。杭州番薯、苋菜番薯、武义白心为熟薯低可溶性糖高干物率品种,蒸熟后块根甜度、黏度低,质地粉,适合作全粉加工用品种及育种亲本,其中,杭州番薯、苋菜番薯的熟薯可溶性糖和麦芽糖含量低,而武义白心的蔗糖含量和熟薯生化甜度在所有种质中最低。Table 7
表7
表711份特异种质的主要可溶性糖组分含量和食味
Table 7
| 种质名称 Germplasm name | 干物率 Dry matter content (%) | 生薯Raw | 熟薯Steamed | 食味 Taste | |||||
|---|---|---|---|---|---|---|---|---|---|
| Fru (mg·(g·FW)-1) | Suc (mg·(g·FW)-1) | Sol (mg·(g·FW)-1) | Bcs | Mal (mg·(g·FW)-1) | Sol (mg·(g·FW)-1) | Bcs | |||
| 雪梨番薯 Xuelifanshu | 19.24 | 26.05 | 12.13 | 68.63 | 78.71 | 28.17 | 93.04 | 85.46 | 75.3 |
| 南瓜番薯 Nanguafanshu | 21.02 | 24.31 | 17.57 | 68.70 | 78.44 | 16.63 | 86.77 | 87.35 | 77.3 |
| 浙薯81 Zheshu 81 | 22.81 | 10.04 | 59.21 | 82.99 | 85.55 | 25.68 | 103.45 | 90.21 | 76.7 |
| 蜜东 Midong | 27.77 | 11.87 | 17.80 | 47.40 | 48.95 | 121.62 | 157.55 | 81.64 | 81.3 |
| 金瓜番薯 Jinguafanshu | 26.45 | 12.52 | 33.42 | 67.18 | 67.86 | 82.46 | 146.50 | 98.04 | 81.7 |
| 心香 Xinxiang | 31.56 | 11.15 | 24.30 | 53.08 | 54.52 | 97.76 | 144.83 | 85.51 | 83.3 |
| 梓桐黄心 Zitonghuangxin | 35.25 | 8.68 | 15.48 | 41.23 | 39.90 | 129.71 | 160.32 | 79.46 | 83.0 |
| 浙薯13 Zheshu 13 | 38.42 | 4.01 | 27.43 | 49.01 | 41.93 | 136.16 | 172.95 | 86.43 | 82.7 |
| 杭州番薯 Hangzhoufanshu | 34.54 | 4.09 | 43.34 | 64.52 | 57.66 | 18.93 | 70.81 | 60.07 | 72.0 |
| 苋菜番薯 Xiancaifanshu | 31.30 | 4.89 | 40.90 | 56.99 | 55.22 | 21.76 | 66.53 | 54.07 | 73.3 |
| 武义白心 Wuyibaixin | 30.52 | 11.29 | 6.49 | 34.72 | 35.38 | 64.65 | 87.00 | 49.31 | 72.3 |
新窗口打开|下载CSV
3 讨论
3.1 甘薯块根可溶性糖组分特征及与干物率关系
本研究结果表明,甘薯的生薯中含有蔗糖、葡萄糖、果糖和麦芽糖4种可溶性糖,其中,蔗糖含量最高,平均含量占可溶性糖的比例为45.31%,占比最高的品种达到81.74%。前人研究结果表明极大多数商用品种的蔗糖含量占生薯可溶性糖比例超过50%[22,23],但在本试验中仍然有不少种质的蔗糖含量并不占有优势,尤其在低干物率类型中有16份种质的蔗糖含量低于果糖或葡萄糖。果糖和葡萄糖来源于蔗糖在蔗糖合成酶和转化酶催化下的分解[24],因此,这两种糖关系密切,含量相近,2000年,LA BONTE等[14]研究表明在生薯中果糖含量低于葡萄糖,两者关系式为y=0.721x+0.241。本研究表明生薯果糖与葡萄糖的相关系数r=0.976,两者关系式为y= 0.807x+1.275。果糖含量在不同的干物率类型间均存在较大的差距,低干物率品种的含量高。REES等[25]、YAN等[26]以及本研究表明,生薯可溶性糖、果糖、葡萄糖含量均与干物率之间存在负相关,生薯可溶性糖含量与果糖和葡萄糖含量关系最大,说明虽然在群体水平上蔗糖含量是主要的,但生薯可溶性糖含量高低主要由果糖和葡萄糖含量决定,果糖含量高的品种往往生薯可溶性糖含量也高。以前的一些研究在生薯中没有检出麦芽糖,这可能与检测方法、样品制备方法、取样时间、品种等有关。本试验高效液相色谱(high performance liquid chromatography,HPLC)搭配的蒸发光散射检测器(evaporative light scattering detector,ELSD)检测植物可溶性糖具有灵敏度高、检出限低的优点[27,28],102份种质的生薯中均检出了麦芽糖,含量为0.92—24.67 mg·(g·FW)-1,多数高干物率品种的生薯麦芽糖含量高于果糖或葡萄糖。张娟等[29]认为对甘薯可溶性糖提取影响最大的是料液比,适当加大水量有利于提高提取率,卞科等[30]用80%乙醇提取7个品种的薯干粉可溶性糖和SATO等[31]用95%乙醇提取16个品种的鲜薯可溶性糖时均没有检测出麦芽糖,可能与样品可溶性糖提取时加水量不足有关;而REES等[25]与本研究一样用纯水提取可溶性糖,12个品种36份样品均检出了麦芽糖。LEBOT[32]对243份甘薯材料经微波熟化后的块根可溶性糖测定时发现,麦芽糖含量为6.60—243.90 mg·(g·FW)-1,平均含量为92.87 mg·(g·FW)-1,占可溶性糖比例约40%,可溶性糖含量高低与果糖、葡萄糖、蔗糖含量无关,仅与麦芽糖含量有高度相关性。本研究表明,块根蒸熟时麦芽糖大量增加,含量从生薯的0.92—24.67 mg·(g·FW)-1增加至14.80—136.16 mg·(g·FW)-1,平均含量为63.85 mg·(g·FW)-1,占熟薯可溶性糖的57.49%,约65%品种的占比超过50%,熟薯可溶性糖与麦芽糖含量的相关系数r = 0.931,即熟薯可溶性糖含量高低主要由麦芽糖含量决定的。沈升法等[8]对276份紫肉甘薯材料进行了熟薯可溶性糖含量测定,试验群体平均干物率为32.85%,即高干物率材料占多数,结果表明,熟薯可溶性糖含量与干物率没有关系。本试验熟薯可溶性糖、麦芽糖含量与干物率的关系在高干物率类型中不显著,但在低、中干物率类型中则呈极显著正相关(P<0.01),熟薯可溶性糖平均含量在低、中干物率类型间存在较大差距,但在中干、高干物率类型间含量相近,说明优质食用品种容易从中、高干物率育种材料中筛选出。
3.2 甘薯块根可溶性糖及其组分在食味中的作用
前人研究及本研究表明,在甘薯食味指标中甜度与食味总评关系最大,其次是香味和质地,另外甜度、质地、香味、黏度互相呈正相关[8,21,23]。熟薯可溶性糖含量不仅能够反映甘薯甜度,而且与香味、质地、黏度呈明显正相关,因此,熟薯可溶性糖含量是甘薯食味的关键因子[8,11,21,31]。吴列洪等[11]对357份材料的生薯和熟薯糖测定后认为近80%的甜度增量来自蒸熟过程中产生的可溶性糖。本研究表明块根在蒸熟过程中可溶性糖变化主要在于麦芽糖大量产生,而果糖、葡萄糖和蔗糖变化有限。一般认为加热过程产生的麦芽糖来sw自于β-淀粉酶对糊化淀粉的水解,SATO等[31]研究了16个品种的法国油炸薯条可溶性糖、淀粉及淀粉酶变化与质地关系后发现,薯条加工时麦芽糖的产生不仅与β-淀粉酶活性有关,而且与β-淀粉酶耐热性、底物淀粉的含量和糊化温度有关,可溶性糖含量增加可以改善薯条质地的顺滑度、湿润感和粘结性。SUN等[33]通过微波抑制淀粉酶后的块根加麦芽糖在204℃烘烤可以恢复除苯乙醛外极大多数甘薯香气物质的产生,证实麦芽糖是甘薯香气的关键前体物质。因此麦芽糖是影响甘薯甜度、质地和香气的最重要糖分。果糖是4种组分中最甜和最黏的,若蔗糖的甜度为1.00,则果糖为1.75,葡萄糖为0.70,麦芽糖为0.35,而糖分黏度大小为果糖>葡萄糖>蔗糖>麦芽糖[21,34]。另外,果糖参与美拉德反应形成的香气优于葡萄糖[35]。蔗糖是非还原糖,虽然不参与甘薯高温熟制时香气的形成,但4种可溶性糖中只有蔗糖可以提高疏水性香气物质的溶解度而增强甘薯的香味[36]。本研究在甘薯种质资源群体水平上通过块根可溶性糖与食味的关联分析进一步探讨和证实了可溶性糖在食味中的作用,表明麦芽糖、果糖、蔗糖是影响甘薯块根食味的重要因子,可溶性糖组分对食味的贡献大小依次为麦芽糖>果糖>蔗糖>葡萄糖,在可溶性糖对食味的贡献中,麦芽糖贡献率近50%,对香味和质地的作用尤其突出。果糖对黏度的贡献最大,而蔗糖对质地的贡献优于果糖。4 结论
在甘薯的生薯和熟薯中均含有果糖、葡萄糖、蔗糖和麦芽糖4种可溶性糖,其中,麦芽糖、果糖、蔗糖是影响甘薯块根食用品质及加工性能的重要可溶性糖组分。在群体水平上,生薯中蔗糖含量最高,麦芽糖含量最少,生薯可溶性糖和果糖含量是反映甘薯生薯甜度的重要指标。在蒸熟过程中块根可溶性糖变化主要在于产生了大量麦芽糖,麦芽糖含量可占可溶性糖的50%以上,熟薯可溶性糖和麦芽糖含量是反映甘薯食味的重要指标。参考文献 原文顺序
文献年度倒序
文中引用次数倒序
被引期刊影响因子
[本文引用: 1]
[本文引用: 1]
[本文引用: 1]
DOI:10.1016/j.jfoodeng.2008.10.034URL [本文引用: 1]
DOI:10.1371/journal.pone.0204754URLPMID:30335772 [本文引用: 1]

BACKGROUND: Biofortified orange-fleshed sweetpotato (OFSP) varieties are being promoted to reduce vitamin A deficiencies due to their higher beta-carotene content. For OFSP varieties to have impact they need to be accepted and consumed at scale amongst populations suffering from vitamin A deficiencies. OBJECTIVE: We investigated the sensory and cultural acceptability of OFSP varieties amongst households with children aged between 2-5 years old in two areas in Central and Southern Malawi using an integrated model of the Theory of Planned Behavior (TPB) and the Health Belief Model (HBM). METHODS: Sensory acceptability was measured using a triangle, preference and acceptance test using three OFSP varieties and one control variety, among 270 adults and 60 children. Based on a food ethnographic study, a questionnaire on cultural acceptability was developed and administered to 302 caretakers. Data were analyzed by calculating Spearman's correlations between constructs and multiple linear regression modeling. RESULTS: The sensory evaluation indicates that all three OFSP varieties are accepted (scores >3 on 5-point scale), but there is a preference for the control variety over the three OFSP varieties. Almost all caretakers are intending to frequently prepare OFSP for their child in future (97%). Based on regression analysis, the constructs 'subjective norms' (beta = 0.25, p = 0.00) reflecting social pressure, and 'attitudes toward behavior' (beta = 0.14 p = 0.01), reflecting the feelings towards serving their child OFSP, were the best predictors for caretakers' behavior to prepare OFSP for their child. CONCLUSIONS: Our study shows that both sensory and cultural attributes can influence acceptability of varieties and consumption amongst households with children. Considering these attributes can improve the impact of biofortified crops in future programming, by reducing Vitamin A deficiencies through the intake of these nutrient-rich crops.
DOI:10.1270/jsbbs.16129URLPMID:28465663 [本文引用: 1]
Sweetpotato (Ipomoea batatas (L.) Lam.) is an outcrossing hexaploid that is cultivated in the tropics and warm-temperate regions of the world. Sweetpotato has played an important role as a famine-relief crop during its long history and has recently been reevaluated as a health-promoting food. In Japan, sweetpotato is used for a wide range of applications, such as table use, processed foods, and alcohol and starch production, and two groups at National Agriculture Research Organization (NARO) undertake the breeding of cultivars for these applications. Sweetpotato breeders utilize breeding processes such as grafting for flower induction and the identification of incompatibility groups before crossing to conquer problems peculiar to sweetpotato. For table use, new cultivars with high sugar content were released recently and have become popular among Japanese consumers. New cultivars with high anthocyanin or beta-carotene content were released for processed foods and use as colorants. As raw materials, new cultivars with high alcohol yield were released for the production of shochu spirits. In addition, new cultivars with high starch yield and a cultivar containing starch with excellent cold-storage ability were released for starch production. This review deals with recent progress in sweetpotato breeding and cultivars for diverse applications in Japan.
DOI:10.1006/jfca.1999.0819URL [本文引用: 1]
DOI:10.3864/j.issn.0578-1752.2015.03.15URL [本文引用: 6]
【Objective】 The aim of this research is to define the edible quality index and to provide a basis for edible purple-fleshed sweetpotato breeding. 【Method】 The content of anthocyanin, dry matter, soluble sugar and reducing sugar in steamed root, and taste index were measured from 276 purple sweetpotato strains. In addition, the relationships between nutritional compositions and taste of steamed purple sweetpotato were analyzed. 【Result】 As the great variation coefficient of anthocyanin content, it is easy to screen high anthocyanin content varieties in purple sweetpotato breeding. It is the best method that ayamurasaki was crossed with non-purple-fleshed parents containing high sugar to improve the taste of filial purple-fleshed F1 generation of ayamurasaki. Reducing the group level of anthocyanin content would benefit to improve the breeding efficiency of edible purple-flesh sweetpotato. Even thoughanthocyanin content leass than 90 mg·100g-1FW, there was still a good breeding efficiency of edible purple-flesh sweetpotato with high anthocyanin content. There was a better efficiency of edible purple-fleshed breeding when dry matter content ranged from 27.5% to 38%, whereas the best breeding efficiency for dry matter content was ranged from 32% to 36.5%. Moreover, increasing the group level of soluble sugar content in steamed root would help to improve the efficiency of edible purple-fleshed breeding. Anthocyanin content showed highly significant negative effects on sweetness and fragrance of purple sweetpotato, and its negative effects on taste up to 51.30% of taste incremental contribution from soluble sugar. Dry matter content was highly significantly positively correlated with texture, fragrance, and coarse fiber of purple sweetpotato, but it was highly significantly negativelycorrelated with viscosity, and was closely significantly negatively correlated with sweetness. Therefore, dry matter content was little influence on total taste. On the other hand, soluble sugar in steamed root showed a significant effect on taste of purple sweetpotato, in which soluble sugar content had a highly significantpositive correlationwithsweetness,viscosity and texture. Furthermore, non-reducing sugar content had more contribution to sweetness, fragrance, and texture than reducing sugar content, and the contribution to taste incremental from non-reducing sugar was 2.3 times than that of the reducing sugar content. Sweetnessoccupiedan extremely important positionin the taste evaluation ofpurple sweetpotato, and its contributionrate of taste increment was up to 55.38%.【Conclusion】The content of anthocyanin and soluble sugar in steamed root is an important index for edible purple-fleshed varieties.In conclusion, it should take into account both nutrition andfood quality in edible purple-fleshed breeding, and anthocyanin content should be controlledless than90 mg·100g-1FW. The best way for traditional edible purple-fleshed sweetpotato breeding is to select purple-fleshed parent hybrid with high sugar-containing non-purple-fleshed parent.
DOI:10.1002/fsn3.496URLPMID:29188036 [本文引用: 2]
Changes in total starch and reducing sugar content in five sweetpotato varieties were investigated weekly during root development and following subjection of the roots to different postharvest handling and storage conditions. Freshly harvested (noncured) roots and cured roots (spread under the sun for 4 days at 29-31 degrees C and 63-65% relative humidity [RH]) were separately stored at ambient conditions (23 degrees C-26 degrees C and 70-80% RH) and in a semiunderground pit (19-21 degrees C and 90-95% RH). Changes in pasting properties of flour from sweetpotato roots during storage were analyzed at 14-day intervals. Significant varietal differences (p < .05) in total starch, sucrose, glucose, maltose, and fructose concentrations were registered. The total starch and sucrose content of the roots did not change significantly (p < .05) during root development (72.4 and 7.4%, respectively), whereas the average concentrations of glucose, maltose, and fructose decreased markedly (0.46-0.18%, 0.55-0.28%, and 0.43-0.21%), respectively. Storage led to decrease in total starch content (73-47.7%) and increase in sucrose and glucose concentrations (8.1-11.2% and 0.22-1.57%, respectively). Storage also resulted in reduction in sweetpotato flour pasting viscosities. Curing resulted in increased sucrose and glucose concentrations (9.1-11.2% and 0.45-0.85%, respectively) and marked reduction (p < .05) in total starch content (72.9-47.6%). This resulted in low pasting viscosities compared to flour from storage of uncured roots. These findings show that significant changes occur in the carbohydrate components of sweetpotato roots during storage compared to development and present an opportunity for diverse utilization of flours from sweetpotato roots in the food industry.
DOI:10.1371/journal.pone.0182604URLPMID:28827808 [本文引用: 3]
Sweetpotato has rich nutrition, good ecological adaptability and high yield. There is a lack of knowledge about the effects of cooking methods on starch and sugar components in elite Chinese cultivars. In this study, sweetpotato storage roots from four cultivars
[本文引用: 3]
[本文引用: 3]
DOI:10.1111/jfds.1985.50.issue-4URL [本文引用: 1]
DOI:10.21273/JASHS.118.2.236URL [本文引用: 1]
DOI:10.21273/JASHS.125.2.200URL [本文引用: 2]
DOI:10.1021/jf9902191URLPMID:10606553 [本文引用: 1]
Cured sweetpotato roots were stored at different temperatures (4.5, 15.6, and 24 degrees C) for 7 weeks and assayed for invertase activities and reducing sugar levels during two separate years. Invertase activities and reducing sugar concentration significantly increased in the roots kept at low temperature. Of the three types of invertases assayed, acid invertase specific activity was the highest. Acid invertase was the most influential in determining reducing sugar levels in stored sweetpotato. Cultivar differences were found in invertase specific activities and reducing sugar concentration. Reducing sugar content was highly correlated to acid and total invertase activity, regardless of cultivar.
DOI:10.1007/s13197-013-0960-8URLPMID:25477675 [本文引用: 1]
Three sweet potato cultivars (TNG57, TNG66, and TNG73), provided by the Taiwanese Agricultural Research Institute (TARI), were stored at either 15 degrees C or under ambient conditions (23.8 ~ 28.4 degrees C and 77.1 ~ 81.0 % of relative humidity). Sweet potato roots were randomly chosen from each replicate and evaluated for measurement of weight loss, sugar content analysis, and sprouting after 0, 14, 24, 48, 56, 70, 84, and 98 days of storage. Fresh sweet potato roots were baked at 200 degrees C for 60 min then samples were taken for sugar analysis. After 14 days of ambient condition storage, the sprouting percentages for TNG57, TNG66, and TNG73 were 100, 85, and 95 % respectively. When sweet potatoes were stored at 15 degrees C, the weight loss became less and no sweet potato root sprouted after 14 days of storage. Because manufacturers can store sweet potatoes at 15 degrees C for almost 2 month without other treatments, the supply capacity shortage in July and September can be reduced. The total sugar content slowly increased along with increasing the storage time. After baking, the total sugar content of sweet potatoes significantly increased due to the formation of maltose. Maltose became the major sugar of baked sweet potatoes. Raw sweet potatoes stored at 15 degrees C had higher total sugar contents after baking than those stored under ambient conditions. Raw sweet potatoes were recommended to be stored at 15 degrees C before baking.
DOI:10.15835/nbha45110651URL [本文引用: 1]
DOI:10.1016/j.postharvbio.2018.04.002URL [本文引用: 1]
[本文引用: 1]
[本文引用: 1]
DOI:10.1007/s13197-011-0453-6URLPMID:24426034 [本文引用: 4]
Sugar composition of seven sweet potato cultivars was successfully analyzed. Fresh CYY95-26 sweet potatoes had the highest (8.41%) total sugar content while TNG73 had the lowest (4.5%). For these fresh sweet potatoes, maltose content was very low (0 ~ 0.39%). Because 49.92 ~ 92.43% of total sugars were sucrose, sucrose was the major sugar composition of fresh sweet potatoes. After the baking treatment, the total sugar content of baked sweet potatoes was dramatically increased due to the formation of maltose. The maltose content significantly increased from 0 ~ 0.39% to 8.81 ~ 13.97% on dry weight basis. Therefore, maltose should be included in calculating the total sugar content. Electronic micrographs of fresh sweet potato samples showed that the size of starch granules was generally less than 20 mum. After the baking treatment, starch granules completely gelatinized.
[本文引用: 2]
[本文引用: 2]
DOI:10.1007/s13197-012-0900-zURLPMID:25477683 [本文引用: 2]
The objective of this study was to evaluate the influence of sugar composition on the sensory attributes of seven baked sweet potatoes. The sugar composition was analyzed using high performance liquid chromatography. Results showed that the total sugar content of baked sweet potatoes increased significantly because of the formation of maltose. The maltose content dramatically increased after baking, and became the major sugar component of baked sweet potatoes. On the other hand, baked sweet potatoes were evaluated on a 7-point hedonic scale for sensory analysis. Overall acceptability results showed that the panelists preferred baked CYY95-26 and TNG66 over the other baked varieties. Because the correlation between overall acceptability and sweetness was the highest (r = 0.69, p < 0.01), sweetness was determined as the most important factor determining the overall acceptability of baked sweet potatoes. Although sugar composition changed on baking, the overall acceptability of baked sweet potatoes was highly associated with the sucrose content.
URL [本文引用: 1]
URL [本文引用: 1]
DOI:10.1016/j.postharvbio.2008.03.019URL [本文引用: 2]
Abstract
It has previously been shown that sweetpotato cultivars differ in the efficiency by which their roots can heal wounds at low humidity, although this does not appear to relate to rate of wound-healing at high humidity. It has also been shown previously that there is a negative relationship between cultivar root dry matter (DM) content and efficiency of root wound-healing at low humidity (assessed by a lignification score; LS). Root DM content tends to be negatively related to root sugar levels. The study presented here was undertaken to examine further the role of carbohydrates in root response and ability to heal wounds in the presence of water stress. Data from 17 cultivars confirmed the negative correlation between LS and DM and the positive correlation between LS and root sugar levels. Measurement of sugar levels at the root surface both at the time of wounding and after complete healing (5 days) for 10 cultivars indicated a stronger relationship of LS with final sugar levels than initial DM content. This was confirmed in further experiments using a system of adjacent tissue cuboids cut from the parenchyma which were able to exhibit lignification almost as efficiently as whole roots. With this system it was also possible to demonstrate a relatively rapid accumulation of sugars within 24 h of healing. The data were examined further by the development of linear regression models of LS. Comparison of the levels of variance accounted for by the models indicates that LS is strongly cultivar dependent, and most of the cultivar effect is related to cultivar differences in sugar levels during wound-healing. Differences in sugar levels between roots/cuboids of each cultivar also have an effect. Further, the similarity of the models for the whole roots and cuboids gives us confidence in the validity of using the cuboids to investigate wound-healing of whole roots.[本文引用: 1]
[本文引用: 1]
[本文引用: 1]
[本文引用: 1]
[本文引用: 1]
[本文引用: 1]
[本文引用: 1]
[本文引用: 1]
[本文引用: 1]
DOI:10.1111/1750-3841.13978URLPMID:29178339 [本文引用: 3]
Sweetpotato French fries (SPFF) are growing in popularity, however limited information is available on SPFF textural properties in relation to chemical composition. This study investigated the relationship between chemical components of different sweetpotato varieties and textural characteristics of SPFF. Sixteen sweetpotato genotypes were evaluated for (1) chemical constituents; (2) instrumental and sensory textural properties of SPFF; and (3) the relationship between chemical components, instrumental measurements, and sensory attributes. Dry matter (DM), alcohol-insoluble solids (AIS), starch, sugar, and oil content, and also alpha- and beta-amylase activities were quantified in raw sweetpotatoes and SPFF. Peak force and overall hardness describing instrumental textural properties of SPFF were measured using a texture analyzer. Descriptive sensory analysis was conducted and 10 attributes were evaluated by a trained panel. Results showed that DM, AIS, and starch content in raw sweetpotatoes were significantly correlated (P < 0.05) with instrumental peak force and overall hardness (r = 0.41 to 0.68), and with sensory surface roughness, hardness, fracturability, and crispness (r = 0.63 to 0.90). Total sugar content in raw sweetpotatoes was positively correlated with sensory smoothness and moistness (r = 0.77), and negatively correlated with instrumental peak force and overall hardness (r = -0.62 to -0.69). Instrumental measurements were positively correlated with sensory attributes of hardness, fracturability, and crispness (r = 0.68 to 0.96) and negatively correlated with oiliness, smoothness, moistness, and cohesiveness (r = -0.61 to -0.91). Therefore, DM, AIS, starch, and total sugar contents and instrumental measurements could be used as indicators to evaluate sweetpotato genotypes for SPFF processing. PRACTICAL APPLICATION: In recent years, sweetpotato French fries (SPFF) have grown in popularity, but limited information is available on SPFF textural properties in relation to the differences in chemical constituents among sweetpotato varieties. This study demonstrated that sensory texture attributes of SPFF varied widely and were significantly correlated with chemical components such as dry matter, starch, and total sugar contents of raw sweetpotatoes and instrumental texture measurements of SPFF. The knowledge generated from this study will benefit the food industry and breeding programs with the selection of sweetpotato varieties for improved SPFF quality.
DOI:10.1007/s13197-017-2510-2URLPMID:28298685 [本文引用: 1]
When a raw sweet potato root is analysed, only sucrose, glucose and fructose are present but during cooking, starch is hydrolysed into maltose giving the sweet flavour to cooked roots. This study aimed at developing an HPTLC protocol for the rapid quantitative determination of maltose and total sugars in four commercial varieties and to compare them to 243 hybrids grouped by flesh colour (white, orange, purple). In commercial varieties, mean maltose content varied from 10.26 to 15.60% and total sugars from 17.83 to 27.77% on fresh weight basis. Hybrids showed significant variation in maltose content within each group, with means ranging from 7.65% for white-fleshed, to 8.53% in orange- and 11.98% in purple-fleshed. Total mean sugars content was 20.24, 22.11 and 26.84% respectively for white, orange and purple flesh hybrids. No significant correlations were detected between individual sugars but maltose and total sugars content were highly correlated. Compared to the best commercial variety (Baby), 25 hybrids (10.3%) presented a higher maltose content and 40 (16.5%) showed a higher total sugars content. HPTLC was observed as an attractive, cost efficient, high-throughput technique for quantitating maltose and total sugars in sweet potatoes. Perspectives for improving sweet potato quality for consumers' requirements are also discussed.
DOI:10.1111/jfq.1994.17.issue-6URL [本文引用: 1]
URL [本文引用: 1]
Based on the understanding of the relation between glass transition temperature and stickiness,the reason of sticking of substances containing different kinds of sugars on the drier chamber wall during their spray drying was analysed and six methods were suggested to solve this problem,including modification of the substances and improvement of design of the drying process。
[本文引用: 1]
[本文引用: 1]
[本文引用: 1]
[本文引用: 1]
