 ,河北省农林科学院昌黎果树研究所,河北昌黎 066600
Catkin Phenotypic Diversity and Cluster Analysis of 211 Chinese Chestnut Germplasms
LI Ying, ZHANG ShuHang, GUO Yan, ZHANG XinFang, WANG GuangPeng,Changli Institute of Pomology,Hebei Academy of Agricultural and Forestry Sciences,Changli 066600, Hebei通讯作者:
责任编辑: 赵伶俐
收稿日期:2020-04-2接受日期:2020-07-15网络出版日期:2020-11-16
| 基金资助: |
Received:2020-04-2Accepted:2020-07-15Online:2020-11-16
作者简介 About authors
李颖,E-mail:

摘要
关键词:
Abstract
Keywords:
PDF (828KB)元数据多维度评价相关文章导出EndNote|Ris|Bibtex收藏本文
本文引用格式
李颖, 张树航, 郭燕, 张馨方, 王广鹏. 211份板栗种质资源花序表型多样性和聚类分析[J]. 中国农业科学, 2020, 53(22): 4667-4682 doi:10.3864/j.issn.0578-1752.2020.22.013
LI Ying, ZHANG ShuHang, GUO Yan, ZHANG XinFang, WANG GuangPeng.
开放科学(资源服务)标识码(OSID):

0 引言
【研究意义】板栗(Castanea mollissima Bl.)起源于中国,植株抗旱、耐瘠薄,果实营养价值高,是世界上山地开发所依赖的重要坚果类树种[1]。板栗在中国已有4 000多年的栽培历史,现广泛分布在境内24个省、市、自治区,各地板栗在长期的自然演化和人工选择下,形成了各具特色、遗传丰富的种质资源,挖掘利用潜力巨大[1,2]。明确种质遗传多样性是开展创新利用的基础,其中表型性状多样性是种质整体多样性的一个重要组成部分[3,4,5],对种质的表型性状值进行科学分析,有助于了解其遗传稳定性和育种潜力,对发掘、利用和创新种质具有重要指导意义。【前人研究进展】目前关于板栗表型遗传多样性方面的研究,主要包括叶片、刺苞、果实、品质、枝条等性状[6,7,8,9,10,11,12,13],叶片和果实等性状的表型分化系数显示,板栗的表型变异主要来源于群体内部,同一群体品种间的变异更高,多样性程度高于群体间,叶片大小、叶柄的长(粗)度、果实形状、果实大小等形态性状的变异系数均高于10%,遗传多样性丰富,选择潜力巨大,中国板栗果实表型性状遗传稳定性高于品质性状,叶片性状由南向北表现出从长椭圆形逐渐变为椭圆形的规律,北方板栗果实质量小于南方板栗,枝条涉及的9个性状中,表型分化幅度较大,其主要变异来源为群体间变异。同时在分子研究方面,利用AFLP、SSR、ISSR 和RAPD等分子标记技术对栗属植物的多样性水平和起源问题也进行了研究[14]。取得的研究结果以及通过评价鉴定出的特异或优良种质,已在育种生产及科研利用中发挥了重要作用[15]。【本研究切入点】花序作为板栗的重要器官,其形态大小,两性花序的比例等性状是遗传变异的重要特征,同时对产量和品质影响巨大[3,16],但至今仍缺乏关于板栗花序相关性状遗传变异多样性的系统报道。同时以现有的分子生物学信息,在花序性状相关基因发掘不明确的情况下,很难有针对性地筛选花序性状优异的相关种质。【拟解决的关键问题】本研究以我国10个板栗主产区(群体)的211份实生良种、地方品种和古树资源为材料,鉴定评价其花序相关15个表型性状的遗传多样性程度,进一步丰富中国板栗表型性状遗传多样性信息,为现有板栗种质资源的挖掘、创新和保护提供科学支撑,提高育种效率,为今后核心种质的筛选提供依据,为花序表型相关性状的基因定位奠定前期基础。1 材料与方法
1.1 试验材料
以源自我国10个板栗主产区(群体)的211份实生良种、地方品种和古树资源为试验材料(表1)。试材保存于河北省昌黎果树研究所板栗种质资源圃,东经119°15′,北纬39°72′,属温带半湿润大陆性气候区,年平均气温11℃,无霜期186 d,年平均降水量638 mm。所有供试板栗种质均是在2004年统一嫁接于3年生‘燕山早丰’实生砧木上,每份种质嫁接5株,株行距4 m×4 m,常年树体整形修剪均采用轮替更新修剪法[17],每m2留枝量保持在6—9条,其他管理措施一致。2017—2019年,连续3年选取每份种质生长状况基本一致的健康树体3株,分别测量各单株花序相关表型性状。1.2 花序相关表型测定
花序长度、花序粗度和花序小花簇密度按照刘庆忠[18]方法测定。花轴粗度:在雄花盛花期,随机选取树冠外围1年生结果新枝中部的雄花序20条,采用游标卡尺测量花序中间花轴的直径(mm),精确到0.1mm,取平均值。
雄蕊长度=(花序粗度-轴粗度)/2。单位为mm,精确到0.1mm。
花序长粗比=(花序长度/花序粗度)×100%
花轴长粗比:花轴长度同花序长度。花轴长粗比=(花序长度/花轴粗度)×100%
轴序粗度比=(花轴粗度/花序粗度)×100%
每果枝雄花序个数:在雄花盛花期,随机选取树冠外围1年生结果新枝20条,调查其上雄花序数量,
取平均值。
每果枝两性花序个数:在雄花盛花期,随机选取树冠外围1年生结果新枝20条,调查其上两性花序数量,取平均值。
每果枝雌花个数:在雄花盛花期,随机选取树冠外围1年生结果新枝20条,调查其上雌花数量,取平均值。
每果枝总花序个数:在雄花盛花期,随机选取树冠外围1年生结果新枝20条,调查其上花序数量,取平均值。
每两性花序上雌花个数:在雄花盛花期,随机选取树冠外围1年生结果新枝20条,调查其上两性花序数量及两性花序上着生的雌花个数。每两性花序上雌花数=雌花总数/两性花序总数。
雄花序比例=(每果枝雄花序个数/每果枝总花序个数)×100%
两性花序比例=(每果枝两性花序个数/每果枝总花序个数)×100%。
1.3 数据分析
测量性状,计算均值(X)和标准差(δ),Shannon's多样性指数(H')的计算公式为:H'=-ΣPi ln Pi,参考文献[19,20,21,22,23]方法。试验数据采用Excel 2010统计并计算各性状的平均值、标准差和变异系数等,用IBM SPSS 20软件对表型数据进行相关性分析和主成分分析,使用EGMA 7.0软件对表型性状进行聚类分析。Table 1
表1
表1211份板栗种质资源编号、来源及名称
Table 1
| 序号 No. | 来源 Source | 资源名称 Name | 序号 No. | 来源 Source | 资源名称 Name | |
|---|---|---|---|---|---|---|
| 1 | 河北Hebei | 燕宝 Yanbao | 40 | 河北Hebei | 西寨2号 Xizhai 2 | |
| 2 | 河北Hebei | 燕秋 Yanqiu | 41 | 河北Hebei | 西寨1号 Xizhai 1 | |
| 3 | 河北Hebei | 燕丽 Yanli | 42 | 河北Hebei | 邢台薄皮 Xingtaibaopi | |
| 4 | 河北Hebei | 燕紫 Yanzi | 43 | 河北Hebei | 邢台垂枝 Xingtaichuizhi | |
| 5 | 河北Hebei | 遵化短刺 Zunhuadanci | 44 | 河北Hebei | 后南峪垂枝 Hounayuchuizhi | |
| 6 | 河北Hebei | 遵玉 Zunyu | 45 | 河北Hebei | 替码燕明 Timayanming | |
| 7 | 河北Hebei | 宽城榆树沟 Kuanchengyushugou | 46 | 河北Hebei | 变异燕明 Bianyiyanming | |
| 8 | 河北Hebei | 大桑园1号 Dasangyuan 1 | 47 | 河北Hebei | 抚宁薄皮 Funingbaopi | |
| 9 | 河北Hebei | 东冰窖1号 Dongbingjiao 1 | 48 | 河北Hebei | 前3 Qian 3 | |
| 10 | 河北Hebei | 金杖子1号 Jinzhangzi 1 | 49 | 河北Hebei | 大板红 Dabanhong | |
| 11 | 河北Hebei | 金杖子2号 Jinzhangzi 2 | 50 | 河北Hebei | 84--2 | |
| 12 | 河北Hebei | 桥7 Qiao 7 | 51 | 河北Hebei | 小官10 Xiaoguan 10 | |
| 13 | 河北Hebei | 早3113 Zao 3113 | 52 | 河北Hebei | 大官10 Da guan 10 | |
| 14 | 河北Hebei | 屈家早 Qujiazao | 53 | 河北Hebei | 燕山短枝 Yanshandanzhi | |
| 15 | 河北Hebei | 兴隆短刺 Xinglongduanci | 54 | 河北Hebei | 早丰 Zaofeng | |
| 16 | 河北Hebei | 大3113 Da 3113 | 55 | 河北Hebei | 北峪2号 Beiyu 2 | |
| 17 | 河北Hebei | 陈中熟 Chenzhongshu | 56 | 河北Hebei | 东陵明珠 DonglingMingzhu | |
| 18 | 河北Hebei | 白露 Bailu | 57 | 河北Hebei | 10补栽 10 Buzhai | |
| 19 | 河北Hebei | 大青裂 Daqinglie | 58 | 河北Hebei | 达1-3 DA 1-3 | |
| 20 | 河北Hebei | xl-001 | 59 | 河北Hebei | 侯庄2号 Houzhuang 2 | |
| 21 | 河北Hebei | xl-002 | 60 | 河北Hebei | 贾庄1号 Jiazhuang 1 | |
| 22 | 河北Hebei | 迁西壮栗 Qianxizhuangli | 61 | 河北Hebei | 干2-2 Gan2-2 | |
| 23 | 河北Hebei | 崔1 Cui 1 | 62 | 河北Hebei | 岔3 Cha 3 | |
| 24 | 河北Hebei | 艾峪口 Aiyukou | 63 | 河北Hebei | 沙坡峪3号 Shapoyu 3 | |
| 25 | 河北Hebei | 熊84 Xiong 84 | 64 | 河北Hebei | 燕栗2号 Yanli 2 | |
| 26 | 河北Hebei | 迁西早红 Qianxizaohong | 65 | 河北Hebei | 关堂64 Guantang 64 | |
| 27 | 河北Hebei | 去暑红 Qushuhong | 66 | 河北Hebei | 龙湾1号 Longwan 1 | |
| 28 | 河北Hebei | 青龙白 Qinglongbai | 67 | 河北Hebei | 龙湾5号 Longwan 5 | |
| 29 | 河北Hebei | 燕兴 Yanxing | 68 | 河北Hebei | 石场子2-2 Shichangzi2-2 | |
| 30 | 河北Hebei | 28-11 | 69 | 河北Hebei | 杨家峪13 Yanjiayu 13 | |
| 31 | 河北Hebei | 84--3 | 70 | 河北Hebei | 西沟7号 Xigou 7 | |
| 32 | 河北Hebei | 919 | 71 | 河北Hebei | 刑台丰收1 Xingtaifengshou 1 | |
| 33 | 河北Hebei | X12-55 | 72 | 河北Hebei | 塔54 Ta 54 | |
| 34 | 河北Hebei | 石场子1-1 Shichangzi1-1 | 73 | 河北Hebei | 上庄52 Shangzhuang 52 | |
| 35 | 河北Hebei | 燕奎 Yankiui | 74 | 河北Hebei | 下庄4号 Xiazhuang 4 | |
| 36 | 河北Hebei | 早1 Zao 1 | 75 | 河北Hebei | 燕金 Yanjin | |
| 37 | 河北Hebei | 早2 Zao 2 | 76 | 河北Hebei | 杨家峪5号 Yangjiayu 5 | |
| 38 | 河北Hebei | 早3 Zao 3 | 77 | 河北Hebei | 浡1 Bo 1 | |
| 39 | 河北Hebei | 邢台早熟 Xingtaizaoshu | 78 | 河北Hebei | 大录洞 Daludong | |
| 79 | 河北Hebei | 凤2 Feng 2 | 119 | 河北Hebei | 燕光 Yanguang | |
| 80 | 河北Hebei | 东沟峪39 Dongguoyu 39 | 120 | 河北Hebei | 燕晶 Yanjing | |
| 81 | 河北Hebei | 赵杖子11 Zhaozhangzi 11 | 121 | 河北Hebei | 粗城大屯 Kuanchengdatun | |
| 82 | 河北Hebei | 牛1 Niu 1 | 122 | 河北Hebei | 粗城下六 Kuanchengxialiu | |
| 83 | 河北Hebei | 杨家峪1号 Yangjiayu 1 | 123 | 河北Hebei | X19-94 | |
| 84 | 河北Hebei | 何家坟5 Hejiafeng 5 | 124 | 河北Hebei | 塌山1号 Tashan 1 | |
| 85 | 河北Hebei | M17-21 | 125 | 北京Beijing | 京暑红 Jingshuhong | |
| 86 | 河北Hebei | 波叶树 Boyeshu | 126 | 北京Beijing | BJHJ1 | |
| 87 | 河北Hebei | M18-16 | 127 | 北京Beijing | BJHH1 | |
| 88 | 河北Hebei | 1209 | 128 | 北京Beijing | 北京8号 Beijing 8 | |
| 89 | 河北Hebei | 硕丰 Shuofeng | 129 | 北京Beijing | 黑8 Hei 8 | |
| 90 | 河北Hebei | D5-71 | 130 | 北京Beijing | 燕昌 Yanchang | |
| 91 | 河北Hebei | 沙坡峪1号 Shapoyu 1 | 131 | 北京Beijing | 燕红 Yanhong | |
| 92 | 河北Hebei | 塔14 Ta 14 | 132 | 北京Beijing | 燕丰 Yanfeng | |
| 93 | 河北Hebei | 桑6 Sang 6 | 133 | 北京Beijing | 怀丰 Huaifeng | |
| 94 | 河北Hebei | 长南庄2号 Changnanzhuang 2 | 134 | 北京Beijing | 燕平 Yanping | |
| 95 | 河北Hebei | 杨家峪1-6 Yangjiayu 1-6 | 135 | 北京Beijing | 良乡1号 Liangxiang 1 | |
| 96 | 河北Hebei | 桑1 Sang 1 | 136 | 北京Beijing | BJHW | |
| 97 | 河北Hebei | 园门实生 Yuanmenshisheng | 137 | 山东Shandong | 红栗 Hongli | |
| 98 | 河北Hebei | 后南峪丰收1号 Hounanyufengshou1 | 138 | 山东Shandong | 徐家1号 Xujia 1 | |
| 99 | 河北Hebei | 周家峪6号 Zhoujiayu 6 | 139 | 山东Shandong | 尖顶油栗 Jiandingyouli | |
| 100 | 河北Hebei | H7-5 | 140 | 山东Shandong | 双合大红袍 Shuanghedahongpao | |
| 101 | 河北Hebei | H8-1 | 141 | 山东Shandong | 华光 Huaguang | |
| 102 | 河北Hebei | 燕明 Yanming | 142 | 山东Shandong | 华丰 Huafeng | |
| 103 | 河北Hebei | 兴隆早栗子 Xinglongzaolizi | 143 | 山东Shandong | 杂35 Za 35 | |
| 104 | 河北Hebei | 迁西署红 Qianxishuhong | 144 | 山东Shandong | 野杂 Yeza | |
| 105 | 河北Hebei | 东荒峪早 Donghuangyuzao | 145 | 山东Shandong | 黄棚 Huangpeng | |
| 106 | 河北Hebei | 青刘1号 Qingliu 1 | 146 | 山东Shandong | 沂蒙短枝 Yimengduanzhi | |
| 107 | 河北Hebei | 迁李1号 Qianli 1 | 147 | 山东Shandong | 泰栗1号 Taili 1 | |
| 108 | 河北Hebei | 南天门乡 Nantianmenxiang | 148 | 山东Shandong | 金丰 Jinfeng | |
| 109 | 河北Hebei | 大兰口 Dalankou | 149 | 山东Shandong | 红光 Hongguang | |
| 110 | 河北Hebei | 昌徐1号 Changxu 1 | 150 | 山东Shandong | 泰安薄壳 Taianbaoke | |
| 111 | 河北Hebei | 昌左1号 Changzu 1 | 151 | 山东Shandong | 新选1号 Xinxuan 1 | |
| 112 | 河北Hebei | 邢陆1号 Xinglu 1 | 152 | 山东Shandong | 石丰 Shifeng | |
| 113 | 河北Hebei | 迁西牛1 Qianxiniu 1 | 153 | 山东Shandong | 早实丰Zaoshifeng | |
| 114 | 河北Hebei | 去暑红-1 Qushuhong-1 | 154 | 山东Shandong | 大粒 Dali | |
| 115 | 河北Hebei | 去暑红-2 Qushuhong-2 | 155 | 山东Shandong | 郯城3号 Tancheng 3 | |
| 116 | 河北Hebei | 邢台短枝 Xingtaiduanzhi | 156 | 山东Shandong | 金平 Jinping | |
| 117 | 河北Hebei | 替码珍珠 Timazhenzhu | 157 | 山东Shandong | 东岳早丰 Dongyuezaofeng | |
| 118 | 河北Hebei | 迁早1 Qianzao 1 | 158 | 山东Shandong | 岱岳早丰 Daiyuezaofeng | |
| 159 | 山东Shandong | 黑烟青 Heiyanqing | 186 | 江苏Jiangsu | 焦扎 Jiaozha | |
| 160 | 山东Shandong | 烟泉 Yanquan | 187 | 江苏Jiangsu | 焦杂 Jiaoza | |
| 161 | 山东Shandong | 烟青 Yanqing | 188 | 江苏Jiangsu | 宜兴大红袍 Yixingdahongpao | |
| 162 | 山东Shandong | 鲁栗3号 Luli 3 | 189 | 江苏Jiangsu | 处暑红 Chushuhong | |
| 163 | 山东Shandong | 鲁栗2号 Luli 2 | 190 | 江苏Jiangsu | 青毛软刺 Qingmaoruanci | |
| 164 | 湖北Hubei | 罗田乌壳栗 Luotianwukeli | 191 | 江苏Jiangsu | 重阳蒲 Chongyangpu | |
| 165 | 湖北Hubei | DL-1 | 192 | 江苏Jiangsu | 九家种 Jiujiazhog | |
| 166 | 湖北Hubei | DL-2 | 193 | 浙江Zhejiang | 浙早1号 Zhezao 1 | |
| 167 | 湖北Hubei | DL-3 | 194 | 浙江Zhejiang | 上光栗 Shangguangli | |
| 168 | 湖北Hubei | DL-4 | 195 | 浙江Zhejiang | 毛板红 Maobanhong | |
| 169 | 湖北Hubei | 六月暴 Liuyuebao | 196 | 浙江Zhejiang | 浙江魁栗 Zhejiangkuili | |
| 170 | 湖北Hubei | 八月红 Bayuehong | 197 | 安徽Anhui | 大红袍 Dahongpao | |
| 171 | 湖北Hubei | 玫瑰红 Meiguihong | 198 | 安徽Anhui | 软刺早 Ruancizao | |
| 172 | 湖北Hubei | 鄂栗1号 Eli 1 | 199 | 安徽Anhui | 粘底板 Niandiban | |
| 173 | 湖北Hubei | 罗田林科所Luotianlinkesuo | 200 | 广西Guangxi | 广西14-1 Guangxi 14-1 | |
| 174 | 湖北Hubei | 桂花香 Guihuaxiang | 201 | 广西Guangxi | 广西14-2 Guangxi 14-2 | |
| 175 | 湖南Hunan | 桐优-33 Tongyou-33 | 202 | 广西Guangxi | 广西14-3 Guangxi 14-3 | |
| 176 | 湖南Hunan | 双季栗 Shuangjili | 203 | 广西Guangxi | 广西14-4 Guangxi 14-4 | |
| 177 | 湖南Hunan | 安优1号 Anyou 1 | 204 | 广西Guangxi | 广西14-5 Guangxi 14-5 | |
| 178 | 湖南Hunan | 步城优株 Buchengyouzhu | 205 | 广西Guangxi | 广西14-6 Guangxi 14-6 | |
| 179 | 湖南Hunan | 临湘优株1号 LinxiangYouzhu 1 | 206 | 广西Guangxi | 广西油栗 Guangxiyouli | |
| 180 | 湖南Hunan | 林场优株 Lichangyouzhu | 207 | 广西Guangxi | 广西玉林 Guangxiyulin | |
| 181 | 湖南Hunan | 石门优株 Shimenyouzhu | 208 | 陕西Shaanxi | 长安明捡栗 Changanmingjianli | |
| 182 | 湖南Hunan | 临湘优株2号 LinxiangYouzhu 2 | 209 | 陕西Shaanxi | 金真晚栗 Jinzhenwanli | |
| 183 | 湖南Hunan | 湖南黔栗 Hunanqianli | 210 | 陕西Shaanxi | 金真栗 Jinzhenli | |
| 184 | 湖南Hunan | 黄花优株 Huanghuayouzhu | 211 | 陕西Shaanxi | 镇巴双法 Zhenbashuangfa | |
| 185 | 湖南Hunan | 新田优株 Xintianyouzhu |
新窗口打开|下载CSV
2 结果
2.1 板栗种质资源花序相关表型多样性分析
由表2可知,板栗15个花序表型性状的变异系数和遗传多样性指数不尽相同,呈现出较大的变异和丰富的多样性。其中雄花序比例是所有性状中唯一变异系数低于10%,极差低于均值50%的性状,可见该性状整体离散度低,遗传稳定度高,其余14个性状的变异系数均高于10%,其中每果枝雌花个数最大为60.66%,说明这些性状遗传变异相对较大,而每果枝雌花个数更能反映品种间的差异。进一步研究发现,描述花序形态的表型性状变异系数介于15.70%—26.07%,说明这些表型性状变异幅度差异较少,而描述花序数量的表型性状变异系数介于7.37%—60.66%,证明花序数量的表型性状变异幅度差异较大。序轴粗度比的多样性指数最大为1.99,两性花序比例的多样性指数最小为1.41,花序形态表型性状中多样性指数范围是1.53—1.99,均值1.77;花序数量表型中多样性指数范围是1.41—1.87,均值1.63,表明花序形态表型性状的遗传多样性程度高于花序数量表型性状。Table 2
表2
表2211份板栗花序相关性状基本参数及多样性
Table 2
| 表型性状 Morphological character | 均值±标准差 Mean±SD | 中位数 Median | 众数 Mode | 极差 Rang | 变异系数 CV (%) | 多样性指数 H' |
|---|---|---|---|---|---|---|
| 花序长度Catkin length (cm) | 17.95±3.79 | 17.69 | 17.00 | 19.33 | 15.70 | 1.74 |
| 花序粗度Catkin width (mm) | 11.26±2.40 | 11.23 | 10.56 | 13.10 | 16.94 | 1.84 |
| 花序小花簇密度Density of catkin (numbers/cm) | 8.25±1.97 | 8.08 | 8.00 | 11.96 | 17.97 | 1.53 |
| 花轴粗度Floral axis width (mm) | 3.24±0.95 | 3.19 | 3.51 | 3.68 | 23.29 | 1.81 |
| 雄蕊长度Stamen length (mm) | 4.01±1.12 | 4.01 | 3.86 | 6.59 | 21.02 | 1.80 |
| 花序长粗比Catkin length/ Catkin width | 16.71±5.44 | 16.17 | 14.43 | 42.88 | 26.41 | 1.66 |
| 花轴长粗比Floral axis length / Floral axis width | 59.82±21.57 | 56.60 | 56.80 | 84.30 | 26.07 | 1.76 |
| 序轴粗度比Floral sxis width/ Catkin width | 0.30±0.09 | 0.28 | 0.25 | 0.93 | 21.91 | 1.99 |
| 花序形态表型均值Catkin types of phentotype mean | 21.16 | 1.77 | ||||
| 雄花序个数/果枝Male catkin numbers/ Bearing shoot | 7.28±3.67 | 7.00 | 8.00 | 11.60 | 29.34 | 1.73 |
| 两性花序个数/果枝Bisexual catkin numbers/ Bearing shoot | 0.89±1.06 | 0.81 | 1.00 | 3.51 | 58.19 | 1.41 |
| 枝雌花个数/果枝Female flower Numbers/ Bearing shoot | 1.02±0.67 | 1.02 | 0.81 | 5.16 | 60.66 | 1.87 |
| 总花序个数/果枝Catkin numbers/ Bearing shoot | 8.16±4.12 | 7.90 | 6.50 | 11.82 | 28.14 | 1.73 |
| 雌花个数/两性花序Female flower numbers/ Bisexual catkin | 1.19±0.29 | 1.12 | 1.00 | 1.29 | 12.35 | 1.78 |
| 雄花序比例Male catkin numbers/ Catkin numbers | 0.90±0.13 | 0.91 | 0.92 | 0.40 | 7.37 | 1.49 |
| 两性花序比例Bisexual catkin numbers/ Catkin numbers | 0.10±0.13 | 0.09 | 0.08 | 0.40 | 58.03 | 1.41 |
| 花序数量表型均值Catkin quantitative phenotype mean | 36.30 | 1.63 | ||||
| 总均值Mean | 28.23 | 1.70 |
新窗口打开|下载CSV
综上可知,花序形态表型性状离散程度低但分布频率普遍均匀,尽管变异较小,但多样性程度高,而花序数量表型性状虽然离散程度较高,但分布频率相对集中。因此,这类性状遗传变异范围较大,但多样性程度相对较低。
2.2 板栗花序表型在不同群体间的变异和多样性比较
由表3可知,板栗不同群体间15个花序表型性状的变异系数和多样性指数均存在差异。江苏群体的平均变异系数最大,为35.53;安徽群体的平均变异系数最小,为16.96。山东群体中有4个性状平均变异系数群体间最大,全部为花序形态表型性状;江苏群体有4个性状变异系数群体间最大,全部属于花序数量表型性状。安徽有5个性状变异系数群体间最小,其中5个属于花序形态性状,陕西有4个性状变异系数群体间最小,全部属于花序数量性状。可见,就整体而言,江苏群体的花序表型变异较丰富,而安徽群体的遗传更稳定。山东群体的丰富变异集中在花序形态性状上,而江苏群体的丰富变异更集中在花序数量性状上。安徽群体花序形态性状的遗传更稳定,而陕西群体花序数量性状遗传稳定性相对更高。Table 3
表3
表3不同群体间板栗资源表型性状变异系数和多样性指数
Table 3
| 性状 Trait | 河北 Hebei | 北京 Beijing | 山东 Shandong | 湖北 Hubei | 湖南 Hunan | 江苏 Jiangsu | 浙江 Zhejiang | 安徽 Anhui | 广西 Guangxi | 陕西 Shaanxi | ||||||||||
|---|---|---|---|---|---|---|---|---|---|---|---|---|---|---|---|---|---|---|---|---|
| CV (%) | H' | CV (%) | H' | CV (%) | H' | CV (%) | H' | CV (%) | H' | CV (%) | H' | CV (%) | H' | CV (%) | H' | CV (%) | H' | CV (%) | H' | |
| 花序长度CL | 14.03 | 2.02 | 9.15 | 1.70 | 19.34 | 1.67 | 13.82 | 1.41 | 10.48 | 1.80 | 18.04 | 1.28 | 10.86 | 1.04 | 9.11 | 0.64 | 20.55 | 1.67 | 24.90 | 1.39 |
| 花序粗度CW | 22.80 | 2.05 | 20.54 | 1.68 | 20.85 | 1.74 | 23.84 | 1.47 | 28.71 | 1.41 | 11.31 | 1.75 | 4.64 | 1.04 | 16.41 | 1.10 | 38.40 | 1.21 | 24.83 | 1.39 |
| 花序小花簇密度 DC | 17.86 | 1.80 | 10.64 | 1.68 | 11.82 | 1.97 | 29.19 | 1.29 | 9.74 | 1.89 | 28.89 | 0.96 | 5.38 | 1.04 | 18.18 | 0.64 | 15.38 | 1.73 | 7.56 | 1.39 |
| 花轴粗度FAW | 15.40 | 2.02 | 8.39 | 2.02 | 26.61 | 1.93 | 13.07 | 1.67 | 16.35 | 1.50 | 9.05 | 1.55 | 23.21 | 1.04 | 5.15 | 1.10 | 16.73 | 1.21 | 20.53 | 1.04 |
| 雄蕊长度SL | 19.09 | 2.07 | 15.30 | 1.86 | 34.80 | 1.78 | 17.70 | 1.64 | 15.47 | 1.72 | 11.08 | 1.75 | 30.64 | 1.04 | 7.91 | 1.10 | 14.22 | 1.39 | 20.39 | 1.04 |
| 花序长粗比 CL/CW | 19.45 | 1.96 | 14.54 | 1.82 | 48.34 | 1.41 | 17.45 | 1.64 | 19.37 | 1.85 | 23.55 | 1.75 | 20.21 | 1.04 | 5.06 | 1.10 | 25.89 | 1.56 | 9.67 | 1.39 |
| 花轴长粗比 FAL/FAW | 25.87 | 1.96 | 24.29 | 1.86 | 29.90 | 2.01 | 18.79 | 1.64 | 26.92 | 1.89 | 24.39 | 1.55 | 14.07 | 1.39 | 17.43 | 1.10 | 31.35 | 1.49 | 21.07 | 1.39 |
| 序轴粗度比 FAW/CW | 21.72 | 2.00 | 22.57 | 1.94 | 26.23 | 1.79 | 23.66 | 1.42 | 17.13 | 1.77 | 11.67 | 1.75 | 19.25 | 1.39 | 14.24 | 1.10 | 23.53 | 1.21 | 14.31 | 1.39 |
| 雄花序个数/果枝 MCN/BS | 27.65 | 2.05 | 35.36 | 1.42 | 39.13 | 1.89 | 29.70 | 1.77 | 27.45 | 1.55 | 29.11 | 1.55 | 49.58 | 1.04 | 17.06 | 1.10 | 32.58 | 1.56 | 16.69 | 1.39 |
| 两性花序个数/果枝 BCN/BS | 50.87 | 1.99 | 69.10 | 1.27 | 65.43 | 1.75 | 61.65 | 1.39 | 42.41 | 1.47 | 98.74 | 1.28 | 35.81 | 1.39 | 36.08 | 1.10 | 48.18 | 1.49 | 31.58 | 1.04 |
| 雌花个数/果枝 FFN/BS | 50.37 | 1.42 | 80.96 | 0.25 | 67.00 | 0.42 | 58.90 | 0.19 | 42.73 | 0.20 | 97.06 | 0.16 | 45.57 | 0.10 | 44.08 | 0.05 | 45.76 | 0.15 | 29.61 | 0.08 |
| 总花序个数/果枝 CN/BS | 26.41 | 2.06 | 36.30 | 1.82 | 29.24 | 1.89 | 29.03 | 1.55 | 26.90 | 1.59 | 27.25 | 1.28 | 44.49 | 1.04 | 17.26 | 1.10 | 29.47 | 1.73 | 15.84 | 1.39 |
| 雌花个数/两性 花序 FFN/BC | 12.64 | 1.77 | 12.91 | 1.63 | 8.47 | 2.01 | 17.07 | 1.41 | 8.53 | 1.54 | 6.18 | 1.00 | 10.50 | 0.56 | 10.64 | 1.10 | 16.83 | 1.21 | 7.36 | 1.04 |
| 雄花序比例 MCN/CN | 6.52 | 1.97 | 10.96 | 1.35 | 8.84 | 1.84 | 5.76 | 1.85 | 4.21 | 1.85 | 11.67 | 1.28 | 5.37 | 1.04 | 0.75 | 1.10 | 0.37 | 1.39 | 1.97 | 1.04 |
| 两性花序比例 BCN/CN | 52.75 | 1.94 | 68.36 | 1.35 | 60.00 | 1.89 | 47.99 | 1.77 | 39.07 | 1.97 | 122.47 | 1.28 | 59.91 | 1.04 | 17.42 | 1.10 | 55.41 | 1.39 | 21.55 | 1.04 |
| 均值Mean | 25.91 | 1.86 | 29.08 | 1.51 | 32.97 | 1.66 | 26.46 | 1.40 | 20.97 | 1.50 | 35.53 | 1.30 | 23.72 | 0.95 | 16.96 | 0.95 | 28.14 | 1.32 | 19.15 | 1.13 |
新窗口打开|下载CSV
对不同群体板栗资源表型性状H′值进行分析可知,河北群体的平均H′最高为1.86,并且有11个性状H′都是在群体间最高。浙江和安徽群体的平均H′最低为0.95,其中浙江群体有花序粗度、花轴粗度、雄蕊长度、花序长粗比、每两性花序上雌花个数、每果枝总花序个数、每果枝雄花序个数、雄花序比例和两性花序比例9个性状H′最低,安徽群体有花序长度、花序小花簇密度、花轴长粗比、序轴粗度比、每果枝雌花个数5个性状H′最低。由此可知,河北板栗群体的性状频率分布较均匀,浙江和安徽群体的性状频率分布较集中。
2.3 板栗不同群体间的花序表型变异特征
由表4、5可知,15个板栗花序表型性状中,除雄蕊长度和序轴粗度比两个性状无明显差异外,其余13个性状在群体间的差异均达到显著水平,这种相同性状在不同群体差异明显的特点,说明长期的环境异质对群体表型差异有显著影响。北京、广西、河北、山东4个群体资源果枝雌花比较高,广西、山东、湖南、浙江、陕西群体雄花序花簇较稀疏。进一步从群体所处地理位置上看,板栗种质自北向南呈现出雄花序由细长渐变为粗短,雄花序比例逐渐升高,两性花序比例和每果枝雌花数逐渐减少的表型变化特征。Table 4
表4
表4不同群体间板栗花序形态比较
Table 4
| 群体 Population | 花序长度 CL (cm) | 花序粗度 CW (mm) | 花序小花簇密度 DC (No./cm) | 花轴粗度 FAW (mm) | 雄蕊长度 SL (mm) | 花序长粗比 CL/CW | 花轴长粗比 FAL/FAW | 序轴粗度比FAW/CW |
|---|---|---|---|---|---|---|---|---|
| 河北Hebei | 18.38±2.58bB | 11.39±1.75abA | 16.51±2.95aAB | 3.27±0.75abcAB | 4.07±0.78aA | 16.71±3.25abA | 60.58±15.67abA | 0.29±0.06aA |
| 北京Beijing | 18.38±1.68bB | 11.57±0.97abA | 17.21±1.83aAB | 3.62±0.74bcAB | 3.96±0.61aA | 16.17±2.35abA | 54.43±13.22abA | 0.38±0.07aA |
| 山东Shandong | 17.64±3.41bB | 10.77±2.87abA | 16.12±1.91aA | 3.06±0.64abcAB | 3.86±1.34aA | 18.57±8.98abA | 62.06±18.54abA | 0.30±0.08aA |
| 湖北Hubei | 18.48±2.55bB | 11.37±1.49abA | 17.81±5.20abAB | 3.48±0.83abcAB | 3.95±0.70aA | 16.59±2.90abA | 56.73±10.66abA | 0.31±0.07aA |
| 湖南Hunan | 17.22±1.80bAB | 11.35±1.86abA | 15.43±1.50aA | 3.06±0.88abcAB | 4.15±0.64aA | 15.82±3.06abA | 63.28±17.04abA | 0.27±0.05aA |
| 江苏Jiangsu | 16.16±2.91bAB | 10.52±0.95abA | 17.79±5.14abAB | 2.94±0.33abcAB | 3.80±0.42aA | 15.74±3.71abA | 56.93±13.89abA | 0.28±0.03aA |
| 浙江Zhejiang | 17.06±1.85bAB | 11.56±2.68abA | 16.06±0.86aA | 3.15±0.15abcAB | 4.21±1.29aA | 15.42±3.12abA | 57.00±8.02abA | 0.28±0.05aA |
| 安徽Anhui | 17.17±1.56bAB | 12.21±0.63bA | 20.83±3.79bB | 3.58±0.63cB | 4.18±0.33aA | 14.24±0.72abA | 46.62±8.13aA | 0.32±0.05aA |
| 广西Guangxi | 13.34±2.74aA | 10.26±1.72abA | 14.90±2.29aA | 2.88±1.11abAB | 3.68±0.52aA | 13.65±3.53aA | 56.54±17.73abA | 0.28±0.07aA |
| 陕西Shaanxi | 18.04±4.49bB | 9.27±1.90aA | 16.33±1.23aA | 2.64±0.66aA | 3.32±0.68aA | 19.61±1.90bA | 70.38±14.83bA | 0.29±0.04aA |
新窗口打开|下载CSV
The capital and lowercase letters indicate significant differences at the 0.01 and 0.05 level probability. The same as below
Table 5
表5
表5不同群体间板栗花序数量比较
Table 5
| 群体 Population | 雄花序个数/果枝MCN/BS | 两性花序个数/果枝BCN/BS | 雌花个数/果枝FFN/BS | 总花序个数/果枝CN/BS | 雌花个数/两性花序FFN/BC | 雄花序比例 MCN/CN | 两性花序比例BCN/CN |
|---|---|---|---|---|---|---|---|
| 河北Hebei | 7.14±1.95abA | 0.97±0.50abAB | 1.12±0.57abcAB | 8.11±2.10abA | 1.16±0.15abA | 0.89±0.06abAB | 0.11±0.06abAB |
| 北京Beijing | 7.75±2.74abA | 1.29±0.89bB | 1.62±1.31cB | 9.04±3.28abA | 1.21±0.16bA | 0.86±0.09aAB | 0.14±0.09bAB |
| 山东Shandong | 7.02±2.01abA | 0.99±0.64abAB | 1.10±0.73abcAB | 8.01±2.29abA | 1.11±0.10abA | 0.88±0.07abAB | 0.12±0.07abAB |
| 湖北Hubei | 6.37±1.86aA | 0.74±0.45abAB | 0.81±0.48abAB | 7.08±2.05aA | 1.13±0.19abA | 0.90±0.06abAB | 0.11±0.05abAB |
| 湖南Hunan | 6.50±1.78aA | 0.71±0.30abAB | 0.81±0.35abAB | 7.22±1.94abA | 1.15±0.10abA | 0.90±0.04abAB | 0.10±0.04abAB |
| 江苏Jiangsu | 8.89±2.59abA | 0.63±0.63abAB | 0.66±0.64abAB | 9.53±2.59abA | 1.04±0.06aA | 0.91±0.11abAB | 0.09±0.11abAB |
| 浙江Zhejiang | 8.33±4.13abA | 0.63±0.23abAB | 0.67±0.31abAB | 8.95±4.00abA | 1.06±0.11aA | 0.92±0.05abAB | 0.08±0.05abAB |
| 安徽Anhui | 9.53±1.62bA | 0.35±0.13aA | 0.41±0.18aA | 9.89±1.70bA | 1.13±0.12abA | 0.96±0.01bB | 0.04±0.01aA |
| 广西Guangxi | 7.31±2.38abA | 1.23±0.60bB | 1.37±0.63bcAB | 8.55±2.52abA | 1.11±0.19abA | 0.84±0.09aA | 0.16±0.09bB |
| 陕西Shaanxi | 7.98±1.33abA | 0.71±0.23abAB | 0.83±0.25abAB | 8.68±1.38abA | 1.18±0.09abA | 0.92±0.02abAB | 0.08±0.02abAB |
新窗口打开|下载CSV
2.4 板栗花序表型性状相关性分析
由表6可知,8个花序形态表型性状多呈显著或极显著相关性,7个花序数量表型性状亦呈现相同特征,但大多数花序形态和数量表型性状间相关性不显著。序轴粗度比与每果枝总花序个数和雄花序个数呈极显著正相关,与每果枝两性花序个数显著正相关;每两性花序上雌花个数与每果枝雌花个数极显著正相关,与每果枝总花序个数、每果枝雄花序个数显著负相关。每果枝雌花个数与每果枝总花序个数、每果枝雄花序个数、每果枝两性花序个数和两性花序比例成极显著正相关,与雄花序比例极显著负相关。综上可知,板栗花序花轴越粗,果枝上的总花序、雄花序和两性花序越多;两性花序上的雌花越多,则果枝上的总雌花数越多;果枝上的总雌花数越大,花序、雄花序、混合花序的数量都随之增大,但混合花序比例升高,雄花序比例降低。2.5 板栗花序表型性状主成分分析
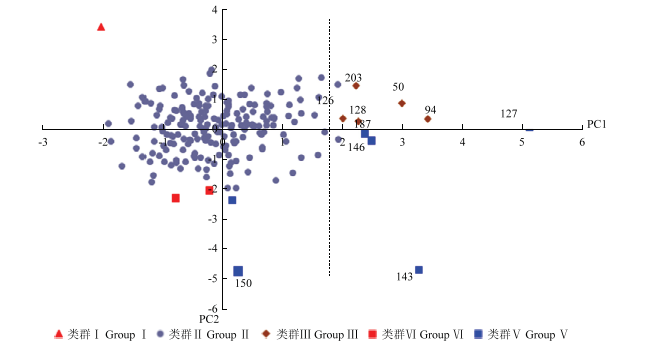
以特征值大于1.0为标准提取主成分。由表7可知,花序表型性状中前5个主成分的特征值均大于1,说明这5个主成分在板栗花序表型变异性构成中作用较大,累计反映了总信息量的84.18%,其中第1主成分贡献率占23.52%,对它作用最大的性状包括每果枝两性花序个数(0.931)、每果枝雌花个数(0.828)、雄花序比例(-0.821)和两性花序比例(0.820),由此可知第1主成分主要是和花序数量有关的性状并与雌花数量呈正相关;第2主成分占21.10%,对它作用最大的性状为花序粗度(0.912)、花序长粗比(-0.889)、雄蕊长度(0.806),说明第2主成分主要是和花序形态有关的性状;第3、4和5主成分贡献率分别占17.537%、11.963%和10.065%。每果枝两性花序个数(0.931)、花序粗度(0.912)、花序长粗比(-0.889)、花序长度(0.864)、每果枝雌花个数(0.828)、雄花序比例(-0.821)、两性花序比例(0.820)、雄蕊长度(0.806)这8个性状的相关系数都在0.8以上,认为其是造成板栗花序表型变异的主要因素,与上述变异系数分析结果基本吻合。以第1主成分为横坐标,第2主成分为纵坐标做成散点图(图1),将211份板栗资源划分为5大类群。类群Ⅰ只有1份资源,来源于山东,花序短粗,雌花量较少;类群Ⅱ包括了大部分板栗种质,性状表现比较集中;类群Ⅲ有5份资源,来源于河北、北京和广西,果枝上雌花丰富;类群Ⅵ有2份资源,全部来自河北,花序长粗比例大;类群Ⅴ有6份资源,来源于山东、北京、河北和江苏,果枝上雌花多、花序细小。对板栗高产育种来说,选育两性花序比例高、每果枝雌花个数多的资源具有重要意义,以横坐标高于2.0为标准选出高雌花量种质9份。2.6 板栗花序表型性状聚类分析
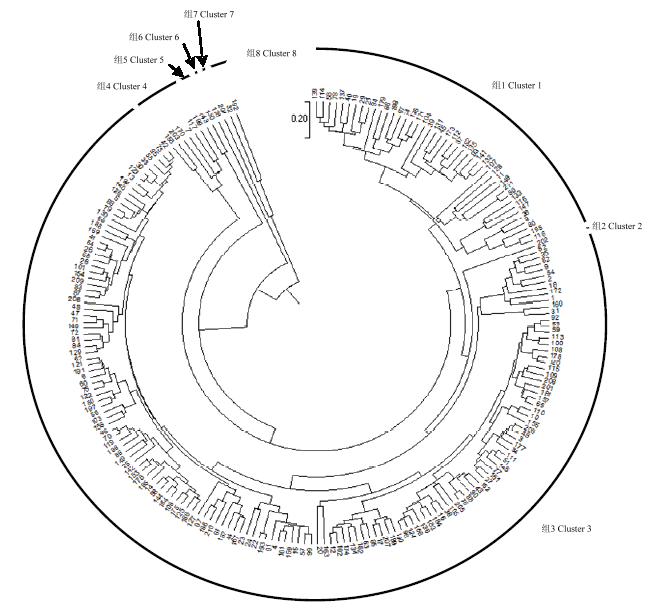
由图2可知,通过聚类分析,在遗传距离为0.38处将211份板栗资源聚为8大类群。第1类群有43份资源,占20.38%,主要来源于华北地区的群体,特征以花序粗且长,花轴粗,小花簇稀疏,雄蕊长度中等,总花序量中等,两性花序占比较低,雌花数量少为主;第2类群包含1份资源,来源为广西地区,特征为花序细短,花轴细弱,花簇密度比较稀疏,雄蕊较短,总花序量中等,两性花序占比中庸,雌花数量中等;第3类群包含155份资源,占73.46%,来源涵盖了10个群体,特征以花序粗且长,轴粗中等,花簇密度比较稀疏,总花序量较少,两性花序占比较少,雌花数量少的资源为主;第4类群包含6份资源,来源为华北、安徽、广西地区,特征以花序长度、粗度中等,花簇较密集,总花序量较少,两性花序占比较少,雌花数量少的资源为主;第5类群包含2份资源,来源于山东,特征为花序细长,花簇稀疏,雄蕊较短,总花序量大,两性花序占比高,雌花数高;第6大类群包含1份资源,来自山东,特征为花序短粗,花轴纤细,花簇密度比较稀疏,雄蕊较长,总花序量少,两性花序占比低,雌花数少;第7大类群包含1份资源,来源于广西地区,特征为花序较粗,长度中等,花簇密度中等,总花序量大,两性花序占比高,雌花数多;第8类群包含2份资源,来源于河北和江苏,特征为花序长度、粗度中等,花簇密集,总花序量多,两性花序占比中等,雌花量多。Table 6
表6
表6板栗花相关表型性状相关性分析
Table 6
| 性状 Trait | 花序 长度 CL | 花序 粗度CW | 花序小花簇 密度DC | 花轴 粗度FAW | 雄蕊 长度 SL | 花序长粗比 CL/CW | 花轴长 粗比 FAL/ FAW | 序轴粗 度比FAW/ CW | 雄花序个数/ 果枝 MCN/ BS | 两性花序个数/果枝BCN/ BS | 雌花个数/果枝FFN/BS | 总花序个数/ 果枝CN/BS | 雌花个数/两性花序FFN/BC | 雄花序 比例MCN/ CN | 两性花 序比例BCN/ CN |
|---|---|---|---|---|---|---|---|---|---|---|---|---|---|---|---|
| 花序长度CL | 1 | ||||||||||||||
| 花序粗度CW | 0.133 | 1 | |||||||||||||
| 花序小花簇 密度DC | -0.174* | 0.088 | 1 | ||||||||||||
| 花轴粗度 FAW | 0.241** | 0.472** | 0.063 | 1 | |||||||||||
| 雄蕊长度SL | 0.051 | 0.920** | 0.068 | 0.092 | 1 | ||||||||||
| 花序长粗比 CL/CW | 0.496** | -0.698** | -0.202** | -0.248** | -0.674** | 1 | |||||||||
| 花轴长粗比 FAL/FAW | 0.352** | -0.442** | -0.182** | -0.776** | -0.154* | 0.592** | 1 | ||||||||
| 序轴粗度比FAW/CW | 0.135* | -0.316** | -0.009 | 0.657** | -0.644** | 0.376** | -0.469** | 1 | |||||||
| 雄花序个数/果枝MCN/BS | 0.0.14 | -0.046 | 0.136* | 0.137* | -0.116 | 0.048 | -0.113 | 0.187** | 1 | ||||||
| 两性花序个数/果枝BCN/BS | 0.126 | 0.025 | -0.046 | 0.164* | 0.043 | 0.082 | -0.090 | 0.173* | 0.208** | 1 | |||||
| 雌花个数/果枝FFN/BS | 0.072 | -0.016 | -0.051 | 0.094 | -0.059 | 0.087 | -0.068 | 0.127 | 0.196** | 0.789** | 1 | ||||
| 总花序个数/果枝CN/BS | 0.043 | -0.037 | 0.115 | 0.166* | -0.117 | 0.064 | -0.125 | 0.214** | 0.972** | 0.432** | 0.370** | 1 | |||
| 雌花个数/两性花序FFN/BC | 0.138* | 0.044 | -0.157* | -0.037 | 0.067 | 0.057 | 0.116 | -0.018 | -0.143* | -0.007 | 0.188** | -0.135* | 1 | ||
| 雄花序比例MCN/CN | -0.074 | -0.036 | 0.108 | -0.064 | -0.017 | -0.034 | 0.039 | -0.050 | 0.241** | -0.788** | -0.620** | 0.032 | -0.005 | 1 | |
| 两性花序比例BCN/CN | 0.076 | 0.043 | -0.118 | 0.069 | 0.023 | 0.030 | -0.045 | 0.051 | -0.250** | 0.787** | 0.624** | -0.041 | 0.020 | -0.996** | 1 |
新窗口打开|下载CSV
3 讨论
花序是板栗的重要器官,其形态大小,两性花序的比例等对产量影响巨大[1,2,3]。对板栗种质资源的花序性状进行多样性分析,是开展育种的基础工作,同时也是一种简便有效的筛选特异种质的方法。板栗花序相关性状是一类重要的表型性状,受遗传和环境效应的影响,这类性状表现出复杂的数量性状特点。由于在个体或微观水平上对表型性状进行研究,较难取得突出进展[24],因此,本研究从全国10个省份(群体)选取211份资源开展花序性状研究,这10个省份涵盖了中国板栗全部5个地方品种群即华北品种群、长江中下游品种群、西北品种群、东南品种群、西南品种群[1],累计栽培面积约占中国板栗栽培面积的85%[25],区域内资源丰富,就种质分布而言有较强的代表性,选取这10个省份(群体)资源开展研究,有利于从宏观水平上开展整体趋势分析和探讨,以便更准确探明性状的遗传变异规律。但10个群体中陕西、安徽、浙江等群体在此次研究中选取资源较少,因此板栗花相关的遗传多样性信息有待进一步完善。变异系数和多样性指数是植物多样性分析最常用的两个指标,变异系数越高,表明性状的离散程度越大、变异幅度越大;而多样性指数越高,表明性状多样性程度越丰富、种类越多[26]。在本研究中,我国板栗资源花序相关性状表现出丰富的变异和表型多样性,其中花序形态表型性状离散程度低但分布频率均匀,整体变异相对较小但多样性程度高,花序数量表型离散程度较高但分布频率相对集中,所以变异范围更大,但多样性程度相对较低,这种现象说明,在板栗的进化过程中,相较于花序的形态,花序数量的变化更大,但分布更集中,这与人们长久以来的育种目的趋于一致,证明板栗资源整体的遗传变异一直在受人为选择的影响。图1
 新窗口打开|下载原图ZIP|生成PPT
图1211份板栗资源花表型性状的主成分分析图
Fig. 1The principal component analysis of 211 Chinese chestnut germplasms
图2
 新窗口打开|下载原图ZIP|生成PPT
图2板栗资源聚类图
Fig. 2Cluster dendrogram of Chinese chestnut
Table 7
表7
表7板栗花相关表型性状的主成分矩阵、特征向量和贡献率
Table 7
| 性状编号 Character code | 主成分 Principal component | ||||
|---|---|---|---|---|---|
| 1主成分 First principal component | 2主成分 Second principal component | 3主成分 Third principal component | 4主成分 Fourth principal component | 5主成分 Fifth principal component | |
| 花序长度CL | 0.194 | -0.203 | -0.073 | -0.073 | 0.864 |
| 花序粗度CW | -0.068 | 0.912 | -0.089 | 0.063 | 0.361 |
| 花序小花簇密度DC | -0.098 | 0.217 | 0.263 | 0.154 | -0.336 |
| 花轴粗度FAW | 0.305 | 0.502 | 0.528 | -0.512 | 0.309 |
| 雄蕊长度SL | -0.208 | 0.806 | -0.338 | 0.295 | 0.276 |
| 花序长粗比CL/CW f | 0.203 | -0.889 | 0.015 | -0.094 | 0.274 |
| 花轴长粗比FAL/FAW | -0.173 | -0.676 | -0.504 | 0.404 | 0.214 |
| 序轴粗度比FAW/CW | 0.401 | -0.232 | 0.639 | -0.602 | 0.034 |
| 雄花序个数/果枝MCN/BS | 0.203 | -0.045 | 0.729 | 0.619 | 0.111 |
| 两性花序个数/果枝BCN/BS | 0.931 | 0.086 | -0.097 | 0.196 | -0.043 |
| 雌花个数/果枝FFN/BS | 0.828 | 0.043 | -0.101 | 0.225 | -0.011 |
| 总花序个数/果枝CN/BS | 0.411 | -0.021 | 0.649 | 0.618 | 0.091 |
| 雌花个数/两性花FFN/BC | 0.023 | -0.036 | -0.263 | -0.046 | 0.390 |
| 雄花序比例MCN/CN | -0.821 | -0.117 | 0.472 | 0.097 | 0.165 |
| 两性花序比例BCN/CN | 0.828 | 0.043 | -0.101 | 0.225 | -0.011 |
| 特征值Eigenvalue | 3.527 | 3.165 | 2.631 | 1.794 | 1.510 |
| 贡献率 Contributive percentage (%) | 23.516 | 21.098 | 17.537 | 11.963 | 10.065 |
| 累计贡献率 Cumulative contributive percentage (%) | 23.516 | 44.613 | 62.150 | 74.113 | 84.178 |
新窗口打开|下载CSV
板栗雄花多、雌花少的特性导致营养分配、物质疏导等方面的不均衡,雄花耗养量大,是限制板栗产量提高的重要因素,生产上常需要采取多种方法解决,如配方施肥、施用微量元素和生长调节剂、人工疏雄等措施,虽可增加雌雄花的比率和坐果率,但也增加了生产成本,所以选育雌花多、雄花序短小、花簇稀疏或雌雄比例大的丰产优质品种,是解决板栗低产的最有效途径之一。由本研究群体看,板栗种质资源自北向南呈现出雄花序由细长渐变为粗短、雄花序比例逐渐升高、两性花序比例和每果枝雌花数逐渐减少的表型变化特征,不同地理来源的板栗资源同一花序表型差异明显,这一结果与江锡兵等[12]的研究相似,说明长期环境异质可导致群体表型的明显差异,推断复杂多变的地理特征和气象条件,悠久的栽培历史,长期的自然和人工选择,是板栗形成具有特定适应性的地方群体资源的共同作用因子。本研究中,地理来源不同的各群体在性状表型值、变异系数及多样性程度上都有显著的差异,相同群体内的不同性状,差异程度也不尽相同,说明基因型差异和环境异质导致了不同群体间表型变异的不同,体现了群体间种质在育种上的不等值性。此现象与笔者之前对板栗枝条多样性的研究结果一致[13]。地理隔离是增加多样性的一个重要因素[27],结合本研究结果,在育种工作中可以根据不同群体间的特点进行亲本选配,打破地理隔离,更易选育出杂合性更高、适应性更强、超亲更明显的品种。比如选取北方的河北群体和南方的广西群体内资源进行杂交,其后代雄花序相关性状变异幅度和多样性水平可能更大,更容易聚合出雄花序短粗、每果枝雌花数等综合品质更优秀的高产品种。
性状相关性分析可以看出,多数花序形态性状和数量性状间相关性不显著,但花轴粗度与两种花序个数显著正相关,花轴越粗,雄花序数和两性花序数都随之变大,由此推测,花轴粗度可以作为判断板栗花量多少的一个佐证。本研究还发现总雌花数量与雄花序数正相关,但与雄花序占比为负相关,因此在育种过程中,不能因为雄花序养分消耗较大[15],一味选择雄花序数量少的资源,而更应该关注雌雄比例适当的资源。
主成分分析可将多个变量化为少数几个指标,从而简化分析过程,更好地描述总变异构成特征[28,29],因此用主成分分析来筛选资源,这样筛选出来的资源不是某单一性状突出,而是相关性状综合优质,在育种上更有意义。本研究中,第一主成分的特征向量与花序数量性状有关,第二主成分的特征向量与花序形态有关。由第一、二主成分为坐标做出的散点图中,类群Ⅰ中变异大的‘徐家1号’在聚类分析中被单独聚出,类群Ⅴ中离其他资源较远的‘143野杂’和‘泰安薄壳’在聚类分析中也被单独聚为一类,类群Ⅴ中的‘BJHH1’在聚类分析中虽未被单独聚类,但从图中也可看出‘BJHH1’与其他资源有较远的遗传距离。可见,本研究中主成分分析所分类群与聚类分析结果相似,证明主成分分析中贡献率较高的性状确实能反映资源变异的主要特点。这一结果与李鸿雁等[30]的研究结果一致。依据主成分分析结果,鉴定筛选出9份两性花数量大、雌雄比例高的高雌花量资源(84-2、长南庄2号、BJHJ1、BJHH1、北京8号、沂蒙短枝、焦杂、广西14-4),这9份特异资源可以在今后的育种工作中作为花性别调控、提高产量的亲本材料。
描述和分析植物表型性状在种质资源研究的过程中是最基本的方法和不可替代的途径。根据目前的研究结果,在作物种质研究中,已有许多通过利用综合评价种质资源来构建核心种质资源库的成功案例,并成功地提高了育种效率[31,32,33,34,35,36,37],表型性状已成为生物学研究的重要命题,基因组和转录组等生物信息学数据只有和植物表型性状互相结合,共同分析才能解析遗传的特点和机理[38,39]。由此可知,充分挖掘表型数据并整理分析,将有助于推动育种学跨越式的发展。
4 结论
中国板栗资源花相关表型性状变异丰富,多样性程度高,地域间遗传变异和多样性程度不同,群体间性状差异显著。花序形态表型性状和花序数量表型性状内部的相关性较明显,但花序形态和花序数量间相关性不明显。综合相关性分析和主成分分析,筛选出每果枝两性花序个数、花序粗、花序长粗比、花序长、每果枝雌花数、雄花序数/花序数、两性花序数/花序数、雄蕊长8个性状可作为板栗花形和花量的综合评定指标;84-2、长南庄2号、BJHJ1、BJHH1、北京8号、沂蒙短枝、焦杂、广西14-4共9个高雌花量的板栗资源可作为性别调控、改善产量的亲本材料。聚类分析将211份资源分为8个类群。本研究为进一步丰富中国板栗表型性状遗传多样性信息,挖掘优异基因材料和现有种质资源保护、利用、创新及遗传改良奠定了基础。参考文献 原文顺序
文献年度倒序
文中引用次数倒序
被引期刊影响因子
[本文引用: 4]
[本文引用: 4]
[本文引用: 2]
[本文引用: 2]
DOI:10.1038/nrg2207URLPMID:17943192 [本文引用: 3]

Although many studies provide examples of evolutionary processes such as adaptive evolution, balancing selection, deleterious variation and genetic drift, the relative importance of these selective and stochastic processes for phenotypic variation within and among populations is unclear. Theoretical and empirical studies from humans as well as natural animal and plant populations have made progress in examining the role of these evolutionary forces within species. Tentative generalizations about evolutionary processes across species are beginning to emerge, as well as contrasting patterns that characterize different groups of organisms. Furthermore, recent technical advances now allow the combination of ecological measurements of selection in natural environments with population genetic analysis of cloned QTLs, promising advances in identifying the evolutionary processes that influence natural genetic variation.
DOI:10.1111/mec.2009.18.issue-3URL [本文引用: 1]
DOI:10.1007/s00442-010-1672-7URL [本文引用: 1]
Phenotypic variation of traits can reflect the ability of plants to adjust to particular environments, but how much of this variation is heritable is not frequently analyzed in natural populations. In the present paper, we investigated the patterns of phenotypic expression in light-related leaf traits of Olea europaea subsp. guanchica, a woody sclerophyllous species endemic to the Canary Islands. We explored phenotypic differentiation and heritable variation across several island populations differing in light environment. A suite of morpho-functional (leaf size, SLA and leaf angle) and physiological (pigment pools: Chl a/b ratio, xantophyll cycle and β-carotene) traits was measured in six populations on three islands. In addition, we estimated heritabilities for these traits following Ritland’s method. Variation in morpho-functional, but not in physiological, traits was observed across the islands and was significantly related to the amount of diffuse light experienced by each population. In addition, significant heritabilities were found for morpho-functional traits, whereas expression of similar phenotypes among populations was accompanied by a lack of heritable variation in physiological traits. Most recently established populations did not exhibit lower heritabilities in quantitative traits than older populations, and apparently displayed congruent phenotypes under the local conditions. Our results strongly support the idea that different types of traits show contrasted levels of genetic and phenotypic variation in populations experiencing marked environmental differences.
URL [本文引用: 1]
The diversity of leaf, petiole and nut in 3 wild intraspecific populations (the Qinling Mountains ecotype, the Taiyi Mountains ecotype, and the Yanshan Mountains ecotype) of Castanea mollissima Blume were investigated to provide the scientific basis for resource protection and utilization. The results indicated: ①There were significant difference among and within population. The morphological traits, such as leaf length, width, leaf shape index, length of petiole and nut shape, size, color, have great morphological diversity with variation coefficient (CV) of more than 10%. The range of nut weight varied from 1.69g to 3.89g in Qinling population with CV 18.3%. The range and CV of leaf area and nut weight were the largest, and those of leaf shape index were the smallest; ②The content, of main nutrition composition (water, total sugar, starch, protein, fat, ash and Vc) in ripe nuts determined in obtained 118 seedlings at the Qinling Mountains, Taiyi Mountains and Yanshan Mountains was analyzed and presented considerable genetic variations with CV of 6.2%-28.3%, and the range and CV of the protein were the largest. There were the same trends in the 3 wild intraspecific populations; ③There was significant difference between site conditions, with smallest CV in leaf area and nut weight and highest CV of Vc content; ④Correlation analysis revealed that mean weight of a single nut with annual rainfall and the longitude of each ecotype, in contrast, they were negatively correlated with the altitude. Vitamin C contents in the nuts from different ecotype were negatively regulated with annul rainfall. These relationships indicated that environmental conditions had impact on genetic diversity in Chinese wild chestnut.
[本文引用: 1]
[本文引用: 1]
[D].
[本文引用: 1]
[D].
[本文引用: 1]
DOI:10.7668/hbnxb.2007.05.026URL [本文引用: 1]
The overall levels of phenotypic characteristics of seed and leaf within and among 5 geographic populations were estimated. The results showed that the percentage of variance portion among population was 10.97% while that within population was 41.57%. The range of variation of differentiation coefficient of morphological traits among population was between 11.85% to 28.34%. The mean phenotypic differentiation coefficient (VST) showed that the variation within population (24.26%) was extremely higher than that among populations (75.74%) which revealed that variation within population were more important. Frequency distribution of 7 phenotypic characteristics in Castanea mollissima primarily displayed a normal distribution. Both multiplicity analysis and Shannon information index is suitable for evaluation of phenotypic diversity in Castanea mollissima.
DOI:10.7668/hbnxb.2011.05.024URL [本文引用: 1]
Morphological traits and main nutritional components,such as yield,average nut weight,content of total sugar,starch,protein,were examined.Genetic variation of nut morphological traits was studied.The results showed that,there were significant differences among crossed chestnut progenies.Some botanical characteristics,including nut height,nut width and starch content,water content,protein content,were relatively stable with variation coefficient(CV)of lower than 10%,nut thickness and fat content were also stable with CV of lower than 15% in all crossed chestnut progenies.The other botanical characteristics,such as yield,average nut weight and total sugar content,fiber content,had great genetic variation with CV of more than 15%.The range of yield varied from 84.40-2006.40 g with CV 82.95%,average nut weight varied form 2.99-13.30 g with CV 23.79% in all progenies.The content of total sugar in overall level had very great diversity with CV 52.04%.The study also discovered that,variation degree of yield was similar and average nut weight was different in crossed chestnut progenies with same female parent,and opposite result appeared in crossed progenies with same male parent.The differences maybe correlated with biological characteristics of female parent and xenia effect.Finally,3 individuals with high yield,high total sugar content and big nut with conical burs,respectively,were screened according to the results.
[本文引用: 1]
[本文引用: 1]
URL [本文引用: 2]
Phenotypic diversity of 12 important agronomic characters include leaf and nut phenotype and quality for 90 Chinese chestnut cultivars from 10 provinces were analyzed using nested design variance analysis and cluster analysis methods. The results showed:(1) There were significant differences for 12 agronomic traits of chestnut among and within populations,indicated that there existed a wide range of variation in the two levels;(2) The average variation coefficient of leaf and nut phenotype and quality traits were 7.7%,4.4% and 6.8%,respectively,showed that genetic stability of nut phenotype traits was higher than the other two traits;(3) The average of phenotypic differentiation coefficient among populations were 23.42%,which were less than the variation within populations(76.58%),showed that the variation within populations was the main source of variation;(4) Ten populations of chestnut were divided into 4 categories by using the minimum distance cluster analysis,indicated the differences of phenotypic diversity of chestnut existed in different geographical population.
[本文引用: 2]
[本文引用: 2]
[本文引用: 1]
[本文引用: 1]
[本文引用: 2]
[本文引用: 2]
[本文引用: 1]
[本文引用: 1]
[本文引用: 1]
[本文引用: 1]
[本文引用: 1]
[本文引用: 1]
[本文引用: 1]
[本文引用: 1]
[本文引用: 1]
[本文引用: 1]
[本文引用: 1]
[本文引用: 1]
[本文引用: 1]
[本文引用: 1]
URL [本文引用: 1]
【Objective】Understanding diversity profile of crop germplasm is the basis of effective conservation and efficient utilization of genetic resources. The present study investigates the phenotypic diversity of four flowering-related traits, including tasseling (T), pollen-shedding (S) tassel-pollenshedding interval (TPI) and anthesis-silking interval (ASI).【Method】799 maize landrace accessions from the core collection preserved in Chinese National Genebank were planted according to multiple-environment trail (MET), and the phenotypic observation of 4 flowering-related traits, including T, S, TPI and ASI, were recorded during the reproduction stage of these accessions. Shannon-Weaver diversity index was calculated based on the phenotypic estimates of these 4 flowering-related traits, and ANOVA was conducted to test the significance of differentiation among the phenotypic estimates and Shannon-Weaver diversity indices.【Result】The results of ANOVA showed that the differentiation of phenotypic estimates of all the 4 flowering-related traits significant at 1% level among 32 provinces/regions, and except TPI, the differentiation of Shannon-Weaver diversity indices of T, S, and ASI significant at 1% level. Among the 6 maize regions of China, phenotypic estimates of all these 4 flowering-related traits significant at 1% level, and the Shannon-Weaver diversity indices of T, S, and ASI significant at 5% or 1% level. Among the 6 maize regions in China, the Shannon-Weaver diversity indices of T, S, TPI, and ASI of accessions from Southwest Montane Maize Region are 1.85, 1.90, 0.88, and 1.20 separately. 【Conclusion】There exists high level of phenotypic diversity of T, S, TPI, and ASI among the maize landrace accessions conserved in Chinese National Genebank, and among 6 maize regions in China, the average phenotypic diversity level of the four flowering-related traits of the accessions of Southwest Montane Maize Region was significantly higher than those of the other 5 maize regions, which indicates that there exist considerably high protection value and utility potential in the maize germplasm of Southwest Montane Maize Region.
[本文引用: 1]
[本文引用: 1]
[本文引用: 1]
[本文引用: 1]
DOI:10.3864/j.issn.0578-1752.2017.22.012URL [本文引用: 1]
【Objective】 The objective of this study is to evaluate some major phenotypic characteristics diversity of mandarin germplasms and explore the comprehensive method for screening important mandarin germplasm resources. 【Method】 The diversity evaluation of 18 phenotypic traits in 239 mandarin accessions were carried out. Variation coefficients, Shannon-Weaver Information index cluster analysis, principal component analysis, correlation and regression analysis were comprehensively used to evaluate the relationship of characteristics and select important characteristics. 【Result】 Based on the variation coefficient of 239 mandarins, large variations were found in the traits of seed numbers per fruit (SNF), the ratio of soluble solids to titratable acidity (TSS/TA), the contents of titratable acid (TA), fruit weight (FW), while genetic characteristics of fruit shape index(FSI), segment numbers per fruit (SNPF), the contents of total soluble solids (TSS) kept relatively stable. Shannon-Weaver Information index showed that the diversity level of FW, fruit diameter (FD), fruit length (FL), SNPF, petiole length (PL), leaf lamina length (LLL), leaf lamina width (LLW), the contents of reducing sugar (RS) and invert sugar (IS) were high, while fruit surface texture(FST), SNF, TSS/TA had low diversity level. The variance analysis was conducted to evaluate the trait difference of 239 mandarin accessions, which divided into five different geographical origins. The result showed that mandarin accessions from America have higher average contents of TSS and IS; the mandarin accessions from Japan have larger FW, FD and FL and lower SNF. Mandarin accessions from the Yangtze River Basin were larger fruit size, higher contents of the TSS, RS and IS than the Pearl River Basin, but lower TSS/TA. Variance analysis for wild germplasms, landraces and bred varieties showed that bred accessions have larger fruits, smoother peels, fewer seeds, lower contents of TA and higher contents of sugar content. Both the cluster analysis and PCA suggested genetic variations were presented in different geographical origins. Small fruit type accession from China should be thought as an unique subgroup, Green Peel Mi Ju is an unique citrus accession. Principal component analysis showed that the variation cumulative contribution rate of the first nine principal components was accounted for 81.94%. The average F value from the comprehensive evaluation of phenotypic traits of 239 mandarins was 0.480. The highest F value (0.664) was given to Ehime Kashi No.21 from Japan. The lowest F value (0.211) was Shikuwasha. The correlation analysis between the phenotypic traits and F value showed that the phenotypic traits except FST were significantly correlated with the F value. Nine phenotypic traits, including fruit length (FL), FSI, FST, SNPF, PL, LLW, the contents of TSS, TA and RS, were selected out as evaluation indexes by stepwise regression analysis. 【Conclusion】 Mandarin accessions presented large phenotypic diversity. The traits difference of the accessions from different geographical origins or germplasm types are great. Nine phenotypic traits could be used as important evaluation charaterisitics for screening unique mandarin.
[本文引用: 1]
[本文引用: 1]
DOI:10.3864/j.issn.0578-1752.2018.17.010URL [本文引用: 1]
【Objective】The study on the diversity and variation of current-year twig and leaf phenotypic traits of pear germplasm resources was conducted in order to provide valuable basic data and theory foundation for normalization, standardization, preservation and construction of pear core collections, and to promote the efficient utilization of pear germplasm resources.【Method】Data were collected for 23 phenotypic parameters of current-year twig and leaf from 548 accessions of 13 Pyrus species preserved in National Germplasm Repository of Apple and Pear according to the method described in Descriptors and Data Standard for Pear (Pyrus spp.) methods. The distribution frequency, coefficient of variation, Simpson index, Shannon-weaver index, correlation and principal component analysis of pear current-year twig and leaf were analyzed using the SPSS19.0 software, and the intraspecific and interspecific genetic diversities of pear were also analyzed and compared. The frequency distributions of quantitative characters were analyzed by Origin 8.0. The crisp-fleshed and soft-fleshed pears were clustered using MEGA 5.0, respectively, according to morphological data.【Result】Analyzing of 15 character traits of pear leaf phenotype showed that 8 out of 15 traits were abundant, namely, ovate shape, wide wedge-shaped base, sharp-acuate apex, serrate on leaf margin with seta, enclasped status of leaf surface, downward latitude of leaf and redish-green young leaf, which accounted for 90.51%, 58.03%, 66.97%, 81.93%, 87.23%, 59.27%, 86.68% and 35.04%, respectively. Regarding the phenotype of current-year twig, which was ample among yellow brown, rich in lenticels, leaf bud slightly held out, obtuse leaf bud apex, size of bud support medium, pubescence on flower bud absent, which accounted for 87.23%, 78.28%, 87.96%, 83.76%, 73.91% and 99.27%, respectively. The Shannon indexes of the color of young leaf and leaf base shape were found to be as high as 2.197 and 1.597, respectively. The analyses of 8 numeric traits indicated that the average coefficient of variation of leaf length, leaf width, petiole length, current-year twig length, twig thickness, internode length, length of flower bud and thickness of flower bud was 17.25%, 19.04%, 20.06%, 23.70%, 15.08%, 19.33%, 20.62% and 16.66%, respectively. Reference cultivars and 5 groups of each trait were proposed based on the statistical analysis of frequency distribution of numeric traits of current-year twig and leaf. Eight numeric traits, including current-year twig, length of flower bud, leaf width and petiole length, were put forward as comprehensive assessment indexes according to the results of correlation and principal component analyses. There were significant differences in 8 pear numeric traits of current-year twig and leaf among and within populations, while phenotypic differentiation coefficient (VST) of intraspecies and interspecies were 41.10% and 58.90%, respectively. Cluster analysis showed that 233 crisp-fleshed local pear cultivars could be divided into 12 categories and 87 soft-fleshed P. ussuriensis accessions into 6 categories. It was worth mentioning that pear resources which was from southwest China were found in most of the groups.【Conclusion】There were abundant genetic diversity based on the phenotype of current-year twig and leaf of pear. The diversities of character traits of color of young leaf and shape of leaf base were higher than the others. The variation coefficients of numeric traits of current-year twig and length of flower bud were also more obvious than the others. These 4 traits can therefore reflect the differences among pear varieties. The variation in pear germplasm resources based on twig and leaf phenotype traits among populations was higher than within populations, suggesting that the variation among populations was the main variation source. Finally, 5 numeric traits were selected to be as the important comprehensive evaluation indexes used for pear germplasm resources.
[本文引用: 1]
[本文引用: 1]
DOI:10.1023/B:EUPH.0000013330.66819.6fURL [本文引用: 1]
Seventy-two accessions covering six varieties of Cucumis melo were characterized by using 35 morphological characters with emphasis on shelf-life, and the relationships between shelf-life and related characters was investigated. Principal component analysis (PCA) revealed that development period of plant and fruit, size of seed and fruit, shelf-life, stem hair, flesh juiciness, netting, abscission of peduncle, rapid yellowing of epidermis at maturity, Brix value, and color of flesh and epidermis etc. were the principal characters to discriminate melon accessions examined in the present study. According to the scatter diagram, vars. acidulusand makuwa, both of which belong to the Oriental melon, are closely related because of their short growth duration, small seed, thin pericarp and poor shelf-life, while American cantaloupe (var.reticulatus) and European cantaloupe (var. cantalupensis) are rather closely related due to their climacteric fruit with orange flesh, slipped peduncle and rapid yellowing of epidermis at maturity, which is closely related with their shelf-life. PCA also indicated that var. saccharinus was closer to var. inodorus than to the other varieties, due to their requirement of long period for development, large size of seed and fruit, and half- or non-slipped peduncle. Shelf-life of melon fruit was significantly correlated with the following characters: quality of flesh, size of seed and fruit, abscission of peduncle, development periods of plant and fruit, rapid yellowing of epidermis at maturity, Brix value and color of flesh and epidermis. Accessions with good shelf-life were mostly found in vars. saccharinus and inodorus.
[本文引用: 1]
[本文引用: 1]
DOI:10.1016/j.scienta.2009.12.024URL [本文引用: 1]
DOI:10.3724/SP.J.1259.2013.00042URL [本文引用: 1]
对250份国外甜瓜(Cucumis melo)种质资源的19个形态性状多样性进行研究。结果表明, 国外甜瓜种质资源具有丰富的形态多样性, 平均遗传多样性指数为1.378。9个质量性状(果实形状、果皮底色、覆纹颜色、覆纹形状、网纹密度、网纹粗度、果肉颜色、果肉质地和种子颜色)和4个数量性状(单果鲜重、果肉厚度、可溶性固形物含量和种子千粒重)变异明显, 其Shannon’s指数分别大于1.0和1.9。不同生态区间种质资源遗传多样性差异明显, 多样性指数由高到低依次为: 南亚(1.512)、东北欧(1.404)、西欧(1.372)、北美(1.340)和东亚(1.281)。通过聚类分析将所有甜瓜种质划分为四大组群, 即南亚组群、东北欧组群、西欧北美组群和东亚北美组群。以印度为代表的南亚甜瓜种质形态多样性水平较高, 支持了印度次生大陆为甜瓜起源中心的观点。
DOI:10.3724/SP.J.1006.2009.00571URL [本文引用: 1]
China has the most soybean germplasm in the world, but only about 1% of them have been used in soybean breeding program, which results in narrow genetic base for developing varieties. This exiguous use of germplasm is due to lack of reliable information on traits with economic importance, which requires replicated multilocational evaluations to identify useful parents. In order to accelerate evaluation and utilization of germplasm, the projects of ‘Establishment of soybean core collection’ (1998–2003) and ‘Gene diversity of mini core collection in soybean’ (2004–2008) were carried out by the continuous supporting from National Basic Research Program (973 project) in case of large germplasm collections has been evaluated properly on the basis of the guideline from core collections. In this paper, the development of core (2–5% of entire collection) and mini-core (10% of core or 1% of entire collection) is introduced. Meanwhile, the complement of the core or mini-core collections is carried out in order to broaden their representative from national wide into international soybean accessions. For testing the representatives of the core collection, four parameters including SSR loci, sample components, sampling ratio and low frequency allele are analyzed, and then confirmed by the random sampling test. The core and mini-core collections have been used in identifying elite traits and developing new lines, in which the approaches have been introduced that based on core and mini-core collections. The further utilization of core and mini-core collections related to genetic diversity and utilization method of collections is discussed, it is pointed that core collections are basic materials for new trait identification, novel gene mining, germplasm enhancement and new variety development. It has been proved that systematic study and use of soybean germplasm will improve the research of the soybean germplam from conservation into wider use.
URL [本文引用: 1]
【Objective】 The purpose of this research is to analyze the genetic diversity of global faba bean germplasm, to explore their genetic similarity and population structure, and to provide essential information for germplasm evaluation and effective utilization of faba bean genetic resources. 【Method】 The genetic similarity of 383 faba bean accessions from 35 countries was analyzed by using ISSR marker. 【Result】 Eleven ISSR primers generated 229 unambiguous bands, of which 212 were polymorphic, and the rate of polymorphic bands was 0.93. Gene diversity index (H) and allelic richness (NA) of different geographic groups of germplasm ranged from 0.16 to 0.28 and from 104 to 193, respectively. Chinese spring-seeding area group showed the highest genetic diversity (H = 0.28, NA = 193), and America group showed the lowest (H = 0.16, NA = 104). The spring faba bean germplasm was clearly separated from winter faba bean germplasm of China in UPGMA clustering analysis based on ISSR molecular marker data. Germplasm from China is quite distinct to that from exotic accessions. The accessions from Europe had a closer genetic similarity with that from North Africa. While the germplasm resources from Asia, Europe and Africa are closely related to their geographical distribution.【Conclusion】Accessions from spring-seeding area of China were most diverse. Germplasm from America showed lowest diversity. The results indicated that the genetic similarity and diversity of faba bean germplasm are closely associated with their growth habit, their geographical origin and ecological distribution.
Key words: faba bean (Vcia faba L.); germplasm resourses; ISSR marker; genetic diversity; genetic similarity
DOI:10.1007/BF00984373URL [本文引用: 1]
DOI:10.3724/SP.J.1006.2015.00175URL [本文引用: 1]
Plant phenotyping is a key link in understanding gene function and environmental effects, and with development of plant function genomics and crop molecular breeding, the traditional phenotypic observation has become the main bottleneck. High-throughput plant phenome analysis technology and plant phenomics study is an effective way to solve this problem. Although plant phenome analysis is becoming a hot spot at home and abroad, relevant concepts are still relatively fuzzy, and this situation hinders the development of this emerging discipline. In this paper, the relevant concepts and categories of plant phenome and plant phenomics were analyzed, and the new concepts such as quasi-phenome, identifiable traits, mapped traits, and tolerance of plant phenotype to the changes of inheritance and environment, were introduced. And, plant phenome was defined as “all of physical, physiological and biochemical characteristics and traits which are decided or influenced by genome and environments, and can reflect the plant structures and compositions, or reflect the processes and results of plant growth and development”, and plant phenomics as “the comprehensive controls, complete collections and systematic analyses of plant phenome informations and related environmental parameters”. The scopes, directions, and top design principles of plant phenomics research, were also discussed.
DOI:10.11913/PSJ.2095-0837.2016.60962URL [本文引用: 1]
传统的表型组学研究已严重滞后于高速发展的基因组、转录组及蛋白质组学,这也制约了作物育种学、功能基因组学等领域研究的深入开展。为突破这一瓶颈,国内外科研工作者经不懈的努力开发出了各类具有自动化、高精度、高通量特点的表型组学分析平台,并将该平台与各类“组学”研究相结合,这将是作物育种学领域的一次新的技术革命。本文对植物表型组学的概念和研究意义进行了介绍和分析,并对高通量表型组学分析平台进行了详细介绍,同时对未来表型组学的发展和各类组学及生物大数据的综合利用进行了展望。
DOI:10.11913/PSJ.2095-0837.2016.60962URL [本文引用: 1]
传统的表型组学研究已严重滞后于高速发展的基因组、转录组及蛋白质组学,这也制约了作物育种学、功能基因组学等领域研究的深入开展。为突破这一瓶颈,国内外科研工作者经不懈的努力开发出了各类具有自动化、高精度、高通量特点的表型组学分析平台,并将该平台与各类“组学”研究相结合,这将是作物育种学领域的一次新的技术革命。本文对植物表型组学的概念和研究意义进行了介绍和分析,并对高通量表型组学分析平台进行了详细介绍,同时对未来表型组学的发展和各类组学及生物大数据的综合利用进行了展望。
