 ,1, 王凡1, 王龙俊2, 周琴,1, 蔡剑1, 王笑1, 黄梅1, 戴廷波1, 姜东,1
Study on the Adaptability of Wheat Reaching the Protein Content Standard of Soft Wheat in Jiangsu Province
XIA ShuFeng,1, WANG Fan1, WANG LongJun2, ZHOU Qin,1, CAI Jian1, WANG Xiao1, HUANG Mei1, DAI TingBo1, JIANG Dong,1通讯作者:
责任编辑: 杨鑫浩
收稿日期:2020-02-24接受日期:2020-05-9网络出版日期:2020-12-16
| 基金资助: |
Received:2020-02-24Accepted:2020-05-9Online:2020-12-16
作者简介 About authors
夏树凤,E-mail:

摘要
关键词:
Abstract
Keywords:
PDF (2578KB)元数据多维度评价相关文章导出EndNote|Ris|Bibtex收藏本文
本文引用格式
夏树凤, 王凡, 王龙俊, 周琴, 蔡剑, 王笑, 黄梅, 戴廷波, 姜东. 江苏省小麦籽粒蛋白质达标弱筋小麦的适生性分析与评价[J]. 中国农业科学, 2020, 53(24): 4992-5004 doi:10.3864/j.issn.0578-1752.2020.24.003
XIA ShuFeng, WANG Fan, WANG LongJun, ZHOU Qin, CAI Jian, WANG Xiao, HUANG Mei, DAI TingBo, JIANG Dong.
开放科学(资源服务)标识码(OSID):

0 引言
【研究意义】弱筋小麦是适合制作饼干糕点类食品的原料。自2000年来,我国的饼干消费量急剧增加,饼干产量在近20年内以每年23.23%的速度增长[1]。作为饼干制作的原料,弱筋小麦的需求量也随之增长。饼干制品对酥脆性的要求较高,在加工过程应尽量避免面筋的形成,这就需要蛋白质含量低的弱筋面粉。张岐军等[2]研究指出,优质饼干小麦籽粒蛋白质含量(grain protein content,GPC)在9%—11.5%。根据GB/T 17320-2013《小麦品种品质分类》规定,弱筋小麦籽粒干基粗蛋白质含量(GPC)<12.5%[3]。小麦籽粒蛋白质含量不仅由小麦品种的遗传特性决定,还受到气候、土壤、栽培措施等影响[4,5]。江苏省位于我国的长江中下游弱筋小麦优势带,其气候湿润,热量条件良好,有利于小麦低蛋白和弱面筋的形成[6],然而由于长江中下游河渠纵横,湖泊星布,小范围气候不尽相同,导致了在类似的常规管理措施下,不同地区弱筋小麦达标率不同[7],明确不同种植地的小麦GPC达到弱筋小麦标准的可能性及其影响因素对品质区划具有重要意义。【前人研究进展】随机森林是利用多棵决策树对样本进行训练并预测的一种分类器,不仅无需提前对自变量和因变量的关系进行假设,还能有效克服自变量间的多重共线性,并给出各变量的重要性排序[8],在农业因子分析以及预测生物量的研究中已取得较好的应用效果[9]。EL?BIETA[10]采用分类回归树和随机森林发现,植物生长关键阶段的土壤质量和水分利用率是影响冬小麦产量全球升温潜能值和变异性最重要变量。刘峻明等[11]采用长时间序列气象数据结合随机森林早期预测冬小麦产量,得出各气象特征在不同生育阶段对产量的影响程度。Meta分析作为一种可以对同一研究目的多个独立研究结果的综合定量分析的方法[12],可以综合分析多个年份,多个试验点的研究结果。XU等[13]基于24个试验点数据,利用Meta分析探究了自然因素和耕作方式对华北平原温室气体排放的影响,发现降水、温度、土壤pH和质地对华北平原年均温室气体排放量没有显著影响,而矿物肥料氮肥施用量与排放量呈指数关系增加。单组率Meta分析也叫无对照资料的Meta分析,属于横断面研究,只需收集特定时间、特定范围内一组数据中的总样品数和事件发生样品数及相关因素就可进行因素与事件发生之间的关联分析,不需要对照组,在临床医学研究中应用较多[14,15]。【本研究切入点】现有的关于弱筋小麦品质的研究大多是控制条件下的试验,且试验点少(<10个),难以客观评估弱筋小麦的分布情况。另一方面,分析气象等生态因子对产量和品质的影响,大多采用线性相关和多元线性回归分析[16,17,18],但是考虑到农学规律并非都是线性且线性回归模型会存在多重共线性问题,上述研究方法存在一定缺陷。【拟解决的关键问题】本研究基于2018—2019年2年江苏省13个市36个县区157个抽样点(依据两位经纬度数据)种植小麦检测到的422个小麦GPC数据,利用随机森林和SMOTE算法(一种解决分类不平衡问题的方法)[19]对空间特征和气象因子进行重要性分析,筛选出相对重要的影响因子,并结合单组率Meta分析及其亚组分析,探究常规种植模式下江苏小麦GPC在不同的气象因子、地理位置范围内达标弱筋小麦标准的可能性,旨在为江苏弱筋小麦的种植区划提供理论和参考依据。1 材料与方法
1.1 数据来源
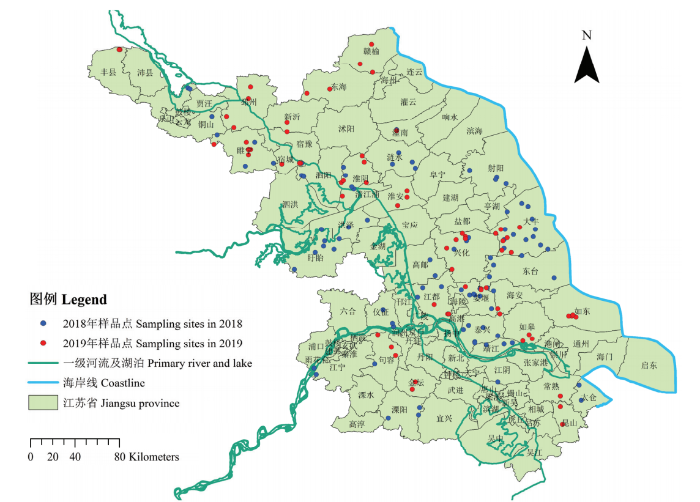
本研究所用样品来源于2018、2019年江苏省13市(图1)小麦品质抽样。抽检样品一般取小麦主产县种植面积排在前几位的品种,并来自于种植面积100亩以上的大户,抽样县区抽样数均≥3,抽样同时记录经纬度、栽培管理等信息,从中筛选出施氮量介于150—270 kg·hm-2的样品用于研究。2018年符合以上条件的抽样有210个,2019年有212个,共计422个样品(附表1)。图1
 新窗口打开|下载原图ZIP|生成PPT
图12018和2019年江苏小麦抽样点分布
Fig. 1Distribution of wheat sampling points in 2018 and 2019
籽粒蛋白质含量(GPC)采用7250型近红外谷物分析仪进行测定。
气象数据来自于中国气象数据网(
抽样地距一级河流和湖泊或者海岸线的最短距离利用ArcGIS map 10.2通过邻域分析获得。
1.2 数据分析
1.2.1 随机森林的构建(1)特征集及目标变量的构造
根据GB/T 17320-2013 《小麦品种品质分类》,弱筋小麦籽粒蛋白质含量(GPC)<12.5 %,依此标准将GPC数据分为弱筋和非弱筋两类,分别为84和338个样品。由于灌浆期是小麦籽粒形成的关键时期,且江苏省小麦的灌浆期在4、5月,因此按旬统计了4、5月各旬的总降雨量(RAIN)、总日照时数(SUN)、积温(TEM),按月统计了11、12、1、2、3月上述气象因子。考虑到江苏省的一级河流及湖泊和海岸线从西向东分布不同(图1),且尽管一些农业区划研究考虑了河流的影响,但是鲜有研究将河流信息定量纳入[21,22],种植地距一级河流和湖泊或者海岸线的最短距离(Distance)也被纳入分析变量。
(2)构建过程
为使得模型适用多样的气候条件,使用R-3.6.1软件将2年的原始数据按7:3随机分为训练集(306个)和检测集(116个),使用DMwR包中的SMOTE算法扩充和平衡弱筋模型原训练集中弱筋和非弱筋两分类的样本量,使其数量各为126个,构成新的训练集。通过随机且有放回地(bootstrap法)从新训练集中采样得到N棵树所需的N个子训练集,使得每个的子训练集都不同且包含重复的训练样本,每次未被抽到的数据成为袋外数据(out-of-bag,OOB),用来进行内部误差评估和变量重要性评价。生成每棵树时,从规模为M的特征变量集中选择m个变量(m<M),最优m尽量选择在N棵树上,OBB误差小且接近的数值。每棵树内的特征节点的选择基于GINI系数,$GINI(D)=\sum\nolimits_{\text{k}=\text{1}}^{\text{y}}{{{\text{p}}_{\text{k}}}}\times \text{(1-}{{\text{p}}_{\text{k}}}\text{)}=1\text{-}\sum\nolimits_{\text{k}=\text{1}}^{\text{y}}{\text{p}_{_{\text{k}}}^{\text{2}}}$,y表示数据集D中的类别数,pk是该类在该集合中的比例。其意义是从数据集中随机抽取2个样本类别标识不一致的概率。基尼指数越小,数据集的纯度越高。在本研究中,根据试验结果实时优化决策树数目N和特征变量个数m这2个参数,最终N等于1 000,m等于7。并用检测集验证模型精确度,计算误判率,以精度平均较少值计算各因子影响江苏省小麦GPC达标弱筋小麦标准的重要性,以上可通过randomForest包实现。
1.2.2 单组率Meta分析 基于2018年和2019年422条小麦籽粒蛋白质含量数据,统计同一县区、同一年份(默认气候条件相同)样品蛋白质含量达到弱筋小麦标准的个数(R,R≥0)以及总个数(T,T≥3),获得43组数据,计算弱筋小麦达标率P,经纬度和种植地距一级河流和湖泊或者海岸线的最短距离(Distance)采用县区内样品点均值。采用R-3.6.1软件Meta包中的metaprop函数进行Meta分析,由于相当多的地区弱筋小麦达标率过大(如0.8<P<1.0)或过小(如0<P<0.2),使用Freeman- Tukey双反正弦对P值进行数据转换来稳定方差[14, 23],随后,进行异质性检验和单组率meta分析。为进一步探究地理位置和气象特征如何影响弱筋小麦的达标可能性,选择经纬度及随机森林的重要性>15的变量3等分进行因素分析,对转换后的P值等权相加,合并效应量为江苏省小麦GPC达标弱筋小麦标准率值,计算其合并后的点估计值及95%置信区间。
统计学异质性采用χ2检验和I^2进行判断。当各研究间存在统计学同质性时(P>0.10,I^2<25%),使用固定效应模型分析;当各研究间存在统计学异质性时(P<0.10,I^2>25%),采用随机效应模型分析。本研究I^2=77%>25 %,P-value<0.1,存在统计学异质性,因此选择随机效应模型。
采用MySQL进行数据整合,采用R-3.6.1软件进行绘图,利用ArcGIS map10.2反距离插值法进行插值绘制地图。
2 结果
2.1 江苏省小麦籽粒蛋白质含量概况
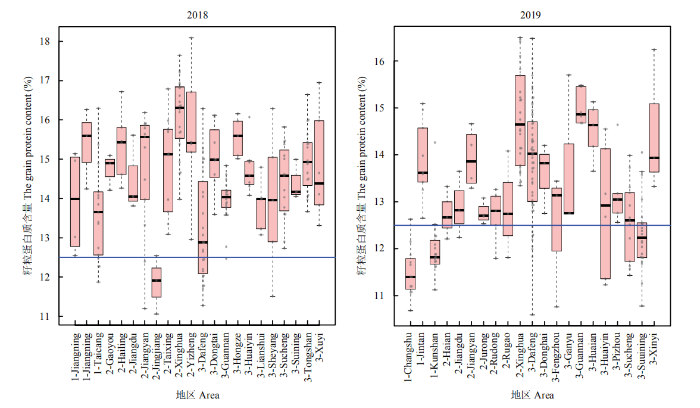
在常规种植模式下,2个年度江苏省小麦籽粒蛋白质含量(GPC)平均值为13.92%,其中2018年、2019年小麦GPC变幅分别为11.06%—18.09%、10.20%—16.50%,平均值分别为14.52%、13.33%,GPC≥14%样品的占比分别为67.14%、34.12%,12.5%≤GPC<14%的占比分别为22.86%、36.17%,GPC<12.5%的样品分别占比10%、29.71%。2018年GPC普遍高于2019年(图2)。图2
 新窗口打开|下载原图ZIP|生成PPT
图22018、2019年江苏省小麦籽粒蛋白质含量(GPC)
横线表示蛋白质含量等于12.5%,1、2、3分别表示苏南、苏中、苏北,其后为县区
Fig. 2Distribution of wheat GPC in Jiangsu in 2018 and 2019
The horizontal line indicates that the protein content is equal to 12.5%, and 1, 2, and 3 followed by name of county indicate southern Jiangsu, central Jiangsu, and northern Jiangsu, respectively
2018年22个县中有6个县存在GPC达到弱筋小麦标准的小麦,2019年21个县区中有11个。2018年GPC达到弱筋小麦标准的小麦占比10%,达标率前3的县区(市)是靖江(Jingjiang)、大丰(Dafeng)、太仓(Taicang),分别为67%,41%和24%。2019年占比29.71%。达标率前3的县区(市)是常熟(Changshu)、昆山(Kunshan)、睢宁(Suining),分别为92%,90%和64%。地区方面,弱筋小麦达标率始终是苏南>苏中>苏北,在2018年分别为16.67%,10.83%和6.06%,2019年分别为63.64%,25%和9.09%。
苏南的东南沿海沿湖县区(太仓、常熟、昆山)以及苏中的东部沿海县区(大丰)在2018年和2019年都有弱筋小麦分布,苏北地区的西北部沿河县区(睢宁、丰县、淮阴、宿城)仅在2019年有分布。
2.2 江苏省小麦籽粒蛋白质含量达到弱筋小麦标准的可能性及其分布
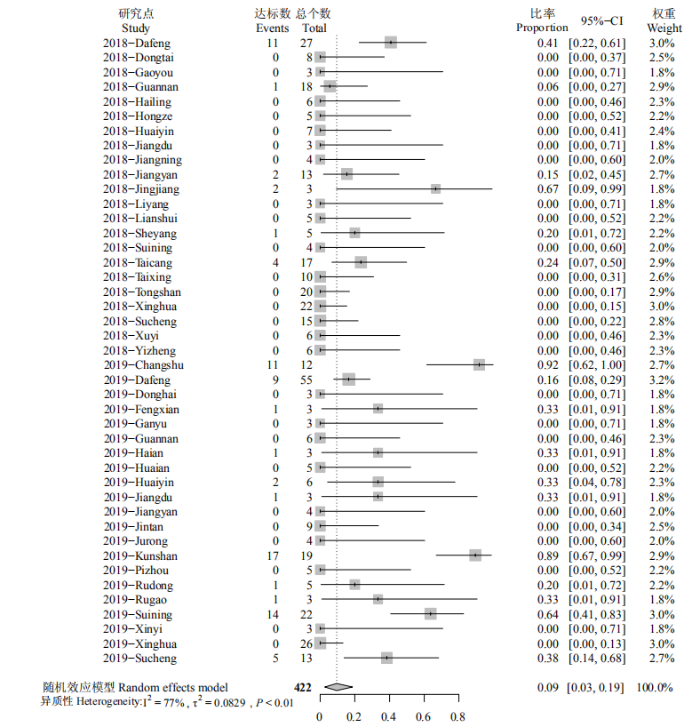
通过单组率Meta分析合并江苏省不同年份、不同县区的效应量,得出江苏省小麦GPC达标弱筋小麦标准的率值,结果表明常规种植模式下,小麦在江苏的弱筋GPC达标可能性为9.48%,95%置信区间为[2.69%,18.57%](图3)。图3
 新窗口打开|下载原图ZIP|生成PPT
图3江苏省小麦籽粒蛋白质含量(GPC)达标弱筋小麦标准的比率(Meta分析)
2018,2019为年份,其后为县区
Fig. 3The ratio of wheat GPC reaching to the standard of weak gluten wheat in Jiangsu province (Meta-analysis)
The 2018 and 2019 followed by name of county indicate the year
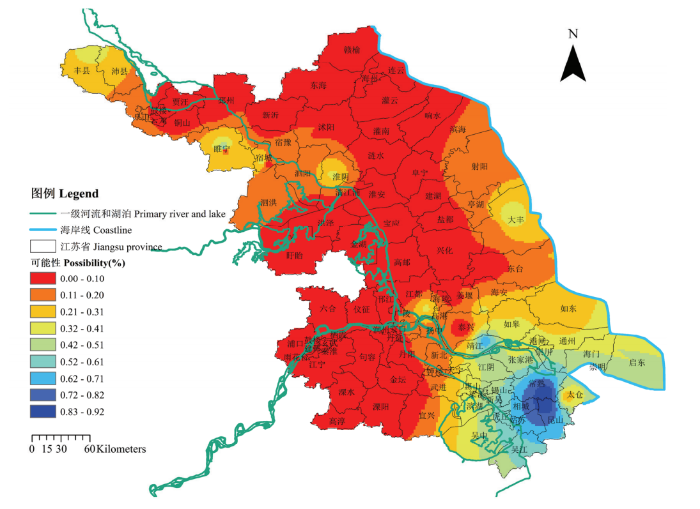
由图4可知,江苏东南部以及靖江区域的小麦GPC达到弱筋小麦标准可能性最高,均大于50%(此处临海和太湖)。其次是江苏北部的沿河流一带,以及江苏东部的沿海区域,达标可能性最高可达41%。而江苏的西南部、东北部以及中心区域达标可能性几乎为0。除了气候因素以外,这些区域的水系分布相对其他区域较少,因此,种植地距一级河流和湖泊或者海岸线的最短距离(Distance)也用于随机森林的构建(图5)。
图4
 新窗口打开|下载原图ZIP|生成PPT
图4江苏省小麦籽粒蛋白质含量(GPC)达标弱筋小麦标准的可能性分布
Fig. 4Distribution of the possibility of wheat GPC reaching the standard of soft wheat in Jiangsu province
图5
 新窗口打开|下载原图ZIP|生成PPT
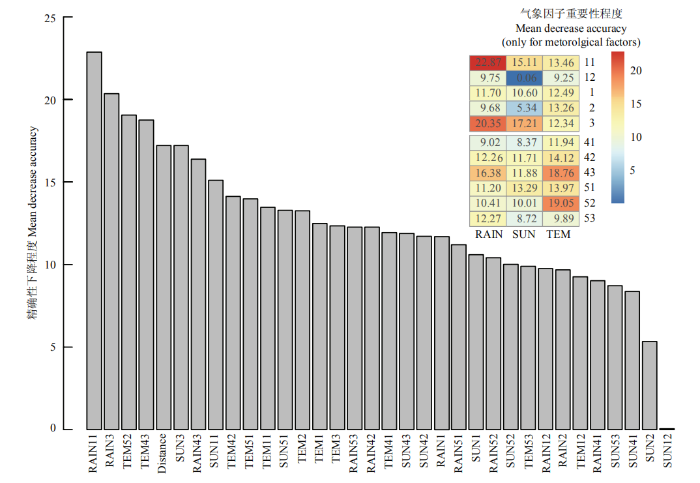
图5影响弱筋模型构建的变量重要性
TEM,SUN,RAIN分别为积温,日照时数,降雨量。后面的数字表示月份,其中41,42,43,51,52,53分别表示4月上、中、下旬,5月上、中、下旬。Distance表示样品点距离一级河流和湖泊或者海岸线的最短距离,下同
Fig. 5Importance of variables affecting soft wheat model construction
TEM, SUN, RAIN represent accumulated temperature, sunshine hours, rainfall, respectively. 41, 42, 43, 51, 52, 53 represent the early, middle, and late April, the early, middle, and late May, respectively. Distance represents the shortest distance from the sample point to the primary river and lake or coastline. The same as below
2.3 影响小麦籽粒蛋白质含量达到弱筋小麦标准的关键因子
弱筋小麦随机森林模型基于袋外观测的预测误判率为16.27%,对检测集(116个)的误判率为12.07%,对全部数据集(422个)的整体误判率为14.22%。模型变量重要性如图5所示,Mean decrease accuracy是指预测误差准确性降低的程度,该值越大表示该变量的重要性越大[24]。气象因子是影响江苏省小麦GPC能否达标弱筋小麦标准的最重要因素。重要性>15的气象因子有11月和3月的总降雨量(RAIN11、RAIN3)和总日照时数(SUN11、SUN3),4月下旬的总降雨量(RAIN43)、积温(TEM43)和5月中旬的积温(TEM52)。有4个气象因子的重要性大于地理位置因素(Distance)。其中,11月的总降雨量(RAIN11)是最重要的气象因子,此时江苏小麦正处于出苗阶段。第2重要的气象因子是3月的总降雨量(RAIN3),此时江苏小麦处于拔节期。5月中旬(灌浆期)的积温(TEM52)和4月下旬(开花期前后)的积温(TEM43)也是相对重要的气象因素。抽样点距离一级河流和湖泊或者海岸线的最短距离(Distance)重要性排名第5,3月的总日照时数(SUN3)的重要性排名第6,但两者差异不明显。12月的总日照时数(SUN12)是最不重要的指标,其次是2月的总日照时数(SUN2)。图5中的热力图表明,生育前期,出苗和分蘖期(11—12月)、拔节期(3月)的各气象因子之间总降雨量的影响更大,越冬期(1—2月)的积温相对其他气象因子重要;生育后期,即4月到5月中旬(从孕穗到灌浆期),其积温对江苏省小麦GPC达标弱筋小麦标准的影响更大。
2.4 江苏省小麦籽粒蛋白质含量达标弱筋小麦标准可能性与关键因子的关系
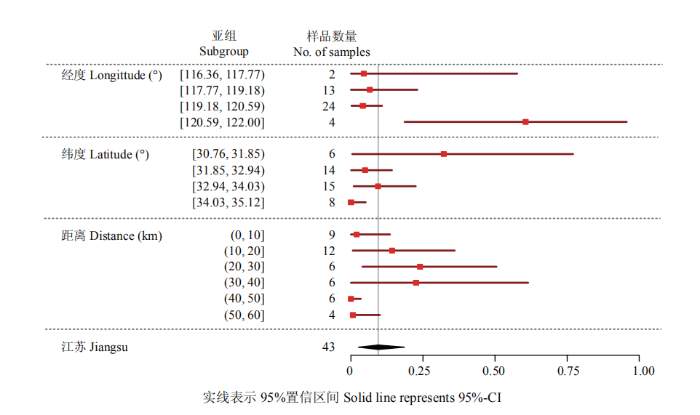
2.4.1 江苏省小麦籽粒蛋白质含量达标弱筋小麦标准可能性与地理位置的关系 抽样点距离一级河流和湖泊或者海岸线的最短距离短,其种植的小麦GPC达标弱筋小麦标准的可能性高,在距离为20—30 km时达到最高,为23.95%,其次是30—40 km, 为22.58%,超过40 km后或小于10 km,达标可能性远远低于平均水平,几乎为0(图6)。因此,除了气候因子影响外,种植地距离一级河流和湖泊或者海岸线的最短距离也造成随着纬度从30.76°到35.12°向北推移,江苏省小麦GPC达标弱筋小麦标准的可能性从32.17%迅速下降至0.03%,但32.94—34.03°之间可能性略微上升;随着经度从116.36°到122°向东推移,江苏省小麦GPC达标弱筋小麦标准的可能性从4.45%逐步上升至60.59%,在119.18—120.59°之间略微下降。图6
 新窗口打开|下载原图ZIP|生成PPT
图6关键地理位置与江苏小麦籽粒蛋白质含量达标弱筋小麦标准可能性的关系
实线表示95%置信区间
Fig. 6Relationship between key geographic locations and the possibility of wheat GPC reaching the standard of soft wheat in Jiangsu
Solid line represents 95%-CI
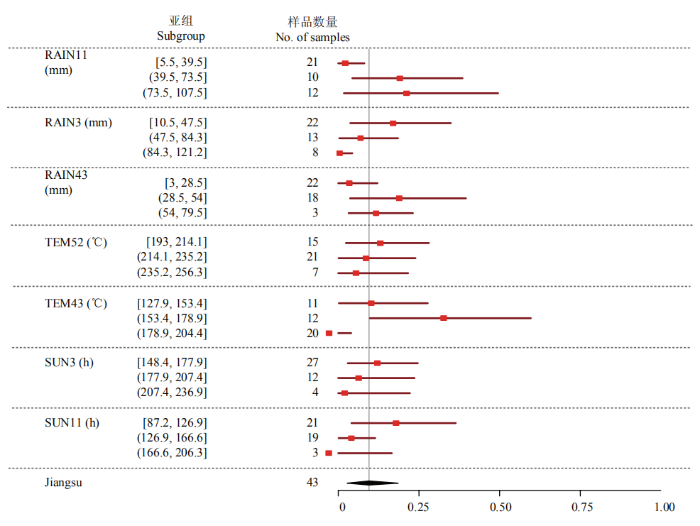
2.4.2 江苏省籽粒小麦蛋白质含量达标弱筋小麦标准可能性与关键气象因子的关系 重要性>15的气象因子中有关降雨量指标是11月的总降雨量(RAIN11)、3月的总降雨量(RAIN3)以及4月下旬的总降雨量(RAIN43)。11月的总降雨量(RAIN11)与江苏省小麦GPC达标弱筋小麦标准的可能性呈正相关,此时处于出苗期,当总降雨量>39.5 mm时,达标可能性大于全省水平,总降雨量在73.5—107.5 mm之间,江苏省小麦GPC达标弱筋小麦标准的可能性最高,为21.14 %。3月的总降雨量(RAIN3)与江苏省小麦GPC达标弱筋小麦标准的可能性呈负相关,此时处于拔节分蘖期,江苏省小麦GPC达标弱筋小麦标准可能性在总降雨量<47.4 mm时,低于全省水平,在总降雨量为10.5—47.4 mm时最高,为16.97 %。4月下旬,江苏省小麦处于开花期前后,GPC达标可能性随总降雨量先上升后下降,在适当的总降雨量(28.5—54 mm)下,GPC达标可能性最高,为18.83%(图7)。
图7
 新窗口打开|下载原图ZIP|生成PPT
图7关键气象因子与江苏小麦籽粒蛋白质含量达标弱筋小麦标准可能性的关系
实线表示95%置信区间
Fig. 7Relationship between key meteorological factors and the possibility of wheat GPC reaching the standard of soft wheat in Jiangsu province
Solid line represents 95%-CI
5月中旬的积温(TEM52)与江苏省小麦GPC达标弱筋小麦标准的可能性呈负相关,在积温较低(193—214.1℃)时,GPC达标可能性最高,为13%。而江苏省小麦GPC达标可能性随着4月下旬的积温(TEM43)的增加,先上升后下降,在适宜的积温(153.4—178.9℃)下,GPC达标可能性最高,为32.66%。
日照时数方面,随着3月份的总日照时数的增加,江苏省小麦GPC达标弱筋小麦标准可能性呈现下降趋势,在148.4—177.9 h时,江苏省小麦GPC达标弱筋小麦标准可能性最高,为12.07%。11月的总日照时数对江苏省小麦GPC达标可能性的影响与之相同,在总日照时数在87.2—126.9 h时,GPC达标可能性最高,达17.9%。
2.5 同一县区(市)不同年份小麦籽粒蛋白质含量达标弱筋小麦可能性受关键因子的影响验证
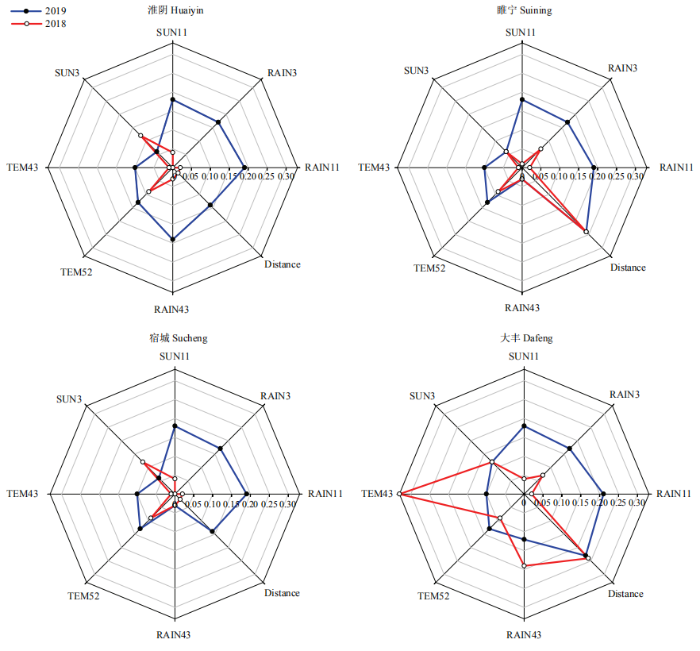
苏中东部沿海县区大丰(Dafeng)在2018和2019年均有弱筋小麦分布,而苏北沿河县区睢宁(Suining)、淮阴(Huaiyin)、宿城(Sucheng)仅在2019年有弱筋小麦分布(图2)。选取随机森林模型重要性>15的关键因子结合Meta分析所得的各关键因子不同区间下江苏省小麦GPC达标的可能性(图6—7)发现,2019年淮阴、睢宁、宿城的11月总降雨量和日照时数、3月的总降雨量、4月下旬的积温和总降雨量、5月中旬的积温均比2018年有利于弱筋小麦的生长。2018年大丰3月的总降雨量,4月下旬的积温和总降雨量以及地理位置均值(Distance)分别为71.2 mm,176.3℃,39 mm,21.22 km,比睢宁(64 mm,200.6℃,3 mm,23.93 km)、淮阴(88.9 mm,189.4℃,23.5 km, 5.67 km)、宿城(108.1 mm,200.6 ℃,23.5 km,9.57 km)有利于江苏小麦GPC达标弱筋小麦,且由于4月下旬积温和总降雨量比2019年同期气象因子更适宜,给小麦GPC达标弱筋小麦带来更大的积极性,从而使得大丰在2年均有弱筋小麦分布(图8)。图8
 新窗口打开|下载原图ZIP|生成PPT
图8淮阴、睢宁、宿城、大丰在关键因子影响下的2018和2019年的达标可能性
Fig. 8The possibility of wheat GPC reaching the standard of soft wheat under the effects of key factors in 2018 and 2019 in Huaiyin, Suining, Sucheng, Dafeng (%)
3 讨论
蛋白质含量是决定小麦籽粒烘焙品质的关键指标,从江苏省小麦籽粒品质抽样结果看,小麦GPC 2年平均值为13.92%,变幅为10.20%—18.09%。2018年小麦GPC均值比2019年高8.93%,其中GPC≥14%样品占比比2019年高33.02%,12.5%≤GPC<14 %的样品占比比2019年低13.31%,GPC<12.5 %(弱筋小麦)占比比2019年低19.71%。苏南的东南沿海沿湖县区(太仓、常熟、昆山)以及苏中的东部沿海县区(大丰)在2018年和2019年都有弱筋小麦分布,苏北地区的西北部沿河县区(睢宁、丰县、淮阴、宿城)仅在2019年有弱筋小麦分布。采用随机森林算法和单组率Meta分析及亚组分析对江苏省小麦GPC达标弱筋小麦标准的可能性定量研究发现,江苏省不同年份、不同县区弱筋小麦的分布与气象因子以及水系分布有很大的关系。地理因素方面,抽样点距离一级河流和湖泊或者海岸线的最短距离造成了相对大的影响,最大差值为23.95%。这可能由于接近河流的地区土壤中的水分在小麦生育后期相对充足,相对其他区域有利于籽粒中直链淀粉和总淀粉含量的积累,从而降低蛋白质含量,利于弱筋小麦的形成[25]。而小麦抽样点距离一级河流和湖泊或者海岸线的最短距离在10 km以内的弱筋小麦达标可能性低于10—30 km,这可能是因为一些地区的土壤越接近河流其含盐量越高[26],从而使得小麦蛋白质含量显著提高[27,28],当盐浓度较低(0.3 %)时,对小麦蛋白的影响不显著[28]。
气象因子方面,同期的气象因子中,生育前期中出苗期、分蘖期和拔节期的降雨量影响大于积温和日照时数,而生育后期中孕穗至灌浆期的积温更重要。TOSCANO等[29]也发现秋季至冬季的降水量、从开花期到收获期的气温对冬小麦GPC极为重要。其中,江苏省小麦GPC达标弱筋小麦标准的可能性与出苗期的降雨量呈正相关,这是因为秋冬季,大量的降雨会使通过土壤剖面流失的氮素增加,特别是沙质土壤,不利于后期氮素的吸收,从而不利于提高谷物蛋白质含量[30]。GARRIDO-LESTACH等[31]也发现小麦GPC与花前降雨呈负相关。而江苏省小麦GPC与拔节期降雨量(0—121.2 mm)呈正相关,这可能是由于江苏农户通常会在拔节期施用氮肥,降雨量在121.2 mm内的增加,可以显著提高小麦植株的氮吸收量和吸收速率[32],且蛋白质合成所需的氮源约75%来自开花前在营养器官贮存的氮化合物,从而增大后期高GPC的可能性。当5月中旬(灌浆期/成熟期)积温在193—256.3℃时,江苏省小麦GPC达标的可能性随着积温的升高而降低。王大成等[33]采用神经网络的方法研究也发现,当北京小麦在5月上旬至6月上旬(开花至乳熟期)时,在16—32℃下,随着温度的升高,蛋白质合成酶逐渐增强,物质代谢旺盛,灌浆过程加速,GPC升高。
本研究考虑了常规种植情况下,气候因子以及空间特征对江苏弱筋小麦形成的影响,但没有将小麦的品种纳入分析范围。原因是前人研究表明,在一定程度上栽培条件的变化对蛋白质的影响大于基因或品种的影响[33],且2018—2019年抽样结果反映,一些传统观点上的中筋小麦品种在江苏表现出低蛋白现象。
4 结论
(1)江苏省小麦籽粒蛋白质在2018—2019年间变幅为10.20%—18.09%,均值为13.92%。其中籽粒蛋白质GPC≥14%样品占比最多,其次是12.5%≤GPC<14%样品,GPC<12.5%(弱筋小麦)最少,占比19.91 %。弱筋小麦主要分布在东部沿海、东南沿海沿湖地区(2018—2019年)。在气候适宜的情况下(2019年),西北沿河一带的小麦GPC也可达标弱筋小麦标准。(2)受水系分布以及气候等因素的共同制约,江苏不同地区小麦GPC达标弱筋小麦标准的可能性存在差异。水系分布方面,种植地距一级河流和湖泊或者海岸线的最短距离在20—30 km之间,达标可能性最高。气象因子方面,生育前期,降雨量对江苏弱筋小麦的形成影响比较大,特别是出苗期和拔节期;生育后期,积温的影响更重要,尤其是开花期和灌浆期。
(3)在进行江苏弱筋小麦种植区划时,应重点考虑地理位置(水系分布等)和气候分布。
参考文献 原文顺序
文献年度倒序
文中引用次数倒序
被引期刊影响因子
DOI:10.1016/S2095-3119(17)61729-5URL [本文引用: 1]
[本文引用: 1]
[本文引用: 1]
[本文引用: 1]
[本文引用: 1]
DOI:10.1071/CP13238URL [本文引用: 1]
DOI:10.1016/j.fcr.2018.06.003URL [本文引用: 1]
[本文引用: 1]
[本文引用: 1]
[本文引用: 1]
[本文引用: 1]
DOI:10.1023/A:1010933404324URL [本文引用: 1]

Random forests are a combination of tree predictors such that each tree depends on the values of a random vector sampled independently and with the same distribution for all trees in the forest. The generalization error for forests converges a.s. to a limit as the number of trees in the forest becomes large. The generalization error of a forest of tree classifiers depends on the strength of the individual trees in the forest and the correlation between them. Using a random selection of features to split each node yields error rates that compare favorably to Adaboost (Y. Freund & R. Schapire, Machine Learning: Proceedings of the Thirteenth International conference, ***, 148–156), but are more robust with respect to noise. Internal estimates monitor error, strength, and correlation and these are used to show the response to increasing the number of features used in the splitting. Internal estimates are also used to measure variable importance. These ideas are also applicable to regression.
DOI:10.1016/j.cj.2016.01.008URL [本文引用: 1]
DOI:10.1016/j.fcr.2018.07.015URL [本文引用: 1]
URL [本文引用: 1]
冬小麦生育早期的产量预测对于制定冬小麦整个生长期的精准管理决策具有重要参考意义。该文基于随机森林算法,采用1990-2015年河南省小麦平均拔节期至平均抽穗期地面观测气象数据与统计产量数据,分别提取不同穗分化期的温湿度、降水等47个气象要素和小麦种植区经纬度、高程3个空间要素,共计50个参数作为特征变量集,以实际单产、气象产量和相对气象产量分别作为目标变量,构建多种变量组合模型对冬小麦产量进行回归预测,并结合袋外数据重要性结果对产量影响因子进行分析。研究结果表明:1)使用气象产量和相对气象产量作为目标变量建模的预测效果优于单产模型,决定系数R2均达到0.8以上,气象产量的平均绝对误差(mean absolute error,MAE)和均方根误差(root mean square error,RMSE)分别为415和558 kg/hm2,相对气象产量的MAE和RMSE分别为0.07和0.09;2)相较于气象特征,空间特征在产量预测中起决定性作用,且小花分化期以及抽穗开花期的气象特征产量预测精度高于其他穗分化期;3)在气象特征中,利用袋外数据变量重要性得出平均温度、最低温度、负积温、最高温度在不同生育阶段对产量的影响程度。该研究结果为冬小麦生育早期产量预测提供了新的思路和方法。
DOI:10.3969/j.issn.1671-5144.2013.03.014URLPMID:32615030 [本文引用: 1]
OBJECTIVE: It has been estimated that much of health research may be wasted, resulting in billions of dollars in wasteful research spending worldwide each year. Given the increased use of randomized trials and their influence on medicine, one method to combat research waste is to conduct randomized clinical trials (RCTs) only when a systematic review (SR) suggests more data are needed or when no previous SRs are identified. Here, we analyzed RCTs to determine whether SRs were cited as justification for conducting a trial. METHODS: We analyzed phase III RCTs published between 2016 and 2018 in New England Journal of Medicine, Lancet, and JAMA. We performed duplicate and independent data extraction to ensure the accuracy and validity of our data. For each trial, we extracted whether SRs were cited as justification for conducting the clinical trial. RESULTS: We examined 637 RCTs that cited 728 SRs. Overall, 38.1% (243/637) of RCTs cited an SR as either verbatim (6.9%, 44/637) or inferred (31.2%, 199/637) for trial justification. The 79 remaining RCTs cited SRs in other ways. Approximately, 49.5% (315/637) of RCTs did not cite a SR. CONCLUSIONS: Less than half of the analyzed clinical trials cited a SRs as the basis for undertaking the trial. We believe trialists should be required to present relevant SRs to an ethics or peer review committee demonstrating an unmet need prior to initiating a trial. Eliminating research waste is both a scientific and ethical responsibility.
DOI:10.1002/ece3.3211URLPMID:28904752 [本文引用: 1]
Requirements for mitigation of the continued increase in greenhouse gas (GHG) emissions are much needed for the North China Plain (NCP). We conducted a meta-analysis of 76 published studies of 24 sites in the NCP to examine the effects of natural conditions and farming practices on GHG emissions in that region. We found that N2O was the main component of the area-scaled total GHG balance, and the CH 4 contribution was <5%. Precipitation, temperature, soil pH, and texture had no significant impacts on annual GHG emissions, because of limited variation of these factors in the NCP. The N2O emissions increased exponentially with mineral fertilizer N application rate, with y = 0.2389e(0.0058x) for wheat season and y = 0.365e(0.0071x) for maize season. Emission factors were estimated at 0.37% for wheat and 0.90% for maize at conventional fertilizer N application rates. The agronomic optimal N rates (241 and 185 kg N ha(-1) for wheat and maize, respectively) exhibited great potential for reducing N2O emissions, by 0.39 (29%) and 1.71 (56%) kg N2O-N ha(-1) season(-1) for the wheat and maize seasons, respectively. Mixed application of organic manure with reduced mineral fertilizer N could reduce annual N2O emissions by 16% relative to mineral N application alone while maintaining a high crop yield. Compared with conventional tillage, no-tillage significantly reduced N2O emissions by ~30% in the wheat season, whereas it increased those emissions by ~10% in the maize season. This may have resulted from the lower soil temperature in winter and increased soil moisture in summer under no-tillage practice. Straw incorporation significantly increased annual N2O emissions, by 26% relative to straw removal. Our analysis indicates that these farming practices could be further tested to mitigate GHG emission and maintain high crop yields in the NCP.
[本文引用: 2]
[本文引用: 2]
[本文引用: 1]
[本文引用: 1]
[本文引用: 1]
[本文引用: 1]
DOI:10.1626/pps.9.323URL [本文引用: 1]
[本文引用: 1]
[本文引用: 1]
[本文引用: 1]
[本文引用: 1]
DOI:10.3724/SP.J.1047.2011.00539URL [本文引用: 1]
气温是最重要的气象因子之一,空间插值为台站气象数据降尺度提供了有效方法。本文利用江苏省67个气象台站2003年的逐日气温资料计算逐月平均气温和年平均气温,结合空间分辨率为30m×30m的DEM数据,分别利用反距离权重法、张力样条插值法、普通克里格插值法和协同克里格插值法,对月和年平均气温进行插值,并利用交叉验证法对插值精度进行了验证。研究结果表明,考虑空间自相关性的普通克里格法的插值精度明显优于反距离权重法和张力样条插值法;而协同克里格法由于考虑了经纬度、距海岸距离和高程等影响气温空间分布的局地因素,其插值精度一般略优于普通克里格法,尤其是在站点稀疏的情况下,协同克里格的优势更加明显;由于受海陆分布和东亚季风的影响,江苏省气温的空间分布与距海岸距离有关,在利用协同克里格进行空间插值时,距海岸距离也是一个值得关注的因素。
[本文引用: 1]
[本文引用: 1]
URL [本文引用: 1]
江苏小麦常年播种3 000万亩左右,面积、单产、总产均居全国第3~4位.由于地处南北过渡地带,以淮河-苏北灌溉总渠为界,分属两大类型,淮北属北方冬麦区黄淮平原生态型,淮南属南方冬麦区长江中下游平原生态型.
URL [本文引用: 1]
江苏小麦常年播种3 000万亩左右,面积、单产、总产均居全国第3~4位.由于地处南北过渡地带,以淮河-苏北灌溉总渠为界,分属两大类型,淮北属北方冬麦区黄淮平原生态型,淮南属南方冬麦区长江中下游平原生态型.
DOI:10.1186/2049-3258-72-39URLPMID:25810908 [本文引用: 1]
BACKGROUND: Meta-analyses have become an essential tool in synthesizing evidence on clinical and epidemiological questions derived from a multitude of similar studies assessing the particular issue. Appropriate and accessible statistical software is needed to produce the summary statistic of interest. METHODS: Metaprop is a statistical program implemented to perform meta-analyses of proportions in Stata. It builds further on the existing Stata procedure metan which is typically used to pool effects (risk ratios, odds ratios, differences of risks or means) but which is also used to pool proportions. Metaprop implements procedures which are specific to binomial data and allows computation of exact binomial and score test-based confidence intervals. It provides appropriate methods for dealing with proportions close to or at the margins where the normal approximation procedures often break down, by use of the binomial distribution to model the within-study variability or by allowing Freeman-Tukey double arcsine transformation to stabilize the variances. Metaprop was applied on two published meta-analyses: 1) prevalence of HPV-infection in women with a Pap smear showing ASC-US; 2) cure rate after treatment for cervical precancer using cold coagulation. RESULTS: The first meta-analysis showed a pooled HPV-prevalence of 43% (95% CI: 38%-48%). In the second meta-analysis, the pooled percentage of cured women was 94% (95% CI: 86%-97%). CONCLUSION: By using metaprop, no studies with 0% or 100% proportions were excluded from the meta-analysis. Furthermore, study specific and pooled confidence intervals always were within admissible values, contrary to the original publication, where metan was used.
DOI:10.1016/j.isprsjprs.2011.11.002URL [本文引用: 1]
Land cover monitoring using remotely sensed data requires robust classification methods which allow for the accurate mapping of complex land cover and land use categories. Random forest (RF) is a powerful machine learning classifier that is relatively unknown in land remote sensing and has not been evaluated thoroughly by the remote sensing community compared to more conventional pattern recognition techniques. Key advantages of RF include: their non-parametric nature; high classification accuracy; and capability to determine variable importance. However, the split rules for classification are unknown, therefore RF can be considered to be black box type classifier. RF provides an algorithm for estimating missing values; and flexibility to perform several types of data analysis, including regression, classification, survival analysis, and unsupervised learning.
In this paper, the performance of the RF classifier for land cover classification of a complex area is explored. Evaluation was based on several criteria: mapping accuracy, sensitivity to data set size and noise. Landsat-5 Thematic Mapper data captured in European spring and summer were used with auxiliary variables derived from a digital terrain model to classify 14 different land categories in the south of Spain. Results show that the RF algorithm yields accurate land cover classifications, with 92% overall accuracy and a Kappa index of 0.92. RF is robust to training data reduction and noise because significant differences in kappa values were only observed for data reduction and noise addition values greater than 50 and 20%, respectively. Additionally, variables that RF identified as most important for classifying land cover coincided with expectations. A McNemar test indicates an overall better performance of the random forest model over a single decision tree at the 0.00001 significance level. (C) 2011 International Society for Photogrammetry and Remote Sensing, Inc. (ISPRS) Published by Elsevier B.V.
[本文引用: 1]
[本文引用: 1]
DOI:10.1556/CRC.39.2011.4.7URL [本文引用: 1]
Durum wheat (Triticum turgidum L. Desf.) is a species well adapted to the Mediterranean environments where salt stress due to seawater intrusion is an increasing problem. The purpose of this study was to deep insight into the relationships among physiological, productive and qualitative aspects under salinity, being these aspects still poorly investigated in durum wheat. In 2004-2005 crop season 10 durum wheat genotypes of different origin and breeding time were grown in a naturally-lit polycarbonate greenhouse under three irrigation water salinity levels (0.9, 6.0 and 12.0 dS m(-1)). A complete randomized block design with three replications was adopted. The osmotic damage was evaluated by estimating relative water content (RWC), leaf water potential (Psi(w)) and osmotic potential at full turgor (Psi(pi 100)). The toxic damage to the plants was evaluated by measuring Na(+) accumulation and Na(+)/K(+) ratio in the leaves. Differences in yield performance were evaluated by assessing the main yield components and some qualitative traits, carotenoid pigment and protein content and Sedimentation test in sodium dodecyl sulphate. A significant effect of genotype, salt stress and of their interaction on all the characters was observed. Durum wheat genotypes generally showed a moderate tolerance to salt stress. The genotype performance was dependent on stress level and RWC maintenance. Osmotic adjustment and low sodium accumulation were found to play a key role in salt tolerance. An improvement in the grain quality characters on increasing salinity level, consistently with a yield decrease, was observed.
DOI:10.1016/j.foodchem.2015.11.008URLPMID:26616983 [本文引用: 2]
Addition of salt solution in making wheat dough improves viscoelasticity. However, the effect of native salt fortification on dough quality is unclear. Here, wheat plants were subjected to post-anthesis salt stress to modify salt ion content in grains. The contents of Na(+) and K(+), high-molecular-weight glutenin subunits (HMW-GS), glutenin macropolyers (GMP) and amino acids in mature grains were measured. As NaCl concentration in soil increased, grain yield decreased while Na(+) and K(+) contents increased. The contents of amino acids, HMW-GS and GMP in grains also increased, especially when NaCl concentration exceeded 0.45%. Fraction of GMP larger than 10 mum was also increased. Na(+) and K(+) contents were significantly positively correlated to GMP and total HMW-GS contents, and to large GMP fraction.
DOI:10.1016/j.agrformet.2015.02.003URL [本文引用: 1]
DOI:10.1016/j.eja.2010.05.006URL [本文引用: 1]
Abstract
Two durum wheat (Triticum durum Desf.) cultivars (Simeto and Ofanto) were grown in field trials in Foggia (Southern Italy), under two water regimes and in three cropping seasons, to evaluate the influence of water regime on grain protein composition in relation to technological quality. On grain samples, the following quality analyses were performed: protein and gluten content, gluten index and SDS test. Furthermore, different protein fractions were evaluated: gliadins; glutenins, high molecular weight subunits (HMW-GS) and low molecular weight subunits (LMW-GS) of the larger glutenin polymers; percentage of unextractable polymeric proteins (%UPP). Two-dimensional gel electrophoresis (2D) of glutenins was also performed on selected samples. A year-on-year variation in gluten index was observed and its values were positively correlated (r = 0.71**) with the number of days with maximum temperature ranging from 30 to 35 °C during grain filling. This was consistent with an increase in glutenin fractions. Between the investigated cultivars, Simeto showed better technological performance and higher glutenin content, HMW-GS/LMW-GS ratio and %UPP. Water deficit was found to affect technological quality and protein composition differently depending on the timing of stress occurrence. An increase in protein content and in HMW-GS/LMW-GS ratio, consistent with a decrease in grain yield, was observed when water deficit occurred throughout the growing season. When a terminal water stress occurred in grain filling an improvement in gluten strength was observed consistently with an increase in the amount of glutenin macropolymers associated to a general modulation of HMW-GS and LMW-GS levels, as indicated by 2D analyses. Probably water deficit associated to high temperature stress which generally occurs under Mediterranean environments during grain filling, may have caused a higher aggregation level of glutenin subunits that was reflected in an improvement of technological quality.DOI:10.1016/j.eja.2004.12.001URL [本文引用: 1]
Abstract
Three different experiments were designed to study the effects of N fertilizer rate, timing and splitting, and the response to combined application of N and S fertilizer on the quality of durum wheat (Triticum turgidum L.) over a 3-year period in Vertisols under rainfed Mediterranean conditions. The following parameters were analyzed: grain yield, test weight, grain protein concentration, gluten index, yellow index, ash content and vitreousness. The N rate experiment included rates of 0, 100, 150, and 200 kg N ha−1 carried out on 4 different sites. The experiment was designed as a randomized complete block with four blocks. For the experiment on N timing and splitting, a single rate of 150 kg N ha−1 was used, different fractions being applied at sowing, tillering and stem elongation, at a single site; again, experimental design was a randomized complete block with four blocks. Finally, for the experiment on the response to combined application of N and S fertilizer, a single fertilizer dose of 150 kg N ha−1 was applied in two forms (urea + ammonium nitrate and urea + ammonium nitrosulfate) with one leaf application at ear emergence (zero, 25 kg S ha−1, 25 kg N ha−1, 25 kg S ha−1 + 25 kg N ha−1, and 50 kg N ha−1), also at a single site, using a split-plot design with four replications. Year-on-year variation in rainfall led to marked variations in wheat yield, grain protein concentration and quality indices. Rainfall and temperatures during grain formation and ripening (April and May) were critical for durum wheat quality. N fertilizer rate modified the behavior pattern of some quality indices as a function of climate, and had a more consistent effect on durum wheat quality than on grain yield. The highest values for grain yield were recorded at an N rate of 100 kg ha−1, while maximum grain protein concentration values were recorded at 200 kg ha−1. Increasing N rates also prompted an increase in vitreous kernel count, which was highest at 150 kg N ha−1. The timing and splitting of N fertilizer had no clear effect on either grain yield or quality indices. Leaf application of N at ear emergence increased only grain protein concentration, vitreous kernel count and grain ash content. Soil or leaf application of S had no effect on quality indices, with the exception of ash content, which rose with leaf application at ear emergence. The response of grain yield and grain protein concentration to fertilizer N differed from that reported for temperate climates.[本文引用: 1]
[本文引用: 1]
URL [本文引用: 2]
Temperature, rainfall, illumination time and soil nutrients are major ecological factors to influence protein content forming of winter wheat. This study focused on the evaluation of the relative weighting of those factors on winter wheat grain quality (protein) based on the wheat planting, soil and weather data in Beijing, China. artificial neural network (ANN) analysis is employed in this study. The result indicated that the 10 factors have significant impact on the formation of wheat protein. The most important factor is illumination time from 6th June to 10th June, followered by the number of days which the temperature above 32℃, available nitrogen content of soil, average temperature from 1st May to 10th June, average temperature from 26 May to 30 May, accumulated temperature from 20th May to 10th June, average temperature from 1st June to 5th June, range of temperature from 20th May to 10th June, rainfall from 20th May to 10th June, and organic matter in soil respectively. Then, the response curves for key factors are generated by the ANN models in order to reflect the wheat protein variant trend according to the different ecological factors. The results of this study can probably be used for provided the reference basis for the winter wheat quality regionalization of Beijing area
