 ,1, ʯ��2, �θ�,1, ������,1
Potential of Fertilizer Reduction and Benefits of Environment and Economic for Cereal Crops Production in Shaanxi Province
ZHANG XinXin,1, SHI Lei2, HE Gang,1, WANG ZhaoHui,1ͨѶ����:
���α༭: ����ϼ
�ո�����:2019-12-4��������:2020-03-3�����������:2020-10-01
| ��������: |
Received:2019-12-4Accepted:2020-03-3Online:2020-10-01
����� About authors
������,E-mail��

ժҪ
�ؼ��ʣ�
Abstract
Keywords��
PDF (3446KB)Ԫ������ά�����������������EndNote|Ris|Bibtex�ղر���
�������ø�ʽ
������, ʯ��, �θ�, ������. ����ʡ��ʳ�����ļ���DZ�������û���Ч��[J]. �й�ũҵ��ѧ, 2020, 53(19): 4010-4023 doi:10.3864/j.issn.0578-1752.2020.19.014
ZHANG XinXin, SHI Lei, HE Gang, WANG ZhaoHui.
0 ����
���о����塿�ҹ�ռ����7%�ĸ��������������ȫ���1/3�Ļ���[1],���ʹ���ʹ�ò���һϵ�еĻ�������,�������ˮ�塢������Ⱦ,�ƻ���̬����[2,3]��������ũҵ��ʡ,2017��С������ˮ���IJ�������ֱ�ռ��ʳ�����35%��38%��4%[4]��ũ������ʳ��������������,���ڴ����ũ�����ڡ���Ͷ���������Ĺ۵�,ͨ�����»���Ͷ����������������ʲ���[5]�����,����ũ����ʩ����Ϊ�Dz�ȡ��ѧʩ�ʴ�ʩ,������߷��������ʡ�������̬��������Ҫǰ�ᡣ��ǰ���о���չ��2002��2015��,�ҹ�������ʳ�������ʩ�ʳ̶Ƚ���33%��43%[6],ȫ����ʳ����������������<30%������ռ��������60%����[7],���ϴ��δ���������ն���������������������ˮ��,����Ӱ����̬ϵͳ��̬ƽ��[8]��ũ���Ǹ��ع���������,ȫ��25��Сũ���ڹ�����60%�ĸ��ص�ͬʱ,Ҳ����Ӱ������ʳ��������Դ���ĺ���̬ƽ��[9]��ũ�����ֹ�����Ҫ���ݾ���,2006��2013����μ����ܫ�ĵ��н����ʾС���ط������ֱ����102��268 kg N��hm-2��57��167 kg P2O5��hm-2��0��74 kg K2O��hm-2[10],������������ܴ�,ʩ�ʲ����������ձ鷢����������,����ʩ�ʼ��������ϼ۸������ƶȵȱ仯,ũ����ʩ�����ҲӦ����һ���ı䡣���д��ģ��ũ����������������߶�ʩ����״�Ļ���,��ָ��ũ������ʩ�ʵĹؼ�,������ʩ���ۺ�Ч��Ļ���,Ϊ��2018��������ʡ���أ��С�������֯�˴�Χ���뻧���С����Ե��ǵ�ѭ����������Ҫһ��,�������Ե���ʧ��������½�غ�ˮ����̬ϵͳ�л�Ӱ���������������ܺ����������[11]���������ǻ��Ե���ʧ�Ļ�������,ʩ��������Ե���ʧ������ع�ϵ[12]������,����������Ϊ148 kg N��hm-2ʱ,���Ե���ʧΪ33.6 kg N��hm-2,������������Ϊ279 kg N��hm-2ʱ,���Ե���ʧ�����ӵ�84.9 kg N��hm-2[13]�������о��Ļ�������������༯������䶨λ����,���Ի���ũ����������ʡ��߶�����ʳ���������Ļ������ۼ�����DZ�����о����١�����Ч���ϵ��ũ��������,�Ǿ���ǰ���뿼�ǵĺ���ָ��,��ͬ����ľ���Ч������Ͷ���������ͬ������ϴ�1990������,�ҹ���ʳ������ܳɱ��������غ������ɱ������Ӷ�����,ˮ��һֱ���ڴ����൱��С�������,���߾���Ч����ֳ������Բ���[14]��Ͷ��ɱ���,ȫ��С������ˮ����ƽ�����Ϸ�Ϊ2 191 Ԫ/hm2,ռ�ܳɱ���14%,������ʡ�ķ��Ϸѽ�С,�ֱ�Ϊ1 686��1 846��1 657 Ԫ/hm2,ռ�ܳɱ���11%��10%��7%[15]������,�����������Ʒ�г��۸�ı䶯ҲӰ��ũ���ľ������롣2012��2017���,����С������7.6%��0.17 Ԫ/kg��,����е��ҵ�ѡ��˹��ɱ��ȵ����ǵ�����С��۸�����,����ũ������Ч���½�[15]�������о�����㡿Ŀǰ���еĴ����ũ������������Ҫ�������ض�����һ����,����ʡ��߶���Ҫ��ʳ���������������Ľ��١�����,����������ʳ����͵����������Ԫ�ؽ���ʵ�ʵ���,���ڲ���������ڷʽڱ���ЧDZ��,�Ծ�ʩ�ʡ���Դ��Ч����̬�����Ѻþ�����Ҫ���塣�������Ĺؼ����⡿���о�����2018��������ʡ��֯�Ĵ��ģʵ�ص���,ͨ�����ֽ�ũ����Ҫ��ʳ���������IJ�����ʩ��״��������DZ�������������뾭��Ч�����۷���,���ڸ�ȷ������ũ��������Ϊ��Ϊ�ڱ�������Ч��ũҵ�ɳ�����չ�ṩ��ѧָ����1 �����뷽��
1.1 ��������ſ�
����ʡλ���ҹ�������,�ϱ���880 km��������160��490 km,�������301��hm2����������,�ɱ����Ͻ��ι���Ϊ�´���ů�´��ͱ����ȴ�,��������½������������ƽ�����½���8��16��,��ƽ����ˮ������275��1 270 mm,��Ҫ������7��9�·ݡ�1.2 ũ������
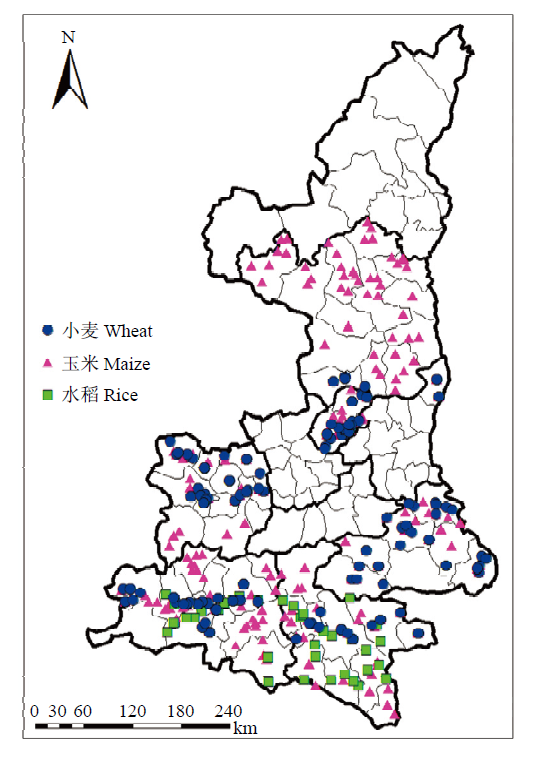
2018��10��12��������ʡ���أ��С������Ե�����ֲ���666.7 hm2���ϵ��������뻧��ʽ��չ�������С�ÿ��ÿ������ѡ��10����ֲ����ḻ,������ǿ�ĵ���ũ�����е���,һ��һ���������ʾ���ָ������������͡�����������ֲ������������ۼ۸������͡��������������ֺ�����ʩ��ʱ�ڵȡ��˴ε��л�õ���Ч�ʾ�����2 156��,����ũ��Ʒ����ʳ���С�����ס�ˮ�������`�ӡ������������ϡ��߲ˡ����̵�,���������в衢ɣ��������ҩ�ĵȡ����о���������ʳ����Ϊ�о�����,�������ֱ�Ϊ��С��312�ݡ�����514�ݡ�ˮ��150��,����976��,���������ֲ���ͼ1��ͼ1
 �´��ڴ�|����ԭͼZIP|����PPT
ͼ1���еص�ֲ�ͼ
Fig. 1Distribution of the survey sites
1.3 �����ּ���
����ũ��С��IJ�������1 800��7 500 kg��hm-2,90%��ũ������������2 700��6 375 kg��hm-2���Բ����ĵ�5%��λ����2 700 kg��hm-2����95%��λ����6 450 kg��hm-2��Ϊ��ͺ�������3 750 kg��hm-2��,Ȼ���ԵȲ�����ࣨ1 250 kg��hm-2���ֳɵͲ����в��߲�3����Χ��С�����ˮƽ�ӵ͵�������Ϊ<3 950 kg��hm-2���Ͳ���,3 950��5 200 kg��hm-2���в���,>5 200 kg��hm-2���߲��������Ʒ������ֵ����ײ���ˮƽ����Ϊ<6 750 kg��hm-2���Ͳ���,6 750��9 000 kg��hm-2���в���,>9 000 kg��hm-2���߲���;ˮ������Ϊ<7 400 kg��hm-2���Ͳ���,7 400��8 800 kg��hm-2���в���,>8 800 kg��hm-2���߲�������1����Table 1
��1
��1��Ҫ��ʳ���������ʩ����
Table 1
| ���� Crop | ����ˮƽ Yield level | �ȼ���Χ Yield range (kg��hm-2) | ������ Sample amount | ���� Yield (kg��hm-2) | ʩ���� N rate (kg N��hm-2) | ʩ���� P rate (kg P2O5��hm-2) | ʩ���� K rate (kg K2O��hm-2) |
|---|---|---|---|---|---|---|---|
| С�� Wheat | �Ͳ� Low | <3950 | 100 | 3227c | 152b | 112a | 35a |
| �в� Mid | 3950-5200 | 103 | 4534b | 183a | 95a | 35a | |
| �߲� High | >5200 | 109 | 5846a | 193a | 99a | 42a | |
| ƽ�� Mean | �� | �� | 4573 | 177 | 102 | 37 | |
| ���� Maize | �Ͳ� Low | <6750 | 224 | 5327c | 237a | 85c | 42b |
| �в� Mid | 6750-9000 | 178 | 7688b | 257a | 107b | 43b | |
| �߲� High | >9000 | 112 | 10715a | 251a | 132a | 64a | |
| ƽ�� Mean | �� | �� | 7319 | 247 | 103 | 47 | |
| ˮ�� Rice | �Ͳ� Low | <7400 | 24 | 6446c | 218a | 63b | 59a |
| �в� Mid | 7400-8800 | 55 | 7878b | 178b | 102a | 55a | |
| �߲� High | >8800 | 71 | 9339a | 182b | 86ab | 73a | |
| ƽ�� Mean | �� | �� | 8340 | 186 | 88 | 64 |
�´��ڴ�|����CSV
1.4 ����ʩ�ʼ�Сũ��ʩ�ʵȼ����۷���
ʩ�ʵ�Ŀ�IJ�����ʹ����߲�,������������������ά�ֻ�������������ˮƽ��,����������������ֵ�����,�����������ƽ����Ƽ�����ȷ����ͬ�����ȼ��ĺ���ʩ����[16,17]��ʽ��,����Ϊ����ũ����ʵ�ʲ���;����������ָС������ˮ���İٹ��������������������ܻ�������Ϊ���ص�Ӱ��,������������������������,����������С�����������ֱ�Ϊ2.8 kg N��hm-2��0.7 kg P2O5��hm-2��2.4 kg K2O��hm-2[18];���ֱ�Ϊ1.74 kg N��hm-2��0.32 kg P2O5��hm-2��1.53 K2O��hm-2[19,20,21];ˮ���ֱ�Ϊ1.71 kg N��hm-2��0.34 kg P2O5��hm-2��1.84 kg K2O��hm-2[22]������ϵ��ָ�����о������������ֹ�Ӧ����ȷ���ĵ���ʩ�������ߵ͵IJ���,�������������ͼصĵ���ϵ���ֱ�Ϊ1.0��1.5��0.3[16]��
����ũ��ʩ�ʵȼ����۷����,�Ժ���ʩ������40%Ϊ���,ʩ�ʵȼ��ӵ͵�������Ϊ0��0.8 Rec�����㣩;0.8��1.2 Rec�����У�;>1.2 Rec����������
1.5 ���ݼ���
1.5.1 ���Ե���ʧ���Ĺ��� ��ʳ��������ϵͳ��,��ѧ���ʵ�ʩ�õ���N2O�ŷš�NH3�ӷ��Լ�NO3-�����ǻ��Ե���Nr����ʧ����Ҫ;��,���о�����CUI��[9]������������ľ���ģʽ,��N2O�ŷš�NH3�ӷ��Լ�NO3-����֮������Ե���ʧ��N2O�ŷţ�kg N��hm-2����
NH3�ӷ���kg N��hm-2����
NO3-���ܣ�kg N��hm-2����
ʽ��,N��ʾ��ѧ����������kg N��hm-2�������Ե���ʧǿ��Ϊ���Ե���ʧ��������ı�ֵ��
1.5.2 ����Ч��Ĺ��� ����ũ�������������е�ԭ�ϡ���ֲ��ũ�ʺ�����������гɱ���Ч�����,
����������ʳ����ľ���Ч�������
ʽ��,Ͷ��ķ��ϰ������Ϊ���ʷʡ����Ϸʺ��л���,���ʷ��д����طʵ��۷ֱ�Ϊ3.8��4.5��5.8Ԫ/kg,���Ϸʵ���Ϊ3.0Ԫ/kg,��Ʒ�л���Ϊ1.36Ԫ/kg,ũ�ҷ�Ϊ0.3Ԫ/kg;С������ˮ�������ӷѷֱ�Ϊ954��974��892Ԫ/hm2;ũҩ�ѷֱ�Ϊ279��212��197Ԫ/hm2;��е��ҵ�ѷֱ�Ϊ2 376��1 607��2 080Ԫ/hm2���������ݾ���Դȫ��ũ��Ʒ�ɱ������ࣨ2018��)[15]��
1.6 ���ݴ�����ͳ�Ʒ���
���ڷ�������,���ʷʰ������ֺ��������㡢���Ϸʰ���ʵ�ʵ����¼ֵ���㡢�л��ʰ��ա��й��л�������־������,���ۺϵĴ�����������ʾ�����ݲ���Microsoft Excel 2010���л��ܡ����㡢����;����IBM SPSS Statistics 22.0���е����ط���;����SigmaPlot 12.5��������Է���;����ArcMap 10.5��Origin 9.1��ͼ��2 ���
2.1 ��Ҫ��ʳ����IJ�����ʩ����״
����ũ�������������������������1����С������ˮ����ƽ�������ֱ�Ϊ4 573��7 319��8 340 kg��hm-2,С���и߲���ȵͲ���ֱ��41%��81%;���ֱ��44%��101%;ˮ���ֱ��22%��45%��3�����ﲻͬ������������������������С��ĵ��طʷֱ�Ϊ177 kg N��hm-2��102 kg P2O5��hm-2��37 kg K2O��hm-2,�߲���ĵ��������ȵͲ�������27%,���еͲ�����ط���������������;���ĵ��طʷֱ�Ϊ247 kg N��hm-2��103 kg P2O5��hm-2��47 kg K2O��hm-2,�߲�����ط��������в���ֱ�����23%��49%,�ȵͲ���ֱ�����55%��52%,������������������;ˮ���ĵ��طʷֱ�Ϊ186 kg N��hm-2��88 kg P2O5��hm-2��64 kg K2O��hm-2,�и߲���ȵͲ��鵪�������ֱ����18%��17%,�������ֱ�����62%��37%,�ط��������������졣�ɴ˿ɼ�,С��߲���ĵ��ʱ�ƽ��ֵͶ��ϸ�,���߲�����ʽϸ�,ˮ���߲���δ���ӷ���Ͷ�롣��ʳ���������ķ����������Ϊ,�����Ե��ʷ�Ϊ��,�ط��Ը��Ϸ�Ϊ������2��������С������ˮ��,���ʷʷֱ�ռ������Ͷ���48%��61%��56%;���Ϸʷֱ�ռ����Ͷ���67%��64%��57%,ռ�ط���Ͷ���66%��60%��70%����������Ͷ����,���ʷ���Ҫ�ǵ���,�ʴ�֮,�ط�����;���Ϸ����ط�Ϊ��,���ʴ�֮;�л��ʵ����ֹ�Ӧ���ܵ͡���ʳ����������ʩ�ʷ�ʽ����Ϊ,�����Ի�ʩΪ��,С��ĵ��ʻ���Ϊ8�s1,����Ϊ7�s5,ˮ��Ϊ5�s2;�طʶ��Ի�ʩ��ʽʩ�á�
Table 2
��2
��2�������ࡢ�����������
Table 2
| ���� Crop | ���� ���� Fertilizer type | ���� Nitrogen fertilizer | �� Phosphorus fertilizer | �ط� Potassium fertilizer | |||||||||
|---|---|---|---|---|---|---|---|---|---|---|---|---|---|
| ���� Basal fertilizer (kg N��hm-2) | �� Top-dressing (kg N��hm-2) | �ܺ�All | ���� Basal fertilizer (kg P2O5��hm-2) | ��Top-dressing (kg P2O5��hm-2) | �ܺ�All | ���� Basal fertilizer (kg K2O��hm-2) | ��Topdressing (kg K2O��hm-2) | �ܺ�All | |||||
| ƽ��Average | ����Ratio (%) | ƽ��ֵAverage (kg P2O5��hm-2) | ����Ratio (%) | ƽ��ֵAverage (kg K2O��hm-2) | ����Ratio (%) | ||||||||
| С��Wheat | ���ʷ� ECF | 66 | 20 | 83a | 48 | 22 | 0 | 22b | 22 | 3 | 0 | 3c | 8 |
| ���Ϸ� CF | 76 | 0.2 | 75a | 44 | 69 | 0.3 | 68a | 67 | 25 | 0.3 | 25a | 66 | |
| ��� OM | 15 | 0 | 14b | 8 | 11 | 0 | 11c | 11 | 10 | 0 | 10b | 26 | |
| �ܺ�All | 157 # | 20 & | �� | �� | 102 # | 0.3 & | �� | �� | 37 # | 0.3 & | �� | �� | |
| ����Maize | ���ʷ� ECF | 51 | 99 | 151a | 61 | 18 | 1 | 19b | 18 | 1 | 0.2 | 1c | 2 |
| ���Ϸ� CF | 68 | 4 | 72b | 29 | 62 | 4 | 66a | 64 | 23 | 2 | 28a | 60 | |
| ��� OM | 23 | 1 | 24c | 10 | 18 | 1 | 18b | 18 | 18 | 1 | 18b | 38 | |
| �ܺ�All | 142 # | 104 & | �� | �� | 97 # | 6 & | �� | �� | 44 # | 3 & | �� | �� | |
| ˮ��Rice | ���ʷ� ECF | 55 | 50 | 105a | 57 | 21 | 0 | 21b | 24 | 3 | 0 | 3c | 5 |
| ���Ϸ� CF | 54 | 3 | 56b | 30 | 48 | 2 | 50a | 57 | 43 | 1 | 44a | 70 | |
| ��� OM | 25 | 0 | 25 c | 13 | 17 | 0 | 17b | 19 | 16 | 0 | 16b | 25 | |
| �ܺ�All | 134 # | 52 & | �� | �� | 86 # | 2 & | �� | �� | 63 # | 1 & | �� | �� | |
�´��ڴ�|����CSV
2.2 ��Ҫ��ʳ���������Ͷ��ֲ�
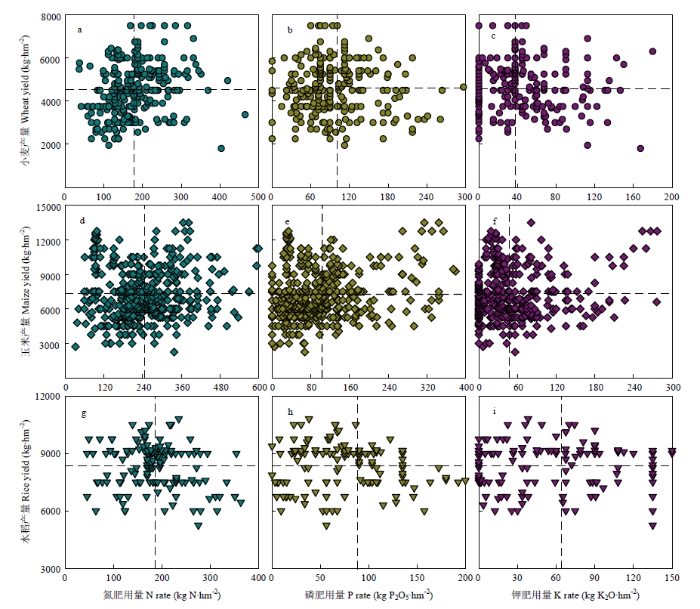
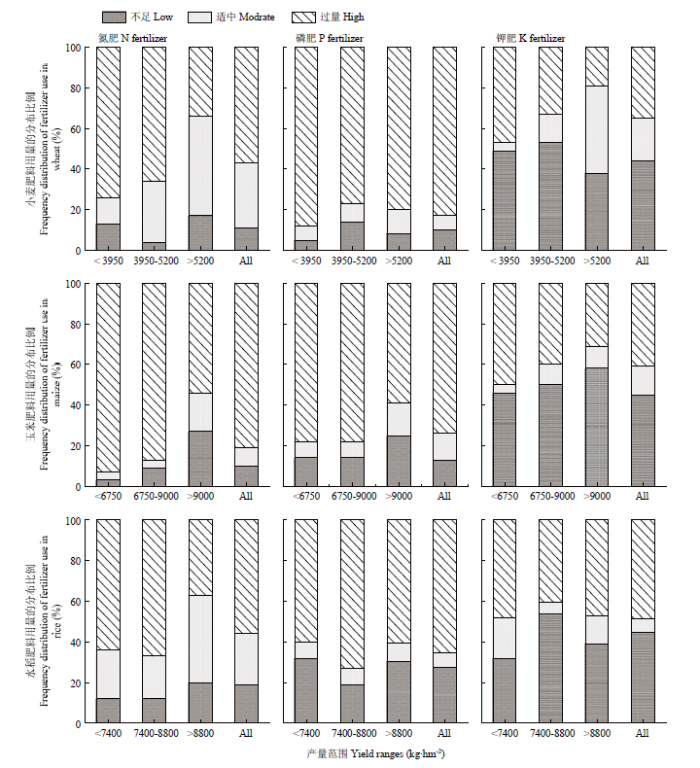
����С�������ʩ�������֣�ͼ2��,��������36��465 kg N��hm-2,ƽ��177 kg N��hm-2;��0��454 kg P2O5��hm-2,ƽ��102 kg P2O5��hm-2;�ط�0��279 kg K2O��hm-2,ƽ��37 kg K2O��hm-2�����ط���������ܴ�,����ϵ������Ϊ38%��62%��112%,������ʩ������������ԡ�ͨ��������Ӧ�ķ��Ϻ�����������ʵ��ʩ������ʾ��ͼ3��,���㡢���к���ʩ����ũ������Ϊ11%��32%��57%;ʩ������Ϊ10%��7%��83%;ʩ������Ϊ44%��21%��35%��������ͬ����ˮƽũ����ʩ������֪,��������,����ʩ��ũ����74%���͵�34%������ʩ��ũ����13%���ӵ�49%,����ʩ��ũ����47%���͵�19%������ʩ��ũ����4%���ӵ�43%,����ʩ��ũ����Ȼռ77%��88%,�������仯��ͼ2
 �´��ڴ�|����ԭͼZIP|����PPT
ͼ2С������ˮ���IJ�����ʩ������ϵ
ͼ�к����߷ֱ����С������ˮ����ƽ������,�����߷ֱ�������طʵ�ƽ������
Fig. 2Relationships between grain yields and N, P and K fertilizers about wheat, maize and rice
The horizontal dashed line represents yield mean value of wheat, maize and rice. The vertical dashed line represents N rate, P rate and K rate used by local farmers, respectively
ͼ3
 �´��ڴ�|����ԭͼZIP|����PPT
ͼ3С������ˮ��������Ͷ��ֲ�ͼ
Fig. 3Distribution of nutrient inputs in wheat, maize, and rice
���������֣�ͼ2��,��������Ϊ32��695 kg N��hm-2,ƽ��247 kg N��hm-2;������Ϊ0��606 kg P2O5��hm-2,ƽ��103 kg P2O5��hm-2;�ط�����Ϊ0��324 kg K2O��hm-2,ƽ��47 kg K2O��hm-2�����ط���������ܴ�,����ϵ������Ϊ45%��86%��126%,������ʩ������������ԡ�ͨ��������Ӧ�ķ��Ϻ�����������ʵ��ʩ������ʾ��ͼ3��,���㡢���к���ʩ����ũ������Ϊ10%��9%��81%;ʩ������Ϊ13%��13%��74%;ʩ������Ϊ45%��14%��41%��������ͬ����ˮƽũ����ʩ������֪,��������,����ʩ��ũ����93%���͵�54%������ʩ��ũ����4%���ӵ�19%,����ʩ��ũ����50%���͵�31%������ʩ��ũ����4%���ӵ�11%,����ʩ��ũ����Ȼռ59%�� 78%,�������仯��
����ˮ�����֣�ͼ2��,��������Ϊ45��405 kg N��hm-2,ƽ��186 kg N��hm-2;������Ϊ0��465 kg P2O5��hm-2,ƽ��88 kg P2O5��hm-2;�ط�����Ϊ0��345 kg K2O��hm-2,ƽ��64 kg K2O��hm-2�����ط���������ϵ������Ϊ37%��82%��95%,������ʩ������������ԡ�ͨ��������Ӧ�ķ��Ϻ�����������ʵ��ʩ������ʾ��ͼ3��,���㡢���к���ʩ����Сũ������Ϊ19%��25%��56%;ʩ������Ϊ28%��7%��65%;ʩ������Ϊ45%��7%��48%��������ͬ����ˮƽũ����ʩ������֪,��������,����ʩ��ũ����64%���͵�37%������ʩ��ũ����24%���ӵ�43%,����ʩ��ũ��ռ60%��73%,����ʩ��ũ��ռ40%��48%���������仯����������,С������ˮ�����ʹ���ʩ��������ء��ر�����,���طʹ����벻�����档����ʩ�ʵ�ռ�������ˮƽ����߶����ӡ�
2.3 ����DZ���뻷������
�Ƚ�ũ��ʵ��ʩ���������ʩ�������֣���3��,���ٷ���Ͷ���DZ������ʳ��������Ͳ���ˮƽ���졣����С��,���ط������ɷֱ����41%��90 kg N��hm-2����59%��68 kg P2O5��hm-2����59%��48 kg K2O��hm-2��������,������Ҫ����Ϊ�͡��в�ũ�����Ͳ�ũ���ĵ��طʵļ����ֱ�Ϊ48%��72%��66%,�в�ũ���ļ����ֱ�Ϊ40%��58%��63%����������,���ط������ɷֱ����55%��153 kg N��hm-2����73%��97 kg P2O5��hm-2����66%��67 kg K2O��hm-2������ʩ���ϵ���Ҫ����Ϊ�Ͳ���ũ��,���طʼ����ֱ�Ϊ63%��75%��70%������ˮ��,���ط������ɷֱ����38%��86 kg N��hm-2����64%��76 kg P2O5��hm-2����58%��64 kg K2O��hm-2������ʩ���ϵ���Ҫ����Ϊ�Ͳ�ũ��,���طʼ����ֱ�Ϊ60%��63%��63%���ɴ˿ɼ�,��ʳ�����ʩ���ϵ���Ҫ����Ϊ�Ͳ�ũ��,����DZ�����,�����طʴ�֮��Table 3
��3
��3С������ˮ���ļ���DZ���뻷������
Table 3
| ���� Crop | ����ˮƽ Yield level | ���� Yield (kg��hm-2) | ���ʹ��� Excessive N rate (kg N��hm-2) | �ʹ��� Excessive P rate (kg P2O5��hm-2) | �طʹ��� Excessive K rate (kg K2O��hm-2) | ���Ե���ʧǿ�� Nr losses intensity | |||||||
|---|---|---|---|---|---|---|---|---|---|---|---|---|---|
| FPex | Rec | % | FPex | Rec | % | FPex | Rec | % | ƽ��ֵ Mean (kg N��t-1) | % | |||
| С�� Wheat | �Ͳ�Low | 3227 | 174 | 90 | 48 | 122 | 34 | 72 | 68 | 23 | 66 | 8.5 a | 33 |
| ����Mid | 4534 | 212 | 127 | 40 | 113 | 48 | 58 | 88 | 33 | 63 | 6.8 b | 24 | |
| �߲�High | 5846 | 255 | 164 | 36 | 112 | 61 | 46 | 104 | 42 | 60 | 5.6 c | 16 | |
| ƽ��Mean | 4573 | 218 | 128 | 41 | 116 | 48 | 59 | 81 | 33 | 59 | 6.9 | 26 | |
| ���� Maize | �Ͳ�Low | 5327 | 248 | 93 | 63 | 106 | 26 | 75 | 81 | 24 | 70 | 4.8 a | 50 |
| ����Mid | 7688 | 279 | 134 | 52 | 131 | 37 | 72 | 96 | 35 | 64 | 3.5 b | 43 | |
| �߲�High | 10715 | 359 | 186 | 48 | 196 | 51 | 74 | 153 | 49 | 68 | 2.6 c | 31 | |
| ƽ��Mean | 7319 | 280 | 127 | 55 | 132 | 35 | 73 | 101 | 34 | 66 | 3.8 | 45 | |
| ˮ�� Rice | �Ͳ�Low | 6446 | 276 | 110 | 60 | 90 | 33 | 63 | 96 | 36 | 63 | 4.7 a | 38 |
| ����Mid | 7878 | 206 | 135 | 34 | 131 | 40 | 69 | 114 | 43 | 62 | 3.3 b | 19 | |
| �߲�High | 9339 | 239 | 160 | 33 | 118 | 48 | 59 | 122 | 52 | 57 | 2.7 c | 4 | |
| ƽ��Mean | 8340 | 229 | 143 | 38 | 119 | 43 | 64 | 110 | 46 | 58 | 3.3 | 18 | |
�´��ڴ�|����CSV
��ʳ���������Ļ�����������������Ͳ���ˮƽ���졣С������ˮ���Ļ��Ե���ʧǿ�ȷֱ�Ϊ6.9��3.8��3.3 kg N��t-1��������ͬ�������֪,���Ե���ʧǿ����������Ӷ��������͡���Ͳ������,�в���С������ˮ���Ļ��Ե���ʧǿ�ȷֱ�20%��27%��30%,�߲���ֱ���34%��46%��43%��ͨ������ʩ������Ӧ�Ļ��Ե���ʧǿ�������������ʧDZ������3������һ���������ٻ��Ե���ʧǿ�ȵ�DZ����֪,�е߲���С������ˮ���ļ���DZ���ֱ�Ϊ16%��33%��31%��50%��4%��38%������,�в���Ļ��Ե���ʧ����DZ���ֱ�Ϊ24%��43%��19%���ɴ˿ɼ�,���ٻ��Ե���ʧ�Ĺؼ��ڵͲ���,�����������ر���С��
2.4 ������
��ʳ���������ľ���Ч������������Ͳ���ˮƽ���죨��4��������С������ˮ������,��Ͷ��ֱ�Ϊ5 443��5 013��4 928 yuan/hm2,����Ͷ��ֱ�ռ��Ͷ���33%��44%��36%���ܲ����ֱ�Ϊ9 953��14 104��24 947 Ԫ/hm2����������ľ���Ч��ֱ�Ϊ4 468��9 091��20 020 Ԫ/hm2,��ͬ��������������;������Ч�ֱ�Ϊ4 919��10%����9 905��9%����20 543��3%��Ԫ/hm2����Ͳ������,С������ˮ���߲������Ͷ��ֱ�������6%��19%��5%,�ܲ����ֱ�����32%��26%��12%������Ч��ֱ�����459%��128%��52%��������ˮ�����,С�����Ͷ��ֱ�������9%��11%,�ܲ���ȴ�ֱ������42%��151%,���¾���Ч��ֱ������50%��78%�������ʾ,�Ż�����������ʩ�ʷ�ʽ����������ʩ�ʽṹ�����������������߾���Ч��ĺ���;��֮һ��Table 4
��4
��4С������ˮ���ľ���Ч��
Table 4
| ���� Crop | �����ȼ� Yield level | �ܲ��� Output (yuan/hm2) | Ͷ�� Input (yuan/hm2) | ����ռ��Ͷ�� Fertilizer/ total (%) | ����Ч�� Benefit (yuan/hm2) | ������ЧBenefit increase | ||||
|---|---|---|---|---|---|---|---|---|---|---|
| ���ʷ� ECF | ���Ϸ� CF | �л��� OM | ��Ͷ�� Total | (yuan/hm2) | (%) | |||||
| С�� Wheat | �Ͳ�Low | 6675c | 338 | 1134 | 231 | 5339b | 32 | 1336c | 1984c | 49 |
| ����Mid | 10059b | 546 | 1096 | 85 | 5335b | 32 | 4595b | 5036b | 10 | |
| �߲�High | 13126a | 434 | 1543 | 51 | 5655a | 36 | 7472a | 7737a | 4 | |
| ƽ��Mean | 9953 | 439 | 1258 | 122 | 5443 | 33 | 4468 | 4919 | 10 | |
| ���� Maize | �Ͳ�Low | 10065c | 664 | 888 | 327 | 4671b | 40 | 5395c | 6311c | 17 |
| ����Mid | 14413b | 807 | 1016 | 212 | 4828b | 42 | 9585b | 10416b | 9 | |
| �߲�High | 17834a | 426 | 2107 | 216 | 5541a | 50 | 12293c | 12989a | 6 | |
| ƽ��Mean | 14104 | 632 | 1337 | 252 | 5013 | 44 | 9091 | 9905 | 9 | |
| ˮ�� Rice | �Ͳ�Low | 19908b | 616 | 416 | 583 | 4784a | 34 | 15124b | 15808b | 5 |
| ����Mid | 26905a | 545 | 1038 | 217 | 4969a | 36 | 21936a | 22444a | 2 | |
| �߲�High | 28028a | 446 | 1281 | 135 | 5030a | 37 | 22999a | 23378a | 2 | |
| ƽ��Mean | 24947 | 536 | 912 | 312 | 4928 | 36 | 20020 | 20543 | 3 | |
�´��ڴ�|����CSV
3 ����
3.1 ũ����ʳ�����IJ���������Ͷ�����
����2018���976��ũ���������ݿ�֪,����ʡ��С������ˮ��ƽ�������ֱ�Ϊ4 573��7 319��8 340 kg��hm-2��С������Ը���2011��2015����μ����ܫ���н����4 243 kg��hm-2��[16];���ײ�������2013��2016����μ����ܫ���н����6 000 kg��hm-2��[23];ˮ����������2006��2009�����ذ�ɽ�����н�� ��7 822 kg��hm-2��[24]���ܵ�����,��ʳ�����������������,������Ӧ����ʳ���������ӡ�����������ٴ�������ս������ʩ������֪,ũ����ʳ��������Ͷ����ࣨ152��257 kg N��hm-2�����ʴ�֮��63��132 kg P2O5��hm-2�����طʽ��٣�35��73 kg K2O��hm-2�����Ի�����[25] 2009��2012�����μ����ܫ��С�������ĵ��ط������ֱ�Ϊ195 kg N��hm-2��128 kg P2O5��hm-2��35 kg K2O��hm-2,Ҳ���ֳ��ߵ������ס��ͼص�����ʩ������������������Ҫ��ʩ֮һ,Ȼ�����о��������������������δ�����������,ˮ���߲���ĵ��������������ڵͲ��顣������,�����ŷ��ϼ۸��½����ر�������[26],ũ��Ϊ��ø߲�,���ڹ���ʩ�û��ʵ����������ֲ�������[27]���ҹ�ũ������ӯ����������,HUANG��[28]�����ҹ�ũ�ﵪ������ӯ��2.8��6.6 Tg��a-1,����ӯ��4.1 Tg��a-1[29],���س���2.9��3.9 Tg��a-1[30]�������д���������ӯ���ƻ���ʩ����������������ع�ϵ,�ڽ�ˮ���ٵ������ʩ�����������������������[31]������,���ط�ʩ�ñ�������������ƽ��,Ҳ�ǵ�������Ͷ��߲���ȴ���ߵ���Ҫԭ����,���й��̻����ּ���û��ũ��ʩ����Ԫ�ط���,����ũ�������Ҫ�Ե���ʶ�����йء�
����������Դ��ʩ�ʷ�ʽ��֪,48%��61%�ĵ������Ե��ʵ���,57%��67%���ʺ�60%��70%�ļط����Ը��Ϸʡ�С��ĵ��ʻ���Ϊ8�s1,����Ϊ7�s5,ˮ��Ϊ5�s2,�ط��Ի���һ����ʩ��Ϊ���������ũ�������Ը��Ϸʺ͵��ʵ���Ϊ��,ʩ�������ʵ��ʡ�ͨ����Ϊ,С��ĵ��ʻ�����2�s1Ϊ��,����ˮ����1�s2��2�s3�Ϻ���[32,33,34]��ũ���Ļ��ʱ���ƫ�ߡ���ƫ��,����ؼ�ԭ��������������ˮ�١����ȱ�����ʲ����й�[35]�����о���ʩ�����������δ�������������,ͬһʩ��ˮƽ����������е��иߡ���������Ƕ����ع�ͬ���õĽ��,����������������,����������ͺ�ʩ�ʷ����й�[35]����ϵ��н��,����ʡСũ����ʳ���������д����ŵ�����ʩ�ù���,�طʹ����벻�㲢��,�ػ�ʩ����ʩ,�ػ��ʡ����л��ʵ��ձ������Ż�����������ʩ�÷�����Ӧ���л�����ʩ[36]���������Ϸʵ��ر����ȴ�ʩ���ڴ�ʡ��߶��ϸ���ʩ�ʲ����������ģ���������ѵ��������ı�ʾ����չʾ,�������ũ����ũҵ֪ʶ�����Լ��Ƽ�Ӧ��,����ũҵ�ɳ�����չ��
3.2 ũ����ʳ���������ļ��ʡ�����DZ��������Ч��
��������ʳ����������Ҫ��������Դ,Ȼ��ʩ�õķ�������δ���������ս���������������ʧ����������ϵͳ���������[37]��ˮ��[38]�Ϳ�����Ⱦ[3]�������⡣���,����ʩ����״������DZ������ʳ�����ͻ�����ȫ�����ش��о������ʾ��ʩ�ʹ�����������ʳ���������ļ�����DZ���ֱ���33%��63%��46%��75%��57%��70%,����DZ������3������һ������������ķ�����������,�еͲ�������ĵ�������ռ��Ϊ64%��93%,������������ռ��60%��88%,�����ļط�����ռ��Ϊ33%��50%��ͼ3��,����ζ�ż��ʵ��ص����еͲ����ũ����ͬʱ������������뵪�ط�����������������,����ũ������DZ����,����������̬��������������С������ˮ��,���ӻ����ʩ�ʲ�����������������Ҫԭ��ũ�������ؾ�Ӫ������,ͨ����Ϊ��Ͷ����������ǻ�ø߲�����Ҫ����[39],��֮���ʲ������г�����������۸�ƫ��[40],�ǹ���ʩ�ʵ���Ҫԭ�����������Է����ɿ�ѧָ����������[41],Ȼ���ҹ�������Ƭ���̶ȸ�,ÿ������ƽ��0.1 hm2[42],���ģ�������ƶ���ѧ��ʩ����,ʱ������Ѷȴ�,ͬʱ���ǵ��ؿ������������������,������Ϊ�����������ƽ���Ƽ�����ͨ������������ȷ��ʩ�������Ϊʵ�ʡ�����,ũ�������ײ�����5 000��7 000 kg��hm-2,���ݺ���ʩ���������Ƽ��ĵ�������Ϊ87��122 kg��hm-2,�Ƽ���������Ϊ24��34 kg��hm-2,�Ƽ��ļط�����Ϊ23��32 kg��hm-2,ʵ�ʵķ�������ũ���ɸ��ݶ���ľ����������������ͬ������Ļ���ЧӦ��֪,��ʳ�����������Ե���ʧ����DZ��Ϊ4%��50%,�߲���ļ���DZ�����ͣ���3�������ܸ߲���ͨ���иߵķ���Ͷ����,���䵪�������ʽϸ�,�ʻ��Ե���ʧǿ�ȱȵͲ�����������34%��46%��WANG��[43]�ڸ�����ҴҲ���ֵ�����������140 kg N��hm-2��ߵ�221 kg N��hm-2ʱ,��δ���ӵ�λ�����Ļ��Ե���ʧ�����ɴ˿ɼ�,��һ����Χ�����ӵ�������������������,����һ������Ե���ʧǿ��,��˵����Ч��ߵ�������Ч������������ʵ��˫Ӯ����Ҫ���ϡ�����,��ͬ�������͵Ļ��Ե���ʧǿ�Ȳ���ϴ�,С��Ļ��Ե���ʧ������ˮ����1.8��2.1������3��,����Ҫ������С��͵IJ����Լ��ߵ����������ʺ������ܵ�����,ͨ�������ۺϵ�����-�������ϵͳ���߲������������ֲ�����Ǽ��ٻ��Ե���ʧ����Ҫ;��֮һ��CUI��[9]֤ʵӦ���ۺϵ�����-�������ϵͳ�ڼ��ٵ�������15%��18%��ͬʱ,������ʳƽ������11%��12%,���ٵ���ʧ13%��22%����ͬ�������ͺͲ������,����Ч�����������ˮ���ľ���Ч��ΪС������2.7��4.0��,�ߵĵ����͵����������������Ҫԭ��[14]��Ȼ��������������������,����ʡˮ����ֲ��Ҫ���������ϵIJ��ֵ���,��˷���������С�������Ч���DZ�Ҫ�ġ����������,С��ľ������������50%��С����Ϊ����ʡ��������ʳ����֮һ,��2000��2017�����ֲ���������31%��47.4��hm2��,����ֻ�����7%��30��t��[15]��ͬʱ�����г���������,С��۸���ڡ��컨�塱�ⶥ,�����ɱ�ȴ�ڡ��ذ�ʽ������,ѹ����С����������ռ�[44,45],�Ӷ�����С��ľ�������������ס���ͨ������֧�֡������ȴ�ʩ����С����ֲ��������С���ܲ��͵���,�Ӷ����С�������ľ���Ч�档
4 ����
���о�����2018��976�ݵ�������,ϵͳ��������ʳ���������IJ�����ʩ����״,���ʡ�����DZ��������Ч�档С������ˮ����ƽ�������ֱ�Ϊ4 573��7 319��8 340 kg��hm-2,ƽ��ʩ�����ֱ�Ϊ177��247��186 kg N��hm-2,ƽ��ʩ�����ֱ�Ϊ102��103��88 kg P2O5��hm-2,ƽ��ʩ�����ֱ�Ϊ37��47��64 kg K2O��hm-2,�����뵪�ط�����������������ԡ�������������̬��������������������ʳ����,���ӻ����ʩ�ʲ�����������������Ҫԭ��,��ũ������DZ���ͻ��Ե�����DZ��������ʡ��Ҫ��ʳ����������ͼطʵ�DZ���ֱ�Ϊ33%��63%��46%�� 75%��57%��70%,�����Ե���ʧDZ��Ϊ4%��50%��С������ˮ�������ľ���Ч��ֱ�Ϊ4 468��9 091��20 020 yuan/hm2�����о��Ӽ��ʽڱ���Ч����Ϊ������,����Ե��в���ũ��Ϊ���ʼ����������������ص�,3��������ɷֱ���ٵ��ط�45%��65%��61%,�Ӷ�����26%��45%��18%�Ļ��Ե���ʧ,���10%��9%��3%�ľ���Ч�档�ο����� ԭ��˳��
������ȵ���
������������
�����ڿ�Ӱ������
DOI:10.1038/4351179aURLPMID:15988514 [��������: 1]
[��������: 1]
DOI:10.1890/14.WB.007URL [��������: 2]
[��������: 1]
[��������: 1]
DOI:10.3390/su11020543URL [��������: 1]
[��������: 1]
[��������: 1]
[��������: 1]
[��������: 1]
DOI:10.5194/acp-15-13849-2015URL [��������: 1]
DOI:10.1038/nature25785URLPMID:29513654 [��������: 3]

Sustainably feeding a growing population is a grand challenge, and one that is particularly difficult in regions that are dominated by smallholder farming. Despite local successes, mobilizing vast smallholder communities with science- and evidence-based management practices to simultaneously address production and pollution problems has been infeasible. Here we report the outcome of concerted efforts in engaging millions of Chinese smallholder farmers to adopt enhanced management practices for greater yield and environmental performance. First, we conducted field trials across China's major agroecological zones to develop locally applicable recommendations using a comprehensive decision-support program. Engaging farmers to adopt those recommendations involved the collaboration of a core network of 1,152 researchers with numerous extension agents and agribusiness personnel. From 2005 to 2015, about 20.9 million farmers in 452 counties adopted enhanced management practices in fields with a total of 37.7 million cumulative hectares over the years. Average yields (maize, rice and wheat) increased by 10.8-11.5%, generating a net grain output of 33 million tonnes (Mt). At the same time, application of nitrogen decreased by 14.7-18.1%, saving 1.2 Mt of nitrogen fertilizers. The increased grain output and decreased nitrogen fertilizer use were equivalent to US$12.2 billion. Estimated reactive nitrogen losses averaged 4.5-4.7 kg nitrogen per Megagram (Mg) with the intervention compared to 6.0-6.4 kg nitrogen per Mg without. Greenhouse gas emissions were 328 kg, 812 kg and 434 kg CO2 equivalent per Mg of maize, rice and wheat produced, respectively, compared to 422 kg, 941 kg and 549 kg CO2 equivalent per Mg without the intervention. On the basis of a large-scale survey (8.6 million farmer participants) and scenario analyses, we further demonstrate the potential impacts of implementing the enhanced management practices on China's food security and sustainability outlook.
[��������: 1]
[��������: 1]
DOI:10.3864/j.issn.0578-1752.2016.03.009URL [��������: 1]
It is in general thought that nitrogen (N) fertilizer is overused in Chinese croplands and that the overuse has resulted in severe environmental problems. As the biggest reactive nitrogen producer and N fertilizer consumer in the world, China is facing a great challenge to reduce nitrogen consumption in agriculture. The objectives of this review are to examine the sources and fate of reactive nitrogen in agroecosystems, to find out why N fertilizer consumption reaches such a high level, and provide with suggestions for better N management practices. To understand the current agricultural use of reactive N in China, principles of biogeochemical N cycling are used to discuss N flows in the agroecosystems in the year 2010, with focus on N input/output and balances in crop-soil systems. At the national level, input of reactive N to croplands was excessive in 2010, and the surplus was approximately equal to the quantity of the reactive N recycled back to crop fields by atmospheric N deposition and irrigation with N-polluted water, about 5 Tg N. Generally speaking, the use of N fertilizer in cereal crops is not extraordinarily high since N fertilizer is also distributed for other uses: Forestation, feeding livestock and fishes, and application to the green fields in urban areas. It is common and significant that there are much higher N application rates to fruit tree plantations and vegetable production, especially to the greenhouse vegetable growing system, in comparison with that applied to cereal crops. With the facts of the limited arable lands, low recycling rates of organic wastes, and low input of biological fixed N, crop production has to depend heavily on the use of N fertilizer in China. There is a low acreage of arable land per capita, with 8% of global arable land feeding 20% of the world population. Recycled rate of nutrient N in the organic wastes are lower than 30% and input of biological N fixation to croplands is less than 15%. Therefore, to meet the demands of Chinese population for both food and improving diets under the condition of the predominance of the croplands with medium to low productivities, high N fertilizer input is understandable. However, N fertilizer consumption is much higher than the national average in some highly productive regions, including the Huang-Huai-Hai Plain, the Yangtze Basin, and Zhujiang Delta (Guangdong) regions, and is closely connected with higher crop yields/multiple cropping indices, and smaller proportion of legume crops to the total cropping area. It is clear that the N losses from food production-processing-consumption chain have resulted in resource wasting and environmental risks. On the other hand, part of the environment received reactive N from the losses of croplands and the other pollution sources, returns to the fields via atmospheric deposition and the irrigations with polluted waters, and becomes an important source of N input to croplands. Due to the complexity of N transformation in agroecosystems and biogeochemical N cycling, N losses are unavoidable. Therefore, the best management practices at various spatial levels should be taken as the options to reduce the fertilizer use in croplands to the minimum. Integrated measures, including multi-disciplinary researches and the cooperation of various social sectors, have been suggested to optimize N management practices at each spatial level, in order to reach the fundamental goals of maintaining/improving soil fertility, securing food, reducing nitrogen fertilizer use, and minimizing environmental risks.
DOI:10.1111/gcb.12213URLPMID:23553871 [��������: 1]
Although the goal of doubling food demand while simultaneously reducing agricultural environmental damage has become widely accepted, the dominant agricultural paradigm still considers high yields and reduced greenhouse gas (GHG) intensity to be in conflict with one another. Here, we achieved an increase in maize yield of 70% in on-farm experiments by closing the yield gap and evaluated the trade-off between grain yield, nitrogen (N) fertilizer use, and GHG emissions. Based on two groups of N application experiments in six locations for 16 on-farm site-years, an integrated soil-crop system (HY) approach achieved 93% of the yield potential and averaged 14.8 Mg ha(-1) maize grain yield at 15.5% moisture. This is 70% higher than current crop (CC) management. More importantly, the optimal N rate for the HY system was 250 kg N ha(-1) , which is only 38% more N fertilizer input than that applied in the CC system. Both the N2 O emission intensity and GHG intensity increased exponentially as the N application rate increased, and the response curve for the CC system was always higher than that for the HY system. Although the N application rate increased by 38%, N2 O emission intensity and the GHG intensity of the HY system were reduced by 12% and 19%, respectively. These on-farm observations indicate that closing the yield gap alongside efficient N management should therefore be prominent among a portfolio of strategies to meet food demand while reducing GHG intensity at the same time.
DOI:10.1016/j.jclepro.2017.05.196URL [��������: 1]
[��������: 2]
[��������: 2]
[��������: 4]
[��������: 4]
DOI:10.3864/j.issn.0578-1752.2017.14.012URL [��������: 3]
��Objective��It is of great significance to clarify the farmers’ nutrient input situation for the realization of stable yield, high yield, and high nutrient use efficiency in dryland wheat production.��Method��A 5-yr long farm survey of 1 261 farmers was carried out to analyze and evaluate their fertilizer applications and the fertilizer reduction potential in Weibei dryland, based on the nutrient requirement determined by the corresponding wheat grain yields and sustainable development of dryland wheat production.��Result��Obtained results showed the farmers’ wheat yields ranged from 750 to 9 000 kg hm-2, with the average of 4 243 kg·hm-2, and they were allocated into five groups as: very low (<2 640 kg·hm-2), low (2 640-3 780 kg·hm-2), moderate (3 780-4 920 kg·hm-2), high (4 920-6 060 kg·hm-2) and very high (>6 060 kg·hm-2), respectively, accounting for 22.0%, 22.2%, 19.3%, 22.8% and 13.6% of the total. Farmers’ nitrogen (N) application rates ranged from 33 to 454 kg N·hm-2 with an average of 188 kg N·hm-2, phosphorus (P) ranged from 0 to 435 kg P2O5·hm-2 with an average of 125 kg P2O5·hm-2, and potassium ranged from 0 to 201 kg K2O·hm-2 with an average of 19 kg K2O·hm-2. However, farmers’ yields showed no significant correlations with the N, P, and K rates, respectively. With the increase of grain yield levels, the proportion of N over application farmers decreased from 97.8% in the very low yield group to 18.0% in very high group, but that of N deficient application farmers increased from 0.7% to 45.9%, correspondingly. Similar to N, the proportion of P over application farmers decreased from 99.3% in very low yield group to 70.9% in very high yield group, and this means P over application was practiced by more than 70.0% of farmers in each yield group. Different from N and P, K deficient application was practiced by more than 60.0% of farmers in each yield group. Therefore, for N, farmers in very low and low yield groups were recommended to reduce 24-144 kg N·hm-2, 28%-73% from their high or very high N application rates, and farmers in moderate, high and very high yield groups were recommended to reduce 50-181 kg N·hm-2, 26%-51% of their high or very high N rates and add 38-134 kg N·hm-2, 41%-345% more to the low or very low N rates. For P, farmers in different yield groups should reduce 7-31 kg P2O5·hm-2, 23%-33% from the high P rates, and reduce 85-118 kg P2O5·hm-2, 61%-85% from the very high P rates. For K, farmers with no or very low K input in different yield groups were suggested to use 13-50 kg K2O·hm-2, and add 7-18 kg K2O·hm-2, 35%-78% for those with low K rates. ��Conclusion�� Compared with the conventional method, which adopted an uniform fertilization rate as the criterion to evaluate the famers’ fertilizer application with variable yields, the present work proposed a yield based approach. This approach is proved to be suitable for the small scale household farming in China, and enable to objectively and accurately understand the arbitrary and over application of fertilizer, and to provide a scientific basis for the effective regulation of farmers’ fertilizer application.
DOI:10.3864/j.issn.0578-1752.2018.15.009URL [��������: 1]
In order to obtain high crop yield and low environmental nitrogen (N) pollution risk simultaneously, identifying the optimal N application rate is one of the most effective methods. Based on the theory of optimal N application and the present situation of N fertilizer application in China, we summarized the recommended methods for optimal N rate used in current research. The existing recommended methods for optimal N rate were soil nutrient regulation during crop growth, N application effect curve, balance of N input and output, and the critical N rate based on standard nitrate-N of leaching water from farmland. The first three methods, which focused on agronomy effect firstly and then assessed its environmental effect, were for the purpose of obtaining better agronomic benefits. All of these three methods were scientific and reasonable, which had proved their application in practice. The forth method focused on environmental effect firstly and then estimates its effect on yield intending to prevent nitrate pollution of groundwater, which could quantify the actual environmental effect of optimal N application rate. However, the critical N application rate of the forth method has some uncertainty because of many influencing factors, and its variation under different years, different regions and different soil types need be further studied.
[D].
[��������: 1]
[D].
[��������: 1]
DOI:10.1016/j.fcr.2012.01.006URL [��������: 1]
The overestimation of nitrogen (N) uptake requirement under a high-yield cropping system with maize (Zen mays L.) has been a driving force in the overuse of N fertilization and environmental pollution in China. A database comprising 1246 measurements collected between 2005 and 2009 from 105 on-farm and station experiments conducted in the spring maize domains of the Northeast. Northwest of China and the North China Plain, was used to evaluate N uptake requirement in relation to grain yield. Field experiments with different maize cultivars and N management forms were also carried out to assess this relationship. Across all the sites, maize yield averaged 11.1 Mg ha(-1) which was more than twice that of the national maize grain yield average of China of 5.3 Mg ha(-1) and the world average of 4.5 Mg ha(-1). Nitrogen uptake requirement per Mg grain yield averaged 17.4 kg. Considering 6 ranges of grain yield (<7.5 Mg ha(-1), 7.5-9 Mg ha(-1), 9-10.5 Mg ha(-1), 10.5-12 Mg ha(-1), 12-13.5 Mg ha(-1) and >13.5 Mg ha(-1)), N uptake requirements per Mg grain yield were 19.8, 18.1, 17.4, 17.1, 17.0 and 16.9 kg respectively. This decreasing N uptake requirement per Mg grain yield with increasing grain yield was attributed to increasing harvest index (HI) and the diluting effects of declining grain and straw N concentrations. Grain yield increased with year of cultivar release from the 1950s to the 2000s. with N uptake requirement per Mg grain yield decreasing because of declining grain and straw N concentrations. Compared with the current commercial hybrid (ZD958), the lower N uptake requirement per Mg grain yield of the N-efficient hybrid of XY335 was attributed to a lower straw N concentration while maintaining a similarly high grain yield and grain N concentration. In neither of the years was there any evidence of leaf senescence in either optimal N rate (N-opt) or excessive N rate (N-over) and there was no significant difference between N uptake of these two treatments. This indicated that excessive N application could not delay leaf senescence to sustain further grain yield increase. (C) 2012 Elsevier B.V.
DOI:10.1016/j.fcr.2015.06.001URL [��������: 1]
DOI:10.1016/j.fcr.2013.06.006URL [��������: 1]
DOI:10.1016/j.fcr.2015.05.008URL [��������: 1]
[��������: 1]
[��������: 1]
URLPMID:24564138 [��������: 1]
In order to understand the present situation of rice fertilization and the existing problems in the farmers' nutrient resources input in the Qin-Ba mountainous area of southern Shaanxi, the survey data from 2854 households in 11 counties of this area in the project
URLPMID:24564138 [��������: 1]
In order to understand the present situation of rice fertilization and the existing problems in the farmers' nutrient resources input in the Qin-Ba mountainous area of southern Shaanxi, the survey data from 2854 households in 11 counties of this area in the project
DOI:10.11674/zwyf.2013.0409URL [��������: 1]
Ϊ��ȷ�ҹ���������С��ʩ����״�����������ض�С�������ֲ��ѡȡ3����/������4�����ũ������Ͷ����顣���������������� ��������С������Ͷ����ȣ�����Ͷ��ũ��31.7%���С� 21.0%ƫ�ߡ� 41.9%�ܸߡ� 1.7%ƫ�͡� 3.7%�ܵͣ�10.6%��ũ����Ͷ�������У�ƫ�ͺͺܵ͵ķֱ�ռ41.7%��9.6%��ƫ�ߺͺܸߵ�ռ28.3%��9.8%���ط�Ͷ�������е�ũ��ռ1.5%��ƫ�͵�2.1%���ܵ͵�88.3%��ƫ�ߵ�2.9%���ܸߵ�5.2%������ �ס� �طʵ�ƫ��������PFP���ֱ�Ϊ21.7�� 36.2��88.9 kg/kg���ڷ���Ͷ���������л��ʷֱ�ռ����������3.1%����������2.3%���ط�������53.8%��������Ͷ��ĵ���ռ96.2%����ռ100%���ط�ռ100%����Ȼ������ʩ�ù�������ƫ��Ͳ��㲢�棬�ط����Ӳ��㣬 ����ƫ�ࡢ �л���ƫ�٣� ����ƫ�ࡢ ��ƫ��������Ŀǰ��������С������Ͷ���д��ڵ���Ҫ���⡣
[��������: 1]
[��������: 1]
DOI:10.1016/S2095-3119(16)61476-4URL [��������: 1]
[��������: 1]
DOI:10.5194/essd-10-1-2018URL [��������: 1]
[D].
[��������: 1]
[D].
[��������: 1]
[D].
[��������: 1]
[D].
[��������: 1]
DOI:10.11674/zwyf.14243URL [��������: 1]
��Ŀ�ġ���ȷ����ʡС��ʩ����״,������ʡС��������Դ�������п�ѧָ������������ѡȡ2��С��������һ��һ����μ����ܫ��һ������������ƽԭ����5�����ũ��ʩ�ʵ��顣�������μ����ܫС����������꼾�併ˮ�������ֳ��Ͷ����ȵ�����,�������3473 kg/hm2; ����ƽԭ���ڲ���С������꼾�䲨����С,���5882 kg/hm2��μ�����о������ũ��ʩ������,μ��20.2%ũ��ʩ��ƫ��,43.5%�ܸ�,ʩ�������Ľ�ռ29.7%,ƫ�͵�ռ4.6%,�ܵ͵Ľ���2.0%,����ƽ������ΪN 197.6 kg/hm2; ����20.3%ũ��ʩ��ƫ��,37.5%�ܸ�,ʩ�������Ľ�ռ17.5%,ƫ�͵�ռ14.2%,�ܵ͵Ľ���10.5%,ƽ��ʩ����ΪN 199.2 kg/hm2������ʡũ����Ͷ��������������,��Ͷ��ƫ�ͺ�ƫ�߲���,μ����ƽ��Ͷ�������е�ũ��ռ12.0%,ƫ�͵�ռ41.5%,�ܵ͵�10.7%,ƫ�ߵ�26.7%,�ܸߵ�9.2%,��Ͷ��ƽ��P2O5123.4 kg/hm2; ������ƽ��Ͷ�������е�ũ��ռ14.3%,ƫ�͵�ռ27.2%,�ܵ͵�13.8%,ƫ�ߵ�31.0%,�ܸߵ�13.7%,ƽ��ΪP2O5 141.6 kg/hm2��μ����ܫС���Ͷ��ƽ��K2O 32.9 kg/hm2,����ƽԭΪK2O 37.3 kg/hm2,μ�����г���90%ũ���ط�Ͷ�벻�㡣����ʡ��С������Ͷ���Ի�ʩΪ��,ʩΪ��,μ�����ж�С����ƽ����ʩ��ΪN 189.9��185.4 kg/hm2,ռ������Ͷ���96.1%��93.1%,ʩ��N 7.7��13.8 kg/hm2,��ռ3.9%��6.9%������ʡ��С��������Ͷ���Ի���Ϊ��,�л���Ϊ��,μ�������л���Ͷ��ĵ���ƽ������N 4.7��3.1 kg/hm2,��ռȫ������Ͷ���2.4%��1.6%,P2O5ƽ��2.4��1.7 kg/hm2,ռ1.9%��1.2%,������Ͷ��ĵ��� ����Խϴ�,μ�����е���ƽ��N 192.9��196.0 kg/hm2,P2O5ƽ��120.8��139.9 kg/hm2���Ի��ʡ�μ��N�� P2O5 �� K2Oƽ��PFP(����ƫ������)�ֱ�Ϊ20.0 kg/kg�� 33.3 kg/kg��83.5 kg/kg; ����PFP�ֱ�Ϊ36.8 kg/kg�� 53.9 kg/kg��131.8 kg/kg������ʡμ����ܫ��С����������غ�̼���ũ����Ϊϲ���ĵ���Ʒ��,ƽ����55.7%��47.2%��ũ��ѡ��; ������ũ����Ϊϲ���ĵ���Ʒ��Ϊ����,��42.8%ũ��ѡ�á��ո���μ��ũ����Ϊϲ������Ʒ��,ƽ����50.2%��ũ��ʩ��; ������ũ����Ϊϲ������Ʒ��Ϊ������,��40.2%��ũ��ʩ�á����Ϸ�ʩ�������������,μ������ƽ����30.8%��40.2%��ũ��ʩ�á��л���ʩ��ũ���������������½�,μ��������2008~2009���10.0%��11.7%���ٵ�2012~2013���0.8%��0.8%�������ۡ�����ʡũ��С��ʩ�ʴ��ڵ��ʹ���,��ʩ�ù����Ͳ��㲢��,�ط����Ӳ���,�л���Ͷ��ƫ��,��ƫ�ٵ����⡣
[��������: 1]
[��������: 1]
[��������: 1]
[��������: 1]
[��������: 2]
[��������: 2]
DOI:10.13287/j.1001-9332.201804.023URLPMID:29726234 [��������: 1]
The effects of optimum nitrogen (N) fertilization rate with and without adding manure on wheat yield and leaching of residual nitrate-N in soil profile were examined in Weibei dryland, Shaanxi with a field experiment combined different N fertilization rates (0, 75, 150, 225, 300 kg N.hm(-2)) and organic manure (0 and 30 t.hm(-2)). The results showed that, compared to chemical N fertilizer, combined application of inorganic fertilizer and organic manure increased winter wheat yield by 14.7% when N fertilization rate was reduced by 27.1%. The highest yield was obtained when 150 kg.hm(-2) of N rate was combined with the manure (N150+M). The combination of N fertilizer and manure promoted N uptake of wheat grain and increased N use efficiency by 20.2%. The highest N use efficiency was recorded in the N150+M treatment. In addition, the lea-ching of residual nitrate-N during the wheat growing season and the leaching of nitrate-N during summer fallow were decreased. When N application rate was lower than 115 kg.hm(-2), N fertilizer combined with organic manure reduced the amount of nitrate-N leaching in summer fallow. We recommend the combined application of organic manure with about 150 kg.hm(-2) of N fertilizers in Weibei dryland to guarantee high winter wheat yield, N use efficiency, and reduce excessive residue of fertilizer N in the soil.
DOI:10.1126/science.1182570URLPMID:20150447 [��������: 1]
Soil acidification is a major problem in soils of intensive Chinese agricultural systems. We used two nationwide surveys, paired comparisons in numerous individual sites, and several long-term monitoring-field data sets to evaluate changes in soil acidity. Soil pH declined significantly (P < 0.001) from the 1980s to the 2000s in the major Chinese crop-production areas. Processes related to nitrogen cycling released 20 to 221 kilomoles of hydrogen ion (H+) per hectare per year, and base cations uptake contributed a further 15 to 20 kilomoles of H+ per hectare per year to soil acidification in four widespread cropping systems. In comparison, acid deposition (0.4 to 2.0 kilomoles of H+ per hectare per year) made a small contribution to the acidification of agricultural soils across China.
DOI:10.1126/science.1186834URLPMID:20150494 [��������: 1]
Population growth, arable land and fresh water limits, and climate change have profound implications for the ability of agriculture to meet this century's demands for food, feed, fiber, and fuel while reducing the environmental impact of their production. Success depends on the acceptance and use of contemporary molecular techniques, as well as the increasing development of farming systems that use saline water and integrate nutrient flows.
[��������: 1]
[��������: 1]
[��������: 1]
DOI:10.11674/zwyf.2012.12045URL [��������: 1]
Six hybrids and 13 genotypes of flue��cured tobacco were used to study the genotype difference, parent��offspring correlation and heterosis of F1 generation in their nutrient characteristics. The results showed a significant difference in biomass, root/shoot ratio, contents and absorptions of nitrogen (N), phosphorus (P) and potassium (K), chlorophyll concentration, nitrate reductase (NR) activity and root activity among different genotypes of flue��cured tobaccos in seedling stage. The contents of N, P and K in roots and N and K in shoot, dry matter accumulation, root activity and root/shoot ratio showed no significant correlations between F1 generation and the parents. There was a significant negative correlation between P content in shoots of F1 generation and mid��parent, while NR activity of F1 generation had significant positive correlation with female parent. The chlorophyll concentration of F1 generation correlated significantly with male parent, mid��parent and low��parent. The P and K contents in root, N content in shoot, NR activity, chlorophyll concentration, root activity, root/shoot ratio, dry matter accumulation of flue��cured tobacco in seedling stage had mid��parent heterosis. The P content in root, NR activity, root activity, root/shoot ratio, dry matter accumulation had over high��parent heterosis. The N content in root and P, K contents in shoots had no significant heterosis, but some cross combinations had mid��parent heterosis and over high��parent heterosis.
DOI:10.1016/j.gloenvcha.2016.08.005URL [��������: 1]
DOI:10.1007/s11104-010-0530-zURL [��������: 1]
Monitoring of drinking water has shown an increase in nitrate-nitrogen (NO3−-N) concentration in groundwater in some areas of the Heihe River Basin, Northwest China. A combination of careful irrigation and nitrogen (N) management is needed to improve N uptake efficiency and to minimize fertilizer N loss. A 2-year experiment investigated the effects of different irrigation and N application rates on soil NO3−-N distribution and fertilizer N loss, wheat grain yield and N uptake on recently reclaimed sandy farmland. The experiment followed a completely randomized split-plot design, taking flood irrigation (0.6, 0.8 and 1.0 of the estimated evapotranspiration) as main plot treatment and N-supply as split-plot treatment (with five levels of 0, 79, 140, 221, 300kg N ha−1). Fertilizer N loss was calculated according to N balance equation. Our results showed that, under deficit irrigation conditions, N fertilizer application at a rate of 300kg ha−1 promoted NO3−-N concentration in 0–200cm depth soil profiles, and treatments with 221kg N ha−1 also increased soil NO3−-N concentrations only in the surface layers. Fertilizer N rates of 70 and 140kg ha−1 did not increase NO3−-N concentration in the 0–200cm soil profile remaining after the spring wheat growing season. The amount of residual NO3−-N in soil profiles decreased with the amount of irrigation. Compared with N0, the increases of fertilizer N loss, in N79, N140, N221 and N300 respectively, were 59.9, 104.6, 143.5 and 210.6kg ha−1 over 2years. Under these experimental conditions, a N rate of 221kg ha−1 obtained the highest values of grain yield (2775kg ha−1), above-ground dry matter (5310kg ha−1) and plant N uptake (103.8kg ha−1) over 2years. The results clearly showed that the relative high grain yield and irrigation water productivity, and relative low N loss were achieved with application of 221kg N ha−1 and low irrigation, the recommendation should be for those farmers who use the upper range of the recommended 150–400kg N ha−1, that they can save about 45% of their N and 40% of their irrigation water application.
[��������: 1]
[��������: 1]
[��������: 1]
[��������: 1]
