 ,1, ����2, ���ƺ�1, �γ���1, ���3, �Ժ�ΰ,1
Nitrogen and Phosphorus Loads and Their Environmental Effects of Animal Manure in Hainan Island from 1988 to 2018
DING Shang,1, FU Yang2, GUO HaoHao1, SONG ChenYang1, LI BoLing3, ZHAO HongWei,1ͨѶ����:
���α༭: ��÷
�ո�����:2019-12-13��������:2019-12-30�����������:2020-09-16
| ��������: |
Received:2019-12-13Accepted:2019-12-30Online:2020-09-16
����� About authors
����,E-mail��

ժҪ
�ؼ��ʣ�
Abstract
Keywords��
PDF (1365KB)Ԫ������ά�����������������EndNote|Ris|Bibtex�ղر���
�������ø�ʽ
����, ����, ���ƺ�, �γ���, ���, �Ժ�ΰ. ���ϵ�1988��2018�����ݷ���������������ЧӦ[J]. �й�ũҵ��ѧ, 2020, 53(18): 3752-3763 doi:10.3864/j.issn.0578-1752.2020.18.011
DING Shang, FU Yang, GUO HaoHao, SONG ChenYang, LI BoLing, ZHAO HongWei.
0 ����
���о����塿������,���ž��õķ�չ��ũҵ��Լ��ˮƽ�����,������ֳҵѸ�ͷ�չ,�ڹ������������Ʒ��ͬʱ,���ݷ�����Ĺ�������Ҳ���������صĻ�������[1],��ɸ��ص����ɹ���[2],ˮ����̬ϵͳ��Ӫ����[3,4],��ԭ������Ⱦ[5]��һϵ������,���Ϲ���ũ��֯�ѽ�������ֳ��Ϊ����������ȾԴ֮һ[6]����˶����ݷ��۵��������������о�,����Դ�ͻ����ǶȽ����Ż�,���ڹ��Һ�����߶����ƶ��������ֺͷ���������Ҫ����ǰ���о���չ��Ŀǰ,�����ݷ�����Դ�����úͻ���������о�,���������****���˴�����������MISHIMA��[7,8]ͨ����ȷ������й���ȥ������˷�ʵ�ʩ����,����˺�����ʩ��ˮƽ,�������ݷ��۵���Դ���������˽�һ���о�;��BASSANINO��[9]��ӻ����Ƕȳ���,���������������͡�����������������,������һ�ֶԲ�ͬ��ũҵ�������пռ������ķ���,�ݴ˷��������ݷ���Ļ���ЧӦ��Ҳ��****[10]���������ݷ�����ظ���Ԥ��ֵ���������ݷ�������صĻ������ա��ڹ��ҳ߶���,�����Ƶ�[11]ͨ��ȷ�����㷽���Ͳ���,������2003���ҹ���ֳҵ����������Լ�ƽ�����ظ��ɡ��ڴ˻�����,�������о���Ա���ҹ����ݷ������ԴDZ����������������Ⱦ���ս�����ϵͳ�о�[12,13,14]��������߶���,�����[15]������ʡΪ�о�����,������2006��2010������ݷ����ŷ�����������,����������Ի�������Ⱦѹ��;�����[16]��ӿռ�仯����,�о���2016��ɽ��ʡ�������ݷ��۲����������ָ���������ԴDZ�����������ա������о�����㡿���о�ָ��,���ϵ�λ�������������Ⱦ���ɽϸ�,��Ⱦ���������[12,17-18]������������̬���������������ϣ�ʵʩ������[19]�ж�ũҵ����̬��չ��������̬��������˸߱�Ҫ��,���,��ȷ���ݷ��۸��ظ��ɼ��价��ЧӦ�Դٽ����ϵ���̬���������ش����ں���ʡ,�����****[17,20-21]����ijһ�����,�о��ж�̽����ֳ���������ظ������,������ʱ�ճ߶�����Ը��������ݷ����������������ظ��ɼ��价�����յľ����о����������Ĺؼ����⡿�Ժ��ϵ�Ϊ�о�����,����1988��2018�꺣�ϵ����ݷ������ֲ������Լ���λ�������������,��ͨ�����ݷ�����ظ���Ԥ��ֵ�뻷������ָ�����ۺ�������Ի���������Ӱ��,����Ϊ����������ֳ���ֺͻ��������ṩ��ѧ�ο���1 �����뷽��
1.1 �о����ſ�
���ϵ����ҹ��ڶ���,λ�ڶ���108��37�䡪111��03��,��γ18��10�䡪20��10��,���Լ3.39��ƽ��ǧ�ס�������ƽ������24��27��,ȫ����˪����,�����������ڶ�,�����ʽϸ�,ȫ�����˷����ĵ�����30%,�Է�չ����ҵ���нϺõ�DZ����2018�걾����Ч�������Ϊ43.90����,��Ҫ�������غ�ƽԭ����,���в�Ϊɽ���������,���������С,�ֵ������Խϴ�1988��2018��,���ϵ�����ҵ���ٷ�չ,����2018���,����ҵ�ܲ�ֵ��245.32��Ԫ,�����������666��ͷ,�����������16 011��ֻ,�����⵰�����ܲ�����84.71���[22]��1.2 ���ݼ�����
���о��������꺣�ϵ�������ֳ�����������������������1989��2019�꡶����ʡͳ���������ͨ��������ȫ��ũҵ�ղ�,ͳ�����������������,����2019�꺣��ʡͳ�����,������ֳ����2013��2018��Ϊ�����������ݣ������ǵ���ͬʱ�ڼ���ͬ���������������ڵIJ���,ѡ������ĩ��������ţ��ĩ������������ĩ���������⼦��Ѽ����ĩ��������������ĩ��������Ϊ��ֳ�����м��㡣���ڲ�ͬ����,���ݷ������йϵ�������ֺ�����������,��ͬ������������Ҳ������ͬ,���IJ���ũҵũ�岿�ƽ�˾���һ��ȫ����Ⱦ�ղ��쵼С��칫����2009�����Ϸ�������һ��ȫ����Ⱦ�ղ�������ֳҵԴ������ϵ���ֲᡷ[23]������������ʡ���IJ���,������Ž��ܵ�[24]�Բ�������ԭ����������ϵ��=1/3�����ڲ�����ϵ��+2/3�����ڲ�����ϵ��;��ţ������ϵ����Ϊ���̽�;����ţ������ϵ��������ţ����;��ţ������ϵ������������;����������ϵ������������;���ݲ�����ϵ�����⼦�IJ�����ϵ�����㡣��������,����IJ�����ϵ�����Թ�ά��[12]���о�,�������ء��������ڽ�ϵ��к�����[24]��ã���1����
Table 1
��1
��1���ݷ�����йϵ�������ֺ���
Table 1
| �������� Animal category | ���� Fresh weight (kg) | �������� Growth period (d) | ��������� Manure production (kg��d-1) | ���ز����� N production (g��d-1) | ���ز����� P production (g��d-1) |
|---|---|---|---|---|---|
| ��Pig | 90 | 199 | 3.74 | 36.43 | 4.83 |
| ��ţDairy cattle | 624 | 365 | 50.99 | 353.41 | 62.46 |
| ��ţBeef cattle | 316 | 365 | 23.02 | 65.93 | 10.52 |
| ����ţDraft cattle | 328 | 365 | 27.63 | 139.76 | 25.99 |
| ��Sheep | 35 | 365 | 0.87 | 2.15 | 0.46 |
| �⼦Chicken | 2 | 80 | 0.06 | 0.71 | 0.06 |
| ����Egg-laying hen | 2 | 365 | 0.12 | 1.16 | 0.23 |
| ѼDuck | 2 | 210 | 0.06 | 0.71 | 0.06 |
| ��Goose | 4 | 120 | 0.06 | 0.71 | 0.06 |
�´��ڴ�|����CSV
1.3 ���㹫ʽ
1.3.1 ���ݷ������ֲ�����$Q=\sum \limits ^{9}_{i=1}Qi$,Qi=Fi��Ri��Wi��Ni,N(P)
ʽ��,QΪ���ݷ������ֲ�������;QiΪijһ�����ݷ��������;FiΪ��������;RiΪ��������������;WiΪ��������;Ni,N(P)Ϊ�����е��������ֺ�����
1.3.2 ���������������� LN(P)=QN(P)/A
ʽ��,LN(P)Ϊ��λ�������������;QN(P)Ϊ�����ײ�����;AΪ��Ч���������
1.3.3 ���ݷ�����ظ���Ԥ��ֵ ��λ������������ɽ���ӳ�������ݷ����Ƿ�,Ϊ�ж������ŷŶԻ�����������в�̶�,����Ҫ��һ��������Ⱦ�ȼ�,�ο�������[10]����ķ����Ժ��ϵ����ݷ���λ�����������ЧӦ����Ԥ���ͷּ���
R=q/p,q=��M��T/A
ʽ��,RΪԤ��ֵ,qΪ���ݷ�����������,M�������ݷ�����;TΪ�������ݷ���������൱���Ļ���ϵ��[10];pΪ�����൱���Ƶ��л����������ʩ����,��������顢����ƽ��[10,25]���о�,�˴�ȡ45 t��hm-2��
���ĵķּ��ο�������[10]���о�,��Rֵ��Ϊ<0.4��0.4��0.7��0.7��1.0��1.0��1.5��1.5��2.5��>2.5��6������,Ԥ������ֱ�Ϊ�������͢�,��Ӧ����Ⱦ�̶ȷֱ�Ϊ�ޡ����С��С������ء����غͺ����ء�RֵԽ��,˵�����ݷ��۶���̬������DZ��Σ��Խ��
1.3.4 ���ݷ��������������� ���ø��ضԵ��ij������͵�λ�����ܵ����ŷ���,���������������������,�ó�������ֳ�Ļ���������ʵ����ֳ������
EN/P=A��SN/P,LE=EN/P/r,$CQ=\sum \limits ^{9}_{i=1}D_{N(P)i}/r$
ʽ��,EN/PΪ�����ܵ���������;AΪ��Ч�������;SN/PΪ�����ʩ����������,SN=170 kg��hm-2,SP=35 kg��hm-2[26,27];LEΪ������ֳ��������;rΪ��λ��������ܵ����ŷ���;CQΪ������ֳʵ������;DN(P)iΪ��i�����ݷ������ܵ����ŷ�����
���ݹ�ά���콨����[12,28]���о�,��ʵ��������ֳ������50%����������ֵ��Ϊ����ָ��,�Ժ��ϵ�������Ⱦ���з���������
2 ���
2.1 ���ϵ����ݷ����������������
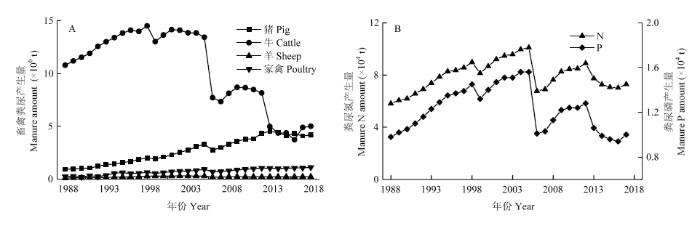
��ͼ1-A���Կ���,1988��2018�꺣�ϵ����ݷ�������������·�Ϊ3����,1988��2005����ֳ�����������,������12.05��106 t����17.95��106 t,��2006�����ֽϴ��ģ�½�,������11.32��106 t,��2008����������������ȶ������뺣��ʡ�����������仯���һ��,����,���ݷ��������Ҳ��������йϵ�����������ڵ�����Ӱ��,����ţ���������ڳ�,��йϵ����,��Ȼ��30����ţ����ֳ��ռ����,������������ʼ�սϸ�,ͬ����,����ֳ���ں�����ϵ��Ӱ��,�������������ϵ�,����������ֳ��������,������ռ�������ߡ�ͼ1
 �´��ڴ�|����ԭͼZIP|����PPT
ͼ11988��2018�꺣�ϵ����ݷ����ŷű仯�����ֲ�����
Fig. 1Changes of manure emissions and nutrient production in Hainan Island from 1988 to 2018
�����ֲ�����������ͼ1-B��,��������ʼ�仯��������,1988��2005�������5.82��104 t����10.10��104 t,��2006�꽵��6.78��104 t,�˺�������,2013���Ժ�,����ϵ������,��ֳ������2012����ǰ���ϴ�,���������仯����,���������ȶ�,������7.00��104 t��1988��2005���������0.98��104 t����1.56��104 t,2006�꽵��1.01��104 t,2007��2012�걣������������,������ά����1.00��104 t��
2.2 ���ϵ����ݷ���λ���������������
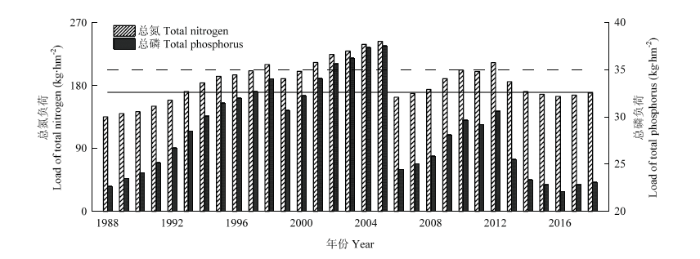
���ݷ���λ���������������һ���̶��Ϸ�ӳ���ݷ���DZ�ڵĻ�������[29],���ٶ����з�������ʧ�Ľ������,��������Ϊ����Ӷ�������������ˮƽ�ϵ�������Ⱦ������ѡȡŷ�˸��������ݣ�SN=170 kg��hm-2,SP=35 kg��hm-2[26,27]����Ϊ���ʩ����ֵ,�о�����,������ֵ������������ϴ��ʧ[27,30]��1993��2005�ꡢ2008��2014��䵥λ��������ܵ����ɳ���,2005�����,Ϊ242.60 kg��hm-2��������,�����������½�,��Ҳ�ӽ�����ֵ,���巴ӳ�������صĵ�����Ⱦ���͵�λ���������Ԫ�ظ�������,��2002��2005�곬������ֵ,������ݾ�δ����,��������dz��ֽϵ͵�ˮƽ,ά����22.00 kg��hm-2���ң�ͼ2����
ͼ2
 �´��ڴ�|����ԭͼZIP|����PPT
ͼ21988��2018�꺣�ϵ���λ��������ܵ���������
��������ʾ�ܵ�ʩ��������,��
Fig. 2Loads of total nitrogen and phosphorus in unit cultivated land of Hainan Island from 1988 to 2018
������ means the limited amount of total nitrogen application, ��
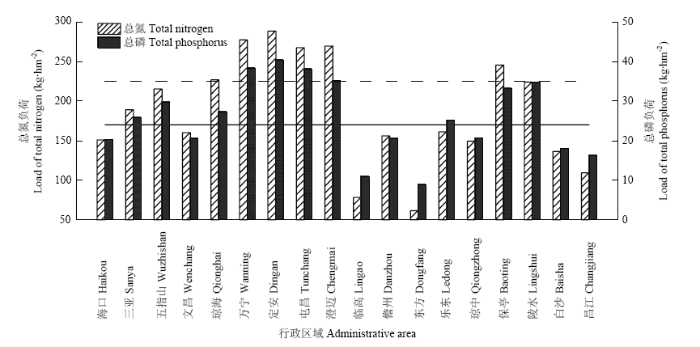
������ֲ�����,2018�굥λ����������������������ϴ�,�͵����ɶ���,�����������ͳ�����ֵ�ϴ�,�ֱ�Ϊ288.50��277.28��269.52 kg��hm-2�����������ٸ���ֵ������100 kg��hm-2,�ֱ�Ϊ61.66��78.30 kg��hm-2,�뵪Ԫ�����,���У��أ�������������ֵ����,���������������Ͳ���������ֵ����,���ж�����Ԫ�ظ������,Ϊ40.35 kg��hm-2,��͵�Ϊ����,��Ϊ8.83 kg��hm-2��ͼ3����
ͼ3
 �´��ڴ�|����ԭͼZIP|����PPT
ͼ32018�꺣�ϸ�����λ��������ܵ���������
Fig. 3Loads of total nitrogen and phosphorus in unit cultivated land area in Hainan Island in 2018
2.3 ���ϵ����ݷ�����ظ���Ԥ��ֵ
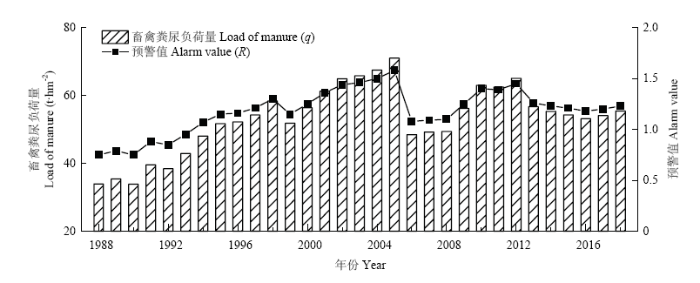
q��R�ܷ����������Ӱ��,������������������ֳ�����������һ�¡����Ӿ�����ֵ������ͼ4��,1988��2018�꺣�ϵ����ݷ�����ظ���Ԥ��ֵʼ�մ��ڽϸ�ˮƽ,����������1.0��1.5,�ּ����дﵽ����,�Ի����н����ص�Ӱ�졣���Կ�������30���������ݷ����������Ⱦ�����˸��ؿɳ��ܸ���,�Ի����Ѿ��н����ص���в������2005��Ԥ��ֵ���,Ϊ1.58,����Ӱ�컷��,1990����ֵ���,Ϊ0.75,�Ի�����һ��Ӱ��,������ֵ��1.23����,�Ի����н����ص���в��ͼ4
 �´��ڴ�|����ԭͼZIP|����PPT
ͼ41988��2018�꺣�ϵ����൱�����ɼ����ظ���Ԥ��ֵ
Fig. 4Pig manure equivalent load and alarm value in Hainan Island from 1988 to 2018
�ռ�ֲ��ϣ���2��,ͨ���Ը�����2018��Ԥ��ֵ�ļ���,���������ݷ�����ظ������Ի�������в,R=0.36,����,���У��أ����ݷ��۾��Ի���������ͬ�̶ȵ�Ӱ��,���ڡ����ǡ����ݵȵضԻ�����Ӱ��,�IJ�����ͤӰ�������,���������������Ͳ�Ԥ��ֵ�Ѵﵽ����,�Ի�������������в,���е����������ص��Ƕ�����2.66���ͳ�����4.59��,�ﵽ����ˮƽ������һ���̶��Ϸ�ӳ�˺�������߶������ݷ�������������Ч���ؿɳ��ܷ�Χ,��������ֻ�ͨ��������������ʧ,�ϻ���ʹ�����������½�,���������صĻ�������[2],���Ҳ��ֵ������������DZ�ڻ��������Ѵﵽʮ���Ͼ��ĵز���
Table 2
��2
��22018�꺣�ϸ��������൱�����ɼ��Ի�������в�ּ�
Table 2
| ���� Area | ���൱�� Pig manure equivalent (��104 t) | ���ݷ����� Load of manure (t��hm-2��a-1) | Ԥ��ֵ Alarm value (R) | Ԥ������ Classification level | �Ի�������в�̶� The threat to environment |
|---|---|---|---|---|---|
| ����Haikou | 159.61 | 32.67 | 0.73 | �� | ��Medium |
| ����Sanya | 55.48 | 38.15 | 0.85 | �� | ��Medium |
| ��ָɽWuzhishan | 14.37 | 43.93 | 0.98 | �� | ��Medium |
| �IJ�Wenchang | 233.28 | 58.47 | 1.30 | �� | ������Less serious |
| ����Qionghai | 176.86 | 76.73 | 1.71 | �� | ����Serious |
| ����Wanning | 188.79 | 98.21 | 2.18 | �� | ����Serious |
| ����Dingan | 264.48 | 119.48 | 2.66 | �� | ������More serious |
| �Ͳ�Tunchang | 103.73 | 77.51 | 1.72 | �� | ����Serious |
| ����Chengmai | 631.61 | 206.37 | 4.59 | �� | ������More serious |
| �ٸ�Lingao | 75.57 | 23.75 | 0.53 | �� | ����Slight |
| ����Danzhou | 143.13 | 27.72 | 0.62 | �� | ����Slight |
| ����Dongfang | 75.51 | 16.39 | 0.36 | �� | ��None |
| �ֶ�Ledong | 115.36 | 38.08 | 0.85 | �� | ��Medium |
| ����Qiongzhong | 28.71 | 28.66 | 0.64 | �� | ����Slight |
| ��ͤBaoting | 29.18 | 48.57 | 1.08 | �� | ������Less serious |
| ��ˮLingshui | 48.05 | 40.68 | 0.90 | �� | ��Medium |
| ��ɳBaisha | 30.61 | 26.29 | 0.58 | �� | ����Slight |
| ����Changjiang | 58.12 | 24.60 | 0.55 | �� | ����Slight |
�´��ڴ�|����CSV
2.4 ���ϵ����ݷ�����������
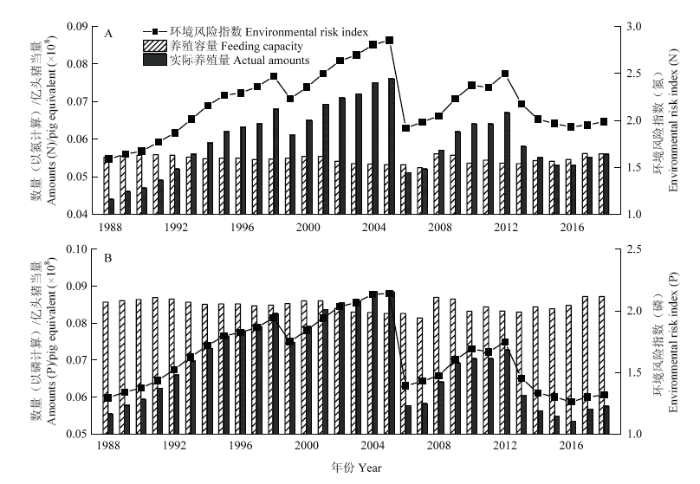
��1.3.4�й�ʽ��������ϵ�������ֳ�Ļ���������ʵ����ֳ����,Ϊ������ֲҵ����ֳҵ�ĺ�����չ,ʵ����ֳ��Ӧ�ﵽ��ӽ�50%��ֳ����[12]������������������ʵ��������,�����ݷ�������Ⱦ�����ķ���,����ʵ��������ֳ������50%����������ֵ��Ϊ����ָ��,���������ս����������Ե�Ϊ����ͼ5-A��,�ܸ����������,���ϵ�1988��2018������ܵ�����ֳ����������0.055��ͷ������,ʵ����ֳ������0.044��0.076��ͷ������֮��;����Ϊ����ͼ5-B��,������ֳ������0.085��ͷ����������,ʵ����ֳ������0.055��0.096��ͷ������֮��,�빢ά���콨����[12,28]��ȫ����Χ�о��Ϲ��㺣�ϵ���ֵ���ϴ�,ԭ������ȫ���߶���,ǰ�˻��ڡ��й�ͳ�������,�ں���������ʱʹ���ܸ������,������������Ϊʹ����Ч���������Ϊ���ݷ��۳��س���������ʵ���������ͼ5���Կ���,1988��2018�껷������ָ��������1.00,�����ϵ�30������������ֳ������ũ�غ����Ļ�������,���ڻ������ա�������ֵ�ϸߵ����Ϊ2005��,��������ָ��Ϊ2.85���Ե��ƣ���2.14�����ƣ�������������ֳ�����Ŀ���,2018�껷������ָ���½���1.99���Ե��ƣ���1.32�����ƣ���
ͼ5
 �´��ڴ�|����ԭͼZIP|����PPT
ͼ51988��2018�꺣�ϵ�������ֳ����ֳ������ʵ����ֳ��������������ָ��
Fig. 5Feeding capacity, actual amounts and environmental risk index of livestock and poultry in Hainan Island from 1988 to 2018
�ڿռ�ֲ��ϣ���3��,�Ե�Ϊ��,2018����������ж������ٸ�������ֳδ��������50%����ֳ����������������ָ����1.00���£�,���ڡ��IJ���7������������Ⱦָ������1.00��2.00,�нϸߵĻ�������,���ǡ���ָɽ��������9��������������ָ������2.00,�����صĻ�������,���ж���������Χ�ڷ���ֵ���,Ϊ3.39������Ϊ��,2018�궫�����ٸߺͲ�����������ָ����1.00����,����Ϊ���ݷ��۶Ի���Ӱ���С�����ڡ����ǡ��IJ���11��������������ָ������1.00��2.00,�нϸߵĻ�������,������������4��������������ָ������2.00,�����صĻ�������,������ֵ���,Ϊ2.31��
Table 3
��3
��32018�������������ֳ�Ļ���������ʵ����ֳ��������Ⱦ����ָ��
Table 3
| ���� Area | ������ Loading capacity (t) | ��ֳ��������ͷ�������� Feeding capacity | ʵ����ֳ������ͷ�������� Actual amounts | ��������ָ�� Environmental risk index | ||||
|---|---|---|---|---|---|---|---|---|
| N | P | N | P | N | P | N | P | |
| ����Haikou | 8305 | 1710 | 62.46 | 96.99 | 55.44 | 56.07 | 1.78 | 1.16 |
| ����Sanya | 2472 | 509 | 18.59 | 28.87 | 20.66 | 21.29 | 2.22 | 1.48 |
| ��ָɽWuzhishan | 556 | 115 | 4.18 | 6.50 | 5.30 | 5.53 | 2.53 | 1.70 |
| �IJ�Wenchang | 6782 | 1396 | 51.01 | 79.21 | 48.09 | 46.45 | 1.89 | 1.17 |
| ����Qionghai | 3918 | 807 | 29.47 | 45.76 | 39.31 | 35.66 | 2.67 | 1.56 |
| ����Wanning | 3268 | 673 | 24.58 | 38.16 | 40.09 | 41.81 | 3.26 | 2.19 |
| ����Dingan | 3763 | 775 | 28.30 | 43.94 | 48.03 | 50.66 | 3.39 | 2.31 |
| �Ͳ�Tunchang | 2275 | 468 | 17.11 | 26.57 | 26.92 | 28.92 | 3.15 | 2.18 |
| ����Chengmai | 5203 | 1071 | 39.13 | 60.76 | 62.04 | 60.99 | 3.17 | 2.01 |
| �ٸ�Lingao | 5410 | 1114 | 40.69 | 63.18 | 18.74 | 19.76 | 0.92 | 0.63 |
| ����Danzhou | 8777 | 1807 | 66.01 | 102.51 | 60.58 | 60.13 | 1.84 | 1.17 |
| ����Dongfang | 7834 | 1613 | 58.92 | 91.49 | 21.37 | 23.09 | 0.73 | 0.50 |
| �ֶ�Ledong | 5149 | 1060 | 38.73 | 60.14 | 36.68 | 43.17 | 1.89 | 1.44 |
| ����Qiongzhong | 1703 | 351 | 12.81 | 19.88 | 11.24 | 11.74 | 1.76 | 1.18 |
| ��ͤBaoting | 1021 | 210 | 7.68 | 11.93 | 11.09 | 11.32 | 2.89 | 1.90 |
| ��ˮLingshui | 2008 | 413 | 15.10 | 23.45 | 19.90 | 23.29 | 2.63 | 1.99 |
| ��ɳBaisha | 1979 | 408 | 14.89 | 23.12 | 11.95 | 11.85 | 1.61 | 1.03 |
| ����Changjiang | 4016 | 827 | 30.20 | 46.90 | 19.41 | 21.80 | 1.29 | 0.93 |
�´��ڴ�|����CSV
3 ����
3.1 ���ϵ����ݷ����ײ����仯����
������ֳ��ģ����ֳ�ṹ��һ���̶���Ӱ�������ݷ����������ڲ�ͬ��ʷʱ��,����ҵ��չ��ģ��ͬ,���ǶԵ����ʵ������Ϊ�̼�����ҵ��չ����Ҫ������[31],����������ҵ��Լ��ˮƽ�����Ҳ�ٽ�����ֳ��ģ�Ľ�һ��������2007���,����ҵ��չ��������Դ��Ч�Ժͻ����Ѻ��͵�Ҫ��,����������ͻ���Ѿ�����Ӧ�µķ�չ����[32]������2006���,���߲���̨�����Ȼ������Ӱ��,���ݲ��������˽ϴ�����½�[18],���ݷ��ۺ�����֮���١�����������ֳ�ṹ�IJ�ͬ,������Ⱦ���ŷ�Ҳ����������,ţ�����IJ�����ϵ���ϸ�,���ݵIJ�����ϵ���ϵ�,���ܽ�����ݵ���ֳ�����нϴ�����,�������ŷ�����ǰ��δ�����Ա仯������YUAN��[33]�о�����,��Զ�����ʳ�ṹ�ĵ����ɽϺõؿ������ݷ���������3.2 ����������ֳ�ĸ��ظ��ɷ���
�о�����,���ϵ�30�������������ݷ�㵪���ɽϸ�,��DZ�ڵĻ�������,�������ں�����Χ��,��������ϼ��[34]����2015��ȫ���߶ȵ��о���������ϵ�λ������������ɳ���150 kg��hm-2,���ɵ���30 kg��hm-2��,������Խ��[20]����2011��Ժ����о��е�������һ������,ԭ���ǻ��ڲ�ͬ��,��Խ�Ȳ��õ�������ϵ����Խϸ�,��Ҳ��ӳ���ڲ�ͬ�ı����о�������������졣���ظ��ɵķ�������,��ά���콨����[12,28]�о�Ҳ����������ȫ����Χ���ڽ�����ˮƽ�����ں��ϵ������������С,30��������Ч�������ά����40��������,��������ֳ�����е�����ϵ���ϸ�,������ֳ����������,��Ը��ص�ѹ��Խ��Խ����Ԫ������,����Ҫ���ڶ����������ŷ�ϵ���ϵ�ʹ�ø�����������С���ڿռ���,Ϊ�Ż���Դ����,���ϻ��֡�������������ҵ����,�в���̬������,���������ʶȷ�չ����[35],�������������������ҵ��ģ�ϴ�,���ݷ��۸��ظ��ɽϸ�,�������������ȵ������ж���,�����ڸ��������С,������Ҳ�����ڽϸ�ˮƽ,�������һ�����Ƶ���������ֳ��ģ,�������ٸߵȵأ����������ڸ�������ϴ�,�����ݷ����нϺõij�������,�����ɽϵ�,Ϊ������������,�ɽ�һ��������ֳ��ģ��3.3 ����������ֳ�Ļ���ЧӦ����
ֵ��ָ������,Ϊ�ó����ݷ�����ظ���Ԥ��ֵ�ͻ�������ָ��,�ڼ��������,ʹ�õ������ݷ��۲���������,����ʵ�������,���ڻӷ��������Լ�����������е���ʧ,���ݷ�����ȫ�����������,����ڹ�ʽ�ó�����ֵ��������ӳ����Ի�����ʵ����Ⱦ,����������Ⱦ���������ֲ���,���Ը�����Ϊ����,�ݴ˿��Է�ӳ���������ݷ�������ĸ�����,�����ж϶Ի����Ƿ������в�����ں���������ֳ�ĸ��ظ���Ԥ��ֵ,����⡢��Խ��[17,20]����������о�,����ѡ�������ϵ����ͬ,����뱾���ڶ�Ӧ�������ֵ����ȫһ��,�����첻����ȫ���߶���,ǰ�˾ͺ��ϸ��ظ���Ԥ��ֵ�ͻ�������ָ��Ҳ���о�[12,28,36],��ͬ��ݵ��о��������ʾ�����нϸߵĻ�����в,�������о������ʾ��Ⱦ���ո��ߡ�ԭ���ǻ��ڲ�ͬ���,���õ��ĸ��������ͬ��ǰ��ͳ�����ܸ������,���IJ�����Ч���������,ǰ���о�ʱ,��Ժ����н϶������ȥ�������ݷ���,��Ԥ��ֵ�ͷ���ֵ����С�����ӽ����,�����о���ָ�����ϵ������ص��������ϸ�,������в����,����б�Ҫ��ȡ�������ơ���ȾԤ������Դ�����õ��ֶΡ��������о���,�����У��أ��Ļ�����вҪ���������У��أ�,����Ҫ����������������ֳ��ģ�й�,������ʡ�ִ�ũҵ��ʮ���塱��չ�滮��2016��2020���жԶ��������������ʶȷ�չ����ҵ��Ҫ��[35],���ڽ��չ��Ӧ��һ��ͨ���������ƺ���Ⱦ���μ�����Ի�������в�����ж����������ȵ���ֵ���Ǵ��ڽϸ�ˮƽ,�������սϴ�,���Ӧ��ǿ����������������ȾԤ����3.4 ���ں��ϵ����ݷ��ۿ��ƵĶԲ�
������ҵ���ٷ�չ�����Ĵ������ݷ����Ѿ���Ϊ�����������̬������Ⱦ��ֱ�ӻ�������[37],������ݷ��۴���������,GARRETT��[38]��ΪӦ�ۺ�����-����ϵͳ�ķ�չ,���ũҵ�Ŀɳ�����;���ֵ�[39]���鿼���������ֲ���ǿ�����Эͬ��չ�������ۺ�ǰ���о��ͱ��ط�չʵ��,��ΪӦ�ӹ����ͼ������������,�������£���1������������ͳ������,�����������������в��Ͷ������ֽϿ�������ֳ������,���dz�ֿ��Ǹ������,�Լ��в��ֵ�����Է�չ��������ҵ�Ŀ�����,ͬʱ��������ƹ��������ģʽ;����Ǵ��������������Ƕ�[40],�����Լ�Լ����ֳ�����нṹ�����������������Ȼ���;����,�ƽ����ݷ�����Դ������Դ��;��,���������̺��л��ʳ����衣��2�����һ����ģ��������ֳ�����Կ��Ǿ�ϸ������ֳģʽ��PLF��,��������ص����豸��س��ڻ��������������������ŷţ��Դﵽ��ʱ������Ч��[41],����,���ա�������+�����Դ+�л��ʡ���λһ�弼��·��,�������ƹ�ģ���ݳ���������,�Է��۽��й�Һ���롢���������ͺ������ﴦ��[42],ͬʱ�ƹ��ԭ��ȫ��ʽ���͡�ȫ�Զ����º������͵ȼ��������ͬʱ,����ѭ�����õ�ԭ��,�������ݷ�����Ϊˮ����ֳ���ϵ����÷�ʽ�ʹ�������,�Լ������������ƹ����ת�����ݷ��ͽոѵ�ũҵ�����������ʼ�����4 ����
����ֳ��ģ���������ں�����ϵ����Ӱ��,1988��2018�꺣�ϵ����ݷ��������͵������ֲ��������¾������������½����ȶ�3����չ�Ρ���ǰ���ϵ���λ������������ɽ�����,�ӽ�ʩ����ֵ,��������ϴ�,���ֶ������͵��ص�,������У��أ������ɳ���,�����������ں�����Χ�ڡ��ͻ�����������,���ݷ�����ظ���Ԥ��ֵ�ͻ�������ָ������ӳ��30�������������ݷ���DZ�ڻ���Ӱ������,���������Ի�������вҪ����������������������һϵ�б仯��ԭ���뵱ǰ������ֳ��ģ����Ч���������������ֳ�����й�,��ǰ��Ϊ�ַ�ʽ��������ֳ������ʽ�����������ں��ϵ�ũҵ��ɫ��չҪ��,Ϊ�������ݷ��۴����Ļ�������,Ӧ������������������ˮƽ,ͨ�����д��á�ѭ�����õ��ֶν������ݷ��������ŷ���,�ƹ��������ģʽ�ӿ�Է�ʵĴ���,�Լ��������չ����������ֳ��ģ,��֤���ض����ݷ��۵���Ч���ɡ�
�ο����� ԭ��˳��
������ȵ���
������������
�����ڿ�Ӱ������
[��������: 1]
DOI:10.1016/j.jclepro.2016.02.104URL [��������: 2]
DOI:10.1126/science.1155398URLPMID:18388279 [��������: 1]
DOI:10.1111/j.1365-2427.2007.01950.xURL [��������: 1]
DOI:10.1023/A:1023690824045URL [��������: 1]

Livestock production has undergone massive industrialization in recent decades. Nationwide, millions of swine, poultry, and cattle are raised and fed in concentrated animal feeding operations (CAFOs) owned by large, vertically integrated producer corporations. The amount of nutrients (nitrogen and phosphorus) in animal manure produced by CAFOs is enormous. For example, on the North Carolina Coastal Plain alone an estimated 124,000 metric tons of nitrogen and 29,000 metric tons of phosphorus are generated annually by livestock. CAFO wastes are largely either spread on fields as dry litter or pumped into waste lagoons and sprayed as liquid onto fields. Large amounts of nitrogen and phosphorus enter the environment through runoff, percolation into groundwater, and volatilization of ammonia. Many CAFOs are located in nutrient-sensitive watersheds where the wastes contribute to the eutrophication of streams, rivers, and estuaries. There is as yet no comprehensive Federal policy in place to protect the environment and human health from CAFO generated pollutants.
URL [��������: 1]
DOI:10.1080/00380768.2012.658581URL [��������: 1]
DOI:10.1016/j.biombioe.2011.09.009URL [��������: 1]
DOI:10.1016/j.ecolind.2010.05.005URL [��������: 1]
Regionally mandated budgets often ignore important sub-regional differences. To help identify hot-spots, where environmental pressures and agricultural activities combine and heighten the need to optimise farming strategies, we recommend using detailed spatial target analysis.
In this paper, we propose a methodology for identifying different agro-environments, test that method in a case-study territory in the western Po River plain (the largest and most intensive agricultural area in Italy), and then calculate the nutrient budget indicators of these defined agro-environments as a means to assess environmental sustainability.
We identified five Macro Land Units (MLUs) representing five different agro-environments from official datasets and territorial surveys, detected and quantified land use, crop productivity, and fertilisation management in these MLUs, and calculated nutrient budgets according to the IRENA European methodology. As expected, the highest nutrient surpluses (103, 39, and 95 kg ha(-1) for N, P. and K, respectively) were detected in the most intensely managed area. N surpluses were attributed to excess mineral inputs and P surpluses to excess organic inputs. At the territorial scale, the manure N load was far below the 170 kg ha(-1) threshold; at the crop scale, maize showed the least-optimised fertilisation management.
This work suggests that GIS-based analysis of environmental pressures of agricultural activities at a sub-regional level is useful for identifying areas and crops for which fertilization must be well managed. The proposed methodology depends on accurate collection and collation of farm data into GIS databases; public authorities should promote investment in planning and managing data collection in agriculture. (C) 2010 Elsevier Ltd.
[��������: 5]
[��������: 5]
[��������: 1]
[��������: 1]
[��������: 8]
[��������: 8]
[��������: 1]
DOI:10.1021/acs.est.8b02651URLPMID:30059205 [��������: 1]
[��������: 1]
[��������: 1]
[��������: 1]
[��������: 1]
[��������: 3]
[��������: 3]
DOI:10.3864/j.issn.0578-1752.2019.05.008URL [��������: 2]
DOI:10.3864/j.issn.0578-1752.2019.05.008URL [��������: 2]
[��������: 1]
[��������: 1]
[��������: 3]
[��������: 3]
[��������: 1]
[��������: 1]
[��������: 1]
[��������: 1]
[��������: 1]
[��������: 1]
URL [��������: 2]
���Ź��Ҿ��õĸ��ٷ�չ��������ʳ�ṹ�ĸı䣬������ֳҵ�ɴ�ͳ�ַ�ʽ���ģ������Լ������ת�䣬���ݷ����ѭ�����ü���Ի����ķ�������ֵ�ù�ע.��������ͳ�����Ϻ��������ݣ�ͨ��ʹ��ʳ������������ģ��(NUFER)��GIS���ϣ����������ɽ��ʡ������ֳ���ı仯������ģ�������ݷ���IJ��������䵪�������ֵ���Դ��������ʱ��ά��������ɽ��ʡ���ݷ�����Դ�����价������.��������� 1978—2012�꣬ɽ��ʡ���ݷ���IJ�������1.61×10⁷�� t������2.75×10⁷�� t��������1.71����������7.74×10⁴�� t������17.32×10⁴�� t������������1.09×10⁴�� t������3.39×10⁴�� t�������ֱ�ﵽ2.38��3.10��.����ֳ��������֮�⣬��ֳ�ṹ����ֳ��ʽҲ�������ش�仯.�ӿռ�ֲ�����2012��ɽ��ʡ�������ݷ����׳��������ֽ��������кͽ����ϸߣ��б��������ϲ��͵ķֲ��������������ݷ���������Դ�������ڿռ��Ϸֲ�����ƽ�⣬����������ֳרҵ���̶���ũҵ���߹�ͬ���õĽ��.��ˣ�Ӧͨ���Ż��������ֺ����������Эͬ�������ֶΣ����������ݷ�����ŷ���ѭ�����ã�������Ⱦ���������գ���ʵ�����ݷ���������Դ�ĸ�Ч��ɳ�������.
[��������: 1]
[��������: 1]
DOI:10.1016/S1573-5214(01)80002-6URL [��������: 2]
URLPMID:15053104 [��������: 3]
This study explores the effects of manure policy options for agricultural land in The Netherlands on nitrate leaching to groundwater, ammonia and nitrous oxide emissions to the atmosphere and on eutrophication of surface waters. The implementation of the farm gate balance MINAS at farm level, with levy-free N surpluses in the range of 300 to 40 kg per ha per year, and levy-free P surpluses in the range of 17.5 to 0.4 kg of P per ha per year, have been examined. Results indicate that nitrate concentrations in the upper groundwater are related to N surplus, land use, soil type and groundwater level. On dry sandy soils, the N surplus has to be below 60 to 140 kg of N per ha per year, depending on land use, to decrease the nitrate concentrations in the upper groundwater to below 50 mg nitrate per litre. Decreases of N and P concentrations in surface waters, upon lowering levy-free surpluses appear relatively small. For improving the ecological state of surface waters, we recommend a combination of low levy-free N and P surpluses with dredging P rich sediments, flushing of ditches, and decreasing discharges from other sources.
[��������: 4]
[��������: 4]
DOI:10.1016/j.ocecoaman.2017.03.024URL [��������: 1]
[��������: 1]
DOI:10.1016/j.jclepro.2015.07.073URL [��������: 1]
URL [��������: 1]
Ϊȷ���ս������й�������ֳ��չ��������켰���ݷ��Ի�������Ⱦ��в�����о�������ƽ�������ʷ�������ʾ������ֳ�����䵪��Ⱦ�������ʵ���������ʱ��仯���ɣ��������ص�������Ⱦ���ɡ������������Щ���й�������ֳҵ��չѸ�٣�������������������ֳ������ƽ�������ʶ��ձ�ϸߣ�������������12%��ţ�������ƽ�������ʵ��������ϴ�������ֳ��չ�����ɷ�Ϊ3���Σ��Ȳ���չ�Σ�1980��1995�꣩��ȫ�淢չ�Σ�1996��2006�꣩���ִ�����չ�Σ�2007��-�������������С����ϡ����ϵ������ݵ���Ⱦ���������ϴ����Ͷ�����ʡ����ƽ����������Խϸߣ����к��ϡ��Ĵ���ɽ����ʡ��������ֳ�������Ͽ졢��ֳ���ϴ��صĵ���Ⱦ���ɽ��ء�ȫ��ƽ����λ������������ݵ���Ⱦ���ɴ�138.13 kg/hm2�������Ĵ���6ʡ���Ѵ�202.98 kg/hm2���ϡ����о�Ϊȫ����ʡ��ũҵ��չ�滮��������ֳ�ṹ�����ṩ�ο���
DOI:10.1016/j.jenvman.2019.04.028URLPMID:31125871 [��������: 1]
Identifying the key nodes of the phosphorus flows in animal raising system is fundamental to improve P utilization efficiency and reduce the P contamination. This study established a phosphorus flow analysis model for livestock and poultry raising, depicted P flows for major livestock and poultry under two raising modes, and further analyzed their spatial and temporal distributions. We find that around 15% of P input was transferred into the products, and in P output around 40% lost into the environment in 2015. The P flows have been increasing since 2000, and the main contributor is pigs followed by beef cattle. It should be noticed that P loss from livestock and poultry raising is huge with extensive prospect of recycling in some central provinces of China, and western region where ecological environment is fragile, has a higher P loss rate which need to change the dietary preference and adjust raising structure. As for diets, pork and eggs are better choices than milk or other kinds of meat in terms of reducing the P load, when producing per unit protein or energy. This study contributes to the understanding of P management in husbandry industry, the quantification of environmental loads of animal-based food and the identification of the potential of reducing P loss to realize sustainable utilization of P.
[��������: 1]
[��������: 1]
[��������: 2]
[��������: 2]
[��������: 1]
[��������: 1]
DOI:10.1007/s13280-012-0249-6URL [��������: 1]
Non-point source (NPS) pollution has been increasingly serious in China since the 1990s. The increases of agricultural NPS pollution in China is evaluated for the period 2000-2008 by surveying the literature on water and soil pollution from fertilizers and pesticides, and assessing the surplus nitrogen balance within provinces. The main causes for NPS pollution were excessive inputs of nitrogen fertilizer and pesticides, which were partly the result of the inadequate agricultural extension services and the rapid expansion of intensive livestock production with little of waste management. The annual application of synthetic nitrogen fertilizers and pesticides in China increased by 50.7 and 119.7%, respectively, during 1991-2008. The mitigation measures to reduce NPS pollution include: correct distortion in fertilizer prices; improve incentives for the recycling of organic manure; provide farmers with better information on the sound use of agro-chemicals; and tighten the regulations and national standards on organic waste disposal and pesticides use.
DOI:10.1016/j.agsy.2017.05.003URL [��������: 1]
DOI:10.1016/j.gloenvcha.2014.06.015URL [��������: 1]
DOI:10.1021/es400456uURLPMID:23656482 [��������: 1]
The nitrogen (N) and phosphorus (P) costs of food production have increased greatly in China during the last 30 years, leading to eutrophication of surface waters, nitrate leaching to groundwater, and greenhouse gas emissions. Here, we present the results of scenario analyses in which possible changes in food production-consumption in China for the year 2030 were explored. Changes in food chain structure, improvements in technology and management, and combinations of these on food supply and environmental quality were analyzed with the NUFER model. In the business as usual scenario, N and P fertilizer consumption in 2030 will be driven by population growth and diet changes and will both increase by 25%. N and P losses will increase by 44 and 73%, respectively, relative to the reference year 2005. Scenarios with increased imports of animal products and feed instead of domestic production, and with changes in the human diet, indicate reductions in fertilizer consumption and N and P losses relative to the business as usual scenario. Implementation of a package of integrated nutrient management measures may roughly nullify the increases in losses in the business as usual scenario and may greatly increase the efficiency of N and P throughout the whole food chain.
DOI:10.1016/j.biosystemseng.2016.12.005URL [��������: 1]
[��������: 1]
