 ,1,2, ������,1,3
A Method for the Automatic Determination of Scale Parameter During Segmenting Agricultural Drone Images
SHI YaJiao,1,2, CHEN PengFei,1,3ͨѶ����:
���α༭: ���κ�
�ո�����:2019-11-5��������:2020-02-9�����������:2020-09-01
| ��������: |
Received:2019-11-5Accepted:2020-02-9Online:2020-09-01
����� About authors
ʯ�Ž�,E-mail��

ժҪ
�ؼ��ʣ�
Abstract
Keywords��
PDF (7457KB)Ԫ������ά�����������������EndNote|Ris|Bibtex�ղر���
�������ø�ʽ
ʯ�Ž�, ������. һ������ũҵ���˻�Ӱ��ָ�ij߶Ȳ����Զ�ȷ������[J]. �й�ũҵ��ѧ, 2020, 53(17): 3496-3508 doi:10.3864/j.issn.0578-1752.2020.17.007
SHI YaJiao, CHEN PengFei.
0 ����
���о����塿���������ң��ƽ̨,���˻�ң�о��л��������ص�,����ȡ��ʱ�䡢�ռ�ֱ���Ӱ��,���ھ�ũҵ����������Ҫ����[1]���߿ռ�ֱ��ʵ�Ӱ��Ϊȷ��������ֲ���������ȱ����ṩ������֧�š���������,****��һֱ����Ƹ��ֹ���ָ����ȥ�������ȱ����ĸ���[2,3,4]��������ڸ߿ռ�ֱ��ʵ����˻�Ӱ��ֱ�Ӱ������ȱ���ȥ����,�Ƕ�������������������������ݾ��Ⱦ�����Ҫ���塣����****���о�����,���ڸ߷ֱ������˻�Ӱ���������������������ˮ�֡�ֲ�굪Ũ�ȵȲ����ķ��ݾ���[5,6]������,ȷ��ȡ�������,����ʶ���Ӳݡ��������ȶ��dz���Ҫ������ң��Ӱ��������������������,ʵ���Ƕ�Ӱ����з��ࡣ��Ӱ����з���ķ��������˹�Ŀ�ӽ��뷨��������Ԫ���Զ����෨�ͻ��ڶ�����Զ����ࡣĿǰ,�����о�����ȡ�������ʱ,�����Ŀ�ӽ��뷨�������Ԫ���෨[6,7]��Ŀ�ӽ��뷨��������,����Ԫ��������������������[8,9]���������˻����߿ռ�ֱ���Ӱ����˵,�������ķ����������ȡ�ýϺõĽ��[10,11]�����������෨�Ļ���������ͨ��ͼ��ָ��ö���,Ȼ��Էָ������з����Դﵽʶ��Ŀ������Ŀ�ġ����,ͼ��ָ����������ң��Ӱ�����е���Ҫ����[12,13]���ڷָ����ʱ,��Ҫ�趨�߶Ȳ���,��������С������ء�Ŀǰ,�о���Ա����ھ������˹����Ի��,������������ƹ�Ӧ��[14]�����,������˻�Ӱ��߾����Զ��ָ�����,��չ�߶Ȳ����Զ�ȷ�������о�,�Ծ�ũҵ����������Ҫ���塣��ǰ���о���չ������Ӱ����Զ��ָ�,Ŀǰ�������˻�Ӱ����о�������,�����о�����ڸ߷ֱ�������Ӱ�����ݿ�չ[15,16,17,18]������Щ�о�����Ϊ��չ���˻�Ӱ��������Ӧ���ṩ�˲ο������ݡ������ڲ��нϺõ�ͬ����,������нϺõ������ԡ���ԭ�����������ۺ���,�������ۺ���ֵ�仯������,ѡ�仯������յ㡱λ�ô��ij߶Ȳ���ֵ��Ϊ����ֵ,�����г߶Ȳ����Զ�ȷ�������ĺ���˼��[19,20,21,22]������������ƽ��������Ϊ���ۺ���,YANG��[23]��Ϊƽ�����DZ仯�������ʱ����Ӧ�ij߶Ȳ���ֵΪ����ֵ�����,���ƽ������ֻ���Ƕ�����ͬ���Ե�����,YANG��[24]�������������Ϊ���������������ǰ���о����иĽ����ſ���[25]�ڷָ�Ӱ��ʱ,��������������Ծ�ֵ��ַ������Ϊ���۷ָ�߶ȵ�ָ��,��Ϊ��ֲ���ֵ����Ӧ�ij߶�Ϊijһ�������ѷָ�߶�,��ʵ�ֳ߶Ȳ������Զ�ȷ��;�Ծֲ����Local Variance,LV��[26]Ϊ�����,��־����[27]�����Ȩ�ֲ����weighted local variance,WLV����Ϊ���ۺ���,�������ۺ������յ㡱���Զ�ȷ���ָ�߶Ȳ����ķ����������о�����㡿WLV�������,����ʵ��,�����ڷָ�ʱֻ�����˶����������,ȱ����ͬ���ԵĿ���,���ܻᵼ�·ָ���Ƿȷ���������Ĺؼ����⡿���о������һ�ָĽ��ķָ�߶Ȳ����Զ�ȷ������,�����в�ͬˮ���������»�ȡ�����ס�С��������ڡ���ͬ���������˻�Ӱ��ԸĽ�ǰ��ķ������жԱȷ���,Ϊũҵ���˻�Ӱ���Զ��ָ��ṩ�µļ���֧�š�1 �����뷽��
1.1 �������
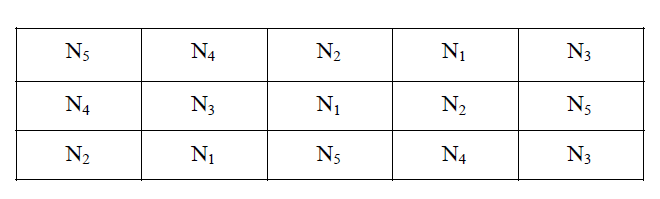
Ϊ����ʵ��Ӧ������,���о������˲�ͬ������������,�Էḻ���鳡����1.1.1 �������ݶ����� ��2018��5�¡�10���ڼ���ʡ�̼���124��40��25��E,43��24��00��N����չ���顣Ʒ��Ϊ������558����������5������,3���ظ�,��15��С��,��С�����Ϊ7.8 m��13 m������,5�����ʴ����ֱ�Ϊ0��70��140��210��280 kg��hm-2����������,��С������������ʩ��ͬ,����ʾ����ͼ1��ʾ��
ͼ1
 �´��ڴ�|����ԭͼZIP|����PPT
ͼ1����������ʾ��ͼ
N1��N5�ֱ��ʾʩ����Ϊ0��70��140��210��280 kg��hm-2
Fig. 1Schematic diagram of the nitrogen experiment of corn
N1-N5 indicate applied nitrogen at 0, 70, 140, 210, 280 kg��hm-2
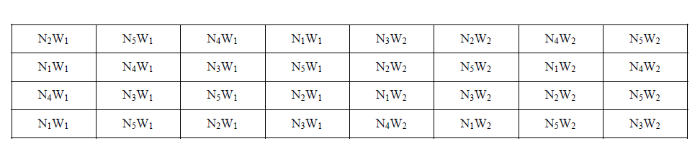
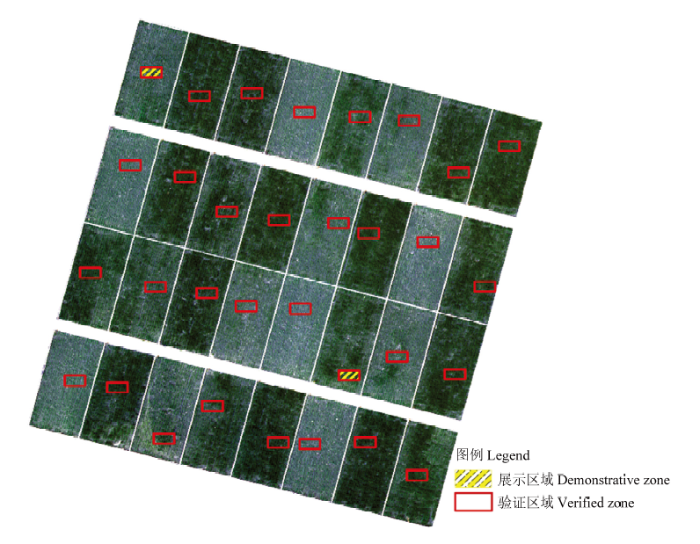
1.1.2 ��С��ˮ����������� ������2018��10����2019��6�����й���ѧԺ����վ��116��34��13��E,36��50��00��N���ڿ�չ��Ʒ��Ϊ��ά��8�š���������2��ˮ�ִ���,5�����ʴ���,��32��С��,��С�����Ϊ10 m��5 m������,ˮ�ִ����ֱ�Ϊ90 mm��60 mm�����;���ʴ����ֱ�Ϊ0��15 000 kg��hm-2�Ƿʡ�15 000 kg��hm-2�Ƿ�+100 kg��hm-2���ʡ�15 000 kg��hm-2�Ƿ�+200 kg��hm-2���ʡ�15 000 kg��hm-2�Ƿ�+300 kg��hm-2���ʡ���������,��С������������ʩ��ͬ,����ʾ����ͼ2��ʾ��
ͼ2
 �´��ڴ�|����ԭͼZIP|����PPT
ͼ2��С��ˮ�����������ʾ��ͼ
W1��90 mm�����;W2��60 mm�����;N1����ʩ��;N2��15 000 kg��hm-2�Ƿ�;N3��15 000 kg��hm-2�Ƿ�+100 kg��hm-2����;N4��15 000 kg��hm-2�Ƿ�+200 kg��hm-2����;N5��15 000 kg��hm-2�Ƿ�+300 kg��hm-2����
Fig. 2Schematic diagram of winter wheat water and nitrogen coupling experiment
W1: 90 mm irrigation amount, W2: 60 mm irrigation amount. N1: No fertilizer; N2: 15 000 kg��hm-2 of farmyard manure; N3: 15 000 kg��hm-2 of farmyard manure and 100 kg��hm-2 of nitrogen fertilizer; N4: 15 000 kg��hm-2 of farmyard manure and 200 kg��hm-2 of nitrogen fertilizer; N5: 15 000 kg��hm-2 of farmyard manure and 300 kg��hm-2 of nitrogen fertilizer
1.2 ң������
�ֱ������״����ȿ��ںͳ���ǰ��,��С��ν��ڿ�չ���˻�����,����3DR Solo���˻���3DR,����������,����������RedEdge M����״�������MicaSense,��ʢ��,��������ȡ���Ӱ�����ݡ�����,RedEdge M����������5������,���IJ����ֱ�Ϊ���Ⲩ�Σ�475 nm�����̹Ⲩ�Σ�560 nm������Ⲩ�Σ�668 nm���������Ⲩ�Σ�840 nm���ͺ�߲��Σ�717 nm�������˻���ҵʱ,�亽���������ص��ʾ���Ϊ75%,���ڷ���ǰ����װ������ں��ڽ�Ӱ���DNֵת��Ϊ�����ʡ�����,������������˻����и߶�Ϊ50 m,��ӦӰ��ռ�ֱ���ԼΪ3.5 cm;С����������˻����и߶�Ϊ30 m,��ӦӰ��ռ�ֱ���ԼΪ2.0 cm��Pix4D ag������Pix4D,��ɣ,��ʿ�������������˻�Ӱ���ƴ�Ӻͷ����ʼ��㡣����,�������������GPS�챦GEO 7X��Trimble,����������,�������ɼ��ĸ߾��ȵ����������ݶ�Ӱ�������ξ�У����1.3 �Ľ��ij߶Ȳ����Զ�ȷ������
���о���WLV�����Ļ�����,�ۺϿ��Ƕ�����ͬ���ԺͶ��������������Ľ�������WLV�������LV������,�����������ڶ�����Ϊ�ö�����������;�����������ľֲ�����,Ȼ�����ж����������ֲ������������ֵ��ΪWLVֵ������,�ڼ���������ֲ�����ʱ,�����ڶ������������Ķ��������ڶ���Ĺ����߳��ij˻���ΪȨ�ء�WLV�ļ��㷽���繫ʽ��1������3����ʾ�����Կ���,WLV�������ؼ�������������,û�г�ֿ��Ƕ�����ͬ���ԡ����,���о���WLV�Ļ��������Ӷ�����ͬ���Եļ���,�Ա����ʾͬ����,�ڹ�ʽ��2���Ļ����ϼ�ȥ�����ڱ������,Ϊ�˱�����ָ��Ƿ�ָ�����,��1/A(u)��Ϊ������ͬ���Ե�Ȩ��,��1-1/A(u)��Ϊ����������Ե�Ȩ�ء����о����Ľ���ķ�����֮Ϊ�Ľ���Ȩ�ֲ��������improved weighted local variance,IWLV��,�����繫ʽ��4���ͣ�5����ʾ��Ӱ��ָ������,���ָ������Ŀ��ijߴ����ʱ,��������������,ͬ������С,��ʱ��IWLVֵ���������������·ָ�����IWLVֵ,����Ϊ���ʽ��,WLV(R)Ϊ�ָ���R�ļ�Ȩ�ֲ�����;#BΪ������;BΪ���μ���;bΪ���μ���B�е�һ�����Σ�Ϊ��������ͬ���ε���������,�Ը���������һ��������;uΪ�ָ���R�е�һ������;P(u)Ϊ����u��Ȩ��,�ڴ�����Ϊ1,��ʾÿ�������IWLVE�ڼ���IWLVʱͬ����Ҫ;WLVE(u, b)Ϊ����u�ڲ���b�ϵļ�Ȩ�ֲ�����,�����繫ʽ��2����ʾ��
ʽ��,N(u)Ϊ����u���������,����u����;vΪN(u)�е�һ������;Q(v)Ϊv��Ȩ��,�ɶ���v������Ͷ���u��v�����߳��ij˻��������;mb(v)Ϊ����v�ڲ���b�ϵľ�ֵ;mb(N(u))Ϊ����u����������ڲ���b�ϵļ�Ȩ��ֵ,�������ʽ��3����
ʽ��,IWLV(R)Ϊ�ָ���R�ĸĽ���Ȩ�ֲ�����;IWLVE(u, b)��ʾ����u�ڲ���b�ϵĸĽ���Ȩ�ֲ�����,�������ʽ��5����
ʽ��,STDb(u)Ϊ����u��b�����ϵ��ڲ�����,A(u)Ϊ�����u���ڵĶ��������
1.4 ���ݷ�������
Ϊ��֤IWLV����,���о���WLV��������бȽϡ��Ƚ�ʱ,ѡ��Ŀǰ������Ӱ��ָ��֮һ��ֵƯ���㷨��Ϊ�ָ��㷨,�����ڻ�ȡ�����ס�С��������Ʋ�ͬ�ıȽ��龰������,���װ�2�������ڡ�5�����ʴ�����Ϊ10�ַָ���������ȿ��ڲ�ͬ���ʴ�����NiS1��ʾ,����ǰ�ڲ�ͬ���ʴ�����NiS2��ʾ,i��ʾ����1��5,��Ӧͼ1��ʾ��ͬʩ������;С��2��ˮ�ִ�����5�����ʴ���Ҳ��Ϊ10�ַָ��,�ֱ���NiWj��ʾ��i��ʾ����1��5,j��ʾ����1��2,�ֱ��Ӧͼ2��ʾ��ͬʩ���������������Ҫ˵������ÿ���龰������ظ�С����Ϊһ���������ָ���ݴ�����,�ֱ�Բ�ͬ�������зָ�߶ȵ�ѡ��ͷָ�������֤������,���ݽ��뾭��,�ۺϿ���Ӱ��ֱ��ʺ�Ŀ���С,���о����߶Ȳ�����Χ����Ϊ5��90֮��,����5Ϊ��������,���������ۺ���ֵ�����ÿ�ֳ���,���ȷֱ���㲻ͬ�߶Ȳ����µ�WLV��IWLVֵ,�õ���������WLV��IWLV��߶ȱ仯ͼ;���,�ֱ���WLV��IWLV���ֵ����Ӧ�ij߶Ȳ���ֵ��ΪӰ��ָ�����ų߶�,��ȡ��Ӧ�ָ���;���,���龰�����С���ڷֱ��������1 m��2 m�ľ���,�ھ����ڲ����˻�������ʽ���зָ�,��������WLV��IWLV�ľ��ȡ���������,���õ��߶ȶ��ȣ�single-scale object accuracy,SOA��[28]��Ϊ����ָ�ꡣSOA�Ǽ���ָ�������ʵ������Ƴ̶ȵ�ָ��,ȡֵ��Χ��0��1֮��,��������繫ʽ��6������7����ʾ������,SOAԽС,�����ָ���Ƿ�ָ����ָ�����Խ����;SOAԽ��,˵���ָ�������ʵ���Խ�ӽ�������,�˻������ָ�ʱ,��WLV��IWLV������õ����ŷָ�߶Ȳ���ȡƽ�����ָ�Ӱ��,�������˹�Ŀ�ӽ���ķ����Էָ�������������
ʽ��,Ru��ʾ�ο��ָ�Ӱ���еĶ���;Pv��ʾ�����۷ָ�Ӱ���еĶ���;#P��ʾ�����۷ָ�Ӱ���ж���ĸ�����
2 ���
2.1 Ӱ��������
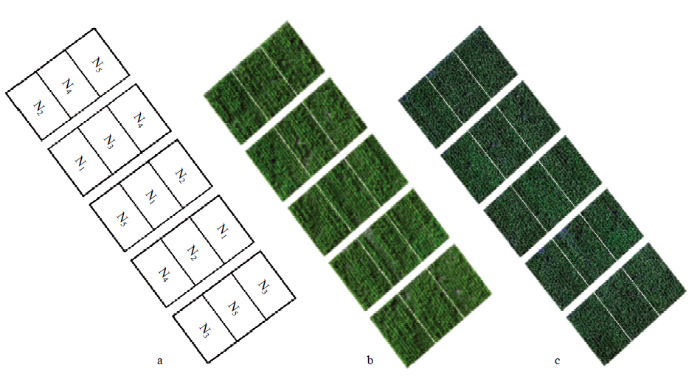
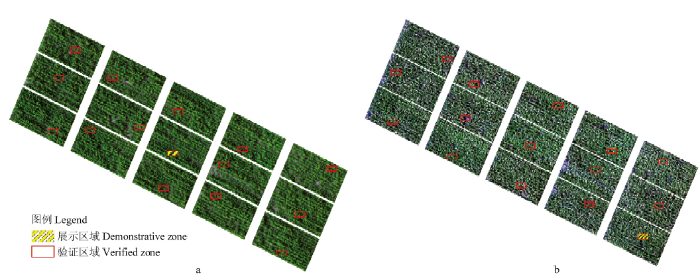
��ͬ����Ĺڲ�ṹ��ͬ,����С��Ľṹ����ϴ�,���ͨ���Ϳ����˻���ȡ��Ӱ��Ҳ���нϴ���졣��ͼ3��4���Կ���,���о���ȡ��С��Ӱ�������Ӱ���������Եø�Ϊϸ��,��ͬ����С������ɫ�Աȶ�Ҳ����������������ϴ�,�ڸ߷ֱ������˻�Ӱ���и�����Ϣ���ֵñȽ�����,Ӱ��������Ҳ�Եø�Ϊ�ֲ�;�ڲ�ͬ��ˮ���ʴ�����,��С��С��չ�ֳ����Եij��Ʋ���,��������ˮ���ʵ����ӳ��Ƹ��š�����,�Ա�ͼ3-b��ͼ3-c,���Կ����������׳���ǰ�ڵ�ֲ��ȴ����ȿ��ڵ�ֲ�����ï�ܡ�������˵,���о���ȡ�����ݾ��нϸ��ӵij���,��Ϊ������ĶԱ��ṩ�ܺõ�֧�š�ͼ3
 �´��ڴ�|����ԭͼZIP|����PPT
ͼ3��������С��ʾ��ͼ��a���������ȿ��ڣ�b��������ǰ�ڣ�c�������˻�Ӱ��
N1��N5�ֱ��ʾ0��70��140��210��280 kg��hm-2���ʴ���
Fig. 3Schematic diagram of corn experiment (a) and corn drone images of bellmouth growth stage (b) and before heading growth stage (c)
N1-N5 represent applied nitrogen at 0, 70, 140, 210, 280 kg��hm-2
ͼ4
 �´��ڴ�|����ԭͼZIP|����PPT
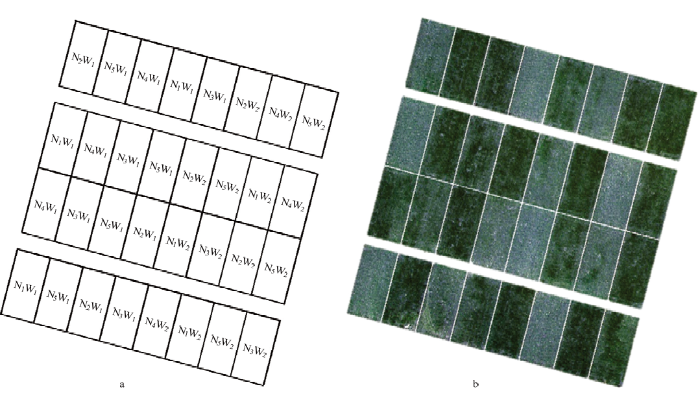
ͼ4��С������С��ʾ��ͼ��a����С��ν������˻�Ӱ��b��
W1��90 mm�����;W2��60 mm�����;N1����ʩ��;N2��15 000 kg��hm-2�Ƿ�;N3��15 000 kg��hm-2�Ƿ�+100 kg��hm-2����;N4��15 000 kg��hm-2�Ƿ�+200 kg��hm-2����;N5��15 000 kg��hm-2�Ƿ�+300 kg��hm-2����
Fig. 4Schematic diagram of wheat experiment (a) and drone image of wheat jointing growth stage (b)
W1: 90 mm irrigation amount, W2: 60 mm irrigation amount. N1: No fertilizer; N2: 15 000 kg��hm-2 of farmyard manure; N3: 15 000 kg��hm-2 of farmyard manure and 100 kg��hm-2 of nitrogen fertilizer; N4: 15 000 kg��hm-2 of farmyard manure and 200 kg��hm-2 of nitrogen fertilizer; N5: 15 000 kg��hm-2 of farmyard manure and 300 kg��hm-2 of nitrogen fertilizer
2.2 ����Ӱ��ָ���
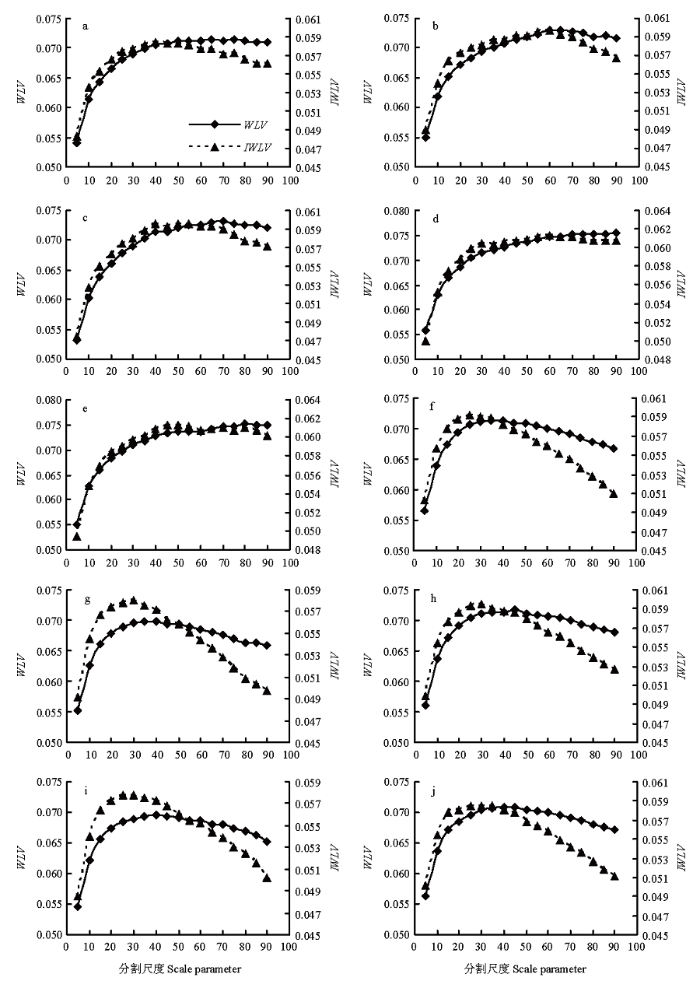
2.2.1 ���ų߶Ȳ���ѡ�� ���ֳ�����WLV��IWLV��߶Ȳ���ֵ�仯�����ͼ5��ʾ�����Կ���,�����WLV,IWLV��߶Ȳ�������,���������½������Ƹ������ԡ���������ӿ��Ƕ����ڲ�ͬ���Ժ�,IWLV����WLV���Էָ�߶ȱ仯����ķָ����������С�����,����������WLV����IWLV��ѡ�������ų߶Ȳ���ֵ����1��ʾ���ӱ��п��Կ���,���ָ������IWLV��ѡ�ij߶Ȳ���ֵ����WLV����ѡ�ij߶Ȳ���ֵС,˵��IWLV�������WLV�������Ӱ��ָ�ø�ϸ������,�ԱȲ�ͬ�����ڵķָ���,���Է������׳���ǰ�ڸ������µ���ѳ߶Ȳ���ֵ�ձ�ȴ����ȿ��ڵ���Ӧ�߶Ȳ���ֵС������Ҫ����Ϊ����ֲ������,ҶƬ���֯,ԭ��������¶�������ڱ������γ��������¶�����߿�,ʶ����ЩС�����߿���Ҫ��С�ij߶Ȳ������Աȸ������ڲ�ͬ�����ķָ���,���������ŷָ�߶�ֵδ���ֳ������Ա仯��ͼ5
 �´��ڴ�|����ԭͼZIP|����PPT
ͼ5��������Ӱ��ͬ�ָ�߶���WLV��IWLV�仯����
ͼa��e�ֱ��ӦN1S1��N5S1,ͼf��j�ֱ��ӦN1S2��N5S2
Fig. 5Curves of WLV and IWLV under different scale parameters using corn images
Figure a-e denotes N1S1-N5S1 respectively, and figure f-j denotes N1S2-N5S2 respectively
Table 1
��1
��1��������Ӱ��WLV����IWLV���ڸ��龰ѡ������ų߶�ֵ
Table 1
| ���� Method | N1S1 | N2S1 | N3S1 | N4S1 | N5S1 | N1S2 | N2S2 | N3S2 | N4S2 | N5S2 |
|---|---|---|---|---|---|---|---|---|---|---|
| WLV | 65 | 65 | 70 | 90 | 80 | 35 | 40 | 45 | 40 | 45 |
| IWLV | 40 | 60 | 40 | 60 | 45 | 25 | 30 | 30 | 30 | 30 |
�´��ڴ�|����CSV
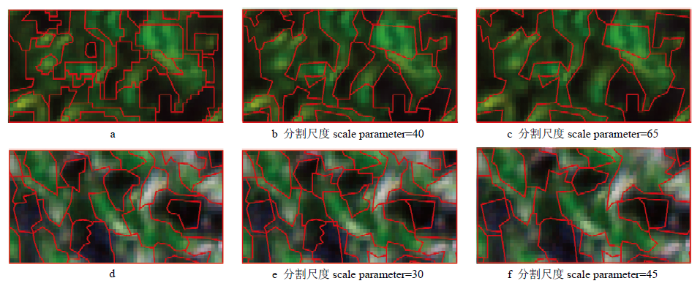
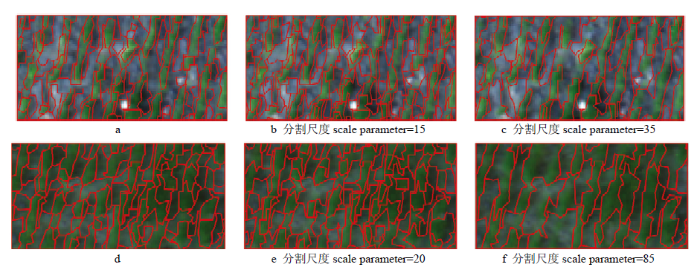
2.2.2 �ָ������ ��ǰ����,�ڸ��ָ��������ÿ��С�����������һ��1 m��2 m�ľ���,�ھ����в����˻�������ʽ���зָ�,�������������WLV����IWLV������ѡ��ij߶��·ָ����ľ��ȡ�ͼ6չʾ�˸����ηֲ����,�������¼����WLV����IWLV����SOAֵ����2��ʾ�����Կ���,���龰�»���IWLV����SOAֵҪ��WLV���ߡ�����,ͼ7չʾ����Ӱ���˻������ָ����ͷֱ����WLV����IWLV��ѡ��߶��µķָ���������,չʾ����λ����ͼ6��ʾ����ͼ�п��Կ���,IWLV��ѡ�߶ȶ�Ӧ�ķָ�����ο��ָ������ӽ�,��WLV��ѡ�߶ȶ�Ӧ�ķָ�������ڽ�Ϊ���Ե�Ƿ�ָ���Ͻ��˵��,������������Ӱ��,IWLV�����ָ�Ľ�����ȸ��ߡ�
ͼ6
 �´��ڴ�|����ԭͼZIP|����PPT
ͼ6��������Ӱ�����֤����ֲ�ͼ
a�������ȿ���;b����ǰ�� a: Bellmouth growth stage; b: Before heading growth stage
Fig. 6The distribution of verified zone using corn images
Table 2
��2
��2��������Ӱ��WLV����IWLV���ڸ��龰ѡ��߶��·ָ�����SOAֵ
Table 2
| ���� Method | N1S1 | N2S1 | N3S1 | N4S1 | N5S1 | N1S2 | N2S2 | N3S2 | N4S2 | N5S2 |
|---|---|---|---|---|---|---|---|---|---|---|
| WLV | 0.626 | 0.693 | 0.675 | 0.654 | 0.722 | 0.747 | 0.755 | 0.682 | 0.726 | 0.711 |
| IWLV | 0.770 | 0.765 | 0.767 | 0.770 | 0.795 | 0.768 | 0.811 | 0.796 | 0.807 | 0.771 |
�´��ڴ�|����CSV
ͼ7
 �´��ڴ�|����ԭͼZIP|����PPT
ͼ7��������Ӱ��ķָ���
�˻������ָ�����a��N1S1����;d��N3S2������;����IWLV��ѡ��߶ȷָ�����b��N1S1����;e��N3S2������;����WLV��ѡ��߶ȷָ�����c��N1S1����;f��N3S2������
Fig. 7Segmentation results using corn image
Segmentation result by human-machine interactive method (a: N1S1 scenario; d: N3S2 scenario); segmentation result of selected optimal scale by the IWLV method (b: N1S1 scenario; e: N3S2 scenario); segmentation result of selected optimal scale by the WLV method (c: N1S1 scenario; f: N3S2 scenario)
2.3 ��С��Ӱ��ָ���
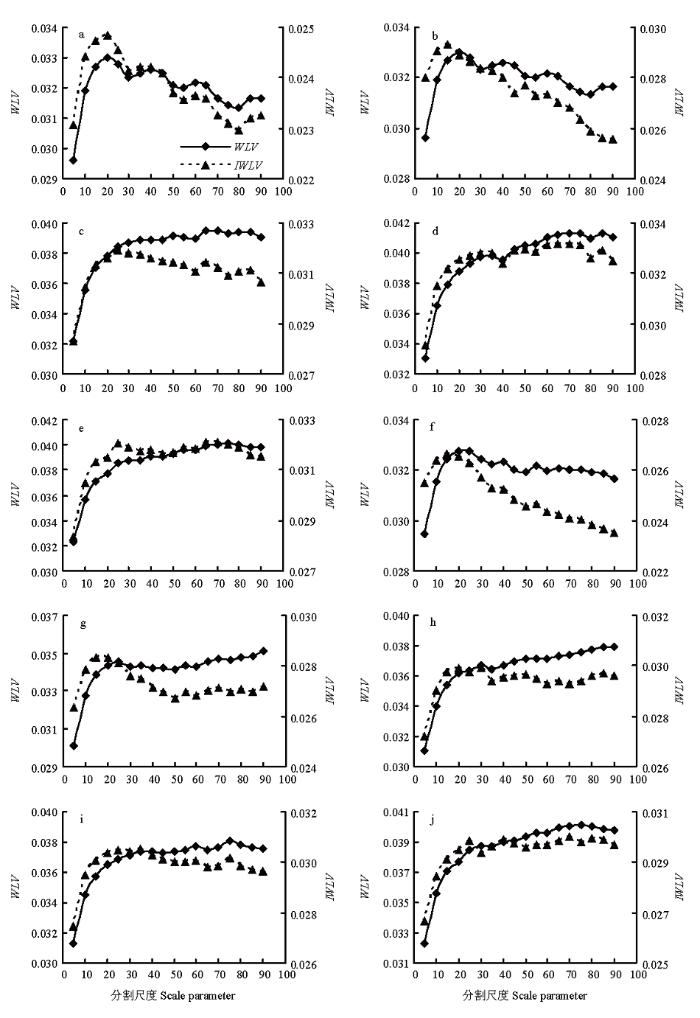
2.3.1 ���ų߶Ȳ���ѡ�� ���ֳ�����WLV��IWLV��߶Ȳ���ֵ�仯�����ͼ8��ʾ�������������,�ڸ��ָ����,���ų߶Ȳ�������,IWLV���в��������������½������Ʊ�WLV�����������ԡ�����,�ڲ��ֳ�����,��߶Ȳ�������,WLV����������ƽ����������������,������ѡ�߶Ȳ���ֵƫ�����Ͻ������,�����WLV��,���о������IWLV����С��ͬ�����¾���ȡ�ý��Ƚ��Ľ��������WLV����IWLV��ѡ���ĸ������߶�ֵ����3��ʾ���ӱ��п��Կ���,2�ַ�����N1W1��ѡ�ij߶Ȳ�����ͬ��,���������ָ����,����IWLV��ѡ�ij߶ȶ���WLV��ѡ�ij߶�С,ͬ��˵��IWLV�����WLV�����Ӱ��ָ�ø�ϸ������,���Է�������ʩ����������,ѡ�������ŷָ�߶�������������ơ�����Ҫԭ����ʩ����Сʱ,С��Ⱥ�峤�ƽ���,�����ʩ������ʱ,С��Ⱥ�峤����ʢ��Ӱ����Ҫ�������С�ij߶���ʶ�𡣲�ͬˮ�ִ���,С���Ʋ��첻����,���,ѡ�������ŷָ�߶�û�������Ա仯��ͼ8
 �´��ڴ�|����ԭͼZIP|����PPT
ͼ8����С��Ӱ��ͬ�ָ�߶Ȳ�����WLV��IWLV�仯����
ͼa��e�ֱ��ӦN1W1��N5W1,ͼf��j�ֱ��ӦN1W2��N5W2 Figure a-e denotes N1W1-N5W1 respectively, and figure f-j denotes N1W2-N5W2 respectively
Fig. 8Curves of WLV and IWLV under different scale parameters using wheat images
Table 3
��3
��3����С��Ӱ��WLV��IWLV����ѡ�ĸ��龰�����ų߶�ֵ
Table 3
| ���� Method | N1W1 | N2W1 | N3W1 | N4W1 | N5W1 | N1W2 | N2W2 | N3W2 | N4W2 | N5W2 |
|---|---|---|---|---|---|---|---|---|---|---|
| WLV | 20 | 35 | 65 | 85 | 75 | 20 | 90 | 85 | 75 | 75 |
| IWLV | 20 | 15 | 25 | 70 | 65 | 15 | 15 | 20 | 35 | 70 |
�´��ڴ�|����CSV
2.3.2 �ָ������ �����˻����������WLV����IWLV��ѡ���߶��µķָ�����������,�������4��ʾ��ͼ9չʾ����ѡ���������Ŀռ�ֲ����������4���Կ���,����N1W1�龰��,2�ַ���ȡ����ͬ��SOAֵ��,�������龰��IWLV������SOAֵ��WLV������SOAֵ�ߡ�����,ͼ10չʾ�˲���Ӱ���˻������ָ����ͷֱ����WLV����IWLV��ѡ��߶��µķָ���������,չʾ����λ����ͼ9��ʾ����ͼ�п��Կ���,IWLV��ѡ�߶ȶ�Ӧ�ָ������˻������ָ�����Ϊ�ӽ�,��WLV��ѡ�߶ȶ�Ӧ�ķָ������ڽ�Ϊ���Ե�Ƿ�ָ��������Ͻ��˵��,����С�������Ӱ��,IWLV�����ָ�Ľ�����ȸ��ߡ�
ͼ9
 �´��ڴ�|����ԭͼZIP|����PPT
ͼ9С��Ӱ����֤����ֲ�ͼ
Fig. 9The distribution of verified zone in wheat image
Table 4
��4
��4����С��Ӱ��WLV����IWLV���ڸ��龰ѡ��߶��·ָ�����SOAֵ
Table 4
| ���� Method | N1W1 | N2W1 | N3W1 | N4W1 | N5W1 | N1W2 | N2W2 | N3W2 | N4W2 | N5W2 |
|---|---|---|---|---|---|---|---|---|---|---|
| WLV | 0.675 | 0.535 | 0.548 | 0.553 | 0.661 | 0.618 | 0.430 | 0.446 | 0.536 | 0.646 |
| IWLV | 0.675 | 0.660 | 0.717 | 0.602 | 0.705 | 0.667 | 0.716 | 0.708 | 0.685 | 0.648 |
�´��ڴ�|����CSV
ͼ10
 �´��ڴ�|����ԭͼZIP|����PPT
ͼ10����С��Ӱ��ķָ���
�˻������ָ�����a��N2W1����;d��N3W2������;����IWLV��ѡ��߶ȷָ�����b��N2W1����;e��N3W2������;����WLV��ѡ��߶ȷָ�����c��N2W1����;f��N3W2������
Fig. 10Segmentation results using wheat image
Segmentation result by human-machine interactive method (a: N2W1 scenario;d: N3W2 scenario); segmentation result of selected optimal scale by the IWLV method (b: N2W1 scenario; e: N3W2 scenario); segmentation result of selected optimal scale by the WLV method (c: N2W1 scenario; f: N3W2 scenario)
3 ����
�����WLV����,���о������IWLV�����ȿ����˶����ڲ�ͬ����,�ֿ����˶����������,�������ڶ��������ΪȨ�ز���,��ͬ���Ժͼ������Ը��費ͬ��Ȩ��,���ձ���IWLV�����ܽϺý��WLV����Ƿ�ָ������,�ڸ��ָ���¶�ȡ���˸��õķָ�Ч��������,�ڻ���WLV��IWLV�ȷ�������Ӱ���Զ��ָ�ʱ,���ָ�߶Ȳ�����Χ���ù���,�����ų߶ȵ�����,�ָ����Ӱ�������Ŀ����ﵽ����1����2�����߸���Ŀ�����Ĺ�����,�����WLV��IWLVֵ���в����������,�Զ��ָ������,�趨���ʵij߶ȷ�Χ�dz���Ҫ[29],����֪ʶ��ȷ�����ų߶Ȳ���ֵ����Ҫ�������ء��ָ�߶�������С������ء�ͬһ�ֱ���Ӱ����,����ԽС�����ŷָ�߶�ԽС��������Ӱ����,���������ڴ����ȿ��ڡ�����ǰ�ڹڲ��������¢���϶,ҶƬ��������֯�γɵ������߿��С��Ϊ��Ӱ��ָ�߶ȵ���Ҫ����,����������������,����ǰ�ڵ������߿�Ҫ�ȴ����ȿ��ڵ������߿��Ϊϸ��,����Ҫ�ķָ�߶�ҲС�ڴ����ȿ��ڵķָ�߶�;С��Ӱ����,���ڰν���С��δ��¢,¢����ڴ�Ƭ��¶�ر�,С��ڲ��Ϊ��Ӱ��ָ�߶ȵ���Ҫ����,���Գ���Խ��,С������ڲ�Խ��,��ָ�߶�Խ��
����,��Էֱ��ʣ�Ӱ��ֱ�����Ŀ������С�ı�ֵ����ָ��������ء��ԱȲ�ͬ����,���Կ������ķָ��������ڶ�С��ķָ�ȡ�������Ϊ��ȻС��Ӱ��ķֱ��ʣ�2.0 cm����������Ӱ��ķֱ��ʣ�3.5 cm��,����С��ҶƬ����Լ3��10 cm������1 cm����,����ҶƬ������40��80 cm������5 cm����,�ֱ��Ӧ2.0 cm��3.5 cm�ֱ���Ӱ����˵,С��Ӱ�����Էֱ���Ҫ��������Ӱ�����Էֱ��ʡ�����,С��ָ����ľ���ֵ��SOAֵ��ҪС�����ָ�����
���о�ֻ�ǻ���С���������ݶ�WLV����IWLV�������жԱ�����,���Ҫ��һ����֤���������������ϵ�Ӧ��Ч����
4 ����
ͨ����������ͬ���Եļ���,���о���WLV�����иĽ�,���IWLV����֧��ũҵ���˻�Ӱ����Զ��ָ��������С��ͬ�����ڡ���ͬ�������������˻�Ӱ��,ͨ����Ʋ�ͬӰ��,��WLV����IWLV���ľ��Ƚ�������,�������,WLV�����Ľ�ΪIWLV����,����Ч������Ƿ�ָ��������г�����,���˻�����������õķָ������,����IWLV���Զ�ѡ��ָ�߶ȵķָ����Ȼ���WLV���Զ�ѡ��ָ�߶ȵķָ�������˸��ߵ�SOAֵ,ȡ�ø��õķָ�Ч�������,�Ľ�������������з����ľ���,������Ч֧��ũҵ���˻�Ӱ����Զ��ָ�,Ϊ��ũҵ�����ṩ����֧�š���л:
��л��־�Ρ�����Ȼ���ֵ��Ͳ�����������������и����֧�ֺͰ���;��л���ʦΪ���о������Ŀ�չ�ṩС��������ء��ο����� ԭ��˳��
������ȵ���
������������
�����ڿ�Ӱ������
[��������: 1]
[��������: 1]
[��������: 1]
DOI:10.1016/0034-4257(94)90134-1URL [��������: 1]
DOI:10.1016/0034-4257(95)00186-7URL [��������: 1]
[��������: 1]
[��������: 1]
DOI:10.3864/j.issn.0578-1752.2019.13.003URL [��������: 2]

��Objective�� Based on the high spatial resolution images of unmanned aerial vehicle (UAV), the effects of removing soil background information and increasing image texture information on the inversion of cotton plant nitrogen concentration were investigated, in order to provide new technology for accurate estimation of cotton nitrogen nutrition status. ��Method�� Cotton water and nitrogen coupling experiment was conducted, and UAV images and plant nitrogen concentration data were measured during different cotton growth stages. Based on the above data, the effect of soil background on cotton canopy spectrum was firstly investigated. Secondly, the correlations between image texture parameters and plant nitrogen concentration were analyzed. Finally, the obtained data was divided into calibration dataset and validation dataset. Different scenarios, including before and after removing the soil background, and adding texture features, were set. The inversion models of plant nitrogen concentration under various scenarios were designed by using the coupled method of spectral indexes and principal component regression, and the performances of the models were compared. ��Result�� The soil background had an effect on the cotton canopy spectrum, and the trends were not the same at different growth stages. There existed significant correlations between image texture parameters and plant nitrogen concentration. For the scenarios before removal soil background, the plant nitrogen concentration prediction model had determination coefficient (R 2) value of 0.33 and root mean square error (RMSE) value of 0.21% during model calibration, and R 2 value of 0.19 and RMSE value of 0.23% during validation. For the scenarios after removing soil background, the plant nitrogen concentration prediction model had R 2 value of 0.38 and RMSE value of 0.20% during model calibration, and R 2 value of 0.30 and RMSE value of 0.21% during validation. For the scenarios adding image texture information, the plant nitrogen concentration prediction model had R 2 value of 0.57 and RMSE value of 0.17% during model calibration, and R 2 value of 0.42 and RMSE value of 0.19% during validation. ��Conclusion�� Based on high spatial resolution images of low-altitude UAVs, both removing soil background and adding image texture information could improve the inversion accuracy of cotton plant nitrogen concentration. Image texture could be considered as important information to support prediction of crop nitrogen nutrition status using UAV images.
DOI:10.3864/j.issn.0578-1752.2019.13.003URL [��������: 2]
��Objective�� Based on the high spatial resolution images of unmanned aerial vehicle (UAV), the effects of removing soil background information and increasing image texture information on the inversion of cotton plant nitrogen concentration were investigated, in order to provide new technology for accurate estimation of cotton nitrogen nutrition status. ��Method�� Cotton water and nitrogen coupling experiment was conducted, and UAV images and plant nitrogen concentration data were measured during different cotton growth stages. Based on the above data, the effect of soil background on cotton canopy spectrum was firstly investigated. Secondly, the correlations between image texture parameters and plant nitrogen concentration were analyzed. Finally, the obtained data was divided into calibration dataset and validation dataset. Different scenarios, including before and after removing the soil background, and adding texture features, were set. The inversion models of plant nitrogen concentration under various scenarios were designed by using the coupled method of spectral indexes and principal component regression, and the performances of the models were compared. ��Result�� The soil background had an effect on the cotton canopy spectrum, and the trends were not the same at different growth stages. There existed significant correlations between image texture parameters and plant nitrogen concentration. For the scenarios before removal soil background, the plant nitrogen concentration prediction model had determination coefficient (R 2) value of 0.33 and root mean square error (RMSE) value of 0.21% during model calibration, and R 2 value of 0.19 and RMSE value of 0.23% during validation. For the scenarios after removing soil background, the plant nitrogen concentration prediction model had R 2 value of 0.38 and RMSE value of 0.20% during model calibration, and R 2 value of 0.30 and RMSE value of 0.21% during validation. For the scenarios adding image texture information, the plant nitrogen concentration prediction model had R 2 value of 0.57 and RMSE value of 0.17% during model calibration, and R 2 value of 0.42 and RMSE value of 0.19% during validation. ��Conclusion�� Based on high spatial resolution images of low-altitude UAVs, both removing soil background and adding image texture information could improve the inversion accuracy of cotton plant nitrogen concentration. Image texture could be considered as important information to support prediction of crop nitrogen nutrition status using UAV images.
URL [��������: 1]
ȷ�����ٵػ�ȡ�ؼ������ڶ�С���غ�������ũҵ�����߽�����䵪��ʩ������Ҫ�ľ������á��������˻���unmanned aerial vehicle��UAV������������������Զ�ʱ���ڻ�ȡ��С������Ϣ��ʵ�ֶԶ�С���غ�����̬��⡣���о�����2015�걱����С��ɽ��С�����˻�����Ӱ����3����ֵ�ָ���������ֲ�������������������롣�Ա�Ӱ��ָ����ʱЧ����ȷ�ԣ�����ȷ���ɼ��Ⲩ�β���ֲ��ָ��VDVI��visible-band difference vegetation index����ȡֲ����Ϣ���������鷽��Ҫ���ڲ�ͬ�ĵ�����ˮ��в�ȹ����£�����С��3���ظ�����ֳ�48������С��������С���߽���ȡС���ĺ졢�̺���ͨ����ƽ��DN��digital number��ֵ��ѡȡ25��ֲ��ָ����ͬʱ���������С����С��ͬ���ٵ�������������Է�����ɸѡ����Ӱ�����������ֲ��ָ��֮����϶Ƚϸߣ���˲������ɷַ�����ԭʼ���ݽ��гɷ���ȡ����ȡ�����������뽨ģ��������ö�Ԫ���Իع�����������ط���ģ�ͣ�ͨ������ϵ����R2������������RMSE����һ���ľ�������nRMSE��3��ָ��ɸѡ�����ģ�ͣ�̽�������ٵ��غ������������������ԡ����������ʵ����ʵ��غ�����UAV����Ӱ���ط��ݽ��������һ�¡��ڷ���ģ�������ȷ��棬3�����ݴ����������>����>ֲ��ָ��������Ч��Ҷ��>ֲ�굪>�������Զ�С��������Ϊ����ҶƬ������������Ϣ��ȡ��֤ģ�͵�R2��RMSE��nRMSE�ֱ�Ϊ0.85��0.235��6.10%���Ȳ�����Ϣ��ȡ��֤ģ�͵�R2��0.14��RMSE��nRMSE�ֱ�0.068��1.77���ٷֵ㣻��ֲ��ָ����Ϣ��ȡ��֤ģ�͵�R2��0.43��RMSE��nRMSE�ֱ�0.141��3.67���ٷֵ㡣�о�����������UAV����Ӱ�����ö�Ԫ���Իع鹹����С���غ�������ģ�ͣ�������С��������ȡ������Ϣ�ķ�ʽ���ݶ�С��Ҷ������Ч����ã���ȴ�ͳ���ݷ�����ģ���ȶ��Ը��ߣ���Ϊ��С�����ˮ�ʾ��߹����ṩ�ο���
DOI:10.1016/j.isprsjprs.2013.09.014URLPMID:24623958 [��������: 1]
The amount of scientific literature on (Geographic) Object-based Image Analysis - GEOBIA has been and still is sharply increasing. These approaches to analysing imagery have antecedents in earlier research on image segmentation and use GIS-like spatial analysis within classification and feature extraction approaches. This article investigates these development and its implications and asks whether or not this is a new paradigm in remote sensing and Geographic Information Science (GIScience). We first discuss several limitations of prevailing per-pixel methods when applied to high resolution images. Then we explore the paradigm concept developed by Kuhn (1962) and discuss whether GEOBIA can be regarded as a paradigm according to this definition. We crystallize core concepts of GEOBIA, including the role of objects, of ontologies and the multiplicity of scales and we discuss how these conceptual developments support important methods in remote sensing such as change detection and accuracy assessment. The ramifications of the different theoretical foundations between the 'per-pixel paradigm' and GEOBIA are analysed, as are some of the challenges along this path from pixels, to objects, to geo-intelligence. Based on several paradigm indications as defined by Kuhn and based on an analysis of peer-reviewed scientific literature we conclude that GEOBIA is a new and evolving paradigm.
DOI:10.1007/s10661-012-3022-1URLPMID:23255169 [��������: 1]
Discrete trees and small groups of trees in nonforest settings are considered an essential resource around the world and are collectively referred to as trees outside forests (ToF). ToF provide important functions across the landscape, such as protecting soil and water resources, providing wildlife habitat, and improving farmstead energy efficiency and aesthetics. Despite the significance of ToF, forest and other natural resource inventory programs and geospatial land cover datasets that are available at a national scale do not include comprehensive information regarding ToF in the United States. Additional ground-based data collection and acquisition of specialized imagery to inventory these resources are expensive alternatives. As a potential solution, we identified two remote sensing-based approaches that use free high-resolution aerial imagery from the National Agriculture Imagery Program (NAIP) to map all tree cover in an agriculturally dominant landscape. We compared the results obtained using an unsupervised per-pixel classifier (independent component analysis-[ICA]) and an object-based image analysis (OBIA) procedure in Steele County, Minnesota, USA. Three types of accuracy assessments were used to evaluate how each method performed in terms of: (1) producing a county-level estimate of total tree-covered area, (2) correctly locating tree cover on the ground, and (3) how tree cover patch metrics computed from the classified outputs compared to those delineated by a human photo interpreter. Both approaches were found to be viable for mapping tree cover over a broad spatial extent and could serve to supplement ground-based inventory data. The ICA approach produced an estimate of total tree cover more similar to the photo-interpreted result, but the output from the OBIA method was more realistic in terms of describing the actual observed spatial pattern of tree cover.
DOI:10.1016/j.compag.2015.03.019URL [��������: 1]
[��������: 1]
[��������: 1]
DOI:10.1016/j.rse.2006.01.013URL [��������: 1]
DOI:10.1109/LGRS.2015.2421736URL [��������: 1]
DOI:10.3390/ijgi4042292URL [��������: 1]
DOI:10.3724/SP.J.1047.2014.00902URL [��������: 1]
��������ң��Ӱ��ռ�ֱ��ʵIJ�����ߣ��������ĵ�����Ϣ��ȡ������չѸ�١�ͼ��ָ���Ϊ����������Ĺؼ�����֮һ����ָ�߶ȵIJ�������Ŀǰ���Է����ߵĶ�γ��Ժ������ж�Ϊ���ݣ�Ч�ʽϵ��ҷָ������˶��졣������WorldView2Ӱ������Ϊ������ϵ�ǰ���е����ۺͷ�����ʵ����һ�ּ�������Զ��������ɷֱ任�ĸ߷ֱ���ң��ͼ��ȫ�����ŷָ�߶�ѡȡ�㷨���Ľ�����㷨�����ɷֱ任���õ����ɷ�Ӱ����Ϊͼ��ָ�ı༭�㣬���ɷֵ�����ֵ�ٷֱ���Ϊ���������Բ����ͷָ���������ֵ��Ȩ�أ��Զ����㵱�ָ�߶ȴ�20����200ʱ�ָ�ͼ��ķָ���������ֵ��GS�����������Ϊȷ��ͼ��ָ�༭���Ƭ�������⣬����������������ֵѡȡ��GS���ֵ����Ӧ�ij߶ȼ�Ϊ���ŷָ�߶ȡ���������������ŷָ�߶�ѡȡ��������Ч������Ϊȷ���ָ�߶ȵ������ԡ�Ƭ���Ժ͵�Ч�ԣ������˸߷ֱ���Ӱ��ָ�������
[��������: 1]
DOI:10.1080/13658810903174803URL [��������: 1]
DOI:10.1016/j.isprsjprs.2013.11.018URL [��������: 1]
We introduce a new automated approach to parameterising multi-scale image segmentation of multiple layers, and we implemented it as a generic tool for the eCognition (R) software. This approach relies on the potential of the local variance (LV) to detect scale transitions in geospatial data. The tool detects the number of layers added to a project and segments them iteratively with a multiresolution segmentation algorithm in a bottom-up approach, where the scale factor in the segmentation, namely, the scale parameter (SP), increases with a constant increment. The average LV value of the objects in all of the layers is computed and serves as a condition for stopping the iterations: when a scale level records an LV value that is equal to or lower than the previous value, the iteration ends, and the objects segmented in the previous level are retained. Three orders of magnitude of SP lags produce a corresponding number of scale levels. Tests on very high resolution imagery provided satisfactory results for generic applicability. The tool has a significant potential for enabling objectivity and automation of GEOBIA analysis. (C) 2013 International Society for Photogrammetry and Remote Sensing, Inc. (ISPRS) Published by Elsevier B.V.
DOI:10.1016/j.isprsjprs.2011.02.006URL [��������: 1]
In this study, a multi-scale approach is used to improve the segmentation of a high spatial resolution (30 cm) color infrared image of a residential area. First, a series of 25 image segmentations are performed in Definiens Professional 5 using different scale parameters. The optimal image segmentation is identified using an unsupervised evaluation method of segmentation quality that takes into account global intra-segment and inter-segment heterogeneity measures (weighted variance and Moran's I, respectively). Once the optimal segmentation is determined, under-segmented and over-segmented regions in this segmentation are identified using local heterogeneity measures (variance and Local Moran's I). The under- and over-segmented regions are refined by (1) further segmenting under-segmented regions at finer scales, and (2) merging over-segmented regions with spectrally similar neighbors. This process leads to the creation of several segmentations consisting of segments generated at three different segmentation scales. Comparison of single- and multi-scale segmentations shows that identifying and refining underand over-segmented regions using local statistics can improve global segmentation results. Published by Elsevier B.V. on behalf of International Society for Photogrammetry and Remote Sensing, Inc. (ISPRS).
DOI:10.1080/01431160600617194URL [��������: 1]
DOI:10.3390/rs10020222URL [��������: 1]
URL [��������: 1]
Nowadays, the internet has been gaining social influence over China and internet media is becoming a mainstream form of publication in China. The China Earthquake Administration Website is the official web portal of the China Earthquake Administration and it is a key information platform of disaster protection andreduction during earthquake emergencies. At the same time, it is an authoritative channel and source of earthquake��related information for interested organizations, mass media and the general public. Hence, with the development of the internet, the roles of the China Earthquake Administration Website, in regard to guiding public opinions, policy propagation, communications, earthquake relief incentives, online interaction, popular science of earthquake, assisting earthquake relief, etc. all are studied.
DOI:10.1016/j.isprsjprs.2014.04.008URL [��������: 1]
Image segmentation is one of key steps in object based image analysis of very high resolution images. Selecting the appropriate scale parameter becomes a particularly important task in image segmentation. In this study, an unsupervised multi-band approach is proposed for scale parameter selection in the multi-scale image segmentation process, which uses spectral angle to measure the spectral homogeneity of segments. With the increasing scale parameter, spectral homogeneity of segments decreases until they match the objects in the real world. The index of spectral homogeneity is thus used to determine multiple appropriate scale parameters. The performance of the proposed method is compared to a single-band based method through qualitative visual interpretation and quantitative discrepancy measures. Both methods are applied for segmenting two images: a QuickBird scene of an urban area within Beijing, China and a Woldview-2 scene of a suburban area in Kashiwa, Japan. The proposed multi-band based segmentation scale parameter selection method outperforms the single-band based method with the better recognition for diverse land cover objects in different urban landscapes. (C) 2014 International Society for Photogrammetry and Remote Sensing, Inc. (ISPRS) Published by Elsevier B.V.
DOI:10.1109/LGRS.2015.2393255URL [��������: 1]
[��������: 1]
[��������: 1]
DOI:10.1016/0034-4257(87)90015-0URL [��������: 1]
DOI:10.3724/SP.J.1047.2016.00639URL [��������: 1]
���������뼼���ڸ߷ֱ���ң��Ӱ����Ϣ��ȡ�еõ��㷺Ӧ��,��Ӱ��ָ�Ļ���������������Լ���Զ���ˮƽ,�����Ƿָ����ѡ�����,�����Թ㷺ʹ�õķ��������ݻ��ָ��㷨Ϊ��,��չ�߶Ȳ���ѡ���о��������ң��Ӱ��ֱ������еľֲ�����ָ��,����߳������Ȩ��,�����Ȩ�ֲ����WLV��ָ��,�Զ���ָ�����������,����ʵ����ѳ߶Ȳ���ѡ�����齭����2.5 m��SPOT 5�ں�Ӱ���Ͻ���ʵ��,ͨ��������ѷָ������˹��ָ��������ƶȶ�WLV���ж�����֤������,����WLV�ڷָ������СΪһ����Ԫ�����Ϊ����Ӱ���ȫ��Χ�߶Ȳ����ı仯���ɽ�����ʵ��,�����������WLV��߶Ȳ����ı仯������,��ͬ����ֵ��ķָ�����ӳ��ʵ������ͬ���۲㼶�ϵİ߿�,���е�1������ֵ���Ӧ�ķָ����ܹ��Ϻõط�ӳӰ�����С��ʶ��Ԫ��
DOI:10.1109/TGRS.2014.2381632URL [��������: 1]
DOI:10.3390/rs9080769URL [��������: 1]
