 ,1
,1Estimating the Correction Coefficient of Days to 100 kg in Licha Black Pig and Its Intercross with Berkshire
ZHENG Hao1, TU JinMin2, XIONG XiuPing2, ZHANG ZeKai1, LI LongYun1, HUANG LiBin2, HUANG ZhiYong2, XIAO ShiJun1, GUO YuanMei,1通讯作者:
责任编辑: 林鉴非
收稿日期:2019-08-9网络出版日期:2020-06-16
| 基金资助: |
Received:2019-08-9Online:2020-06-16
作者简介 About authors
郑浩,E-mail:1073328211@qq.com。

摘要
关键词:
Abstract
Keywords:
PDF (1540KB)元数据多维度评价相关文章导出EndNote|Ris|Bibtex收藏本文
本文引用格式
郑浩, 涂金敏, 熊秀萍, 张则凯, 李龙云, 黄黎斌, 黄智勇, 肖石军, 郭源梅. 里岔黑猪和巴里杂交猪达100 kg体重日龄校正系数研究[J]. 中国农业科学, 2020, 53(12): 2493-2501 doi:10.3864/j.issn.0578-1752.2020.12.015
ZHENG Hao, TU JinMin, XIONG XiuPing, ZHANG ZeKai, LI LongYun, HUANG LiBin, HUANG ZhiYong, XIAO ShiJun, GUO YuanMei.
0 引言
【研究意义】达100 kg体重日龄(D100)用来度量猪只的生长速度,是种猪选育过程中一个非常重要的目标性状[1,2]。由于不能实时监测猪只的体重,且体重受采食和排泄状态等因素的影响,因此很难准确判断猪只达100 kg体重的实际日龄。在育种实践中,通常在一定的体重范围(80—105 kg)对猪只进行称重,然后利用校正系数通过校正公式来计算D100[3],因此,校正系数会直接影响D100估计值的准确性。【前人研究进展】杜洛克、长白和大白猪达50 kg[4]和100 kg体重日龄[5,6]的校正系数已见报道;地方品种达45日龄[7,8]和达50 kg体重[9]的校正系数也有报道,但D100的校正系数尚未见报道。目前,校正系数主要有两种:一种是加拿大种猪遗传改良中心采用的校正系数CF,即国家生猪产业体系2016年以前使用的校正系数[10];另一种是美国国家猪改良协会采用的校正系数A,即国家生猪产业体系目前使用的校正系数[11]。CF [12,13,14,15]和A [16,17,18]均被用来校正D100,但比较这2种校正系数的校正效果的研究报道较少[6]。【本研究切入点】里岔黑猪是山东省著名的地方品种,以多肋和大体型著称[19,20],是大型优质肉猪品种培育的理想素材[21,22],但是其生长速度较慢[23],有待于进一步选育提高。估计里岔黑猪D100的校正系数,能提高生长速度选择的准确性,加速生长速度的遗传改良。【拟解决的关键问题】本研究以里岔黑猪及其与巴克夏公猪杂交产生的杂种1代和2代为研究对象,估计它们D100校正系数CF和A,并比较CF和A的校正效果,为地方猪种及其杂交猪D100的校正提供借鉴。1 材料与方法
1.1 试验猪只
里岔黑猪和巴里猪(巴克夏公猪与里岔母猪杂交后代,包括1代和2代)均来自江西山下投资有限公司定南阳林山下原种猪场(江西,定南)[21]。该场有润农性能测定系统(深圳,润农科技)18套,每年能完成约540头猪的生长肥育测定。本研究使用的生长数据收集于2014—2019年,共计2 250头,其中里岔黑猪554头(阉公猪52头,母猪502头)、巴里1代和2代分别为941头(阉公猪48头,母猪893头)和755头(阉公猪98头,母猪657头)。在保幼期结束时,筛选健康的小猪,根据体重大小随机分组,每组12—14头。每组使用一套润农性能测定系统进行生长肥育测定,该系统会自动记录每个个体每一次采食的起止时间、采食量和体重。在肥育期间,采用统一的饲养管理方法,饲喂玉米-豆粕型全价配合饲料(可消化能为13MJ·kg-1,粗蛋白含量15%),自由采食和饮水。当测定猪只体重达100 kg左右时结束测定。
1.2 统计分析
1.2.1 数据处理和质控 从润农性能测定系统中导出每次采食的详细记录,包括测定站编号、耳号、电子耳标号、采食开始时间、采食结束时间、采食量和体重。利用个体每天所有的体重数据,剔除异常点后取平均数作为当天的体重;测定日龄等于测定日期减去出生日期。为了得到比较可靠的生长曲线,要求测定期≥30d、始测体重≥25 kg、终测体重在80—125 kg、始测日龄>60d和终测日龄<280d。用R语言(R3.4.3,维也纳,奥地利)的lm函数,对每个个体拟合日龄对体重的一元回归方程,剔除拟合度<0.7的个体(生长异常的个体)。然后利用lm函数对每个个体的一元回归方程进行优化:剔除平均体重与回归体重差异(>5 kg)最大的观测后再进行回归分析,直到所有的异常值都被剔除为止,这时得到最佳一元回归方程。计算每个个体最佳一元回归方程的截距、回归系数和拟合度,剔除拟合度小于0.95的个体,剩余个体用于后续分析。1.2.2 D100校正系数的估计 校正系数CF是两条体重对日龄回归直线斜率(回归系数)的比值。第一条直线是最佳回归直线,第二条直线是经过终测点(终测日龄和终测体重)和原点(日龄和体重均为0)的直线。第一条直线的斜率除以第二条直线的斜率就是CF。校正系数A是体重对日龄一元回归方程的截距,通过拟合体重对日龄的一元回归方程直接得到。计算出每个个体的CF和A后,取它们各自的平均数作为群体的校正系数。
1.2.3 初生重、日增重、性别和群体对校正系数的影响 用R语言的plot函数,作日增重和校正系数之间的散点图,并用cor.test函数计算它们之间的相关系数。然后用lm函数拟合一个线性模型,并用anova函数做F检验,检验初生重、日增重、性别和群体是否对校正系数产生显著影响。
1.2.4 D100的估计 根据1.2.1建立的最佳一元回归方程,代入100 kg体重,就可以计算出每个个体达100 kg体重的回归日龄(D100reg)。由于每个个体使用各自的回归系数和截距,因此D100reg可以看作D100的期望值,即真实值的无偏估计值。
利用1.2.2估计的CF和A,根据下列公式分别计算出CF和A达100 kg体重的校正日龄,即D100CF和D100A:
$D100_{CF}=终测日龄-\frac{(终测体重-100kg)×终测日龄}{终测体重×CF }$
$D100_{A}=终测日龄+(100kg-终测体重)×\frac{(终测日龄-A)}{终测体重}$
1.2.5 CF和A校正日龄的比较 为了比较CF和A的校正效果,把每个个体的D100reg作为真值,用R语言的cor.test函数计算校正日龄与D100reg的相关系数。相关系数越高,说明校正日龄越准确。用mean和sd函数,分别计算校正日龄与D100reg差值的平均数和标准差。平均数的绝对值越小,说明校正日龄越准确。标准差越小,校正日龄越精确。
1.2.6 校正系数的通用性 为了研究校正系数的通用性,把一个群体估计的校正系数去校正另两个群体的D100,然后用R语言的cor.test函数计算校正日龄与该群体D100reg之间的相关系数。相关系数越高,通用性越好。
2 结果
2.1 数据质控
一共有896头试验猪只没有通过质量控制,其中209头测定期<30d,242头始测体重<25 kg,330头终测体重不在80—125 kg之间,19头始测日龄<60d,1头终测日龄>280d,39头拟合度<0.7,66头优化后的拟合度<0.95。剩余的1 344头通过了质控,其中里岔黑猪204头(阉公猪22头,母猪182头)、巴里1代644头(阉公猪31头,母猪631头),巴里2代496头(阉公猪64头,母猪432头)。2.2 D100校正系数的估计
由于群体极显著地影响CF和A的估计值(见2.3),因此需分群体进行估计。三个群体CF和A的估计值见表1。里岔黑猪母猪的CF极显著小于巴里1代和2代的CF,巴里1代和2代的CF之间没有显著差异(P = 0.5534)。巴里2代的A极显著大于另外2个群体,另2个群体的A之间没有显著差异(P = 0.1834)。Table 1
表1
表1校正系数的简单统计量
Table 1
| 群体 Population | 系数 Coefficient | 性别 Gender | 样本数 n | 平均数 Mean | 标准差 Std. | 最小值 Min. | 最大值 Max. |
|---|---|---|---|---|---|---|---|
| 里岔黑猪 Licha black pig | A | ♂ | 22 | 60.65 | 26.17 | 5.71 | 91.81 |
| ♀ | 182 | 54.15 | 25.23 | -32.12 | 138.26 | ||
| CF | ♂ | 22 | 1.426 | 0.211 | 1.030 | 1.708 | |
| ♀ | 182 | 1.346 | 0.191 | 0.870 | 2.082 | ||
| 巴里1代 F1 of Berkshire × Licha black pig | A | ♂ | 31 | 49.92 | 21.43 | -4.58 | 81.33 |
| ♀ | 613 | 57.00 | 18.77 | -42.72 | 112.61 | ||
| CF | ♂ | 31 | 1.340 | 0.170 | 0.979 | 1.632 | |
| ♀ | 613 | 1.389 | 0.166 | 0.834 | 2.024 | ||
| 巴里2代 F2 of Berkshire × Licha black pig | A | ♂ | 64 | 54.25 | 19.07 | -1.10 | 87.49 |
| ♀ | 432 | 57.53 | 21.50 | -32.12 | 138.26 | ||
| CF | ♂ | 64 | 1.372 | 0.162 | 0.995 | 1.699 | |
| ♀ | 432 | 1.380 | 0.174 | 0.870 | 2.082 |
新窗口打开|下载CSV
在里岔群体中阉公猪的校正系数都大于母猪相应的校正系数,而在巴里杂交猪中阉公猪的校正系数均小于母猪相应的校正系数。
2.3 初生重、日增重、性别和群体对校正系数的影响
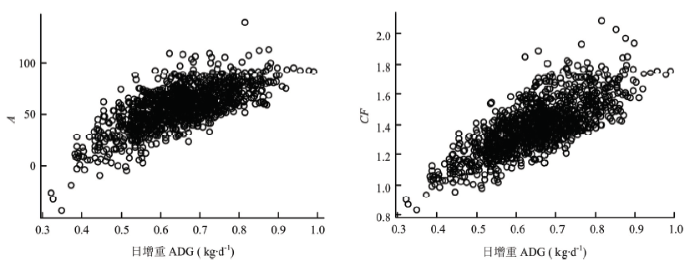
方差分析结果显示初生重对CF(P = 1.6×10⁻⁸)和A(P = 5.2×10⁻¹¹)均产生极显著影响。从日增重和校正系数的散点图(图1)可以看出:日增重极显著地影响CF(P<2.2×10⁻¹⁶)和A(P<2.2×10⁻¹⁶),并与它们存在显著的线性关系,相关系数分别为0.6932(P<2.2×10⁻¹⁶)和0.7424(P<2.2×10⁻¹⁶)。性别对校正系数CF(P = 0.1759)没有影响,但对A(P = 0.0013)产生显著影响。群体极显著地影响CF(P = 0.0089)和A(P = 0.0017)的估计。图1
 新窗口打开|下载原图ZIP|生成PPT
图1校正系数与日增重之间的散点图
Fig. 1Scatter plots between adjusted coefficients and ADG
2.4 D100的估计结果
D100reg的简单统计量见表2。在这3个群体种中,里岔黑猪D100最大,平均为236.23d;其次是巴里2代,平均为215.78d;巴里1代最短,平均为208.93 d。Table 2
表2
表2达100 kg体重回归日龄的简单统计量
Table 2
| 群体 Population | 性别 Gender | 头数 No | 平均数 Mean | 标准差 sd. | 最小值 Min. | 最大值 Max. |
|---|---|---|---|---|---|---|
| 里岔黑猪 Licha black pig | ♂ | 22 | 223.25 | 18.52 | 189.96 | 265.41 |
| ♀ | 182 | 237.80 | 18.89 | 192.90 | 285.89 | |
| 巴里1代 F1 of Berkshire × Licha black pig | ♂ | 31 | 200.32 | 12.45 | 179.95 | 230.12 |
| ♀ | 613 | 209.37 | 15.77 | 171.17 | 268.98 | |
| 巴里2代 F2 of Berkshire × Licha black pig | ♂ | 64 | 206.67 | 17.16 | 174.14 | 241.33 |
| ♀ | 432 | 215.44 | 17.46 | 170.05 | 274.46 |
新窗口打开|下载CSV
2.5 CF和A校正日龄的比较
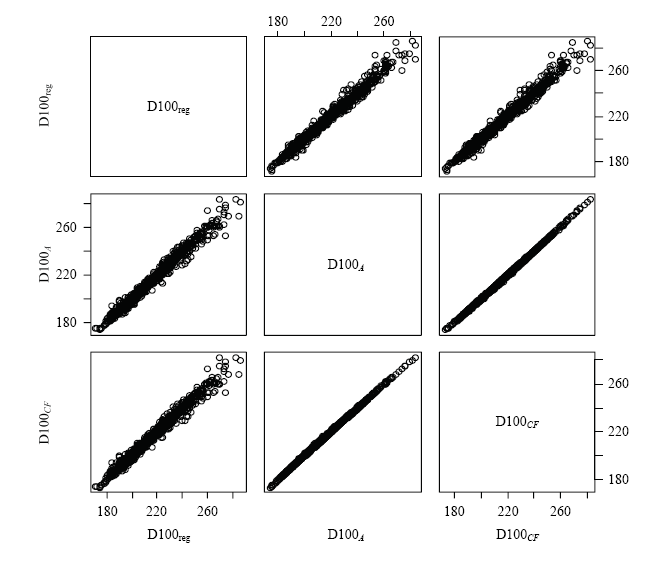
图2是D100reg、D100A和D100CF的散点图。从图中可以看出它们之间呈强相关,尤其是D100CF和D100A之间。D100CF和D100A与D100reg之间的相关系数分别为0.9918(P<0.0001)和0.9917(P<0.0001),D100CF和D100A之间的相关系数为0.9998(P<0.0001)。图2
 新窗口打开|下载原图ZIP|生成PPT
图2回归日龄和校正日龄之间的散点图
Fig. 2Scatter plots between regressive and adjusted days to 100 kg
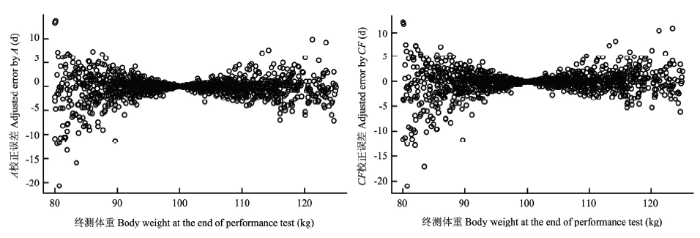
D100CF和D100A与D100reg差值的平均数分别为-0.1385和-0.2741d,标准差分别为2.5532和2.5446d,差异均不显著(P>0.05)。图3是D100CF和D100A与D100reg之差与终测体重之间的散点。终测体重离目标体重(100 kg)越远,D100CF和D100A的误差越大。
图3
 新窗口打开|下载原图ZIP|生成PPT
图3校正日龄减回归日龄之差与终测体重之间的散点图
Fig. 3Scatter plots between body weight at the end of performance test and the difference of adjusted and regressive days to 100 kg
2.6 校正系数通用性结果
表3是用另2个群体的校正系数去校正某个群体的D100CF和D100A与该群体D100reg之间的相关系数。这些相关系数都在0.979以上,且都达到极显著水平(P<0.0001)。Table 3
表3
表3校正系数通用性结果
Table 3
| 来源群体Original population | 校正系数Correction coefficient | LC | BL1 | BL2 | ||
|---|---|---|---|---|---|---|
| 里岔黑猪 Licha black pig (LC) | A | - | 0.9793 | 0.9794 | ||
| CF | - | 0.9800 | 0.9800 | |||
| 巴里1代 F1 of Berkshire × Licha black pig (BL1) | A | 0.9904 | - | 0.9908 | ||
| CF | 0.9905 | - | 0.9907 | |||
| 巴里2代 F2 of Berkshire × Licha black pig (BL2) | A | 0.9930 | 0.9935 | - | ||
| CF | 0.9932 | 0.9937 | - | |||
新窗口打开|下载CSV
3 讨论
本研究估计了里岔黑猪及其与巴克夏杂交1代和2代D100的校正系数CF和A,并比较了它们的校正效果,为里岔黑猪D100的校正以及校正系数CF和A的选择提供参考。提高肉猪的上市体重,能够改善肉质[24],增大眼肌面积[25],降低每公斤猪肉的分摊成本,提高经济效应[26],增加肉猪上市体重已经成为一种趋势[27,28,29]。因此,达110 kg体重日龄可能会逐渐取代现行的D100,成为未来种猪选育的目标性状。根据体重和日龄之间近似的线性关系,D100的校正系数也可以用于达110 kg体重日龄的估计,但是需要把终测体重调整到95—125 kg之间,以降低估计的误差。
里岔黑猪D100的校正系数与杜洛克、长白和大白的校正系数不一样。里岔黑猪的校正系数A大于美国国家猪改良协会[30]和国家生猪产业体系[11]杜洛克、长白和大白相应的校正系数A,也大于韩国猪性能测定中杜洛克、长白和大白达90 kg体重日龄使用的校正系数A[31]。里岔黑猪的校正系数CF小于加拿大种猪遗传改良中心杜洛克、长白和大白D100的校正系数CF[3]。借鉴这些猪种的校正系数会降低里岔黑猪D100估计的准确性,从而影响生长速度的选择效果。
校正系数A和CF都是通过建立日龄对体重的直线回归方程来校正D100,但在建立线性模型时略有不同。校正系数A利用终测点(终测体重,终测日龄)和截距(0,A)来计算回归系数,并建立回归方程:
$日龄=A+\frac{终测日龄-A}{终测体重}×体重$
把终测点和目标点(100 kg,达100 kg体重日龄)分别代入上述回归方程,得到下列方程组:
$D100_{CF}=终测日龄-\frac{(终测体重-100kg)×终测日龄}{终测体重×CF }$
$\bigg{\{}终测日龄=A+\frac{终测日龄-A}{终测体重}×终测体重\\D100_A=A+\frac{终测日龄-A}{终测体重}×100kg体重$
两式相减,经过简单转换后就可以得到校正公式(见1.2.4)。
校正系数CF则利用终测点和原点(0,0)来计算回归系数。这个回归系数(相当于全程ADG)比实际的回归系数(相当于测定期ADG)小,所以需要把全程回归系数校正成实际的回归系数,即乘以校正系数CF(测定期ADG与全程ADG的比值)。日龄对体重的回归方程:
$日龄=终测日龄-\frac{终测日龄}{终测体重×CF}×(终测体重-体重)$
把体重 = 100 kg代入上式,就可以得到D100的CF校正公式(见1.2.4)。
CF的校正日龄和A的校正日龄之间没有显著差异(P = 0.8247),相关系数为0.9998(P<0.0001),说明它们的校正效果几乎一致(图2)。它们的校正日龄与回归日龄之间也不存在显著差异(P值分别为0.7312和0.8613),与回归日龄的相关系数均大于0.9837(P<0.0001),说明它们的校正准确性都很高。目前,校正系数CF [12,13,14]和A [16,17,18]均被用来校正D100,也间接说明它们的校正效果没有显著差异,否则校正效果差的校正系数将会被另一种校正系数所取代。这一结果与张哲等的研究结果不同,他们的研究结果显示校正系数A的校正效果优于校正系数CF的校正效果[6]。根据他们的这一结果,国家生猪产业体系用校正系数A替换了原来使用的校正系数CF[11]。
终测体重与目标体重越接近,校正日龄的误差就越小(图3)。但在生产实践中,终测体重与目标体重越接近,操作起来就越困难。在选择终测体重范围时,既要考虑校正误差,又要兼顾可操作性。当终测体重与目标体重的差异在15 kg以内时,即终测体重的范围为30 kg,校正误差较小(平均误差在5 kg以内,误差小于5%)。因此,目标体重为100 kg和110 kg时终测体重分别为85—115 kg和95—125 kg比较适宜。
校正系数受许多因素的影响,如日增重、群体、性别等,但是日增重对它的影响最大(P<2.2×10⁻¹⁶)。从校正系数A和CF与日增重之间的散点图(图1)和它们之间的相关系数可以看出:日增重越大的个体,其A和CF也越大。
群体也极显著地影响校正系数,不同群体中A (P = 0.0017)和CF(P = 0.0089)存在显著差异。由于校正系数是体重和日龄的函数,因此它受体重和日龄的影响,特别是初生重(P≤1.6×10⁻⁸)和日增重(P<2.2×10⁻¹⁶)。群体间初生重和日增重(数据略)均存在极显著的差异(P<2.2×10⁻¹⁶),从而导致群体间的校正系数存在极显著差异。
性别对校正系数A(P = 0.0013)的影响显著,但是对CF(P = 0.1759)的影响不显著,其主要原因可以是阉公猪数量较少造成检验效率偏低。由于不同性别的猪只生长速度是不一样的[32,33],因此在校正D100时应根据猪只的性别使用相应的校正系数。加拿大种猪遗传改良中心[3]和国家生猪产业技术体系[11]在校正D100时不同性别使用不同的校正系数。但是也有不分性别,公母猪使用同一个校正系数,如美国国家猪改良协会[30]。
校正系数是体重和日龄的函数,因此受生长曲线的影响。虽然本研究使用的3个群体有一定的亲缘关系,但是它们的生长曲线并不一致,从达100kg体重日龄就可以看出(表2)。巴里1代达100kg体重日龄最短,巴里2代其次,而里岔黑猪最长,差异极显著(P<2.2×10⁻¹⁶)。巴里猪是巴克夏公猪和里岔母猪杂交的后代,生长速度显著高于里岔黑猪。用巴里群体的校正系数去校正里岔黑猪群体D100,校正效果很好。由于里岔黑猪的生长曲线与大部分地方猪种比较相似,因此推测用里岔黑猪的校正系数去校正其他地方品种,其校正效果也会较好。
4 结论
里岔黑猪和巴里猪D100的校正系数A和CF与国家生猪产业体系使用的A和CF有较大差异。A和CF的校正效果没有显著差异,当结测体重在85—115 kg时,它们对D100的校正效果都非常好。在本研究的3个群体中,用另外2个群的校正系数来校正某个群体的D100,其校正效果也非常好,说明里岔黑猪D100的校正系数可以为其他地方猪种D100的估计提供参考。致谢:
本研究得到江西农业大学省部共建种猪遗传改良与养殖技术国家重点实验室主任黄路生教授的大力支持。参考文献 原文顺序
文献年度倒序
文中引用次数倒序
被引期刊影响因子
DOI:10.1371/journal.pone.0139207URLPMID:26418247 [本文引用: 1]

In this study, 796 male Duroc pigs were used to identify genomic regions controlling growth traits. Three production traits were studied: food conversion ratio, days to 100 KG, and average daily gain, using a panel of 39,436 single nucleotide polymorphisms. In total, we detected 11 genome-wide and 162 chromosome-wide single nucleotide polymorphism trait associations. The Gene ontology analysis identified 14 candidate genes close to significant single nucleotide polymorphisms, with growth-related functions: six for days to 100 KG (WT1, FBXO3, DOCK7, PPP3CA, AGPAT9, and NKX6-1), seven for food conversion ratio (MAP2, TBX15, IVL, ARL15, CPS1, VWC2L, and VAV3), and one for average daily gain (COL27A1). Gene ontology analysis indicated that most of the candidate genes are involved in muscle, fat, bone or nervous system development, nutrient absorption, and metabolism, which are all either directly or indirectly related to growth traits in pigs. Additionally, we found four haplotype blocks composed of suggestive single nucleotide polymorphisms located in the growth trait-related quantitative trait loci and further narrowed down the ranges, the largest of which decreased by ~60 Mb. Hence, our results could be used to improve pig production traits by increasing the frequency of favorable alleles via artificial selection.
[本文引用: 1]
[本文引用: 1]
[本文引用: 3]
[本文引用: 3]
DOI:1000-2421(2010)04-0469-06URL [本文引用: 1]
Based on the earlier reports that the saturation model was the most optimal model for prediction of relationship between age and body weight,and the linear model is the most optimal model for prediction of relationship between body weight and backfat thickness of three commercial pig breeds.However,in this study,we adjusted the equations for days and backfat thickness at 50 kg body weight.The robustness for the adjusted equations were evaluated by the simple correlation analysis(CORR) and canonical correlation analysis(CANCORR),between the early and whole period revision value,and the results all reached the extreme difference.It proved that the adjusted equations were suitable,and statistically evident between the early and the entire period traits.Additional,we chose the typical comprehensive index model to carry on comprehensive assess for early and entire period performance,and the Spearman’s rank correlation reached the extreme difference for total selection index between two periods.It showed that the early selection was viable,had very high consistency with the entire period selection under definitely choosing strength.These revised expressions of the expected traits had potential application for breeding selection in farm.??
[D].
[本文引用: 1]
[D].
[本文引用: 1]
[本文引用: 3]
[本文引用: 3]
[本文引用: 1]
[本文引用: 1]
[本文引用: 1]
[本文引用: 1]
[本文引用: 1]
[本文引用: 1]
[本文引用: 1]
[本文引用: 1]
DOI:10.21873/invivo.11945URLPMID:32354962 [本文引用: 4]
BACKGROUND/AIM: In percutaneous radiotherapy dose-distribution and volumetric-load of normal tissue varies in different radiation-techniques. Haematotoxicity may lead to deficiencies of the immune and blood system or to secondary malignancies. Therefore, regular blood-counts are carried out during fractionated radiotherapy. The aim was to investigate patient haemogram courses during radiotherapy of localised prostate-cancer treated with different radiation-techniques (n=3). PATIENTS AND METHODS: In this prospective study, blood count changes were examined during fractionated radiotherapy (3D-conformal-RT/step-and-shoot-IMRT/helical-IMRT) on the prostate-region in localised prostate-cancer cases (n=50). RESULTS: The whole patient group displayed a small but significant reduction in leukocytes. This reduction was higher in the two IMRT groups compared to the 3D-group but without any case of leukopenia. Haemoglobin- or thrombocyte-levels did not significantly change. CONCLUSION: Regardless of the delivery mode used, localised fractionated irradiation of prostate region did not cause any clinically relevant haemogram changes in this study. These findings question the necessity of regular blood counts during fractionated radiotherapy of the prostate region for patients without any risk factors.
DOI:10.4141/A99-121URL [本文引用: 2]
DOI:10.1016/S2095-3119(16)61381-3URL [本文引用: 2]
DOI:10.5713/ajas.2004.1223URL [本文引用: 2]
DOI:10.1038/s41598-019-45919-0URLPMID:31273229 [本文引用: 1]
Socially affected traits are affected by direct genetic effects (DGE) and social genetic effects (SGE). DGE and SGE of an individual directly quantify the genetic influence of its own phenotypes and the phenotypes of other individuals, respectively. In the current study, a total of 3,276 Large White pigs from different pens were used, and each pen contained 10 piglets. DGE and SGE were estimated for six socially affected traits, and then a GWAS was conducted to identify SNPs associated with DGE and SGE. Based on the whole-genome re-sequencing, 40 Large White pigs were genotyped and 10,501,384 high quality SNPs were retained for single-locus and multi-locus GWAS. For single-locus GWAS, a total of 54 SNPs associated with DGE and 33 SNPs with SGE exceeded the threshold (P < 5.00E-07) were detected for six growth traits. Of these, 22 SNPs with pleiotropic effects were shared by DGE and SGE. For multi-locus GWAS, a total of 72 and 110 putative QTNs were detected for DGE and SGE, respectively. Of these, 5 SNPs with pleiotropic effects were shared by DGE and SGE. It is noteworthy that 2 SNPs (SSC8: 16438396 for DGE and SSC17: 9697454 for SGE) were detected in single-locus and multi-locus GWAS. Furthermore, 15 positional candidate genes shared by SGE and DGE were identified because of their roles in behaviour, health and disease. Identification of genetic variants and candidate genes for DGE and SGE for socially affected traits will provide a new insight to understand the genetic architecture of socially affected traits in pigs.
DOI:10.1007/s13353-017-0405-6URLPMID:28890999 [本文引用: 2]
Growth and fatness traits are economically important in the pig industry. To dissect the genetic architecture of these traits in commercial pigs, we conducted a genome-wide association study (GWAS) for carcass weight, backfat thickness, and body weight in two commercial populations: Duroc x (Landrace x Yorkshire) (DLY) and Duroc populations. To enhance the detection power, three GWAS approaches including single-trait GWAS, multi-trait GWAS and meta-analysis were used in this study. A total of 13 suggestive loci were identified on nine chromosomes. The most significant locus was detected at 272.05 Mb on SSC1, and it was associated with backfat thickness at the first rib in the DLY population. Three genes at the identified loci (TBC1D1, BAAT and PHLPP1) were highlighted as functionally plausible candidate genes for pig growth and fatness traits. Genome-wide significant locus was not evidenced in this study, indicating that large populations are required to identify QTL with minor effects on growth and fatness traits in commercial pig populations, in which intensively artificial selections have been imposed on these traits and small genetical variances usually retain in these traits.
DOI:10.1016/j.livsci.2012.01.017URL [本文引用: 2]
The purpose of this study was to determine the genetic and phenotypic relationships between litters per sow per year (LSY) and other economically important reproductive and post-weaning traits from data collected in a commercial swine breeding company. Determining the genetic and phenotypic correlations among traits can help breeders evaluate the expected impacts their selection decisions have on other economically important production traits when they are included in a selection index. This is particularly important when considering reproductive and post-weaning traits due to possible undesirable genetic relationships. A total of 32,653 litter records from 7674 sows from 4 herds within a single production system (same genetics, same animal feeding specifications, same management procedures, etc.) were used in this study. The sows were born between 1992 and 2009. Post-weaning traits were recorded on male and female pigs (44,040 records), including sows and their progeny. The reproductive traits collected included number born alive (NBA), and wean to estrus (W2E). Number born alive and wean to estrus interval were recorded for every litter. Back fat between the 3rd and 4th last lumbar vertebrae and back fat and muscle thickness between the 3rd and 4th last rib were measured. Adjusted back fat (BF), percent lean (PCL), days to 100 kg (D100), and litters per sow per year (LSY) were calculated based on recorded information. Genetic parameters were estimated using ASREML The heritability estimates for NBA, LSY, W2E, BF, 0100, and PCL were 0.15, 0.03, 0.03, 0.41, 0.28, and 0.36, respectively. The genetic correlation between LSY and W2E was large, numerically negative, and favorable. The genetic correlations between LSY and the three post-weaning traits (BF, 0100, and PCL) had large standard errors and were unclear in direction. Some economically important traits can be improved indirectly with selection on LSY; however, a selection index will be needed to ensure that post-weaning traits are not adversely affected by selection for LSY in a maternal line breeding program. (C) 2012 Elsevier B.V.
DOI:10.2527/1993.713595xURLPMID:8463145 [本文引用: 2]
Correlated responses in reproductive and carcass traits from a line of Landrace pigs selected for increased 200-d weight along with a randomly selected control line were studied in 195 litters (109 select, 86 control) and 285 pigs (132 select, 153 control). Reproductive and maternal traits studied included litter sizes born, born alive, and alive at 21 d and litter weights at birth and at 21 d. Carcass traits studied were carcass length, longissimus area, average backfat thickness, 10th-rib backfat thickness, specific gravity, weights of closely trimmed ham, loin, and shoulder, belly weight, subjective scoring of the longissimus muscle for color and marbling, estimated percentage of muscle, and lean growth. Total weighted cumulative selection differential for 200-d weight over six generations was 88.7 kg. The realized heritability for 200-d weight was .26 +/- .08, and the change in 200-d weight was 4.2 +/- 1.3 kg per generation. None of the regression coefficients for reproductive traits differed significantly from zero. Ham weight, belly weight, marbling score, and lean growth increased by .069 +/- .027 kg, .051 +/- .020 kg, .045 +/- .012 points, and .0042 +/- .0007 kg/d, respectively, per generation. Specific gravity decreased by -.00063 +/- .00023 per generation in response to the selection for 200-d weight. The increase in lean growth in the select line was the result of an increased growth rate and not from an improvement in percentage of lean in carcasses from pigs from the select line.
[本文引用: 1]
[本文引用: 1]
[本文引用: 1]
[本文引用: 1]
[本文引用: 2]
[本文引用: 2]
[本文引用: 1]
[本文引用: 1]
[本文引用: 1]
[本文引用: 1]
[本文引用: 1]
DOI:10.5851/kosfa.2016.36.3.389URLPMID:27433110 [本文引用: 1]
In order to attain heavier live weight without impairing pork or sensory quality characteristics, carcass performance, muscle fiber, pork quality, and sensory quality characteristics were compared among the heavy weight (HW, average live weight of 130.5 kg), medium weight (MW, average weight of 111.1 kg), and light weight (LW, average weight of 96.3 kg) pigs at time of slaughter. The loin eye area was 1.47 times greater in the HW group compared to the LW group (64.0 and 43.5 cm(2), p<0.001), while carcass percent was similar between the HW and MW groups (p>0.05). This greater performance by the HW group compared to the LW group can be explained by a greater total number (1,436 vs. 1,188, x10(3), p<0.001) and larger area (4,452 vs. 3,716 mum(2), p<0.001) of muscle fibers. No significant differences were observed in muscle pH45 min, lightness, drip loss, and shear force among the groups (p>0.05), and higher live weights did not influence sensory quality attributes, including tenderness, juiciness, and flavor. Therefore, these findings indicate that increased live weights in this study did not influence the technological and sensory quality characteristics. Moreover, muscles with a higher number of medium or large size fibers tend to exhibit good carcass performance without impairing meat and sensory quality characteristics.
[本文引用: 1]
DOI:10.5713/ajas.2005.590URL [本文引用: 1]
DOI:10.1016/j.meatsci.2005.06.006URLPMID:22061378 [本文引用: 1]
Three hundred and forty (340) Durocx(LandracexYorkshire) crossbred piglets were allotted to a 2x2x3 factorial design experiment. The independent variables were the growth rate (fast: around -10 days at 100kg and slow: around +2 days at 100kg), based on two different EBV's (estimated breeding value) of the sire-line for age, the sex (barrows and gilts) and the live weight at slaughter (107, 115 and 125kg). A sub-population of 119 pigs (10 carcasses per treatment) was selected for the carcass and meat quality evaluation trials. As live weight increased there were significant increases in hot carcass weight and dressing percentage (P<0.05). Lean, fat and bone proportions were not affected by weight. Gilts had higher lean proportion (P<0.05) than barrows. Furthermore, carcasses of fast growing pigs were fatter (P<0.05) than those of slower growing ones. Loin muscle pH, drip loss and reflectance values did not vary significantly with any of the treatments. Intramuscular fat was higher in barrows (P<0.05) than in gilts and soluble collagen content decreased with increasing weight (P<0.05). Muscle protein (%) increased (P<0.05) from 107 to 115kg and gilts had a higher (P<0.05) content than castrates. No evidence was found that increasing slaughter weight detracts from carcass characteristics or meat quality.
[本文引用: 1]
[本文引用: 2]
DOI:10.5713/ajas.14.0971URLPMID:26580436 [本文引用: 1]
The objective of this study was to compare the effects of body weight growth adjustment methods on genetic parameters of body growth and tissue among three pig breeds. Data collected on 101,820 Landrace, 281,411 Yorkshire, and 78,068 Duroc pigs, born in Korean swine breeder farms since 2000, were analyzed. Records included body weights on test day and amplitude (A)-mode ultrasound carcass measures of backfat thickness (BF), eye muscle area (EMA), and retail cut percentage (RCP). Days to 90 kg body weight (DAYS90), through an adjustment of the age based on the body weight at the test day, were obtained. Ultrasound measures were also pre-adjusted (ABF, EMA, AEMA, ARCP) based on their test day measures. The (co)variance components were obtained with 3 multi-trait animal models using the REMLF90 software package. Model I included DAYS90 and ultrasound traits, whereas model II and III accounted DAYS90 and pre-adjusted ultrasound traits. Fixed factors were sex (sex) and contemporary groups (herd-year-month of birth) for all traits among the models. Additionally, model I and II considered a linear covariate of final weight on the ultrasound measure traits. Heritability (h(2)) estimates for DAYS90, BF, EMA, and RCP ranged from 0.36 to 0.42, 0.34 to 0.43, 0.20 to 0.22, and 0.39 to 0.45, respectively, among the models. The h(2) estimates of DAYS90 from model II and III were also somewhat similar. The h(2) for ABF, AEMA, and ARCP were 0.35 to 0.44, 0.20 to 0.25, and 0.41 to 0.46, respectively. Our heritability estimates varied mostly among the breeds. The genetic correlations (rG) were moderately negative between DAYS90 and BF (-0.29 to -0.38), and between DAYS90 and EMA (-0.16 to -0.26). BF had strong rG with RCP (-0.87 to -0.93). Moderately positive rG existed between DAYS90 and RCP (0.20 to 0.28) and between EMA and RCP (0.35 to 0.44) among the breeds. For DAYS90, model II and III, its correlations with ABF, AEMA, and ARCP were mostly low or negligible except the rG between DAYS90 and AEMA from model III (0.27 to 0.30). The rG between AEMA and ABF and between AEMA and ARCP were moderate but with negative and positive signs, respectively; also reflected influence of pre-adjustments. However, the rG between BF and RCP remained non-influential to trait pre-adjustments or covariable fits. Therefore, we conclude that ultrasound measures taken at a body weight of about 90 kg as the test final should be adjusted for body weight growth. Our adjustment formulas, particularly those for BF and EMA, should be revised further to accommodate the added variation due to different performance testing endpoints with regard to differential growth in body composition.
DOI:10.1186/s12711-017-0295-4URL [本文引用: 1]
[本文引用: 1]
