 ,1, 王吴彬1, 邢光南1, 杨加银2, 赵团结1, 盖钧镒,11
 2
Genetic Dissection of Protein Content in a Nested Association Mapping Population of Soybean
LI ShuGuang1,2, CAO YongCe1, HE JianBo,1, WANG WuBin1, XING GuangNan1, YANG JiaYin2, ZHAO TuanJie1, GAI JunYi,1通讯作者:
责任编辑: 李莉
收稿日期:2019-08-26接受日期:2019-11-30网络出版日期:2020-05-16
| 基金资助: |
Received:2019-08-26Accepted:2019-11-30Online:2020-05-16
作者简介 About authors
李曙光,E-mail:dawn0524@126.com。

摘要
关键词:
Abstract
Keywords:
PDF (1701KB)元数据多维度评价相关文章导出EndNote|Ris|Bibtex收藏本文
本文引用格式
李曙光, 曹永策, 贺建波, 王吴彬, 邢光南, 杨加银, 赵团结, 盖钧镒. 大豆巢式关联作图群体蛋白质含量的遗传解析[J]. 中国农业科学, 2020, 53(9): 1743-1755 doi:10.3864/j.issn.0578-1752.2020.09.005
LI ShuGuang, CAO YongCe, HE JianBo, WANG WuBin, XING GuangNan, YANG JiaYin, ZHAO TuanJie, GAI JunYi.
0 引言
【研究意义】大豆(Glycine max (L.) Merr.)是世界上重要的经济作物,是植物蛋白质和油脂的主要来源之一,提高大豆蛋白质含量是大豆重要的育种目标。解析大豆蛋白质含量的遗传构成对大豆分子设计育种具有重要意义。【前人研究进展】研究表明,大豆蛋白质含量是典型的数量遗传性状,由多基因控制,并且容易受环境条件的影响[1,2]。近年来,随着基因组测序技术和遗传统计方法的迅速发展,前人分别利用双亲本衍生分离群体和自然群体,对大豆蛋白质含量的遗传构成进行了大量研究。根据大豆SoyBase数据库及相关文献,迄今为止,至少有248个大豆蛋白质含量QTL(quantitative trait loci)已被报道,分布在大豆的20条染色体上[2]。基于连锁定位方法,KARIKARI等[3]利用Linhefenqingdou×Meng8206衍生的重组自交系(recombinant inbred line,RIL)群体检测到一个位于第7染色体上的多环境下稳定表达的大豆蛋白质含量QTL(qPro-7-1),可以解释13.59%—26.22%的表型变异;ZHANG等[4]利用Huapidou(ZDD09982)×Qihuang26(ZDD23189)衍生RIL群体,在大豆第1、10和15染色体上检测到3个表型变异解释率14.00%以上的蛋白质含量QTL。基于关联分析方法,LI等[5]以185份来自国内外的大豆种质为材料,采用MLM(mixed linear model)方法,在第1、13和20染色体上检测到3个遗传贡献率13.00%以上的稳定表达的QTL;WANG等[6]利用235份国内外收集的大豆品种,以FarmCPU(fixed and random model circulating probability unification)方法,检测到12个多环境下稳定表达的与蛋白质含量显著关联的SNP。另一方面,以双亲本衍生分离群体为材料进行QTL定位,不能检测双亲本间不具多态性的关键基因位点[7,8];以自然群体为材料进行关联分析,个体亲缘关系导致的群体结构可能会导致关联分析的假阳性[9];相比之下巢式关联作图(nested association mapping,NAM)群体利用了多亲本之间更多的遗传差异,能够相对较好地控制群体结构。因此,NAM群体结合了连锁定位中QTL检测高功效与关联分析中高作图精度的优点,成为解析复杂性状解剖的很有发展前景的多亲本遗传设计[8,10]。在前期研究中,笔者构建了包含4个RIL群体的大豆NAM群体,并提出了全面解析NAM群体数量性状遗传构成的优化方法[11]。【本研究切入点】由于大豆蛋白质含量是典型的复杂数量遗传性状,人们对其遗传构成还有待进一步深入了解。【拟解决的关键问题】本研究以大豆NAM群体为研究对象,利用RAD-seq进行基因分型并在5个环境下进行田间试验,采用前期研究鉴定的适合于NAM群体的最佳QTL定位方法,来解析大豆NAM群体的蛋白质含量的遗传结构以及推测相关候选基因,并从中探索构建该群体的5个亲本的重组潜力,为高蛋白质含量的大豆品种育种提供理论基础。1 材料与方法
1.1 试验材料
以蒙8206(M8206)为共同亲本,临河×蒙8206(Linhe×M8206,LM,104 RILs)、正阳×蒙8206(Zhengyang×M8206,ZM,126 RILs)、蒙8206×通山(M8206×Tongshan,MT,289 RILs)、蒙8206×WSB(M8206×WSB,MW,104 RILs)分别得到F1代,通过单籽传法自交7代获得4个RIL群体,共计623个家系,整合为一个NAM群体。本研究NAM群体由南京农业大学国家大豆改良中心创制和保存。1.2 田间试验设计
NAM群体及亲本分别于2012年、2013年和2014年在南京农业大学国家大豆改良中心江浦试验站(江浦,简称JP2012、JP2013和JP2014),属于北亚热带季风性湿润气候,雨量充沛、日照充足,无霜期230 d,年均气温15.3℃,降水量1 102.2 mm,年日照2 165.2 h;2012年在安徽科技学院凤阳试验田(凤阳,简称FY2012),属于北亚热带向温带渐变气候,气候温和,光照充足,无霜期212 d,年均气温14.9℃,年降雨量904.4 mm,年日照2 248.7 h;2014年在江苏沿海地区农业科学研究所(盐城,简称YC2014),属于亚热带与暖湿带的过渡地带气候,气温适中,雨量充沛,无霜期213 d,年平均气温14.1℃,常年降水量1 042.2 mm,年日照2 238.9 h;共计5个环境进行田间试验。每公顷施用三元复合肥(N-P2O5-K2O)225 kg,其中N 15%、P2O5 15%、K2O 15%,总养分含量≥45%。采用完全随机区组设计,3次重复,单行区,行长1 m,行距0.5 m,株距10 cm,常规田间管理。1.3 蛋白质含量测定及数据统计分析
大豆自然成熟(完熟期R8)时,每个小区植株收获后脱粒,通风晾干并在35—40℃烘干至恒重,选取籽粒大小一致、饱满的种子,采用FOSS公司生产的近红外谷物分析仪InfratecTM 1241 NIR Grain Analyzer(Sweden)测定大豆种子蛋白质含量,样品测定为近红外透射技术,波长范围570—1 100 nm,完全整粒无损分析,无需磨粉,仪器内置大豆模型,直接显示蛋白质含量测定结果。分别对NAM群体在每个环境下的3次重复进行蛋白质含量检测。采用SAS 9.3(SAS Institute Inc. 2011)的PROC UNIVARIATE、PROC MEANS软件进行表型数据的描述性统计,包括频数分布、平均值、正态分布检验等。采用PROC GLM进行多环境联合方差分析,随机效应模型为$y_{i,j}=\mu+\alpha_i+\beta_j+(\alpha\beta)_{ij}+\varepsilon_{ij}$,基因型、环境、重复(环境)、基因型与环境互作设为随机效应,其中,μ为群体平均值,αi为为第i个基因型的效应,βj为第j个环境的效应,(αβ)ij为基因型与环境互作效应,?ij为残差。
根据公式:$h^2=\sigma_g^2/(\sigma_g^2+\sigma_{ge}^2/n+\sigma^2/nr)$,计算联合多环境下的遗传率,其中,$\sigma_g^2$、$\sigma_{ge}^2$、$\sigma^2$分别代表遗传方差、基因型与环境互作方差、误差方差,n代表环境数,r代表环境内重复次数。根据公式:$ h^2=\sigma_g^2/(\sigma_g^2+\sigma^2)/r$,计算单环境下的遗传率。
1.4 SNP基因型分析与SNPLDB标记构建
NAM群体的SNP基因型与SNPLDB标记来源于LI等[11]文献。利用Restriction-site associated DNA sequencing(RAD-seq)技术对NAM群体进行SNP标记基因分型。由于一个SNP标记位点只有2种等位变异,又称为双等位变异标记,SNP不适合NAM群体中存在复等位变异的基本特征。因此,本研究把位于一个连锁不平衡(linkage disequilibrium,LD)区段内紧密连锁的多个SNP,作为该基因组区域的一段序列,划分为一个SNP连锁不平衡区块(SNP linkage disequilibrium block,SNPLDB),简称为SNPLDB标记。并且用NAM群体的亲本单倍型作为其等位变异,增加每个标记位点的单倍型/等位变异的数量,来匹配NAM群体的复等位变异特征。基于以上分析,NAM群体共鉴定了55 936个SNP和6 137个SNPLDB标记。1.5 全基因组关联分析
采用贺建波等[12,13]提出的限制性两阶段多位点全基因组关联分析方法(restricted two-stage multi-locus genome-wide association analysis,RTM-GWAS),基因型数据为NAM群体的6 137 SNPLDB标记,表型数据为5个环境下蛋白质含量的小区观测值(含每个环境下的3次重复数据)。RTM-GWAS方法分两阶段进行:第一阶段,基于简单线性模型进行单位点关联检验,对SNPLDB标记进行初步筛选,使用常规显著水平0.05作为筛选阈值;第二阶段,对第一阶段筛选到的显著位点,利用多位点模型分析进行QTL检测,并估计等位变异效应,显著水平设为0.01。在这两个阶段中,将基于SNPLDB标记的个体间遗传相似系数矩阵的前10个特征向量作为协变量进行群体结构控制。根据MCCOUCH等[14]提出的QTL命名法,以“q”+性状名称+染色体编号+QTL序号,用斜体表示。如qProt-6-1,q表示QTL,Prot表示大豆种子蛋白质含量,6表示该QTL定位在第6染色体上,1表示该染色体上第1个蛋白质含量QTL。
1.6 候选基因预测
根据检测到的蛋白质含量QTL,推断其候选基因体系。首先,利用大豆基因组数据库SoyBase(http://soybase.org),检索关联SNPLDB标记(±100 kb)物理范围内的注释基因;然后在这些基因中,鉴定出NAM群体中该物理区间内SNP所在的基因;最后,使用卡平方(χ2)独立性测验(test for independence),显著性水平设置为0.05,检验SNPLDB标记(复等位变异)和注释基因中SNP(双等位变异)之间是否显著相关。当这二者存在显著相关时,则该SNP所在的注释基因被认为是候选基因。大豆参考基因组Williams 82(Glyma.Wm82.a1.v1.1)[15]用于基因功能注释。2 结果
2.1 蛋白质含量表型数据分析
NAM群体的蛋白质含量变异较大,在5个环境下平均值的变异幅度为36.6%—46.0%,在5个单环境之间的变异幅度为31.5%—47.8%。NAM群体的共同亲本(M8206)的蛋白质含量为36.3%,低于其他4个亲本(临河、正阳、通山和WSB),这4个亲本的蛋白质含量分别为47.8%、44.7%、45.1%和42.9%。蛋白质含量广义遗传率较高,即遗传变异可以解释85.00%的蛋白质含量表型变异(表1)。多环境联合方差分析结果表明,蛋白质含量在NAM群体中不同基因型之间存在显著差异,同时环境、重复之间、基因型×环境互作也达到了差异极显著水平(P<0.01),表示蛋白质含量受到外在环境条件影响较大,但是基因型间均方远大于基因型×环境互作的均方(表2)。Table 1
表1
表1大豆NAM群体中蛋白质含量(%)的次数分布和描述性统计
Table 1
| 环境 Env. a | 组中值Mid-point | 平均值 Mean | 变幅 Range | CV b (%) | h2 (%) | ||||||||||||||||
|---|---|---|---|---|---|---|---|---|---|---|---|---|---|---|---|---|---|---|---|---|---|
| 32.0 | 33.0 | 34.0 | 35.0 | 36.0 | 37.0 | 38.0 | 39.0 | 40.0 | 41.0 | 42.0 | 43.0 | 44.0 | 45.0 | 46.0 | 47.0 | 48.0 | |||||
| FY2012 | 0 | 0 | 0 | 0 | 0 | 7 | 18 | 54 | 100 | 118 | 162 | 92 | 49 | 13 | 5 | 1 | 0 | 41.0 | 36.1—46.5 | 3.0 | 81.0 |
| JP2012 | 0 | 0 | 0 | 0 | 1 | 8 | 23 | 36 | 70 | 133 | 124 | 106 | 66 | 24 | 18 | 2 | 2 | 41.4 | 35.9—47.8 | 3.0 | 82.2 |
| JP2013 | 0 | 0 | 0 | 0 | 0 | 1 | 3 | 12 | 32 | 76 | 118 | 133 | 113 | 73 | 40 | 17 | 1 | 42.5 | 36.6—47.2 | 3.1 | 80.6 |
| JP2014 | 0 | 0 | 0 | 0 | 0 | 4 | 18 | 41 | 91 | 107 | 139 | 121 | 60 | 22 | 14 | 4 | 0 | 41.3 | 36.6—46.6 | 3.6 | 76.9 |
| YC2014 | 3 | 7 | 22 | 26 | 48 | 54 | 85 | 99 | 103 | 76 | 53 | 28 | 9 | 3 | 4 | 2 | 0 | 38.5 | 31.5—46.1 | 3.5 | 90.0 |
| 均值Mean | 0 | 0 | 0 | 0 | 0 | 3 | 15 | 58 | 85 | 162 | 147 | 97 | 40 | 13 | 2 | 1 | 0 | 40.9 | 36.6—46.0 | 3.3 | 85.0 |
新窗口打开|下载CSV
Table 2
表2
表2大豆NAM群体中蛋白质含量的多环境联合方差分析
Table 2
| 变异来源Source of variation | 自由度Degree of freedom | 均方Mean square | F 值F value | P值P value |
|---|---|---|---|---|
| 环境Environment | 4 | 3652.54 | 49.46 | <0.01 |
| 重复(环境)Replicate (Environment) | 10 | 71.82 | 40.08 | <0.01 |
| 基因型Genotype | 622 | 33.05 | 6.79 | <0.01 |
| 基因型×环境Genotype × Environment | 2467 | 4.95 | 2.76 | <0.01 |
| 误差Error | 5589 | 1.79 | ||
| 总计Total | 8692 |
新窗口打开|下载CSV
2.2 全基因组关联分析
利用RTM-GWAS方法解析NAM群体中蛋白质含量的遗传构成,共检测到90个蛋白质含量QTL,分布在大豆20条染色体上,每条染色体上具有1个(第9、12和17染色体)至12个(第6染色体)QTL,单个QTL的表型变异解释率为0.06%— 3.99%,共解释45.6%表型变异(图1和表3)。其中,qProt-6-1、qProt-7-2、qProt-20-8、qProt-19-3、qProt-6-4、qProt-2-2、qProt-5-5、qProt-18-1、qProt-8-5和qProt-14-2等10个蛋白质含量QTL的表型变异解释率分别为3.99%、2.46%、2.42%、1.85%、1.74%、1.71%、1.64%、1.45%、1.30%和1.02%,贡献均超过1.00%的表型变异,为大贡献QTL(large-contribution QTL),共解释19.60%的表型变异;其余80个小贡献QTL(small-contribution QTL),共解释26.00%的表型变异。图1
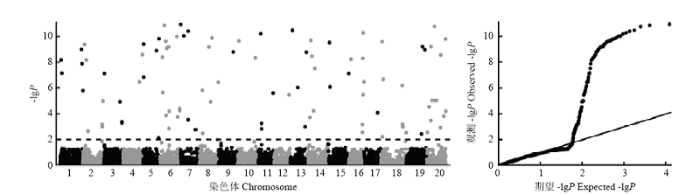 新窗口打开|下载原图ZIP|生成PPT
图1大豆NAM群体蛋白质含量全基因组关联分析曼哈顿图与QQ图
水平虚线为0.01显著性水平,-lgP范围介于2.0—89.2,大于10的值以8—11的值显示
Fig. 1Manhattan and quantile-quantile plots for genome-wide association study of protein content in the soybean NAM population
The horizontal dashed line indicates significance level of 0.01, where the -lgP values are ranged from 2.0 -89.2. The -lgP values greater than 10 were shown as values randomly sampled from 8-11
Table 3
表3
表3大豆NAM群体中检测到的蛋白质含量QTL
Table 3
| QTL | 染色体 Chr. | 位置 Position (bp) | 等位变异 No. allele | -lgP | R2(%) | SoyBase QTLa | GWAS QTLb |
|---|---|---|---|---|---|---|---|
| qProt-6-1 | 6 | 5723944—5861193 | 3 | 89.2 | 3.99 | 30-5, 005, 007, 015 | [16-17] |
| qProt-7-2 | 7 | 7895394—7951423 | 4 | 54.5 | 2.46 | 33-5 | [18] |
| qProt-20-8 | 20 | 45758806—45958325 | 5 | 52.6 | 2.42 | ||
| qProt-19-3 | 19 | 45138372—45336506 | 5 | 39.9 | 1.85 | 2-2, 36-31 | [19] |
| qProt-6-4 | 6 | 13682742—13879752 | 4 | 38.4 | 1.74 | 34-2 | [20,17] |
| qProt-2-2 | 2 | 8795893—8902236 | 4 | 37.8 | 1.71 | 21-4 | [20] |
| qProt-5-5 | 5 | 38956925—39141177 | 4 | 36.1 | 1.64 | 2-1, 9-1, 12-1, 34-1, 011, 014 | |
| qProt-18-1 | 18 | 2346289—2531952 | 5 | 31.1 | 1.45 | 26-12, 28-5, 36-25 | [21] |
| qProt-8-5 | 8 | 31139492—31248131 | 5 | 27.6 | 1.30 | ||
| qProt-14-2 | 14 | 6415938—6607451 | 3 | 23.2 | 1.02 | 1-6, 4-10, 45-1 | [21] |
| qProt-13-1 | 13 | 5277987—5435217 | 3 | 22.5 | 0.99 | 36-21 | |
| qProt-1-3 | 1 | 52165879—52301103 | 3 | 21.6 | 0.95 | 36-9 | [5] |
| qProt-4-2 | 4 | 47959591—48019889 | 5 | 19.3 | 0.92 | 4-2, 37-2 | [21] |
| qProt-16-3 | 16 | 34706667—34803913 | 5 | 19.1 | 0.91 | 41-6 | |
| qProt-10-1 | 10 | 3262276 | 2 | 19.2 | 0.79 | 41-11 | [22] |
| qProt-20-4 | 20 | 18696597—18710242 | 3 | 17.7 | 0.73 | 1-3, 1-4, 3-12, 10-1, 11-1, 30-1, 31-1, 36-26, 37-8, 47-8, 003 | [23] |
| qProt-13-4 | 13 | 39868073—40038639 | 5 | 14.8 | 0.72 | 26-11 | |
| qProt-6-7 | 6 | 20701467—20900668 | 5 | 13.9 | 0.68 | 012 | |
| qProt-6-9 | 6 | 41656522—41677922 | 3 | 13.9 | 0.61 | ||
| QTL | 染色体 Chr. | 位置 Position (bp) | 等位变异 No. allele | -lgP | R2(%) | SoyBase QTLa | GWAS QTLb |
| qProt-7-4 | 7 | 18234251 | 2 | 14.3 | 0.58 | 47-1 | |
| qProt-6-3 | 6 | 10921339—11119531 | 3 | 12.9 | 0.57 | ||
| qProt-14-3 | 14 | 9912397—10112026 | 3 | 12.9 | 0.57 | 21-8 | |
| qProt-9-1 | 9 | 35965266—36048472 | 4 | 12.0 | 0.56 | 5-3, 33-3, 34-6, 35-4, 36-28, 36-29, 36-30, 37-11 | |
| qProt-11-1 | 11 | 5786106—5983572 | 5 | 11.1 | 0.55 | 3-2, 16-1, 34-7, 36-2, 37-1 | [20-23] |
| qProt-2-1 | 2 | 4025110 | 2 | 12.9 | 0.52 | [24] | |
| qProt-5-2 | 5 | 1708219 | 2 | 12.4 | 0.50 | ||
| qProt-5-3 | 5 | 32642277—32673061 | 3 | 11.4 | 0.50 | 36-1 | |
| qProt-7-1 | 7 | 176227—372535 | 5 | 10.1 | 0.50 | ||
| qProt-19-2 | 19 | 39675711—39753005 | 4 | 9.2 | 0.44 | 30-7, 36-32 | |
| qProt-20-3 | 20 | 10292622—10303142 | 4 | 9.2 | 0.44 | 1-3, 1-4, 3-12, 10-1, 11-1, 30-1, 36-26, 37-8, 47-8 | [25] |
| qProt-6-6 | 6 | 16510997—16689830 | 4 | 9.1 | 0.43 | 21-3, 26-7, 35-1, 36-7, 36-8 | |
| qProt-10-3 | 10 | 43721962—43903254 | 5 | 8.3 | 0.42 | 27-5 | [1,26] |
| qProt-20-6 | 20 | 34459783—34480867 | 4 | 8.6 | 0.41 | 26-5, 34-11 | [26] |
| qProt-1-4 | 1 | 54251785—54443212 | 5 | 7.9 | 0.40 | 36-9 | [22] |
| qProt-8-3 | 8 | 23303969—23383404 | 3 | 9.2 | 0.40 | ||
| qProt-1-1 | 1 | 2560155—2683983 | 4 | 8.2 | 0.39 | [21-22] | |
| qProt-15-1 | 15 | 3194114 | 2 | 9.5 | 0.38 | 30-3 | [1,16] |
| qProt-1-2 | 1 | 4621764—4727603 | 5 | 7.1 | 0.37 | [21] | |
| qProt-15-3 | 15 | 50539746—50738644 | 5 | 7.1 | 0.37 | ||
| qProt-14-5 | 14 | 16634057—16648499 | 3 | 7.5 | 0.33 | ||
| qProt-16-1 | 16 | 4780910 | 2 | 8.2 | 0.32 | 4-7 | [6,25] |
| qProt-8-1 | 8 | 7846414—8000705 | 5 | 5.8 | 0.31 | 26-1, 30-4, 34-4, 34-5, 013, 016 | |
| qProt-16-5 | 16 | 37249323—37294601 | 4 | 6.5 | 0.31 | 41-6 | |
| qProt-18-4 | 18 | 51679638—51878009 | 4 | 6.2 | 0.30 | 34-9 | |
| qProt-8-6 | 8 | 46434966—46595148 | 3 | 6.5 | 0.28 | 14-1, 21-1 | [25] |
| qProt-3-1 | 3 | 1011738 | 2 | 7.1 | 0.27 | 010 | |
| qProt-3-2 | 3 | 39567898—39600101 | 5 | 4.9 | 0.27 | 36-34, 21-9, 36-37 | |
| qProt-5-1 | 5 | 1531632—1531635 | 2 | 6.8 | 0.26 | ||
| qProt-18-3 | 18 | 5553907—5635734 | 2 | 6.7 | 0.26 | 47-6 | |
| qProt-1-5 | 1 | 55836890—55889699 | 3 | 5.8 | 0.25 | ||
| qProt-4-1 | 4 | 41014079 | 2 | 6.5 | 0.25 | ||
| qProt-2-5 | 2 | 49426511—49624658 | 4 | 5.0 | 0.24 | 37-4 | |
| qProt-16-4 | 16 | 34859125—35032972 | 5 | 5.5 | 0.24 | 41-6 | [27] |
| qProt-13-2 | 13 | 18987333-18987363 | 2 | 6.0 | 0.23 | 26-13, 36-20, 36-21, 36-23 | [5] |
| qProt-15-2 | 15 | 4817369 | 2 | 6.1 | 0.23 | 30-3 | [18,27-29] |
| qProt-6-11 | 6 | 48032833—48165768 | 4 | 4.4 | 0.22 | 13-2 | |
| qProt-6-2 | 6 | 6233427—6256962 | 2 | 5.6 | 0.21 | 30-5, 31-4, 005, 007, 015 | |
| QTL | 染色体 Chr. | 位置 Position (bp) | 等位变异 No. allele | -lgP | R2(%) | SoyBase QTLa | GWAS QTLb |
| qProt-6-8 | 6 | 22700125—22889619 | 4 | 4.2 | 0.21 | ||
| qProt-8-4 | 8 | 27091794—27092100 | 3 | 4.9 | 0.21 | ||
| qProt-11-3 | 11 | 36538681—36538733 | 2 | 5.6 | 0.21 | 26-6 | |
| qProt-20-7 | 20 | 42051825—42200759 | 5 | 3.8 | 0.21 | ||
| qProt-12-1 | 12 | 36587265 | 2 | 5.5 | 0.20 | 5-2, 21-10, 33-1 | |
| qProt-17-1 | 17 | 33206802—33271301 | 4 | 4.1 | 0.20 | 36-14, 36-16 | |
| qProt-6-5 | 6 | 14689566—14795226 | 4 | 3.8 | 0.19 | 34-2 | [1] |
| qProt-6-10 | 6 | 42894533—43089859 | 4 | 3.7 | 0.19 | 24-1 | |
| qProt-14-1 | 14 | 4726017—4860851 | 4 | 3.7 | 0.19 | 1-6, 4-11, 45-1 | [22] |
| qProt-20-2 | 20 | 5157137 | 2 | 4.5 | 0.16 | 1-3, 1-4, 3-12, 10-1, 11-1, 30-1, 36-26, 37-8, 47-8 | |
| qProt-3-3 | 3 | 44249912—44442395 | 3 | 3.4 | 0.15 | 36-35, 27-4 | |
| qProt-6-12 | 6 | 48187414 | 2 | 4.2 | 0.15 | 13-2 | [20-21] |
| qProt-8-2 | 8 | 8219073—8363193 | 5 | 2.4 | 0.15 | 26-1, 30-4, 34-4, 34-5, 013, 016 | [6,26] |
| qProt-14-4 | 14 | 13291266 | 2 | 4.2 | 0.15 | ||
| qProt-18-8 | 18 | 62050016—62248618 | 5 | 2.5 | 0.15 | 30-10 | |
| qProt-20-9 | 20 | 46154443 | 2 | 4.2 | 0.15 | ||
| qProt-3-4 | 3 | 44486103—44672295 | 4 | 3.3 | 0.14 | 36-35, 27-4 | |
| qProt-18-2 | 18 | 2963699—3158571 | 5 | 2.2 | 0.14 | 20-1, 47-6 | [6] |
| qProt-20-5 | 20 | 33207484—33279787 | 3 | 2.9 | 0.13 | 1-1, 1-2, 15-1, 26-5, 34-11, 39-4 | [30] |
| qProt-7-3 | 7 | 18234233 | 2 | 3.5 | 0.12 | 47-1 | |
| qProt-7-5 | 7 | 35580968—35653659 | 3 | 2.8 | 0.12 | 41-9 | |
| qProt-18-7 | 18 | 60127020—60312441 | 5 | 1.9 | 0.12 | 3-10, 30-10 | |
| qProt-2-4 | 2 | 47360405 | 2 | 3.2 | 0.11 | 40-5 | [23] |
| qProt-11-2 | 11 | 7962963 | 2 | 3.2 | 0.11 | ||
| qProt-16-2 | 16 | 33179205 | 2 | 3.1 | 0.11 | ||
| qProt-13-3 | 13 | 36897211 | 2 | 3.0 | 0.10 | 6-2, 24-2 | |
| qProt-18-5 | 18 | 52822014 | 2 | 3.0 | 0.10 | 3-8, 28-2 | |
| qProt-18-6 | 18 | 54160848 | 2 | 2.9 | 0.10 | 3-9 | |
| qProt-2-3 | 2 | 12237524 | 2 | 2.6 | 0.09 | 36-12 | |
| qProt-19-1 | 19 | 37053052—37053084 | 2 | 2.4 | 0.08 | ||
| qProt-20-1 | 20 | 1315771—1315813 | 2 | 2.5 | 0.08 | 26-3, 26-4, 37-7, 37-9, 41-4 | |
| qProt-5-4 | 5 | 38098083 | 2 | 2.1 | 0.07 | 12-1, 011, 014 | [6] |
| qProt-10-2 | 10 | 40629142—40629143 | 2 | 1.9 | 0.06 | 27-5, 40-1 | |
| LC QTL | 10 | 42 | 19.58 | ||||
| SC QTL | 80 | 261 | 26.06 | ||||
| 总计Total | 90 | 303 | 45.64 | 67(119) | 33(45) |
新窗口打开|下载CSV
根据多环境联合方差分析,遗传变异解释的蛋白质含量表型变异,即性状遗传率为85.00%。本研究检测到的90个蛋白质含量QTL表型变异贡献率为45.60%,推测剩余的39.40%的遗传变异的来源于未定位到的微效QTL,QTL×环境互作与试验误差解释15.00%蛋白质含量表型变异。
2.3 蛋白质含量QTL-等位变异矩阵
NAM群体检测到的90个蛋白质含量QTL中,每个QTL包含2—5个等位变异,共鉴定了303个等位变异效应,其中增效等位变异156个,减效等位变异147个,增效等位变异的效应值为0.007%—2.845%,减效等位变异的效应值为-0.012%—-2.434%,90.8%的等位变异效应值为-1.000%—1.000%,表明大多数等位变异的效应值较小,具有极高或极低表型效应的等位变异较为少见(图2)。图2
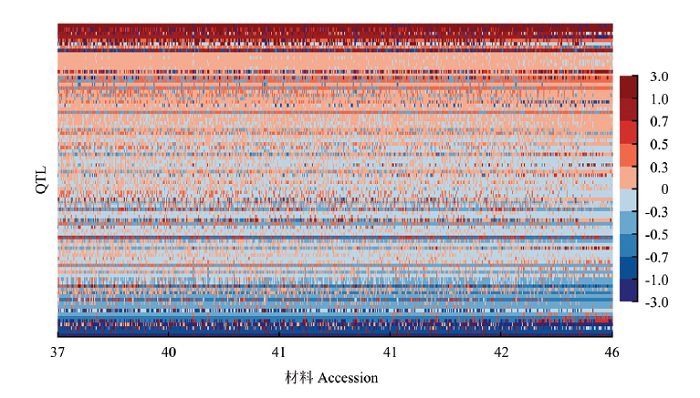 新窗口打开|下载原图ZIP|生成PPT
图2大豆NAM群体RTM-GWAS方法检测到的蛋白质含量QTL等位变异矩阵
横轴表示以蛋白质含量(%)升序排列的种质材料,纵轴表示以增效等位变异频率升序排列的QTL。每行表示一个QTL在不同材料中的等位基因分布,而每列表示一份材料在所有QTL上的等位基因构成。等位基因效应以颜色表示,等位变异效应以颜色表示,即具有暖色的格子代表增效等位变异,而具有冷色的格子代表减效等位变异,颜色的深浅代表等位变异效应的大小
Fig. 2Graphical representation of QTL-allele matrix of protein content detected in the soybean NAM population
The horizontal axis indicates accessions arranged in ascending order of protein content (%), while the vertical axis indicates QTL arranged in ascending order of their positive allele frequency. Every row indicates the allele distribution among accessions at a QTL, while every column indicates the allele constitution of an accession over all QTLs. Allele effects are expressed in color cells where warm colors indicate positive effects, cool colors indicate negative effects, and color gradient indicates effect size
NAM群体的623个家系中90个QTL的303个等位变异效应,组成了一个蛋白质含量QTL-等位变异矩阵(QTL-allele matrix),全面显示了该群体蛋白质含量的遗传构成信息。图2为NAM群体的蛋白质含量QTL-allele矩阵图,每个QTL的等位变异效应以颜色的深浅表示。从蛋白质含量QTL-allele矩阵图中可以看到,不存在等位变异效应完全是减效或增效的NAM家系。蛋白质含量高低的差异在于不同家系中的减效或增效等位变异的构成比例,高蛋白质含量值家系比低值家系具有更多的增效等位变异。此外,高蛋白质含量家系存在一定数量的减效等位变异,而低蛋白质含量家系也存在某些增效等位变异,表明蛋白质含量改良存在很高的重组潜力,并且在育种利用中低蛋白质含量家系的优异变异不应被忽略。
2.4 NAM群体5个亲本的蛋白质含量育种潜力
利用NAM群体的蛋白质含量QTL-allele矩阵来预测5个亲本(临河、正阳、通山、WSB和蒙8206)的蛋白质含量的育种潜力。表4为NAM群体的5个亲本之间潜在的10个杂交组合的蛋白质含量预测结果。根据RTM-GWAS法检测到的5个亲本的蛋白质含量QTL-等位变异效应值,计算潜在杂交组合F2单籽传衍生的10 000个纯系后代蛋白质含量预测值。分别以5%分位数和95%分位数作为预测组合纯合基因型后代的低值和高值。Table 4
表4
表4大豆NAM群体5个亲本之间潜在杂交组合后代的蛋白质含量预测值
Table 4
| 组合 Cross | 观测值 Observation | 独立模型 Independence model | 连锁模型 Linkage model | |||||
|---|---|---|---|---|---|---|---|---|
| Y1 | Y2 | 均值 Mean | P5 | P95 | 均值 Mean | P5 | P95 | |
| 蒙8206×临河 (LM) | 36.3 | 47.8 | 42.1 | 33.1 | 51.1 | 42.0 | 37.8 | 46.3 |
| 蒙8206×正阳 (LZ) | 36.3 | 44.7 | 40.5 | 35.8 | 45.2 | 40.5 | 37.1 | 43.9 |
| 蒙8206×通山 (MT) | 36.3 | 45.1 | 40.7 | 35.8 | 45.6 | 40.7 | 37.5 | 43.9 |
| 蒙8206×WSB (MW) | 36.3 | 42.9 | 39.6 | 34.3 | 45.0 | 39.6 | 36.4 | 42.7 |
| 临河×正阳 Linhe×Zhengyang | 47.8 | 44.7 | 46.3 | 36.4 | 56.1 | 46.2 | 41.5 | 50.9 |
| 临河×通山Linhe×Tongshan | 47.8 | 45.1 | 46.4 | 36.3 | 56.5 | 46.5 | 42.2 | 50.8 |
| 临河×WSB Linhe×WSB | 47.8 | 42.9 | 45.4 | 35.7 | 54.8 | 45.3 | 40.6 | 50.2 |
| 正阳×通山 Zhengyang×Tongshan | 44.7 | 45.1 | 44.9 | 39.9 | 49.8 | 44.9 | 41.7 | 48.1 |
| 正阳×WSB Zhengyang×WSB | 44.7 | 42.9 | 43.8 | 36.7 | 50.7 | 43.8 | 39.6 | 48.0 |
| 通山×WSB Tongshan×WSB | 45.1 | 42.9 | 44.0 | 36.9 | 51.1 | 44.0 | 39.9 | 48.1 |
新窗口打开|下载CSV
在连锁模型预测下,构成大豆NAM群体的4个RIL群体对应的4个杂交组合,临河×蒙8206、正阳×蒙8206、蒙8206×通山和蒙8206×WSB组合在5%—95%百分位数(预测5%范围)的蛋白质含量预测值分别是37.8%—46.3%、37.1%—43.9%、37.5%—43.9%和36.4%—42.7%,而这4个RIL群体的实际表型观测值范围是38.4%—46.0%、36.7%—44.4%、36.7%—45.4%和37.1%—43.2%,表明如不打破连锁,现实的变异潜力与预测的变异潜力相差不大。
如果在独立模型下发生进一步遗传重组,基因组将会发生更大的潜在分离重组。5个亲本之间的10个潜在杂交组合后代的5%—95%百分位数范围,在连锁模型下预测值为36.4%—50.9%,在独立模型下为33.1%—56.5%,比个别杂交组合变异更加广泛。因此,RTM-GWAS构建的QTL等位基因矩阵,提供了一个亲本材料基因分型与预测亲本之间遗传潜力的方法。
2.5 蛋白质含量相关候选基因体系
根据NAM群体中检测的90个蛋白质含量QTL,推断73个蛋白质含量相关候选基因,共解释39.90%的表型变异。根据候选基因的功能注释,这些候选基因归为6类生物学过程,包括蛋白质代谢、DNA代谢、信号转导、代谢过程、胚发育和未知过程等(图3)。图3
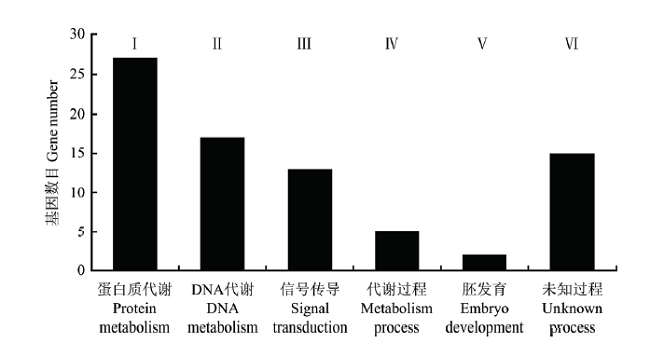 新窗口打开|下载原图ZIP|生成PPT
图3蛋白质含量相关的候选基因功能注释
Ⅰ—Ⅵ:蛋白质含量候选基因的6类生物学过程
Fig. 3The function annotation of candidate genes for protein content
Ⅰ-Ⅵ: The six groups of biological processes for the candidate genes of protein content
第Ⅰ组,具有27个氨基酸和蛋白质代谢相关候选基因,解释18.70%表型变异,包括参与甘氨酸与芳香族氨基酸代谢(Glyma20g24830)、半胱氨酸生物合成(Glyma18g03540)、氨基酸生物合成和分解代谢(Glyma06g14220、Glyma20g38570、Glyma01g40420和Glyma15g43289)、蛋白磷酸化(Glyma07g00670、Glyma08g10810、Glyma12g33230等)、依赖泛素的蛋白质分解代谢(Glyma06g07920、Glyma09g29030)、蛋白水解(Glyma06g18400、Glyma18g43390、Glyma18g53880)的基因。
第Ⅱ组,具有17个DNA代谢相关候选基因,解释8.80%表型变异,包括参与依赖DNA的转录调控(Glyma01g43350、Glyma08g29010、Glyma13g39431等)、DNA甲基化(Glyma15g06880)的基因。
第Ⅲ组,具有13个信号转导与运输过程相关候选基因,解释6.80%表型变异,包括参与生长素和油菜素内酯刺激的响应(Glyma02g13910)、信号转导(Glyma02g45362和Glyma16g31724)、氨基酸运输(Glyma16g29411)、高尔基体囊泡介导的运输(Glyma04g42246和Glyma06g23570)、跨膜运输(Glyma03g31600)的基因。
第Ⅳ组,具有5个代谢过程相关候选基因,解释1.70%表型变异,包括参与碳水化合物代谢(Glyma10g35490)的基因。
第Ⅴ组,具有2个胚发育相关候选基因,解释1.10%表型变异,包括参与减数分裂(Glyma16g31320)、种子休眠之前胚发育(Glyma17g30240)的基因。
第Ⅵ组,具有9个蛋白质含量性状间接相关的未知过程候选基因,解释2.80%表型变异,包括Glyma02g04965、Glyma10g32170、Glyma18g06890等基因。
3 讨论
3.1 大豆蛋白质含量表现数量遗传特点
大豆蛋白质含量属于复杂数量遗传性状,由若干遗传效应大小不一的基因控制,并且受到环境条件的影响[1,5]。本研究NAM群体蛋白质含量的变异幅度为36.6%—46.0%,表现近似正态连续分布的数量遗传特点。根据前人数量性状单基因与多基因遗传模型,盖钧镒等[31]提出了植物数量性状的泛主基因+多基因混合遗传模型,数量性状可能由多个基因控制,遗传效应大小不等且容易受环境影响;在一般试验条件下可以检测到、效应较大的基因作为主效基因,而在现有试验条件下不能单独检测到、效应相对非常小的基因作为微效基因或多基因;主效与微效基因之间的区别是相对的,取决于试验误差或精度,在一种环境中某一基因可能作为主效基因,而在另一环境中受误差干扰表现为微效基因。因此,数量性状由主基因与多基因共同控制是数量性状遗传的基本模型,而纯主基因或纯多基因的遗传模型只是其个别特例。ZHANG等[20]利用多位点复等位变异关联分析方法RTM- GWAS来解析中国大豆地方品种群体蛋白质含量的QTL-allele体系,检测到89个蛋白质含量QTL,遗传贡献率为0.04%—11.30%,本研究利用相同方法来解析大豆NAM群体的蛋白质含量的遗传构成,检测到90个蛋白质含量QTL,遗传贡献从0.06%—3.99%,该结果很好地验证了盖钧镒等[31]提出的泛主基因+多基因数量性状混合遗传模型假说,更进一步表明大豆蛋白质含量是一个典型的数量遗传性状。3.2 本研究检测到蛋白质含量QTL与文献报道QTL比较
大豆蛋白质含量是许多微效基因控制的复杂数量性状,同时也受环境条件的影响[2,5]。基于双亲分离群体的连锁定位和自然群体的关联分析方法,以前的研究已经报道了许多大豆蛋白质含量QTL。目前在大豆基因组数据库SoyBase中公布了248个基于连锁定位的蛋白质含量QTL,其中一些QTL在不同群体中在相同或非常相近的染色体位置被检测到了3次或更多次,表明这些QTL是非常可信的,然而这些已知的QTL在应用到标记辅助育种工作之前需要进一步验证。因此,本研究根据相关标记的参考基因组的物理区域(Glyma.Wm82.a1.v1.1)对本研究检测到的蛋白质含量QTL与前人报道的QTL进行比较。本研究检测到了90个蛋白质含量QTL,分布在所有20条染色体上,其中67个QTL位于或接近SoyBase中已经报道的119个QTL区间,33个QTL与以前报道的关联分析文献中的45个QTL相一致,其余20个QTL是本研究中新检测到的。在NAM群体中检测到的90个蛋白质含量QTL中,qProt-6-1具有最大的遗传贡献率3.99%,前人通过连锁定位方法检测到的4个蛋白质含量QTL位于该QTL区域附近,包括Seed protein 30-5[32],cqSeed protein-005、cqSeed protein-007和cqSeed protein-015[33];前人通过关联分析方法检测到的2个QTL与该QTL相一致,包括Gm06_5660542[16]与Gm06_6067567[17]。并且,还有6个大贡献QTL同时与前人连锁定位与关联分析研究发现的多个QTL相一致,如qProt-7-2(贡献率2.46%)与Seed protein 33-5[34]和Gm07_7058915 [18]的定位区域相临近;qProt-19-3(贡献率1.85%)与Seed protein 2-2[35]、Seed protein 36-31[36]和Gm19_46335384[19]的定位区域相邻近;qProt-6-4(贡献率1.74%)与Seed protein 34-2[37]和Gm06_12914255[20]的定位区域相邻近;qProt-2-2(贡献率1.71%)与Seed protein 21-4[38]和Gm02_7987834[20]的定位区域相邻近;qProt-18-1(贡献率1.45%)与Seed protein 26-12[39]、Seed protein 28-5[40]、Seed protein 36-25[36]和Gm18_2064407[21]的定位区域相邻近;qProt-14-2(贡献率1.02%)与Seed protein 1-6[41]、Seed protein 4-10[42]、Seed protein 45-1[43]和Gm14_7160557[21]的定位区域相邻近。在本研究新检测的20个QTL中,qProt-20-8(2.42%)和qProt-8-5(1.30%)是大豆蛋白质含量的大贡献QTL。
3.3 NAM群体5个亲本的超亲分离潜力
本研究预测了NAM群体5个亲本(临河、正阳、通山、WSB和蒙8206)之间潜在的10个杂交组合的纯系后代的蛋白质含量,其预测值为33.1%—56.5%,表现出明显的双向超亲分离潜力。ZHANG等[20]预测了中国大豆地方品种群体潜在杂交组合的纯系后代的蛋白质含量的育种潜力,其分离范围是39.86%—55.71%。预测优异杂交组合是分子设计育种的前提,但是需要作物育种实践来证明。ZHANG等[44]报道了利用QTL-allele设计亲本组配以及后代选择创造大豆高蛋白质含量材料,从2个RIL群体中选择了具有超亲蛋白质含量表型的2个家系XG30(45.53%)和WT133(48.39%),并对3个已定位到的大效应加性QTL进行标记分型,WT133×XG30杂交后代表现出较大的超亲分离,选育出蛋白质含量高达54.15%的品系材料,由此证明了QTL-allele矩阵在数量性状的超亲分离中的应用价值。此外,NAM群体蛋白质含量的QTL-allele中,蛋白质含量等位变异效应值从-2.434%—2.845%不等,但是绝大多数等位变异效应比较集中在-1.000%—1.000%,具有极高或低表型效应的等位变异较为少见,具有极端值的稀有等位变异对于选育高蛋白质大豆材料存在积极意义。4 结论
共检测到90个蛋白质含量QTL,其中新检测到20个QTL,贡献率总和为45.60%,预测了73个蛋白质含量相关基因。根据NAM群体的蛋白质含量QTL-allele矩阵,预测出潜在杂交组合的纯系后代的蛋白质含量为33.1%—56.5%。参考文献 原文顺序
文献年度倒序
文中引用次数倒序
被引期刊影响因子
[本文引用: 2]
DOI:10.1007/s00122-017-2955-8URLPMID:28801731 [本文引用: 3]

Genetic improvement of soybean protein meal is a complex process because of negative correlation with oil, yield, and temperature. This review describes the progress in mapping and genomics, identifies knowledge gaps, and highlights the need of integrated approaches. Meal protein derived from soybean [Glycine max (L) Merr.] seed is the primary source of protein in poultry and livestock feed. Protein is a key factor that determines the nutritional and economical value of soybean. Genetic improvement of soybean seed protein content is highly desirable, and major quantitative trait loci (QTL) for soybean protein have been detected and repeatedly mapped on chromosomes (Chr.) 20 (LG-I), and 15 (LG-E). However, practical breeding progress is challenging because of seed protein content's negative genetic correlation with seed yield, other seed components such as oil and sucrose, and interaction with environmental effects such as temperature during seed development. In this review, we discuss rate-limiting factors related to soybean protein content and nutritional quality, and potential control factors regulating seed storage protein. In addition, we describe advances in next-generation sequencing technologies for precise detection of natural variants and their integration with conventional and high-throughput genotyping technologies. A syntenic analysis of QTL on Chr. 15 and 20 was performed. Finally, we discuss comprehensive approaches for integrating protein and amino acid QTL, genome-wide association studies, whole-genome resequencing, and transcriptome data to accelerate identification of genomic hot spots for allele introgression and soybean meal protein improvement.
DOI:10.3390/ijms20040979URLPMID:30813455 [本文引用: 1]
Seed protein and oil content are the two important traits determining the quality and value of soybean. Development of improved cultivars requires detailed understanding of the genetic basis underlying the trait of interest. However, it is prerequisite to have a high-density linkage map for precisely mapping genomic regions, and therefore the present study used high-density genetic map containing 2267 recombination bin markers distributed on 20 chromosomes and spanned 2453.79 cM with an average distance of 1.08 cM between markers using restriction-site-associated DNA sequencing (RAD-seq) approach. A recombinant inbred line (RIL) population of 104 lines derived from a cross between Linhefenqingdou and Meng 8206 cultivars was evaluated in six different environments to identify main- and epistatic-effect quantitative trait loci (QTLs)as well as their interaction with environments. A total of 44 main-effect QTLs for protein and oil content were found to be distributed on 17 chromosomes, and 15 novel QTL were identified for the first time. Out of these QTLs, four were major and stable QTLs, viz., qPro-7-1, qOil-8-3, qOil-10-2 and qOil-10-4, detected in at least two environments plus combined environment with R2 values >10%. Within the physical intervals of these four QTLs, 111 candidate genes were screened for their direct or indirect involvement in seed protein and oil biosynthesis/metabolism processes based on gene ontology and annotation information. Based on RNA sequencing (RNA-seq) data analysis, 15 of the 111 genes were highly expressed during seed development stage and root nodules that might be considered as the potential candidate genes. Seven QTLs associated with protein and oil content exhibited significant additive and additive × environment interaction effects, and environment-independent QTLs revealed higher additive effects. Moreover, three digenic epistatic QTLs pairs were identified, and no main-effect QTLs showed epistasis. In conclusion, the use of a high-density map identified closely linked flanking markers, provided better understanding of genetic architecture and candidate gene information, and revealed the scope available for improvement of soybean quality through marker assisted selection (MAS).
DOI:10.1186/s12864-018-5035-9URLPMID:30157757 [本文引用: 1]
Soybean is not only an important oil crop, but also an important source of edible protein and industrial raw material. Yield-traits and quality-traits are increasingly attracting the attention of breeders. Therefore, fine mapping the QTLs associated with yield-traits and quality-traits of soybean would be helpful for soybean breeders. In the present study, a high-density linkage map was constructed to identify the QTLs for the yield-traits and quality-traits, using specific length amplified fragment sequencing (SLAF-seq).
DOI:10.1016/j.ygeno.2018.01.004URLPMID:29325965 [本文引用: 3]
Soybean is globally cultivated primarily for its protein and oil. The protein and oil contents of the seeds are quantitatively inherited traits determined by the interaction of numerous genes. In order to gain a better understanding of the molecular foundation of soybean protein and oil content for the marker-assisted selection (MAS) of high quality traits, a population of 185 soybean germplasms was evaluated to identify the quantitative trait loci (QTLs) associated with the seed protein and oil contents. Using specific length amplified fragment sequencing (SLAF-seq) technology, a total of 12,072 single nucleotide polymorphisms (SNPs) with a minor allele frequency (MAF)?≥?0.05 were detected across the 20 chromosomes (Chr), with a marker density of 78.7 kbp. A total of 31 SNPs located on 12 of the 20 soybean chromosomes were correlated with seed protein and oil content. Of the 31 SNPs that were associated with the two target traits, 31 beneficial alleles were identified. Two SNP markers, namely rs15774585 and rs15783346 on Chr 07, were determined to be related to seed oil content both in 2015 and 2016. Three SNP markers, rs53140888 on Chr 01, rs19485676 on Chr 13, and rs24787338 on Chr 20 were correlated with seed protein content both in 2015 and 2016. These beneficial alleles may potentially contribute towards the MAS of favorable soybean protein and oil characteristics.
DOI:10.3389/fpls.2018.00610URLPMID:29868067 [本文引用: 1]
Soybean was domesticated about 5,000 to 6,000 years ago in China. Although genotyping technologies such as genotyping by sequencing (GBS) and high-density array are available, it is convenient and economical to genotype cultivars or populations using medium-density SNP array in genetic study as well as in molecular breeding. In this study, 235 cultivars, collected from China, Japan, USA, Canada and some other countries, were genotyped using SoySNP8k iSelect BeadChip with 7,189 single nucleotide polymorphisms (SNPs). In total, 4,471 polymorphic SNP markers were used to analyze population structure and perform genome-wide association study (GWAS). The most likely K value was 7, indicating this population can be divided into 7 subpopulations, which is well in accordance with the geographic origins of cultivars or accession studied. The LD decay rate was estimated at 184 kb, where r2 dropped to half of its maximum value (0.205). GWAS using FarmCPU detected a stable quantitative trait nucleotide (QTN) for hilum color and seed color, which is consistent with the known loci or genes. Although no universal QTNs for flowering time and maturity were identified across all environments, a total of 30 consistent QTNs were detected for flowering time (R1) or maturity (R7 and R8) on 16 chromosomes, most of them were corresponding to known E1 to E4 genes or QTL region reported in SoyBase (soybase.org). Of 16 consistent QTNs for protein and oil contents, 11 QTNs were detected having antagonistic effects on protein and oil content, while 4 QTNs soly for oil content, and one QTN soly for protein content. The information gained in this study demonstrated that the usefulness of the medium-density SNP array in genotyping for genetic study and molecular breeding.
DOI:10.3724/SP.J.1006.2011.00191URL [本文引用: 1]
Molecular design breeding is a highly integrated system built on multiple scientific disciplines and technological areas. It allows the simulation and optimization of the breeding procedure before breeders’ field experiments. Thus the best target genotypes to meet various breeding objectives in various ecological regions, and the most efficient and effective crossing and selection strategies approaching the best target genotypes can be identified. The design breeding greatly increases the predictability in conventional breeding, leading to the evolution from “phenotypic breeding by experience” to “genotypic breeding by prediction” and an increased breeding efficiency and effectiveness. Three major steps are involved in design breeding. The first step is to identify genes affecting breeding traits and to study gene and gene interactions, i.e., to seek for the original materials for producing the crop cultivars, which includes establishment of genetic populations, screening of polymorphism markers, construction of linkage maps, phenotypic evaluation and genetic analysis etc. The second step is to determine the target genotypes for various breeding objectives in various ecological regions, i.e., prototype of the final cultivar product, which includes the genotype-to-phenotype prediction based on identified and known gene information, i.e., locations of genes on chromosomes, biochemical pathways and expression networks from genes to traits, their genetic effects on breeding traits, and the interactions between genes. The third step is to identify the most efficient breeding strategies leading to the target genotypes determined in the second step, i.e., a detailed blue chart to produce the designed crop cultivars. Significant progresses have been made in crop molecular design breeding in China in recent years. This paper first summarized major progresses made in the development of novel genetic materials, genetic study of important breeding traits, development and application of breeding simulation tools, application of design breeding, and the platform research and development in molecular design breeding in crops in China. A perspective view of molecular design breeding was given for the near future after reviewing the current research both in China and worldwide. Finally, major research areas relevant to molecular design breeding in China were proposed, among which are prediction methods and tools of genetics and breeding, genetic mating designs and analysis, gene and environment interactions, functional genomics of crops, methods and tools of bioinformatics, technical systems and decision-supported tools. Professional development and education, and team building are essential as well to China’s leading role in crop molecular design breeding in the world.
DOI:10.1371/journal.pone.0017573URLPMID:21423655 [本文引用: 2]
Nested association mapping (NAM) is a novel genetic mating design that combines the advantages of linkage analysis and association mapping. This design provides opportunities to study the inheritance of complex traits, but also requires more advanced statistical methods. In this paper, we present the detailed algorithm of a QTL linkage mapping method suitable for genetic populations derived from NAM designs. This method is called joint inclusive composite interval mapping (JICIM). Simulations were designed on the detected QTL in a maize NAM population and an Arabidopsis NAM population so as to evaluate the efficiency of the NAM design and the JICIM method.
DOI:10.1016/S0140-6736(03)12520-2URLPMID:12598158 [本文引用: 1]
Great efforts and expense have been expended in attempts to detect genetic polymorphisms contributing to susceptibility to complex human disease. Concomitantly, technology for detection and scoring of single nucleotide polymorphisms (SNPs) has undergone rapid development, extensive catalogues of SNPs across the genome have been constructed, and SNPs have been increasingly used as a means for investigation of the genetic causes of complex human diseases. For many diseases, population-based studies of unrelated individuals--in which case-control and cohort studies serve as standard designs for genetic association analysis--can be the most practical and powerful approach. However, extensive debate has arisen about optimum study design, and considerable concern has been expressed that these approaches are prone to population stratification, which can lead to biased or spurious results. Over the past decade, a great shift has been noted, away from case-control and cohort studies, towards family-based association designs. These designs have fewer problems with population stratification but have greater genotyping and sampling requirements, and data can be difficult or impossible to gather. We discuss past evidence for population stratification on genotype-phenotype association studies, review methods to detect and account for it, and present suggestions for future study design and analysis.
DOI:10.1126/science.1174276URLPMID:19661422 [本文引用: 1]
Flowering time is a complex trait that controls adaptation of plants to their local environment in the outcrossing species Zea mays (maize). We dissected variation for flowering time with a set of 5000 recombinant inbred lines (maize Nested Association Mapping population, NAM). Nearly a million plants were assayed in eight environments but showed no evidence for any single large-effect quantitative trait loci (QTLs). Instead, we identified evidence for numerous small-effect QTLs shared among families; however, allelic effects differ across founder lines. We identified no individual QTLs at which allelic effects are determined by geographic origin or large effects for epistasis or environmental interactions. Thus, a simple additive model accurately predicts flowering time for maize, in contrast to the genetic architecture observed in the selfing plant species rice and Arabidopsis.
DOI:10.1007/s00122-017-2960-yURLPMID:28799029 [本文引用: 2]
The RTM-GWAS was chosen among five procedures to identify DTF QTL-allele constitution in a soybean NAM population; 139 QTLs with 496 alleles accounting for 81.7% of phenotypic variance were detected. Flowering date (days to flowering, DTF) is an ecological trait in soybean, closely related to its ability to adapt to areas. A nested association mapping (NAM) population consisting of four RIL populations (LM, ZM, MT and MW with M8206 as their common parent) was established and tested for their DTF under five environments. Using restriction-site-associated DNA sequencing the population was genotyped with SNP markers. The restricted two-stage multi-locus (RTM) genome-wide association study (GWAS) (RTM-GWAS) with SNP linkage disequilibrium block (SNPLDB) as multi-allele genomic markers performed the best among the five mapping procedures with software publicly available. It identified the greatest number of quantitative trait loci (QTLs) (139) and alleles (496) on 20 chromosomes covering almost all of the QTLs detected by four other mapping procedures. The RTM-GWAS provided the detected QTLs with highest genetic contribution but without overflowing and missing heritability problems (81.7% genetic contribution vs. heritability of?97.6%), while SNPLDB markers matched the NAM population property of multiple alleles per locus. The 139 QTLs with 496 alleles were organized into a QTL-allele matrix, showing the corresponding DTF genetic architecture of the five parents and the NAM population. All lines and parents comprised both positive and negative alleles, implying a great potential of recombination for early and late DTF improvement. From the detected QTL-allele system, 126 candidate genes were annotated and χ 2 tested as a DTF candidate gene system involving nine biological processes, indicating the trait a complex, involving several biological processes rather than only a handful of major genes.
DOI:10.1007/s00122-017-2962-9URLPMID:28828506 [本文引用: 1]
The innovative RTM-GWAS procedure provides a relatively thorough detection of QTL and their multiple alleles for germplasm population characterization, gene network identification, and genomic selection strategy innovation in plant breeding. The previous genome-wide association studies (GWAS) have been concentrated on finding a handful of major quantitative trait loci (QTL), but plant breeders are interested in revealing the whole-genome QTL-allele constitution in breeding materials/germplasm (in which tremendous historical allelic variation has been accumulated) for genome-wide improvement. To match this requirement, two innovations were suggested for GWAS: first grouping tightly linked sequential SNPs into linkage disequilibrium blocks (SNPLDBs) to form markers with multi-allelic haplotypes, and second utilizing two-stage association analysis for QTL identification, where the markers were preselected by single-locus model followed by multi-locus multi-allele model stepwise regression. Our proposed GWAS procedure is characterized as a novel restricted two-stage multi-locus multi-allele GWAS (RTM-GWAS, https://github.com/njau-sri/rtm-gwas ). The Chinese soybean germplasm population (CSGP) composed of 1024 accessions with 36,952 SNPLDBs (generated from 145,558 SNPs, with reduced linkage disequilibrium decay distance) was used to demonstrate the power and efficiency of RTM-GWAS. Using the CSGP marker information, simulation studies demonstrated that RTM-GWAS achieved the highest QTL detection power and efficiency compared with the previous procedures, especially under large sample size and high trait heritability conditions. A relatively thorough detection of QTL with their multiple alleles was achieved by RTM-GWAS compared with the linear mixed model method on 100-seed weight in CSGP. A QTL-allele matrix (402 alleles of 139 QTL?×?1024 accessions) was established as a compact form of the population genetic constitution. The 100-seed weight QTL-allele matrix was used for genetic characterization, candidate gene prediction, and genomic selection for optimal crosses in the germplasm population.
[本文引用: 1]
[本文引用: 1]
DOI:10.1007/s10142-013-0328-1URLPMID:23813016 [本文引用: 1]
Salinity is one of the major constraints adversely influencing crop productivity. Saltol QTL is a major QTL associated with Na?-K? ratio and seedling stage salinity tolerance in rice. With an aim to understand the contribution of individual genes localized within saltol towards salinity tolerance, we analysed the transcript abundance of a set of these genes in seedlings of contrasting genotypes of rice. We hypothesize that this approach may be helpful in identifying new 'candidate genes' for improving salinity tolerance in crops. For this purpose, seedlings of Oryza sativa cv. IR64 (sensitive) and the landrace Pokkali (tolerant) were subjected to short/long durations of salinity. qRT-PCR analysis clearly exhibited differential regulation of genes encoding signaling related protein (SRPs), where higher transcript abundance for most of them was observed in Pokkali than IR64 under non-stress conditions, thereby indicating towards well preparedness of the former to handle stress, in anticipation. Genes encoding proteins of unknown function (PUFs), though, constitute a considerable portion of plant genome, have so far been neglected in most studies. Time course analysis of these genes showed a continuous increase in their abundance in Pokkali, while in IR64, their abundance increased till 24 h followed by a clear decrease, thereby justifying their nomenclature as 'salinity induced factors' (SIFs). This is the first report showing possible involvement of SIFs localized within salinity related QTL towards salinity stress response. Based on the phenotypes of insertional mutants, it is proposed that these SIFs may have a putative function in vegetative growth (SIFVG), fertility (SIFF), viability (SIFV) or early flowering (SIFEF).
DOI:10.1038/nature08670URLPMID:20075913 [本文引用: 1]
Soybean (Glycine max) is one of the most important crop plants for seed protein and oil content, and for its capacity to fix atmospheric nitrogen through symbioses with soil-borne microorganisms. We sequenced the 1.1-gigabase genome by a whole-genome shotgun approach and integrated it with physical and high-density genetic maps to create a chromosome-scale draft sequence assembly. We predict 46,430 protein-coding genes, 70% more than Arabidopsis and similar to the poplar genome which, like soybean, is an ancient polyploid (palaeopolyploid). About 78% of the predicted genes occur in chromosome ends, which comprise less than one-half of the genome but account for nearly all of the genetic recombination. Genome duplications occurred at approximately 59 and 13 million years ago, resulting in a highly duplicated genome with nearly 75% of the genes present in multiple copies. The two duplication events were followed by gene diversification and loss, and numerous chromosome rearrangements. An accurate soybean genome sequence will facilitate the identification of the genetic basis of many soybean traits, and accelerate the creation of improved soybean varieties.
[本文引用: 1]
DOI:10.1016/j.plantsci.2016.11.009URLPMID:28167041 [本文引用: 1]
By using the soybean founder parent Tokachi nagaha and its 137 derived cultivars as materials, a genome-wide association analysis was performed to identify the single nucleotide polymorphisms (SNPs) underlying soybean yield and quality related traits at two planting densities. Results of ANOVA showed that genotype, environment, and genotype by environment interaction effects were all significant for each trait. The Tokachi nagaha-derived soybean population could be divided into two subpopulations based on molecular data, and accessions in each subpopulation were almost all from the same Chinese province. Relatedness was detected between pair-wise accessions within the population. Linkage disequilibrium was obvious and the level of intra-chromosome linkage disequilibrium was about 8370kb. A total of 40 SNPs with significant signal were detected and distributed across 18 chromosomes. Some SNP markers were located in or near regions where QTLs have been previously mapped by linkage analysis. Nineteen SNPs were identified both in low- and high- density planting treatments, indicating those loci were common and sTable Sixteen SNPs were co-associated with two or more different traits, suggesting that some of the QTLs/genes underlying those identified SNPs were likely to be pleiotropic.
DOI:10.1186/s12864-015-1872-yURLPMID:26334313 [本文引用: 1]
Crop improvement always involves selection of specific alleles at genes controlling traits of agronomic importance, likely resulting in detectable signatures of selection within the genome of modern soybean (Glycine max L. Merr.). The identification of these signatures of selection is meaningful from the perspective of evolutionary biology and for uncovering the genetic architecture of agronomic traits.
DOI:10.1111/nph.13626URLPMID:26479264 [本文引用: 1]
Present-day soybeans consist of elite cultivars and landraces (Glycine max, fully domesticated (FD)), annual wild type (Glycine soja, nondomesticated (ND)), and semi-wild type (semi-domesticated (SD)). FD soybean originated in China, although the details of its domestication history remain obscure. More than 500 diverse soybean accessions were sequenced using specific-locus amplified fragment sequencing (SLAF-seq) to address fundamental questions regarding soybean domestication. In total, 64,141 single nucleotide polymorphisms (SNPs) with minor allele frequencies (MAFs) &gt; 0.05 were found among the 512 tested accessions. The results indicated that the SD group is not a hybrid between the FD and ND groups. The initial domestication region was pinpointed to central China (demarcated by the Great Wall to the north and the Qinling Mountains to the south). A total of 800 highly differentiated genetic regions and &gt; 140 selective sweeps were identified, and these were three- and twofold more likely, respectively, to encompass a known quantitative trait locus (QTL) than the rest of the soybean genome. Forty-three potential quantitative trait nucleotides (QTNs; including 15 distinct traits) were identified by genome-wide association mapping. The results of the present study should be beneficial for soybean improvement and provide insight into the genetic architecture of traits of agronomic importance.
[本文引用: 4]
DOI:10.3389/fpls.2018.01690URLPMID:30519252 [本文引用: 2]
Protein content (PC), an important trait in soybean (Glycine max) breeding, is controlled by multiple genes with relatively small effects. To identify the quantitative trait nucleotides (QTNs) controlling PC, we conducted a multi-locus genome-wide association study (GWAS) for PC in 144 four-way recombinant inbred lines (FW-RILs). All the FW-RILs were phenotyped for PC in 20 environments, including four locations over 4 years with different experimental treatments. Meanwhile, all the FW-RILs were genotyped using SoySNP660k BeadChip, producing genotype data for 109,676 non-redundant single-nucleotide polymorphisms. A total of 129 significant QTNs were identified by five multi-locus GWAS methods. Based on the 22 common QTNs detected by multiple GWAS methods or in multiple environments, pathway analysis identified 8 potential candidate genes that are likely to be involved in protein synthesis and metabolism in soybean seeds. Using superior allele information for 22 common QTNs in 22 elite and 7 inferior lines, we found higher superior allele percentages in the elite lines and lower percentages in the inferior lines. These findings will contribute to the discovery of the polygenic networks controlling PC in soybean, increase our understanding of the genetic foundation and regulation of PC, and be useful for molecular breeding of high-protein soybean varieties.
DOI:10.1186/s13059-017-1289-9URLPMID:28838319
Soybean (Glycine max [L.] Merr.) is one of the most important oil and protein crops. Ever-increasing soybean consumption necessitates the improvement of varieties for more efficient production. However, both correlations among different traits and genetic interactions among genes that affect a single trait pose a challenge to soybean breeding.
DOI:10.1016/j.plantsci.2017.04.013URLPMID:29241572
To investigate the genetic basis of variation in oil and protein contents in soybean seeds, a diverse collection of 421 mainly Chinese soybean cultivars was genotyped using 1536 SNPs, mostly from candidate genes related to acyl-lipid metabolism and from regions harboring known QTL. Six significant associations were identified for each of seed oil and protein contents which individually explained 2.7-5.9% of the phenotypic variance. Six associations occurred in or near known QTL and the remaining are putative novel QTL. Ten significant associations influenced the oil content without decreasing protein content, and vice versa. One SNP was pleiotropic, with opposite effects on oil and protein contents. The genetic region covering Map-6076 and-6077 was shown to be involved in controlling oil content in soybean by integrating the results of association mapping with information on known QTL and tissue-specific expression data. This region was subject to strong selection during the genetic improvement of soybean. Our results not only confirm and refine the map positions of known QTL but also contribute to a further elucidation of the genetic architecture of protein and oil contents in soybean seeds by identifying new associations exhibiting pleiotropic effects on seed protein and oil contents.
DOI:10.1111/pbi.12249URLPMID:25213593
Soya bean is a major source of edible oil and protein for human consumption as well as animal feed. Understanding the genetic basis of different traits in soya bean will provide important insights for improving breeding strategies for this crop. A genome-wide association study (GWAS) was conducted to accelerate molecular breeding for the improvement of agronomic traits in soya bean. A genotyping-by-sequencing (GBS) approach was used to provide dense genome-wide marker coverage (&gt;47,000 SNPs) for a panel of 304 short-season soya bean lines. A subset of 139 lines, representative of the diversity among these, was characterized phenotypically for eight traits under six environments (3 sites × 2 years). Marker coverage proved sufficient to ensure highly significant associations between the genes known to control simple traits (flower, hilum and pubescence colour) and flanking SNPs. Between one and eight genomic loci associated with more complex traits (maturity, plant height, seed weight, seed oil and protein) were also identified. Importantly, most of these GWAS loci were located within genomic regions identified by previously reported quantitative trait locus (QTL) for these traits. In some cases, the reported QTLs were also successfully validated by additional QTL mapping in a biparental population. This study demonstrates that integrating GBS and GWAS can be used as a powerful complementary approach to classical biparental mapping for dissecting complex traits in soya bean.
DOI:10.3389/fpls.2017.02014URLPMID:29250088
Soybean is one of the most important economic crops for both China and the United States (US). The exchange of germplasm between these two countries has long been active. In order to investigate genetic relationships between Chinese and US soybean germplasm, 277 Chinese soybean accessions and 300 US soybean accessions from geographically diverse regions were analyzed using 5,361 SNP markers. The genetic diversity and the polymorphism information content (PIC) of the Chinese accessions was higher than that of the US accessions. Population structure analysis, principal component analysis, and cluster analysis all showed that the genetic basis of Chinese soybeans is distinct from that of the USA. The groupings observed in clustering analysis reflected the geographical origins of the accessions; this conclusion was validated with both genetic distance analysis and relative kinship analysis. FST-based and EigenGWAS statistical analysis revealed high genetic variation between the two subpopulations. Analysis of the 10 loci with the strongest selection signals showed that many loci were located in chromosome regions that have previously been identified as quantitative trait loci (QTL) associated with environmental-adaptation-related and yield-related traits. The pattern of diversity among the American and Chinese accessions should help breeders to select appropriate parental accessions to enhance the performance of future soybean cultivars.
DOI:10.1016/j.molp.2017.12.016URLPMID:29305230
The complex genetic architecture of quality traits has hindered efforts to modify seed nutrients in soybean. Genome-wide association studies were conducted for seed composition, including protein, oil, fatty acids, and amino acids, using 313 diverse soybean germplasm accessions genotyped with a high-density SNP array. A total of 87 chromosomal regions were identified to be associated with seed composition, explaining 8%-89% of genetic variances. The candidate genes GmSAT1, AK-HSDH, SACPD-C, and FAD3A of known function, and putative MtN21 nodulin, FATB, and steroid-5-α-reductase involved in N2 fixation, amino acid biosynthesis, and fatty acid metabolism were found at the major-effect loci. Further analysis of additional germplasm accessions indicated that these major-effect loci had been subjected to domestication or modern breeding selection, and the allelic variants and distributions were relevant to geographic regions. We also revealed that amino acid concentrations related to seed weight and to total protein had a different genetic basis. This helps uncover the in-depth genetic mechanism of the intricate relationships among the seed compounds. Thus, our study not only provides valuable genes and markers for soybean nutrient improvement, both quantitatively and qualitatively, but also offers insights into the alteration of soybean quality during domestication and breeding.
DOI:10.1534/g3.114.013433URLPMID:25246241
Soybean oil and meal are major contributors to world-wide food production. Consequently, the genetic basis for soybean seed composition has been intensely studied using family-based mapping. Population-based mapping approaches, in the form of genome-wide association (GWA) scans, have been able to resolve loci controlling moderately complex quantitative traits (QTL) in numerous crop species. Yet, it is still unclear how soybean's unique population history will affect GWA scans. Using one of the populations in this study, we simulated phenotypes resulting from a range of genetic architectures. We found that with a heritability of 0.5, ~100% and ~33% of the 4 and 20 simulated QTL can be recovered, respectively, with a false-positive rate of less than ~6×10(-5) per marker tested. Additionally, we demonstrated that combining information from multi-locus mixed models and compressed linear-mixed models improves QTL identification and interpretation. We applied these insights to exploring seed composition in soybean, refining the linkage group I (chromosome 20) protein QTL and identifying additional oil QTL that may allow some decoupling of highly correlated oil and protein phenotypes. Because the value of protein meal is closely related to its essential amino acid profile, we attempted to identify QTL underlying methionine, threonine, cysteine, and lysine content. Multiple QTL were found that have not been observed in family-based mapping studies, and each trait exhibited associations across multiple populations. Chromosomes 1 and 8 contain strong candidate alleles for essential amino acid increases. Overall, we present these and additional data that will be useful in determining breeding strategies for the continued improvement of soybean's nutrient portfolio.
DOI:10.1007/s00122-014-2348-1URLPMID:24952096
Four major SPC-specific loci were identified, and these accounted for 8.5-15.1 % of the phenotypic variation, thus explaining why certain soybean varieties have a high PC but a low SPC. Water-soluble protein content (SPC) is a critical factor in both food quality and the production of isolated soybean proteins. However, few data are available regarding the genetic control and the mechanisms contributing to elevated SPC. In this study, a soybean collection of 192 accessions from a wide geographic range was used to identify genomic regions associated with soybean protein content (PC) and SPC using an association mapping approach employing 1,536 SNP makers and 232 haplotypes. The diverse panel revealed a large genetic variation in PC and SPC. Association mapping was performed using three methods to minimize false-positive associations. This resulted in 4/8 SNPs and 3/6 haplotypes that were significantly associated with soybean PC/SPC in two or more environments based on the mixed model. An SNP that was highly significantly associated with PC, BARC-021267-04016, was localized 0.28 cM away from a published glycinin gene, G7, and was detected across all four environments. Four major SPC-specific loci, BARC-029149-06088, BARC-018023-02499, BARC-041663-08059 and haplotype 15 (hp15), were stably identified on chromosomes five and eight and explained 8.5-15.1 % of the phenotypic variation. Moreover, a glutelin type-B 2-like gene was identified on chromosome eight and may be related to soybean protein solubility. These markers, which are located in previously reported QTL, reconfirmed previous findings and may be important targets for the identification of protein-related genes. These novel SNPs and haplotypes are important for further understanding the genetic basis of PC and SPC. In addition, by comparing the correlation and genetic loci between PC and SPC, we provide new insights into why certain soybean varieties have a high protein content but a low SPC.
DOI:10.1007/s00122-019-03304-5URLPMID:30806741
Genomic regions associated with seed protein, oil and amino acid contents were identified by genome-wide association analyses. Geographic distributions of haplotypes indicate scope of improvement of these traits. Soybean [Glycine max (L.) Merr.] protein and oil are used worldwide in feed, food and industrial materials. Increasing seed protein and oil contents is important; however, protein content is generally negatively correlated with oil content. We conducted a genome-wide association study using phenotypic data collected from five environments for 621 accessions in maturity groups I-IV and 34,014 markers to identify quantitative trait loci (QTL) for seed content of protein, oil and several essential amino acids. Three and five genomic regions were associated with seed protein and oil contents, respectively. One, three, one and four genomic regions were associated with cysteine, methionine, lysine and threonine content (g?kg-1 crude protein), respectively. As previously shown, QTL on chromosomes 15 and 20 were associated with seed protein and oil contents, with both exhibiting opposite effects on the two traits, and the chromosome 20 QTL having the most significant effect. A multi-trait mixed model identified trait-specific QTL. A QTL on chromosome 5 increased oil with no effect on protein content, and a QTL on chromosome 10 increased protein content with little effect on oil content. The chromosome 10 QTL co-localized with maturity gene E2/GmGIa. Identification of trait-specific QTL indicates feasibility to reduce the negative correlation between protein and oil contents. Haplotype blocks were defined at the QTL identified on chromosomes 5, 10, 15 and 20. Frequencies of positive effect haplotypes varied across maturity groups and geographic regions, providing guidance on which alleles have potential to contribute to soybean improvement for specific regions.
[本文引用: 2]
[本文引用: 2]
DOI:10.1270/jsbbs.53.133URL [本文引用: 1]
DOI:10.2135/cropsci2012.03.0153URL [本文引用: 1]
Demand for soybean [Glycine max (L.) Merr.] meal has increased worldwide and soybean importers often offer premiums for soybean containing higher contents of protein and oil. Objectives were to detect quantitative trait loci (QTL) associated with soybean seed protein, oil, and seed weight in a soybean mapping population and confirm detected QTL across genetic backgrounds and environments. Two populations of 216 and 156 recombinant inbred lines were developed from Magellan x PI 438489B and Magellan x PI 567516C crosses, respectively, and grown in two Missouri environments in 2008. More than 900 simple sequence repeat (SSR) and single nucleotide polymorphism (SNP) markers were used for mapping in each population. Across environments and genetic backgrounds, we have identified seven QTL for protein, six for oil, and four for seed weight. Two QTL were detected in common for protein and oil, one on chromosome (Chr.) 5 and another on Chr. 6. Additionally, we have detected one new seed weight QTL on Chr. 6, in the same region of protein and oil QTL. Confirmed protein and oil QTL on Chrs. 5 and 6 may be important targets to find candidate genes involved in modification of protein and oil contents and seed weight using genetic and genomic approaches. Also, SSR and SNP markers closely associated with these QTL can be useful for marker-assisted selection.
DOI:10.1007/s00122-013-2083-zURLPMID:23536049 [本文引用: 1]
Soybean [Glycine max (L.) Merrill] seed oil is the primary global source of edible oil and a major renewable and sustainable feedstock for biodiesel production. Therefore, increasing the relative oil concentration in soybean is desirable; however, that goal is complex due to the quantitative nature of the oil concentration trait and possible effects on major agronomic traits such as seed yield or protein concentration. The objectives of the present study were to study the relationship between seed oil concentration and important agronomic and seed quality traits, including seed yield, 100-seed weight, protein concentration, plant height, and days to maturity, and to identify oil quantitative trait loci (QTL) that are co-localized with the traits evaluated. A population of 203 F4:6 recombinant inbred lines, derived from a cross between moderately high oil soybean genotypes OAC Wallace and OAC Glencoe, was developed and grown across multiple environments in Ontario, Canada, in 2009 and 2010. Among the 11 QTL associated with seed oil concentration in the population, which were detected using either single-factor ANOVA or multiple QTL mapping methods, the number of QTL that were co-localized with other important traits QTL were six for protein concentration, four for seed yield, two for 100-seed weight, one for days to maturity, and one for plant height. The oil-beneficial allele of the QTL tagged by marker Sat_020 was positively associated with seed protein concentration. The oil favorable alleles of markers Satt001 and GmDGAT2B were positively correlated with seed yield. In addition, significant two-way epistatic interactions, where one of the interacting markers was solely associated with seed oil concentration, were identified for the selected traits in this study. The number of significant epistatic interactions was seven for yield, four for days to maturity, two for 100-seed weight, one for protein concentration, and one for plant height. The identified molecular markers associated with oil-related QTL in this study, which also have positive effects on other important traits such as seed yield and protein concentration, could be used in the soybean marker breeding programs aimed at developing either higher seed yield and oil concentration or higher seed protein and oil concentration per hectare. Alternatively, selecting complementary parents with greater breeding values due to positive epistatic interactions could lead to the development of higher oil soybean cultivars.
[本文引用: 1]
DOI:10.1111/pbr.12091URL [本文引用: 2]
DOI:10.1007/s00122-012-1990-8URLPMID:23052024 [本文引用: 1]
Water soluble protein content (SPC) plays an important role in the functional efficacy of protein in food products. Therefore, for the identification of quantitative trait loci (QTL) associated with SPC, 212 F(2:9) lines of the recombinant inbred line (RIL) population derived from the cross of ZDD09454 × Yudou12 were grown along with the parents, in six different environments (location × year) to determine inheritance and map solubility-related genes. A linkage map comprising of 301 SSR markers covering 3,576.81 cM was constructed in the RIL population. Seed SPC was quantified with a macro-Kjeldahl procedure in samples collected over multiple years from three locations (Nantong in 2007 and 2008, Zhengzhou in 2007 and 2008, and Xinxiang in 2008 and 2009). SPC demonstrated transgressive segregation, indicating a complementary genetic structure between the parents. Eleven putative QTL were associated with SPC explaining 4.5-18.2 % of the observed phenotypic variation across the 6 year/location environments. Among these, two QTL (qsp8-4, qsp8-5) near GMENOD2B and Sat_215 showed an association with SPC in multiple environments, suggesting that they were key QTL related to protein solubility. The QTL × environment interaction demonstrated the complex genetic mechanism of SPC. These SPC-associated QTL and linked markers in soybean will provide important information that can be utilized by breeders to improve the functional quality of soybean varieties.
DOI:10.2135/cropsci2004.7840URL [本文引用: 1]
DOI:10.1139/g06-112URLPMID:17426766 [本文引用: 1]
Linolenic acid and seed lipoxygenases are associated with off flavours in soybean products. F5 recombinant inbred lines (RILs) from a cross between a low linolenic acid line (RG10) and a seed lipoxygenase-free line (OX948) were genotyped for simple sequence repeats (SSR), random amplified polymorphic DNA (RAPD), sequence-tagged sites (STS), and cleaved amplified polymorphic sequence (CAPS) markers and evaluated for seed and agronomic traits at 3 Ontario locations in 2 years. One hundred twenty markers covering 1247.5 cM were mapped to 18 linkage groups (LGs) in the soybean composite genetic map. Seed lipoxygenases L-1 and L-2 mapped as single major genes to the same location on LG G13-F. L-3 mapped to LG G11-E. This is the first report of a map position for L-3. A major quantitative trait locus (QTL) associated with reduced linolenic acid content was identified on LG G3-B2. QTLs for 12 additional seed and agronomic traits were detected. Linolenic acid content, linoleic acid content, yield, seed mass, protein content, and plant height QTL were present in at least 4 of 6 environments. Three to 8 QTLs per trait were detected that accounted for up to 78% of total variation. Linolenic acid and lipoxygenase loci did not overlap yield QTL, suggesting that it should be possible to develop high-yielding lines resistant to oxidative degradation by marker-assisted selection (MAS).
DOI:10.1016/S1671-2927(09)60197-8URL [本文引用: 1]
DOI:10.1007/BF00226905URLPMID:24202678 [本文引用: 1]
The objectives of this study were to present an expanded soybean RFLP map and to identify quantitative trait loci (QTL) in soybean [Glycine max (L.) Merr.] for seed protein and oil content. The study population was formed from a cross between a G. max experimental line (A81-356022) and a G. soja Sieb. and Zucc. plant introduction (PI 468916). A total of 252 markers was mapped in the population, forming 31 linkage groups. Protein and oil content were measured on seed harvested from a replicated trial of 60 F2-derived lines in the F3 generation (F2∶3 lines). Each F2∶3 line was genotyped with 243 RFLP, five isozyme, one storage protein, and three morphological markers. Significant (P&lt;0.01) associations were found between the segregation of markers and seed protein and oil content. Segregation of individual markers explained up to 43% of the total variation for specific traits. All G. max alleles at significant loci for oil content were associated with greater oil content than G. soja alleles. All G. soja alleles at significant loci for protein content were associated with greater protein content than G. max alleles.
DOI:10.1007/BF00224058URLPMID:24162390 [本文引用: 1]
Molecular markers provide the opportunity to identify marker-quantitative trait locus (QTL) associations in different environments and populations. Two soybean [Glycine max (L.) Merr.] populations, 'Young' x PI 416 937 and PI 97100 x 'Coker 237', were evaluated with restriction fragment length polymorphism (RFLP) markers to identify additional QTLs related to seed protein and oil. For the Young x PI 416937 population, 120 F4-derived lines were secored for segregation at 155 RFLP loci. The F4-derived lines and two parents were grown at Plains, G.a., and Windblow and Plymouth, N.C. in 1994, and evaluated for seed protein and oil. For the PI 97100 x Coker 237 population, 111 F2-derived lines were evaluated for segregation at 153 RFLP loci. Phenotypic data for seed protein and oil were obtained in two different locations (Athens, G.a., and Blackville, S.C.) in 1994. Based on single-factor analysis of variance (ANOVA) for the Young x PI 416937 population, five of seven independent markers associated with seed protein, and all four independent markers associated with seed oil in the combined analysis over locations were detected at all three locations. For the PI 97 100 x Coker 237 population, both single-factor ANOVA and interval mapping were used to detect QTLs. Using single-factor ANOVA, three of four independent markers for seed protein and two of three independent markers for seed oil were detected at both locations. In both populations, singlefactor ANOVA, revealed the consistency of QTLs across locations, which might be due to the high heritability and the relatively few QTLs with large effects conditioning these traits. However, interval mapping of the PI 97100 x Coker 237 population indicated that QTLs identified at Athens for seed protein and oil were different from those at Blackville. This might result from the power of QTL mapping being dependent on the level of saturation of the genetic map. Increased seed protein was associated with decreased seed oil in the PI 97100 x Coker 237 population (r = -0.61). There were various common markers (P[Symbol: see text]0.05) on linkage groups (LG) E, G,H,K, and UNK2 identified for both seed protein and oil. One QTL on LG E was associated with seed protein in both populations. The other QTLs for protein and oil were population specific.
[本文引用: 1]
DOI:10.1007/s00122-015-2490-4URLPMID:25754423 [本文引用: 1]
After two cycles of marker-assisted breeding on three loci, lines with transgressive segregation of 8.22-9.32 % protein content were developed based on four original soybean parents with 35.35-44.83 % protein content. Marker-assisted breeding has been an innovative approach in conventional breeding, which is to be further demonstrated, especially for quantitative traits. A study on continuous transgressive breeding for seed protein content (SPC) in soybean using marker-assisted procedures is reported here. The SPC of the recombinant inbred line (RIL) population XG varied in 38.04-47.54 % under five environments with P 1 of 35.35 %, P 2 of 44.34 % and total heritability of 89.11 %. A transgressive segregant XG30 with SPC 45.53 % was selected for further improvement. The linkage mapping of XG showed its genetic constitution composed of five additive QTL (32.16 % of phenotypic variation or PV) and two pairs of epistatic QTL (2.96 % PV) using 400 SSR markers with the remnant heritability 53.99 % attributed to the undetected collective of minor QTL. Another transgressive segregant WT133 with SPC 48.39 % was selected from the RIL population WT (44.83 % SPC for both parents). XG30 and WT133 were genotyped on the three major additive QTL (Prot-08-1, Prot-14-1 and Prot-19-2) as A 2 A 2 B 2 B 2 L 1 L 1 and A 1 A 1 B 1 B 1 L 2 L 2 , respectively. From WT133×XG30, surprising transgressive progenies were obtained, among which the recombinants with all three positive alleles A 2 _B 2 _L 2 _ performed the highest SPC, especially that of Prot-08-1. The five F 2-derived superior families showed their means higher than the high parent value in F 2:3 and F 2:4 and more transgressive effect in F 2:5:6, with the highest as high as 54.15 %, or 4.82 and 9.32 % more than WT133 and its original high parent, respectively. This study demonstrated the efficiency of marker-assisted procedure in breeding for transgressive segregation of quantitative trait.
