 ,西北农林科技大学农学院,陕西杨凌 712100
Benefits and Marginal Effect of Dry Matter Accumulation and Yield in Maize and Soybean Intercropping Patterns
ZHAO DeQiang, LI Tong, HOU YuTing, YUAN JinChuan, LIAO YunCheng,College of Agronomy, Northwest A & F University, Yangling 712100, Shaanxi通讯作者:
责任编辑: 杨鑫浩
收稿日期:2019-09-11接受日期:2019-10-17网络出版日期:2020-05-16
| 基金资助: |
Received:2019-09-11Accepted:2019-10-17Online:2020-05-16
作者简介 About authors
赵德强,E-mail:zhaodeqiang@nwafu.edu.cn。

摘要
关键词:
Abstract
Keywords:
PDF (926KB)元数据多维度评价相关文章导出EndNote|Ris|Bibtex收藏本文
本文引用格式
赵德强, 李彤, 侯玉婷, 元晋川, 廖允成. 玉米大豆间作模式下干物质积累和产量的边际效应及其系统效益[J]. 中国农业科学, 2020, 53(10): 1971-1985 doi:10.3864/j.issn.0578-1752.2020.10.005
ZHAO DeQiang, LI Tong, HOU YuTing, YUAN JinChuan, LIAO YunCheng.
0 引言
【研究意义】土地资源紧缺是当今农业生产面临的突出问题,要保证我国粮食安全就必须进一步提高现有土地的生产效率,间作种植模式作为古代中国农业的精华,仍然可以为现今农业生产提高土地生产力做出贡献[1]。大面积连续种植单一作物容易造成土地养分偏耗、加速土壤退化、更容易受到病虫害的威胁[2],而间作种植能保持农田生态系统物种多样性、维持生态系统稳定性、提高资源利用效率[3],此外多样化的粮食产出也可以帮助资金和劳力有限的农民应对复杂多变的农产品市场[4]。加强间作种植技术的研究和知识储备也符合国家“藏粮于地,藏粮于技”的粮食战略[5]。【前人研究进展】玉米大豆间作基于作物高矮搭配合适、养分喜好不同和大豆的固氮作用等优势,被认为是更高效的间作系统[6]。普遍研究认为,玉米大豆间作系统可提高作物的光合效率[7]和养分吸收[8],有利于提高作物生物量和产量,表现出较强的土地生产力优势[9]。也有研究发现,间作大豆受玉米遮阴影响光合速率降低,产量下降[10]。张晓娜等[11]研究表明,间作提高了干物质积累速率,提高了玉米籽粒分配率,降低了大豆籽粒分配率;而崔亮等[12]研究认为间作提高了大豆籽粒分配率。因此,玉米大豆间作系统中,作物的干物质积累与分配规律有待进一步研究。【本研究切入点】较多****已对间作系统中作物光合效率、氮磷养分利用、产量构成和土壤微生物等方面做了较多研究,对间作作物的生长规律提出了合理的解释。但由于研究区域和管理措施不同,难以在同一水平下进行相互比较总结规律,此外,对间作边际效应研究多集中于2种作物总体,没有细化到间作系统中每一行作物,关于边际效应对作物营养器官物质输出的研究也鲜有报道。【拟解决的关键问题】本研究以不同行比的玉米大豆间作为研究对象,系统研究不同行比下玉米和大豆行际间的边际效应,结合作物干物质积累和营养器官物质输出,探明不同作物配比对间作效应的影响,明确间作效应的范围和强度,总结边际效应和干物质分配之间的规律,以期为构建高产优质高效的间作模式提供理论依据和技术支持。1 材料与方法
1.1 研究区概况
试验在中国陕西省杨陵区西北农林科技大学曹新庄试验农场(N34°18′21″,E34°5′34″)进行,该区属于黄土高原南部,气候类型为温带大陆季风气候,年均气温13.2℃,年均降水量633 mm,其中50%—60%降雨量集中在8—10月。土壤类型为塿土,pH为7.8,土壤有机质含量14 g·kg-1,全氮含量1.04 g·kg-1,速效磷含量18 mg·kg-1,速效钾含量129 mg·kg-1。2017年生育期内降水235.0 mm,2018年生育期内降水837.3 mm。1.2 试验设计
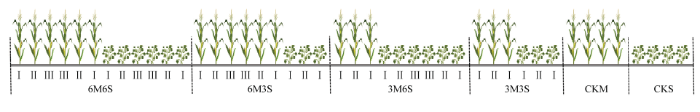
如图1所示,试验设置了6行玉米6行大豆间作(6M6S)、6行玉米3行大豆间作(6M3S)、3行玉米6行大豆间作(3M6S)、3行玉米3行大豆间作(3M3S)、单作玉米(CKM)和单作大豆(CKS)6个处理, 3次重复,共18个小区,小区面积为132 m2(22m×6m)。间作处理中,玉米带和大豆带相邻各行依次记为I、II和III行。6M6S、6M3S、3M6S、3M3S处理中玉米种植面积的百分比分别为50.0%、66.7%、33.3%、50.0%,大豆种植面积的百分比分别为50.0%、33.3%、66.7%、50.0%。图1
 新窗口打开|下载原图ZIP|生成PPT
图1间作种植示意图
Fig. 1Schematic diagram of intercropping planting
供试品种为陕单609(玉米)和陕豆125(大豆),于2017年6月18日和2018年6月15日进行播种,采用穴播的方式,玉米和大豆的行距均为60 cm,株距均为15 cm,玉米带和大豆带之间的距离为60 cm。供试肥料为尿素、磷酸二铵、硫酸钾,于整地前撒施,施肥量为180 kg N·hm-2,58 kg P2O5·hm-2,30 kg K2O·hm-2。试验小区种植是按照玉米大豆自西向东依次安排,保证大豆的光照条件。
1.3 取样方法与项目测定
2017年于玉米的4叶期(V4)、吐丝期(R1)和成熟期(R7)取样,分别对应大豆的分枝前期(V4)、盛花期(R2)、成熟期(R7)。2018年于玉米的3叶期(V3)、拔节期(V6)、大喇叭口期(V12)、吐丝期(R1)、灌浆期(R3)和成熟期(R7)取样,分别对应大豆的苗期(V3)、分枝前期(V4)、分枝后期(V5)、盛花期(R2)、鼓粒期(R5)和成熟期(R7)。取样时每个小区选择生长发育一致、叶片完整的健康植株,取4株齐地面砍倒,按器官分样,经烘箱105℃杀青60 min,85℃烘干至恒重,称重用于测定植株干物质积累量。在成熟期取样,单作处理选取相邻的2行,去除行两头的各3株植株,其余植株齐地面完整收回实验室用于测定生物量;籽粒不烘干,挂置于风干棚内晾晒至含水率为14%时称重,计算产量。间作处理的I行、II行和III行分开取样,于各小区内共收取2行,其他操作方式与单作相同。
1.4 计算方法
1.4.1 生物量和产量测定 单位面积间作生物量TBMS=BIM×μM+BIS×μS[13]。式中,TBMS为间作生物量,BIM为间作玉米生物量,BIS为间作大豆生物量,μM为间作玉米种植面积的百分比,μS为间作大豆种植面积的百分比,将公式中生物量改为产量计算间作产量(TYMS)。1.4.2 作物干物质积累速率计算 干物质积累速率=2次取样地上部干物质积累量的差值/2次采样时间间隔。
1.4.3 土地当量比计算 土地当量比(LER)作为衡量土地利用效率大小的重要指标之一,当其>1时,表明提高了土地利用效率,间作系统有间作优势;当其<1则表明间作体系降低了土地利用效率,表现为间作劣势。生物量土地当量比LERBMS= LERBM + LERBS =BIM/BSM+BIS/BSS[14]。式中,LERBMS为生物量土地当量比,LERBM为玉米偏生物量土地当量比,LERBS为大豆偏生物量土地当量比,BSM为单作玉米生物量,BSS为单作大豆生物量。将公式中生物量改为产量计算间作产量土地当量比(LERYMS)。
1.4.4 种间相对竞争力计算 种间相对竞争力(A)用于衡量间作系统中一种作物相对于另一种作物对光温水肥等自然资源竞争能力的大小,本文只计算了玉米相对于大豆的资源竞争能力大小(AMS),当其>0表明玉米对资源的竞争能力大于大豆,当其<0表明玉米对资源的竞争能力小于大豆。生物量种间相对竞争力ABMS=BIM/(BSM×μM)-BIS/(BSS×μS)[15]。式中,ABMS为玉米相对于大豆的生物量种间相对竞争力。将公式中生物量改为产量计算间作产量种间相对竞争力(AYMS)。
1.4.5 营养器官物质输出量、输出率和贡献率计算 输出量=该器官最大干重-该器官成熟时干重[16],输出率=(该器官最大干重-该器官成熟时干重)/该器官最大干重×100%[16],贡献率=(该器官最大干重-该器官成熟时干重)/籽粒干重×100%[16]。
1.5 数据分析
采用Excel 2017进行数据整理,用SPSS 19进行数据方差分析,用Origin 8绘图。2 结果
2.1 不同种植模式下作物干物质积累动态以及生物量和产量
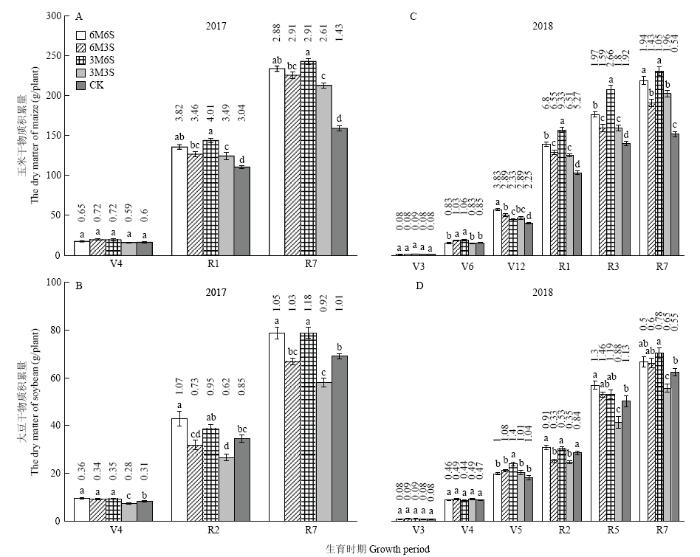
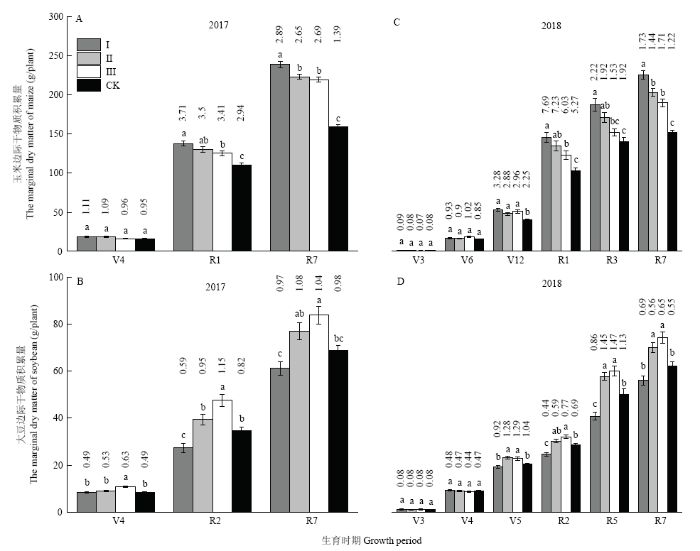
如图2所示,随着生育期推进,玉米和大豆的干物质积累量逐渐增加,不同田间配置处理直接影响玉米和大豆干物质的积累。由图2-A、C可知,各处理玉米干物质积累量在拔节期前差异不显著,从大喇叭口期之后变化趋势为3M6S>6M6S>3M3S>6M3S>CKM,成熟期3M6S处理在2017和2018年比CKM分别高52.63%和51.85%。玉米干物质积累速率为单峰曲线,在吐丝期达到最大,2年分别达到3.54 g·d-1和6.89 g·d-1,其中2018年试验中3M6S处理达到9.33 g·d-1,比CKM高77.04%。由图2-B、D可知,盛花期后6M6S和3M6S处理的大豆干物质积累量高于CKS,其中成熟期时比CKS高了10.43%和13.48%;3M3S处理的大豆干物质积累量最低,其中成熟期时比CKS低了15.48%。大豆干物质积累速率呈现双峰曲线,在分枝后期和鼓粒期较高,2018年试验中分别达到1.11 g·d-1和1.19 g·d-1。2018年盛花期时,各间作处理大豆的干物质积累速率低于分枝后期和鼓粒期,平均只有0.53 g·d-1,比CKS低了58.49%。图2
 新窗口打开|下载原图ZIP|生成PPT
图2不同种植模式下单株干物质积累速率和积累量
不同小写字母表示P<0.05下差异显著。柱状图上的数字表示该生育时期与上一生育时期之间的干物质积累速率。玉米的V3,V4,V6,V12,R1,R3和R7分别对应3叶期,4叶期,拔节期,大喇叭口期,吐丝期,灌浆期和成熟期。大豆的V3,V4,V5,R2,R5和R7分别对应苗期,分枝前期,分枝后期,盛花期,鼓粒期和成熟期。下同
Fig. 2The per plant dry matter accumulation rate and amount under different planting patterns
Different small letters mean significantly different at P<0.05. The number on the column indicates the rate of dry matter accumulation between the growth period and the previous growth period. V3, V4, V6, V12, R1, R3 and R7 of maize correspond to the three-leaf,four-leaf stage, jointing, big flare, silking, filling, and maturity stage, V3, V4, V5, R2, R5 and R7 of soybean correspond to the seedling, early branching, late branching, flowering, filling, and maturity stage. The same as below
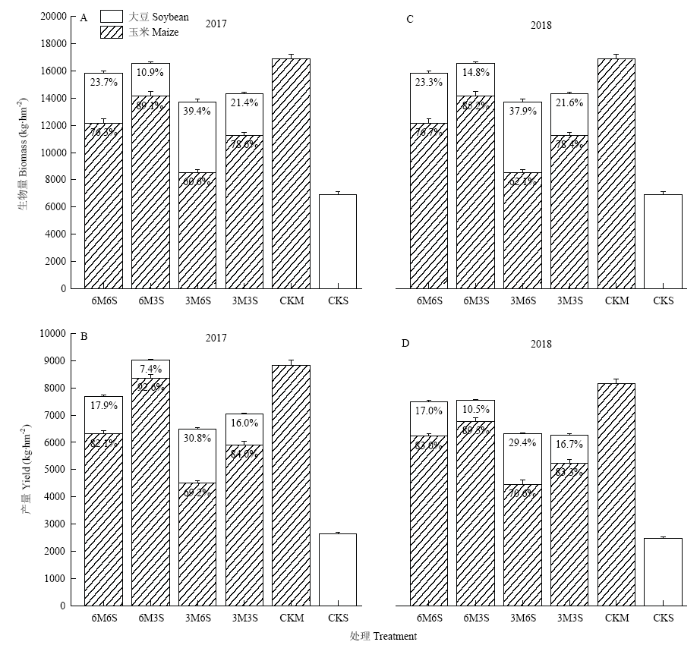
图3结果表明,间作系统中,玉米在生物量和产量中占主导地位,且在产量中的占比高于生物量。各处理生物量和产量的高低与玉米的种植占比相同,均为CKM>6M3S>6M6S>3M3S>3M6S>CKS。6M6S和3M3S处理中玉米和大豆种植比例均为1﹕1,但前者生物量和产量高于后者,主要贡献来自大豆。
图3
 新窗口打开|下载原图ZIP|生成PPT
图3不同种植模式下作物生物量和产量
Fig. 3The biomass and yield under different planting patterns
间作处理中,6M3S处理的玉米生物量和产量最高,分别达到15 299.35 kg·hm-2和7 553.38 kg·hm-2,为CKM的88.63%和88.95%;3M6S处理的大豆生物量和产量最高,分别达到5 519.02 kg·hm-2和1 926.13 kg·hm-2,为CKS的75.65%和75.57%。
2.2 不同行比玉米大豆间作的单株干物质积累量及边际效应
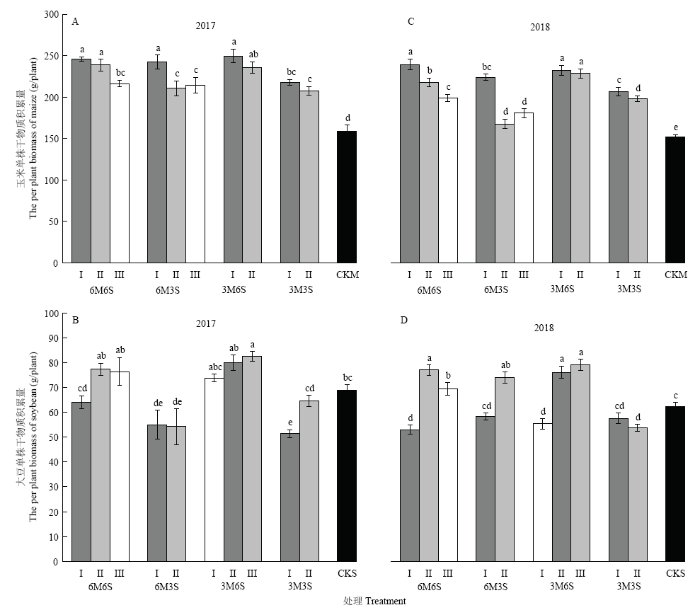
如图4所示,2年试验中,间作处理各行玉米单株干物质积累量显著高于CKM,除6M3S处理外,均呈现距离大豆带越远单株干物质积累量越低的趋势;6M6S和3M6S处理的III行大豆单株干物质积累量高于CKS,除3M6S处理外,I行大豆单株干物质积累量低于CKS。间作作物的单株干物质积累量表现出边际效应(图5),玉米在大喇叭口期之后变化趋势为I行>II行>III行>单作,且除2018年灌浆期外,各行玉米的单株干物质积累量总是显著高于单作;大豆在分枝后期之后变化趋势为III行>II行>单作>I行,且II行、III行与单作之间差异显著。成熟期时,间作玉米I行、II行和III行的单株干物质积累量分别为CKM的149.48%、137.15%和130.34%,间作大豆I行、II行和III行分别为CKS的89.18%、106.02%和117.11%。图4
 新窗口打开|下载原图ZIP|生成PPT
图4不同种植模式下成熟期I、II、III行单株干物质积累量
Fig. 4The per plant dry matter accumulation of I, II, and III row at maturity under different planting patterns
图5
 新窗口打开|下载原图ZIP|生成PPT
图5不同种植模式下边际单株干物质积累速率和积累量
Fig. 5The marginal per plant dry matter accumulation rate and amount under different planting patterns
2.3 不同行比玉米大豆间作的单株产量及边际效应
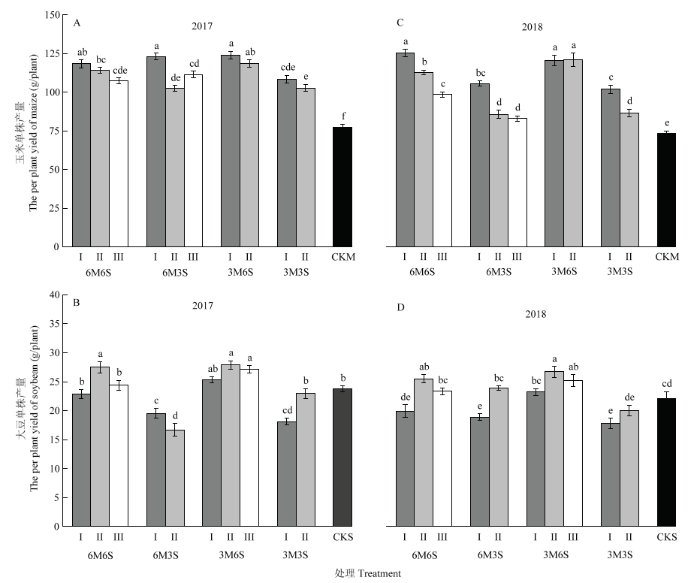
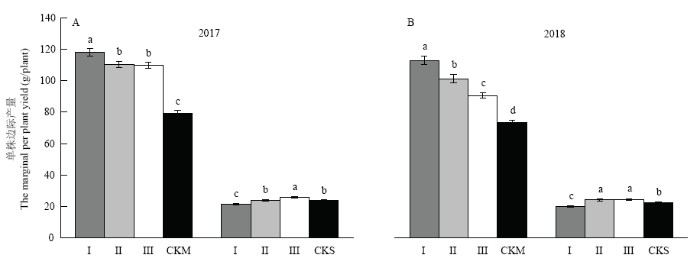
各处理的各行单株产量规律(图6)与各行单株干物质积累量(图4)规律基本一致,其中3M6S处理II行玉米的单株产量显著高于其他间作处理的II行玉米,II行大豆的单株产量也高于其他间作处理的II行大豆。从图7可知,间作各行玉米表现出距离大豆带越远,单株产量降低的趋势,I行、II行和III行的单株产量分别为CKM的151.43%、138.51%和130.84%;各行大豆则相反,表现出距离玉米带越远,单株产量升高的趋势,I行、II行和III行的单株产量分别为CKS的90.22%、104.16%和109.03%。图6
 新窗口打开|下载原图ZIP|生成PPT
图6不同种植模式下I、II、III行成熟期单株产量
Fig. 6The per plant yield at maturity under different planting patterns
图7
 新窗口打开|下载原图ZIP|生成PPT
图7不同种植模式下成熟期边际单株产量
Fig. 7The marginal per plant yield under different planting patterns
2.4 不同行比玉米大豆间作对土地当量比和种间相对竞争力的影响
表1中2年所有间作处理的LERYMS和LERBMS均大于1,2017和2018年最高的3M6S处理分别为1.33和1.27,最低的3M3S处理分别为1.13和1.09。所有间作处理的AMS均大于0,2017年试验中AYMS和ABMS最高的3M6S处理分别为0.66和0.61,最低的3M6S处理分别为0.39和0.38;2018年试验中AYMS最高的6M3S处理为0.51,最低的6M3S处理为0.28,ABMS最高的3M3S处理为0.44,最低的6M3S处理为0.20。Table 1
表1
表1不同行比玉米大豆间作下土地当量比和种间相对竞争力变化
Table 1
| 年份 Year | 处理 Treatment | 产量土地当量比LERYMS | 产量种间相对竞争力AYMS | 生物量土地当量比LERBMS | 生物量种间相对竞争力ABMS | ||||||||
|---|---|---|---|---|---|---|---|---|---|---|---|---|---|
| 玉米 Maize | 大豆 Soybean | LERYMS | 玉米 Maize | 大豆 Soybean | AYMS | 玉米 Maize | 大豆 Soybean | LERBMS | 玉米 Maize | 大豆 Soybean | ABMS | ||
| 2017 | 6M6S | 0.77 | 0.56 | 1.33b | 1.43 | 1.04 | 0.39c | 0.73 | 0.53 | 1.26a | 1.47 | 1.05 | 0.42c |
| 6M3S | 1.02 | 0.27 | 1.30c | 1.42 | 0.76 | 0.66a | 0.93 | 0.26 | 1.20b | 1.40 | 0.79 | 0.61a | |
| 3M6S | 0.55 | 0.81 | 1.36a | 1.53 | 1.14 | 0.39c | 0.51 | 0.76 | 1.27a | 1.53 | 1.14 | 0.38c | |
| 3M3S | 0.72 | 0.46 | 1.18d | 1.34 | 0.86 | 0.48b | 0.67 | 0.42 | 1.09c | 1.34 | 0.84 | 0.50b | |
| 2018 | 6M6S | 0.76 | 0.52 | 1.28ab | 1.53 | 1.04 | 0.49ab | 0.72 | 0.53 | 1.25a | 1.44 | 1.07 | 0.38a |
| 6M3S | 0.83 | 0.32 | 1.15b | 1.24 | 0.97 | 0.28c | 0.84 | 0.26 | 1.10b | 1.26 | 1.06 | 0.20b | |
| 3M6S | 0.55 | 0.75 | 1.30a | 1.64 | 1.13 | 0.51a | 0.51 | 0.76 | 1.27a | 1.52 | 1.13 | 0.39a | |
| 3M3S | 0.64 | 0.43 | 1.07c | 1.28 | 0.85 | 0.43b | 0.67 | 0.42 | 1.09b | 1.33 | 0.89 | 0.44a | |
新窗口打开|下载CSV
2.5 不同种植模式下作物茎叶干物质积累及输出规律
如表2所示,玉米叶干物质量到吐丝期或灌浆期时达到最大,成熟期时有所下降。间作提高了玉米叶的输出量,各行输出量随着距离大豆带越远呈增加的趋势。2017年玉米叶的干物质输出率和贡献率均高于CKM,且均随着距离大豆带越远呈降低的趋势,而2018年却相反。2017年间作处理的I行输出率最高,达到23.3%,2018年CKM的输出率最高,达到26.8%。2017年间作处理的I行贡献率最高,为14.2%,2018年CKM的贡献率最高,为19.1%。Table 2
表2
表2不同种植模式下玉米叶干物质量积累及输出规律
Table 2
| 行号 Number | 处理 Treatment | 2017 | 2018 | |||||||||||||
|---|---|---|---|---|---|---|---|---|---|---|---|---|---|---|---|---|
| V4 | R1 | R7 | 输出量 Remobilization amount (g/plant) | 输出率 Remobilization efficiency (%) | 贡献率 Conversion rate (%) | V3 | V6 | V12 | R1 | R3 | R7 | 输出量 Remobilization amount (g/plant) | 输出率 Remobilization efficiency (%) | 贡献率 Conversion rate (%) | ||
| I | 6M6S | 19.11 | 77.67 | 58.18 | 19.49 | 25.1 | 16.5 | 1.04 | 15.31 | 59.93 | 76.45 | 81.44 | 64.15 | 17.29 | 21.2 | 15.0 |
| 6M3S | 21.19 | 69.96 | 50.89 | 19.06 | 27.3 | 15.7 | 1.10 | 17.81 | 56.65 | 78.55 | 77.17 | 60.72 | 16.45 | 21.3 | 15.0 | |
| 3M6S | 18.55 | 73.51 | 57.65 | 15.87 | 21.6 | 12.8 | 1.07 | 19.74 | 46.95 | 88.17 | 87.82 | 67.93 | 19.89 | 22.7 | 16.9 | |
| 3M3S | 16.55 | 68.32 | 55.44 | 12.88 | 18.9 | 11.8 | 1.30 | 14.66 | 48.41 | 67.41 | 65.63 | 49.05 | 16.58 | 25.3 | 15.1 | |
| 均值Mean | 18.85 | 72.37 | 55.54 | 16.83 | 23.3 | 14.2 | 1.13 | 16.88 | 52.98 | 77.64 | 78.01 | 60.46 | 17.55 | 22.5 | 15.5 | |
| II | 6M6S | 17.86 | 64.55 | 52.13 | 12.42 | 19.2 | 10.9 | 0.97 | 15.25 | 55.72 | 69.62 | 70.42 | 59.53 | 10.88 | 15.5 | 10.1 |
| 6M3S | 20.85 | 57.13 | 45.88 | 11.25 | 19.7 | 10.7 | 1.26 | 16.23 | 48.77 | 68.05 | 66.93 | 51.98 | 14.95 | 22.3 | 17.2 | |
| 3M6S | 20.48 | 70.89 | 51.39 | 19.50 | 27.5 | 16.5 | 1.18 | 18.44 | 42.43 | 81.97 | 83.64 | 62.99 | 20.65 | 24.7 | 19.3 | |
| 3M3S | 15.54 | 61.05 | 45.39 | 15.65 | 25.6 | 15.1 | 0.81 | 15.49 | 45.27 | 69.17 | 70.21 | 49.53 | 20.67 | 29.4 | 22.1 | |
| 均值Mean | 18.68 | 63.40 | 48.70 | 14.71 | 23.2 | 13.3 | 1.05 | 16.35 | 48.05 | 72.20 | 72.80 | 56.01 | 16.79 | 23.1 | 17.0 | |
| III | 6M6S | 15.36 | 60.57 | 49.23 | 11.34 | 18.7 | 10.5 | 1.01 | 14.75 | 55.95 | 66.19 | 64.77 | 50.59 | 14.18 | 21.9 | 14.9 |
| 6M3S | 17.14 | 59.00 | 48.05 | 10.95 | 18.6 | 9.8 | 0.84 | 21.79 | 45.62 | 60.01 | 66.37 | 49.33 | 17.04 | 25.7 | 20.0 | |
| 均值Mean | 16.68 | 61.00 | 47.84 | 13.16 | 21.6 | 12.0 | 0.93 | 17.09 | 48.72 | 66.89 | 68.54 | 51.37 | 17.17 | 25.1 | 19.1 | |
| CKM | CKM | 16.23 | 52.66 | 41.82 | 10.84 | 20.6 | 13.6 | 1.04 | 15.49 | 40.23 | 56.29 | 57.96 | 42.40 | 15.56 | 26.8 | 19.1 |
新窗口打开|下载CSV
表3中玉米茎的输出量、输出率和贡献率均高于玉米叶,2年平均分别高了12.0 g/plant、21.3%和11.3%。间作处理玉米茎的输出量高于CKM,且随着距离大豆带越远呈降低的趋势;输出率也随着距离大豆带越远呈降低的趋势,且III行玉米的输出率低于CKM;只有2018年II行玉米的贡献率高于CKM。
Table 3
表3
表3不同种植模式下玉米茎干物质量积累及输出规律
Table 3
| 行号 Number | 处理 Treatment | 2017 | 2018 | ||||||||||
|---|---|---|---|---|---|---|---|---|---|---|---|---|---|
| R1 | R7 | 输出量Remobilization amount (g/plant) | 输出率Remobilization efficiency (%) | 贡献率Conversion rate (%) | V12 | R1 | R3 | R7 | 输出量Remobilization amount (g/plant) | 输出率Remobilization efficiency (%) | 贡献率 Conversion rate (%) | ||
| I | 6M6S | 72.05 | 39.71 | 32.34 | 44.9 | 27.3 | 25.77 | 75.14 | 50.82 | 41.62 | 33.52 | 44.6 | 29.1 |
| 6M3S | 61.59 | 35.31 | 26.28 | 42.7 | 21.7 | 24.36 | 67.01 | 45.05 | 35.35 | 31.66 | 47.3 | 28.9 | |
| 3M6S | 66.10 | 32.40 | 33.70 | 51.0 | 27.1 | 20.19 | 70.98 | 54.59 | 32.97 | 38.01 | 53.5 | 32.3 | |
| 3M3S | 56.75 | 34.82 | 21.93 | 38.6 | 20.1 | 20.82 | 57.59 | 39.17 | 35.88 | 21.70 | 37.7 | 19.8 | |
| 均值Mean | 64.12 | 35.56 | 28.56 | 44.5 | 24.2 | 22.78 | 67.68 | 47.40 | 36.45 | 31.22 | 46.2 | 27.6 | |
| II | 6M6S | 67.42 | 37.60 | 29.82 | 44.2 | 26.1 | 23.96 | 65.28 | 39.24 | 37.07 | 28.20 | 43.2 | 26.3 |
| 6M3S | 55.59 | 24.45 | 31.14 | 56.0 | 29.6 | 20.97 | 59.01 | 31.03 | 21.86 | 37.15 | 63.0 | 42.7 | |
| 3M6S | 65.27 | 36.91 | 28.36 | 43.5 | 23.9 | 18.24 | 72.28 | 47.49 | 38.69 | 33.58 | 46.5 | 31.4 | |
| 3M3S | 55.82 | 37.05 | 18.77 | 33.6 | 18.1 | 19.47 | 55.75 | 40.81 | 38.19 | 17.56 | 31.5 | 18.8 | |
| 均值Mean | 61.03 | 34.00 | 27.02 | 44.3 | 24.5 | 20.66 | 63.08 | 39.64 | 33.95 | 29.12 | 46.2 | 29.5 | |
| III | 6M6S | 62.14 | 37.17 | 24.97 | 40.2 | 23.1 | 24.06 | 65.86 | 40.03 | 36.97 | 28.89 | 43.9 | 30.4 |
| 6M3S | 59.96 | 35.45 | 24.51 | 40.9 | 22.0 | 19.62 | 54.25 | 35.31 | 31.14 | 23.10 | 42.6 | 27.2 | |
| 均值Mean | 59.74 | 35.92 | 23.82 | 39.9 | 21.7 | 21.84 | 59.73 | 38.95 | 35.06 | 24.67 | 41.3 | 27.4 | |
| CKM | CKM | 52.51 | 30.90 | 21.62 | 41.2 | 27.2 | 17.30 | 50.17 | 38.78 | 27.29 | 22.88 | 45.6 | 28.1 |
新窗口打开|下载CSV
如表4所示,大豆茎叶的输出量和输出率均低于玉米,分别只有7.4 g/plant和19.8%,但是贡献率均高于玉米,平均达到27.8%。间作II行和III行的大豆输出量均高于CKS,其中II行的输出量最高,2017和2018年分别为9.02 g/plant和8.85 g/plant。2017年试验中只有间作II行的大豆输出率和贡献率高于CKS,2018年间作各行大豆的输出率和贡献率均高于CKS,且随着距离玉米带的远近呈降低的趋势。
Table 4
表4
表4不同种植模式下大豆茎叶干物质积累及输出规律
Table 4
| 行号 Number | 处理 Treatment | 2017 | 2018 | |||||||||||||
|---|---|---|---|---|---|---|---|---|---|---|---|---|---|---|---|---|
| V4 | R2 | R7 | 输出量Remobilization amount (g/plant) | 输出率Remobilization efficiency (%) | 贡献率Conversion rate (%) | V3 | V4 | V5 | R2 | R5 | R7 | 输出量 Remobilization amount (g/plant) | 输出率 Remobilization efficiency (%) | 贡献率 Conversion rate (%) | ||
| I | 6M6S | 9.18 | 29.23 | 22.95 | 6.28 | 21.5 | 28.1 | 1.02 | 9.11 | 17.46 | 28.42 | 32.92 | 25.80 | 7.12 | 21.6 | 29.2 |
| 6M3S | 8.43 | 26.23 | 21.78 | 4.45 | 17.0 | 22.8 | 1.11 | 9.47 | 20.78 | 23.33 | 33.59 | 26.58 | 7.01 | 20.9 | 24.3 | |
| 3M6S | 8.17 | 40.39 | 31.19 | 9.20 | 22.8 | 32.9 | 0.99 | 8.57 | 27.98 | 37.23 | 41.81 | 35.89 | 5.92 | 14.2 | 16.3 | |
| 3M3S | 7.07 | 23.35 | 20.07 | 3.28 | 14.1 | 18.2 | 0.97 | 8.82 | 19.52 | 25.07 | 30.88 | 26.03 | 4.85 | 15.7 | 16.9 | |
| 均值Mean | 8.21 | 29.80 | 24.00 | 5.80 | 19.5 | 26.4 | 1.02 | 8.99 | 21.44 | 28.51 | 34.80 | 28.58 | 6.22 | 17.9 | 21.1 | |
| II | 6M6S | 9.63 | 48.38 | 38.66 | 9.72 | 20.1 | 35.4 | 0.88 | 8.34 | 21.28 | 32.33 | 47.83 | 37.59 | 10.24 | 21.4 | 29.1 |
| 6M3S | 10.07 | 51.25 | 38.16 | 13.10 | 25.6 | 66.6 | 1.14 | 9.28 | 21.80 | 27.21 | 46.23 | 33.78 | 12.45 | 26.9 | 34.2 | |
| 3M6S | 11.07 | 45.35 | 36.90 | 8.45 | 18.6 | 31.1 | 1.10 | 8.02 | 24.73 | 32.39 | 42.25 | 37.32 | 4.93 | 11.7 | 13.1 | |
| 3M3S | 7.92 | 30.00 | 25.18 | 4.82 | 16.1 | 21.3 | 1.09 | 9.95 | 21.47 | 24.23 | 32.38 | 24.58 | 7.80 | 24.1 | 29.5 | |
| 均值Mean | 9.67 | 43.75 | 34.72 | 9.02 | 20.6 | 37.3 | 1.05 | 8.90 | 22.32 | 29.04 | 42.17 | 33.32 | 8.85 | 21.0 | 26.1 | |
| III | 6M6S | 10.40 | 44.20 | 35.89 | 8.30 | 18.8 | 34.1 | 1.07 | 9.21 | 20.94 | 31.71 | 42.71 | 33.09 | 9.62 | 22.5 | 29.5 |
| 3M6S | 8.96 | 31.14 | 24.08 | 7.07 | 22.7 | 27.4 | 1.26 | 9.33 | 19.28 | 21.56 | 33.05 | 27.47 | 5.58 | 16.9 | 22.5 | |
| 均值Mean | 9.24 | 37.27 | 29.97 | 7.30 | 19.6 | 29.1 | 1.12 | 9.35 | 21.00 | 26.64 | 37.58 | 29.61 | 7.96 | 21.2 | 27.7 | |
| CKS | CKS | 8.37 | 35.02 | 27.94 | 7.08 | 20.2 | 29.8 | 1.01 | 8.95 | 20.38 | 28.62 | 34.41 | 28.87 | 5.54 | 16.1 | 18.3 |
新窗口打开|下载CSV
3 讨论
3.1 间作种植下作物干物质积累特点及与产量的关系
张晓娜等[11]研究结果表明玉米大豆间作中玉米处于竞争优势地位,干物质积累速率和积累量高于单作,间作大豆却同时表现出高于或低于单作两种情况。本研究结果与之相同,此外本研究中AMS>0,表明玉米处于竞争优势地位,大豆处于竞争劣势地位。PRASAD等[17]研究表明间作玉米有更充足的光照,提高了干物质积累速率,而间作大豆受到遮阴影响,干物质积累速率下降,本试验中玉米吐丝期(大豆盛花期)时,间作玉米的干物质积累速率比单作平均高了30.97%,间作大豆比单作平均低了19.04%,其他生育时期间作玉米和大豆的平均干物质积累速率均高于单作。由于玉米的收获指数要高于大豆[18],本研究中所有间作处理中玉米在产量中的占比均大于在生物量中的占比。王竹等[19]和LESOING等[20]研究发现大幅宽种植减弱了作物之间的竞争,缓解了大豆的遮阴问题,减少了玉米对大豆的资源掠夺,有利于提高间作系统的生物量和产量,尤其是大豆的。本研究中大幅宽种植的6M6S处理中玉米产量占比达到91.1%,为CKM产量的88.7%,远远高于小幅宽种植的3M3S处理。GAO等[21]、HAUGGAARD-NIELSEN等[22]和HE等[23]研究认为小带宽玉米带保证了间作玉米的充足光照和通风,同时玉米的根系可以充分延伸到大豆条带吸收养分,大带宽大豆种植避免了邻近玉米的遮光。本试验中大幅宽玉米小幅宽大豆种植的3M6S处理具有最高的相对生物量和产量。3.2 玉米大豆间作的边际效应分析
REN等[24]研究表明玉米大豆间作提高了作物干物质积累速率和积累量,生物量和产量高于单作种植,表现出间作优势。本试验采用每一行取样的方法,细致分析了玉米大豆的间作效益,发现与大豆间作能显著提高玉米I行的干物质积累速率和积累量,对II行和III行也有一定的促进作用,除3M6S处理外,间作大豆的I行均表现出生长受到抑制,II行、III行大豆均表现出生长促进作用。范元芳等[25]研究认为玉米大豆间作时,大豆受到邻近玉米的遮光影响;王一等[26]研究认为大豆花期以后遮阴降低了叶片最大光合速率,降低了单株粒重;本研究中遮阴是I行大豆干物质积累量和产量降低的主要原因。高阳等[27]对玉米大豆间作系统根系分布规律的研究发现,玉米根系可以向大豆带延伸200—300 cm,HAUGGAARD-NIELSEN等[28]和KESSEL等[29]对玉米大豆间作氮阻遏和氮转移效应的研究发现,玉米对大豆的养分掠夺可以提高大豆自身固氮作用,是玉米大豆间作优势或劣势的重要原因,这也表明本研究中玉米和大豆的间作效应可以到达内部第III行180 cm处。本试验中3M6S处理的I行大豆生长没有受玉米抑制,可能是由于该处理中玉米占比较少,玉米对大豆带的养分掠夺没有造成大豆养分缺乏,反而有助于大豆氮阻遏效应的解除,使得2种作物均获得了最高的单株生物量和产量。3.3 玉米大豆间作模式下茎叶干物质积累和转运规律
作物叶片和茎秆的光合产物输出是籽粒营养物质的重要来源,隋鹏祥等[30]和徐田军等[31]研究表明玉米茎叶转运的营养物质占籽粒重量的29.6%;唐江华等[32]研究表明大豆茎叶转运的营养物质占籽粒重量的36.8%。本研究与齐文增等[33]和闫艳红等[34]研究结果一致的是玉米和大豆的茎叶干物质积累量均在吐丝期和鼓粒期达到最大,之后随着营养物质转运至籽粒而下降。茎秆和叶片是作物主要的光合器官,其光合产物向籽粒运输形成产量,因此较高的茎叶干物质积累量是保证较高输出量的前提,本研究中玉米和大豆的茎叶输出量总是随着干物质积累量的增加而增加。玉米大豆间作条件下,作物光照条件[35]、土壤养分状况[36]以及农田小气候[37]均发生改变,对作物干物质积累和转运产生影响,而且受籽粒发育状况[38]和输出路径畅通程度[39,40]等诸多因素影响,茎叶的输出率和贡献率表现出多变规律,本研究结果也是如此。此外间作处理中,间作大豆I行的输出量、输出率和贡献率较低可能是由于受玉米遮光影响,大豆将更多的光合产物用于茎秆的伸长[41]。4 结论
本研究围绕玉米大豆间作不同行比配置,分析作物干物质积累和产量的边际效应及系统收益,结果表明玉米和大豆间作提高了玉米的干物质积累速率和积累量,也提高了大豆的干物质积累量,但降低了大豆盛花期时的干物质积累速率。间作提高了土地当量比,其中玉米的贡献大于大豆,本研究条件下3M6S处理生产效率最高。玉米大豆间作表现出强烈的边际效应,间作玉米的I行、II行和III行,以及间作大豆的II行和III行均表现为间作优势,间作大豆I行为间作劣势。茎叶较高的干物质积累量是保证向籽粒输出更多营养的前提,间作提高了茎叶干物质输出量,但茎叶输出率和贡献率受多种因素影响,其分配规律还需进一步研究验证。参考文献 原文顺序
文献年度倒序
文中引用次数倒序
被引期刊影响因子
[D].
[本文引用: 1]
[D].
[本文引用: 1]
[本文引用: 1]
[本文引用: 1]
[本文引用: 1]
[本文引用: 1]
[D].
[本文引用: 1]
[D].
[本文引用: 1]
.(
URL [本文引用: 1]
(
URL [本文引用: 1]
[本文引用: 1]
[本文引用: 1]
[本文引用: 1]
[D].
[本文引用: 1]
[D].
[本文引用: 1]
[本文引用: 1]
[本文引用: 1]
[本文引用: 1]
[本文引用: 1]
[本文引用: 2]
[本文引用: 2]
[本文引用: 1]
[本文引用: 1]
[本文引用: 1]
[本文引用: 1]
DOI:10.1016/S0378-4290(01)00156-3URL [本文引用: 1]
DOI:10.3724/SP.J.1006.2016.00751URL [本文引用: 3]

研究茬口对轮作作物的产量贡献及干物质积累与分配规律的影响,对于优化作物高产高效栽培理论和技术具有重要意义。本研究在甘肃河西绿洲灌区,通过田间试验,研究了前茬小麦不同秸秆还田方式(25 cm高茬收割免耕, NTSS; 25 cm高茬等量秸秆覆盖免耕, NTS; 25 cm高茬等量秸秆翻压, TIS; 低茬收割翻耕, CT)对轮作玉米干物质积累和分配及产量的影响,以期为该区前茬小麦轮作玉米生产模式提供优化依据。结果表明,与CT相比,NTSS、NTS、TIS提高了玉米抽穗后干物质的积累量,两年平均高4.8%~12.7%,NTS较NTSS、TIS具有更高的干物质累积作用;NTSS、NTS、TIS可提高玉米叶、茎、鞘对籽粒的贡献率,提高幅度平均为12.8%~25.0%、6.3%~11.3%、18.3%~78.4%,其中NTS较NTSS、TIS提高作用更突出。NTSS、NTS、TIS提高了玉米的籽粒产量,增幅为11.3%~17.5%,其中NTS两年籽粒产量最高,分别达到13 470 kg hm-2和13 274 kg hm-2,较TIS高5.6%~9.0%;穗粒数增加是小麦秸秆还田提高轮作玉米产量的主要原因。同时NTS获得较高的收获指数,提高比例为6.4%~8.4%,说明NTS较其他处理增产的另一原因是提高了收获指数。本研究表明,其前茬小麦秸秆覆盖结合免耕(NTS)可作为绿洲灌区优化后茬玉米干物质累积规律及获得高产的理想耕作措施。
DOI:10.3724/SP.J.1006.2016.00751URL [本文引用: 3]
研究茬口对轮作作物的产量贡献及干物质积累与分配规律的影响,对于优化作物高产高效栽培理论和技术具有重要意义。本研究在甘肃河西绿洲灌区,通过田间试验,研究了前茬小麦不同秸秆还田方式(25 cm高茬收割免耕, NTSS; 25 cm高茬等量秸秆覆盖免耕, NTS; 25 cm高茬等量秸秆翻压, TIS; 低茬收割翻耕, CT)对轮作玉米干物质积累和分配及产量的影响,以期为该区前茬小麦轮作玉米生产模式提供优化依据。结果表明,与CT相比,NTSS、NTS、TIS提高了玉米抽穗后干物质的积累量,两年平均高4.8%~12.7%,NTS较NTSS、TIS具有更高的干物质累积作用;NTSS、NTS、TIS可提高玉米叶、茎、鞘对籽粒的贡献率,提高幅度平均为12.8%~25.0%、6.3%~11.3%、18.3%~78.4%,其中NTS较NTSS、TIS提高作用更突出。NTSS、NTS、TIS提高了玉米的籽粒产量,增幅为11.3%~17.5%,其中NTS两年籽粒产量最高,分别达到13 470 kg hm-2和13 274 kg hm-2,较TIS高5.6%~9.0%;穗粒数增加是小麦秸秆还田提高轮作玉米产量的主要原因。同时NTS获得较高的收获指数,提高比例为6.4%~8.4%,说明NTS较其他处理增产的另一原因是提高了收获指数。本研究表明,其前茬小麦秸秆覆盖结合免耕(NTS)可作为绿洲灌区优化后茬玉米干物质累积规律及获得高产的理想耕作措施。
[本文引用: 1]
[本文引用: 1]
[本文引用: 1]
[本文引用: 1]
[本文引用: 1]
[本文引用: 1]
DOI:10.1007/s11104-004-1305-1URL [本文引用: 1]
DOI:10.5814/j.issn.1674-764x.2012.02.009URL [本文引用: 1]
Intercropping can improve field microclimates, decrease the incidence of crop diseases, and increase crop yields, but the reasons for this remain unknown. Solar radiation is the most important environmental influence. To understand the mechanisms of intercropping we established an experiment consisting of three cropping patterns: a monocropping control (treatment A) and two intercropping treatments (B: two rows of maize and two rows of soybean intercropping; C: two rows of maize and four rows of soybean intercropping). Results show that compared to monocropping, intercropping increased the amount of light penetrating to inferior leaves in maize plants. Light intensity reaching maize plants at the heading stage in intercropping increased over two-fold at 30 cm above ground and 10-fold at 70 cm above ground, compared with monocropping. At the flowering to maturity stage, light intensity at 110, 160 and 210 cm above ground among maize plants was greatly increased in intercropping compared with monocropping, by some five-fold, two-fold and 12%, respectively. Moreover, light intensity declined more slowly at the measured heights in the intercropping system compared with monocropping. From the 7–18th leaf, light intensity per leaf increased two-fold in intercropping compared with monocropping. Daily light duration increased more than a mean of 5 h per day per leaf in intercropping compared with monocropping. The biological characters of maize including thousand kernel weight, yield per plant and area of ear leaves were all greater in intercropping than monocropping. These results suggest that, for maize, intercropping improves light density and duration significantly and this may contribute to biomass and yield increases.
DOI:10.1016/j.eja.2015.10.001URL [本文引用: 1]
[本文引用: 1]
[本文引用: 1]
DOI:10.3864/j.issn.0578-1752.2016.11.004URL [本文引用: 1]
【Objective】The present work studied the effect of shading on photosynthesis and chlorophyll fluorescence characteristics, including leaf area, lamina mass per unit area, chlorophyll content, yield characters, photosynthetic and fluorescence parameters of three soybean cultivars at different growth stages, in order to support the development of maize-soybean intercropping and relay-intercropping systems in hilly and mountainous area of southern China.【Method】Three cultivars named Guixia 2, Nandou 12 and C103, whose period and total days for growth were different with each other, were studied. Soybean plants were shaded by shading nets with 50% transmittance during growth stages of emergence to full-bloom (VER2), emergence to pod-fill (VER5), and full-bloom to full-ripe (R2R8), respectively. Plants grown under natural light were used as control (CK). Leaf area, lamina mass per unit area, chlorophyll content, photosynthetic and fluorescence parameters, as well as yield characters were measured and analyzed. 【Result】 Compared to the control (CK), leaf area, chlorophyll (a+b) content and apparent quanta efficiency at the VER2 stage increased by 15.5%, 13.0% and 74.1%, respectively; lamina mass per unit area, light compensation point and maximum photosynthetic rate were decreased by 15.8%, 26.2% and 26.5%, respectively, compared to CK. Leaf area, chlorophyll (a+b) content and apparent quanta efficiency increased by 0.3%, 10.5% and 28.1%, respectively at the R2R8 stage; while lamina mass per unit area, light compensation point and maximum photosynthetic rate decreased by 10.2%, 20.3% and 12.1%, respectively, compared to CK. When soybean plants were re-illuminated at full bloom stage, maximal quantum yield of PSII was decreased by 3.0% and non-photochemical quenching was increased by 26.8%, compared to CK. When plants were re-illuminated at pod-fill stage, maximal quantum yield of PSII was decreased by 8.5% and non-photochemical quenching was increased by 40.8%, compared to CK. In addition, at VER2, VER5 and R2R8 stages for Guixia 2, yields per plant decreased by 40.8%, 48.7% and 59.2%, and 100-seed weight decreased by 23.7%, 39.3% and 26.4%, respectively, compared to CK. For Nandou 12 at these stages, yields per plant decreased by 46.7%, 54.2% and 21.2%, and 100-seed weight were decreased by 3.9%, 19.9% and 26.1%, respectively, compared to CK. For C103, yields per plant decreased by 69.8%, 74.9% and 73.9%, and 100-seed weight decreased compared to CK by 68.8%, 69.6% and 71.6%, respectively.【Conclusion】Shading to the VER2 stage had a greater impact than for R2R8 on the photosynthesis and chlorophyll fluorescence characteristics of soybean. Photosynthetic capacity of soybean leaves made some recovery from shading when re-illuminated at R2. However, high-light stress was observed for plants re-illuminated at R5. Therefore, we suggest that maize-soybean intercropping to be a more advantageous system than relay-intercropping in hilly and mountainous area of southern China, with the perspective of minimizing the negative effects of shading on soybean photosynthesis. We also suggest, it is necessary to re-illuminate the soybean plants before full-bloom stage, in order to avoid an excessively long shading duration, when making decisions about on cultivar use, sowing time, and planting technology. The effect of shading period can influence yield of soybean. Moreover, the longer the shading duration last, the more the expected yield loss.
URL [本文引用: 1]
A field experiment was conducted to study the root distribution and water adsorption of maize and soybean in their strip intercropping. The results showed that under the condition of full irrigation, both maize roots and soybean roots were distributed approximately in triangle-shape in soil profile. Maize roots extended horizontally into a wider area, 58 cm away from the plant row and usually occurred in 16〖KG-*2〗-〖KG-*7〗22 cm soil layer. They were not restricted to maize root zone, but traversed into soybean strip zone. Soybean roots were horizontally distributed in a limited zone near the plant row, and their reached range was within about 26 cm. Both for maize and for soybean, their root mass density decreased with increasing distance from the plant row. About 90% of the root mass of maize and edge-row soybean was presented in 0〖KG-*2〗-〖KG-*7〗30 cm soil layer. The root mass density of maize at 10 cm from maize row was greater than that of soybean, but this density of soybean at 20 cm from maize strip was greater than that of maize. About 85% of root mass was distributed in 0〖KG-*2〗-〖KG-*7〗30 cm soil layer, and the variation of soil water content in intercropping strips also occurred mainly in this soil layer. In the maize/soybean strip intercropping system, soil water content decreased in the order of maize zone>soybean zone>middle zone, indicating that each strip-intercropped crop preferentially absorbed the soil water in its strip and utilized the soil water in intermingled zone later.
[本文引用: 1]
[本文引用: 1]
[本文引用: 1]
[本文引用: 1]
[本文引用: 1]
[本文引用: 1]
DOI:10.11869/j.issn.100-8551.2015.10.2026URL [本文引用: 1]
为探求适合北疆伊犁河谷夏大豆种植的耕作方式,就翻耕覆膜(TP)、翻耕(T)、旋耕(RT)、免耕(NT)4种耕作方式对夏大豆的干物质积累与分配规律及产量的影响进行了研究.结果表明,不同耕作方式处理的干物质积累均符合Logistic模型曲线,其中翻耕覆膜处理的动态累积模型的特征参数值最为协调,其单株干物质动态积累量不仅比其它各处理提早进入快速积累时期,且持续时间最长,最大相对生长速率出现也最早,使其干物质积累总量增多;翻耕覆膜处理的花前的干物质积累量对籽粒的转运量、转运率和对籽粒贡献率略低,但花后的提高显著,总体表现较优,产量最高,分别比翻耕、旋耕、免耕处理的高出7.42%、10.85%和16.05%,差异极显著(P<0.01),其单株荚数、单株粒数、百粒重、单株产量也均高于其它各处理,基本达极显著差异水平(P<0.01).本研究可为伊犁河谷夏大豆种植选择适宜的耕作方式提供一定的理论依据.
[本文引用: 1]
[本文引用: 1]
[本文引用: 1]
[本文引用: 1]
[本文引用: 1]
[本文引用: 1]
DOI:10.1016/j.plaphy.2007.03.016URL [本文引用: 1]
[本文引用: 1]
[本文引用: 1]
[本文引用: 1]
[本文引用: 1]
[本文引用: 1]
[本文引用: 1]
[本文引用: 1]
