 ,*河南省农业科学院粮食作物研究所, 河南郑州 450002
Genome-wide association study of ear cob diameter in maize
MA Juan, CAO Yan-Yong, LI Hui-Yong,*Institute of Cereal Crops, Henan Academy of Agricultural Sciences, Zhengzhou 450002, Henan, China通讯作者:
收稿日期:2020-08-14接受日期:2020-12-1网络出版日期:2021-01-04
| 基金资助: |
Received:2020-08-14Accepted:2020-12-1Online:2021-01-04
| Fund supported: |
作者简介 About authors
E-mail:

摘要
关键词:
Abstract
Keywords:
PDF (8297KB)元数据多维度评价相关文章导出EndNote|Ris|Bibtex收藏本文
本文引用格式
马娟, 曹言勇, 李会勇. 玉米穗轴粗全基因组关联分析[J]. 作物学报, 2021, 47(7): 1228-1238. doi:10.3724/SP.J.1006.2021.03048
MA Juan, CAO Yan-Yong, LI Hui-Yong.
玉米穗轴粗是一个重要的穗部性状, 与玉米产量相关性状具有密切关系。穗轴粗与穗粗具有显著正相关关系, 相关系数高达0.57~0.77[1,2,3,4], 与穗行数表现为中度极显著正相关(r = 0.41~0.45, P<0.01)[1-2,5]。此外, 穗轴粗与单穗粒重(r = 0.21~0.39)[2-3,6]、穗长(r = 0.34~0.36)[1,4]、行粒数(r = 0.25)[1]、单穗重(r = 0.21~0.22)[1,4]、粒长(r = 0.27)[4]、粒宽(r = 0.17~0.23)[4]和粒厚(r = 0.20)[2]也表现出显著正相关。玉米穗轴同时作为重要的工业原材料, 可以用来制备生物燃料纤维素乙醇[7], 在可持续能源发展中具有重要作用。穗轴粗是影响穗轴的一个重要性状, 与穗轴重存在较高正相关关系(r = 0.58~ 0.61, P<0.01)[1,2]。因此, 解析玉米穗轴粗的遗传机制, 对玉米产量和穗轴产量的提高均具有重要意义。
数量性状定位和全基因组关联分析(genome-wide association study, GWAS)是解析穗轴粗遗传构成的重要方法。Yi等[8]利用RIL (recombinant inbred line)群体和永久F2群体共鉴定13个控制穗轴粗的数量性状位点(quantitative trait loci, QTL), 其解释表型变异率为4.3%~8.7%。Guo等[2]利用郑58×昌7-2构成的231个F2:3家系在2个密度条件下挖掘13个穗轴粗QTL, 其中3个QTL的表型变异解释率为13.65%~24.71%, 为控制穗轴粗的主效QTL。Choe等[1]利用韩国糯玉米构成的F2:3群体鉴定到7个控制穗轴粗的QTL, 解释表型变异率为4.4%~12.9%。王帮太等[9]通过元分析(meta-analysis)整合了产量相关性状QTL, 发现穗轴粗存在5个一致性QTL, 其中, 2个Meta-QTL在籽粒产量的2个区域中出现。Su等[3]利用复合区间作图和最小绝对值收敛和选择算子分别鉴定2个和3个穗轴粗QTL。Zhu等[4]利用全基因组关联分析挖掘到5个穗轴粗显著关联SNP (single nucleotide polymorphisms)和6个候选基因。通过连锁分析和关联分析, Zhang等[10]共鉴定13个穗轴粗QTL和25个穗轴粗显著关联SNP。
目前, 有关玉米穗轴粗全基因组关联分析和候选基因的研究报道较少。本研究利用309份材料构成的关联群体对穗轴粗进行全基因组关联分析, 挖掘玉米穗轴粗显著关联位点和候选基因, 为选育穗轴产量高的玉米新品种提供理论基础。
1 材料与方法
1.1 材料和田间试验设计
选用国内玉米核心种质和黄淮海骨干自交系等309份材料作为关联群体。在2017年夏, 309份材料分别种植在河南新乡原阳(Yuanyang, YY)、河南商丘虞城(Yucheng, YC)、河南周口郸城(Dancheng, DC)和海南三亚(Sanya, SY)。2019年夏种植在原阳。采用随机区组试验设计, 2行区, 2粒播, 行距60 cm, 株距25 cm, 每行15株, 共设3个重复。脱粒后, 测量穗轴粗。1.2 表型数据统计分析
利用R语言对不同环境穗轴粗进行相关性分析。利用QTL IciMapping v4.0[11]对2017年原阳、郸城、虞城、三亚和2019年原阳进行联合方差分析, 并计算广义遗传力和最佳线性无偏估计值(best linear unbiased estimator, BLUE)。1.3 基因型鉴定和分析
309份自交系采用GBS (genotyping-by-sequencing)简化测序的方法进行基因型鉴定。测序仪为Illumina HiSeq PE150双端测序。利用BWA软件比对B73参考基因组(1.4 全基因组关联分析
利用2017年原阳、郸城、虞城、三亚、2019年原阳和BLUE环境的穗轴粗进行全基因组关联分析。为了控制假阳性和假阴性, 本研究利用FarmCPU (fixed and random model circulating probability unification)[12]、MLMM (multiple loci mixed linear model)[13]和CMLM (compressed mixed linear model)[14]方法的Q (群体结构) + K (亲缘关系)模型进行全基因组关联分析。群体结构Q值由Structure v2.3.4计算。其中亚群数为1~8, length of burn-in period为5000, 蒙特卡罗重复个数为50,000, 每个亚群数迭代次数为3。根据ΔK的结果, 确定亚群数为2时的Q值用于关联分析。亲缘关系K值由TASSEL v5.0软件的Centered_IBS方法计算。显著临界值设置为P=0.05/58129=8.60E-07。FarmCPU和MLMM方法显著位点的表型变异解释率(phenotypic variation explained, PVE)采用线性回归方法计算[15], CMLM方法的PVE由软件给出[13]。利用ANNOVAR对显著关联位点挖掘穗轴粗的候选基因。通过检索maizeGDB, 获得候选基因在不同组织的转录表达数据。2 结果与分析
2.1 穗轴粗表型数据分析
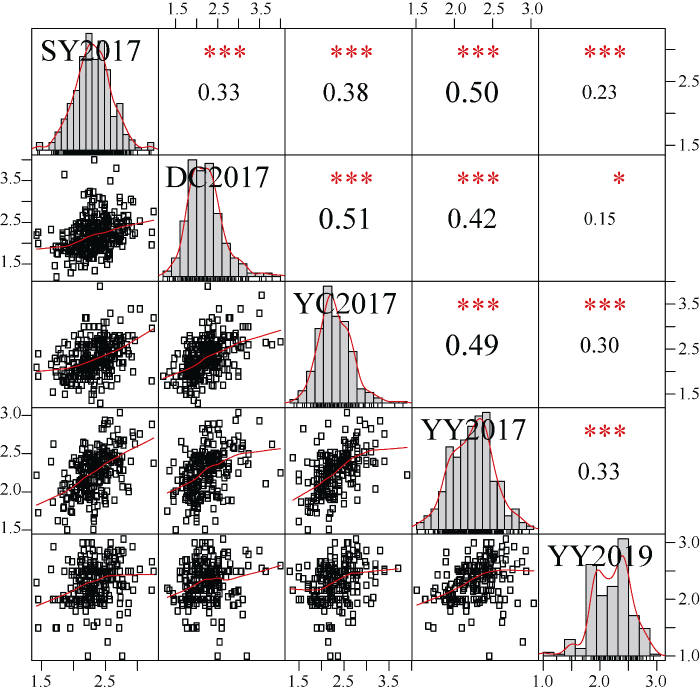
2017年和2019年不同环境关联群体的轴粗变异范围为1~4 cm。从柱状图的拟合曲线上看, 除了YY2019, 其余4个环境的穗轴粗基本符合正态分布(图1)。多环境穗轴粗的广义遗传率为0.77。相关性分析表明不同环境间均存在显著正相关关系(r = 0.15~0.51, P<0.05) (图1)。而且, 2017年4个环境的穗轴粗相关系数较高。其中, 2017年郸城和虞城穗轴粗的相关系数最高, 为0.51 (P<0.001), SY2017和YY2017间的相关系数为0.50 (P<0.001)。2019年原阳的穗轴粗与2017年4个环境的相关系数均较低(r = 0.15~0.33)。综合5个环境的联合方差分析表明, 关联群体基因型间存在极显著差异(表1), 说明材料间穗轴粗存在显著的遗传变异。不同环境间和基因型与环境互作也存在极显著差异(表1)。这说明, 尽管穗轴粗的遗传力较高, 也受到环境因素的影响。
Table 1
表1
表1多环境联合方差分析
Table 1
| 变异来源 Source | 自由度 Degree of freedom | 方差和 Sum of square | 均方 Mean of square | F值 F-value | P值 P-value |
|---|---|---|---|---|---|
| 区组/环境Block/Environment | 9 | 0.77 | 0.086 | 1.65 | 0.0970 |
| 基因型Genotype | 308 | 184.95 | 0.60 | 11.55 | <0.0001 |
| 环境Environment | 4 | 4.84 | 1.21 | 23.28 | <0.0001 |
| 基因型与环境互作 Genotype and environment interaction | 1036 | 170.71 | 0.16 | 3.17 | <0.0001 |
| 误差Error | 1694 | 88.04 | 0.052 |
新窗口打开|下载CSV
图1
 新窗口打开|下载原图ZIP|生成PPT
图1不同环境间穗轴粗相关性分析和柱状图
图中对角线方框为性状的柱状图, 上三角为相关系数和显著性程度。0.05、0.01、0.001 显著水平分别标*、**、***。下三角为不同环境间穗轴粗的散点图。SY、DC、YC和YY分别表示三亚、郸城、虞城和原阳。2017和2019代表年份。
Fig. 1Correlation analysis and histograms for ear cob diameter in multi-environments
Histograms are showed in diagonal. Correlation values and significant levels represented by asterisk are showed in upper triangular matrix. Significant levels 0.05, 0.01, and 0.001 are denoted by *, **, and ***, respectively. Scatter plots of ear cob diameter are showed in lower triangular matrix. SY, DC, YC, and YY represent Sanya, Dancheng, Yucheng, and Yuanyang, respectively. 2017 and 2019 denote years.
2.2 穗轴粗全基因组关联分析
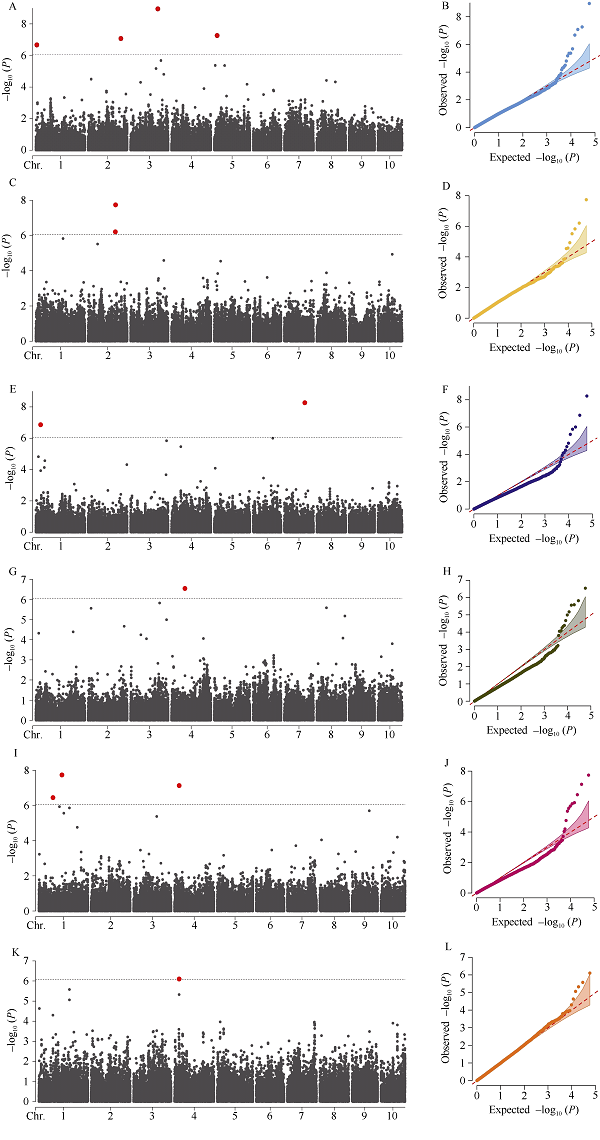
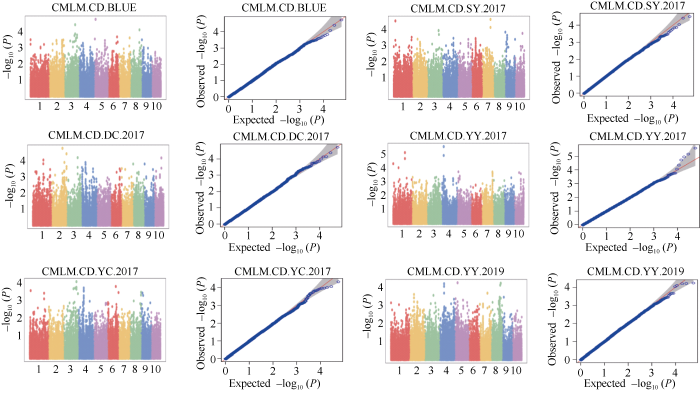
利用58,129个SNP标记对2017年郸城、虞城、原阳、三亚、2019年原阳和BLUE环境的穗轴粗进行全基因组关联分析, 共检测到12个穗轴粗显著关联SNP, 其中5个位于基因间, 4个位于内含子区和3个位于外显子区(表2)。CMLM方法没有检测到穗轴粗显著关联位点(附图1)。MLMM方法仅在2017年原阳检测到1个显著SNP, 即S4_29277313 (P = 7.96E-07), 位于第4号染色体上的外显子区, 解释表型变异小于1%, 为控制穗轴粗的微效位点(图2、表2和附图2)。FarmCPU方法对不同环境(除了2019年原阳)穗轴粗均具有较好的拟合效果(图2和附图2)。该模型共检测到12个显著SNP (P = 1.12E-09~6.12E-07) (图2和表2)。其中, BLUE环境检测到4个SNP, 2017年郸城、三亚、虞城和原阳分别检测到2个、2个、1个和3个显著SNP。其中, FarmCPU模型也检测到S4_29277313。FarmCPU模型共检测到4个主效SNP。S1_29006330位于第1号染色体bin1.02, 解释穗轴粗变异率为13.10%。在第2号染色体上, 检测到2个主效SNP, 即S2_170889116和S2_204602646, 分别解释穗轴粗变异率为14.17%和10.23%。S4_83821463位于第4号染色体bin4.05, 解释穗轴粗变异率为12.83%。不同环境间没有检测到相同的SNP, 这也说明穗轴粗受环境的影响较大。图2
 新窗口打开|下载原图ZIP|生成PPT
图2穗轴粗显著SNP的曼哈顿图和QQ图
A和B: BLUE环境FarmCPU方法; C和D: 2017年郸城FarmCPU方法; E和F: 2017年三亚FarmCPU方法; G和H: 2017年虞城FarmCPU方法; I和J: 2017年原阳FarmCPU方法; K和L: 2017年原阳MLMM方法。
Fig. 2Manhattan plots and quantile-quantile plots for significant SNP for ear cob diameter
A and B: FarmCPU in BLUE environment; C and D: FarmCPU in Dancheng in 2017; E and F: FarmCPU in Sanya in 2017; G and H: FarmCPU in Yucheng in 2017; I and J: FarmCPU in Yuanyang in 2017; K and L: MLMM in Yuanyang in 2017.
2.3 穗轴粗候选基因分析
从12个穗轴粗显著关联SNP中共挖掘17个候选基因(表2), 结合maizeGDB中基因的转录表达数据(附图3), 发现Zm00001d049399 (核仁素蛋白)和Zm00001d050368 (HMGA)在穗发育相关的4个组织(16~19 d的分生组织、2~4 mm穗原基、6~8 mm穗原基和雌小穗)中表达量较高, 分别为63.9~157.1和61.5~107.5。Zm00001d006323编码组蛋白-赖氨素N-甲基转移酶ATX4 (Arabidopsis trithorax 4), 在16~19 d的分生组织、2~4 mm穗原基和6~8 mm穗原基的表达量较高, 达到97.0~119.2。Zm 00001d013694编码的产物是single myb histone 6 (SMH6), 在4个组织中的表达量为15.5~19.3。Zm00001d050365是ZIM (zinc-finger protein expressed in inflorescence meristem)转录因子ZIM35, 在16~19 d的分生组织中表达量较高(17)。Zm00001d042528编码染色质组装因子1亚单位FAS1 (chromatin assembly factor 1 subunit FAS1), 在2~4 mm穗原基的表达量最高(21.2)。Zm0000 1d029814编码木葡聚糖内糖基转移酶/脱水酶蛋白XTH32 (xyloglucan endotransglucosylase/hydrolase protein 32), 在雌小穗中表达量较高(48), 在16~19 d的分生组织表达量为17.9。候选基因Zm0000 1d028280编码细胞壁连接的类受体激酶WAKL14 (wall-associated receptor kinase-like 14), 在4个组织中表达量较低(1.8~4.3)。Zm00001d027451 (S-腺苷-L-甲硫氨酸依赖的甲基转移酶超家族蛋白)、Zm00001d030556 (有机阳离子/肉碱转运体7)、Zm00001d029812 (苏氨酸合酶1)、Zm00001d005342和Zm00001d005339在4个组织中不表达或表达量较低。Table 2
表2
表2不同环境不同方法检测的穗轴粗显著SNP和候选基因
Table 2
| 方法Method | 标记名称 Marker name | 染色体 Chr. | 位置 Position (Mb) | bin | P值 P-value | MAF | 表型变异解释率 Phenotypic variance explained (%) | 环境 Environment | 类型 Type | 候选基因 Candidate genes |
|---|---|---|---|---|---|---|---|---|---|---|
| FarmCPU | S1_143964620 | 1 | 143.96 | 1.05 | 1.82E-08 | 0.47 | 0.34 | YY2017 | intergenic | Zm00001d030556 (organic cation/carnitine transporter 7 OCT7); Zm00001d030557 (alanine aminotransferase 2 ALT2) |
| FarmCPU | S1_29006330 | 1 | 29.01 | 1.02 | 1.36E-07 | 0.34 | 13.10 | SY2017 | intergenic | Zm00001d028279; Zm00001d028280 (wall-associated receptor kinase-like 14WAKL14) |
| FarmCPU | S1_5537879 | 1 | 5.54 | 1.01 | 2.15E-07 | 0.37 | 3.27 | BLUE | intronic | Zm00001d027451 (S-adenosyl-L-methionine-dependent methyltransferases superfamily protein) |
| FarmCPU | S1_88127156 | 1 | 88.13 | 1.05 | 3.53E-07 | 0.27 | 0.0010 | YY2017 | intergenic | Zm00001d029812 (threonine synthase 1 TS1); Zm00001d029814 (xyloglucan endotransglucosylase/hydrolase protein XTH32) |
| FarmCPU | S2_170090146 | 2 | 170.09 | 2.06 | 6.12E-07 | 0.14 | 3.02 | DC2017 | intergenic | Zm00001d005339; Zm00001d005342 |
| FarmCPU | S2_170889116 | 2 | 170.89 | 2.06 | 1.83E-08 | 0.11 | 14.17 | DC2017 | intronic | Zm00001d005358 (nuclear pore complex protein GP210) |
| FarmCPU | S2_204602646 | 2 | 204.60 | 2.07 | 8.45E-08 | 0.14 | 10.23 | BLUE | exonic | Zm00001d006323 (histone-lysine N-methyltransferase ATX4) |
| FarmCPU | S3_170875493 | 3 | 170.88 | 3.06 | 1.12E-09 | 0.11 | 8.55 | BLUE | intronic | Zm00001d042528 (chromatin assembly factor 1 subunit FAS1) |
| FarmCPU | S4_29277313 | 4 | 29.28 | 4.04 | 7.28E-08 | 0.09 | 0.01 | YY2017 | exonic | Zm00001d049399 (putative nucleolin-like family protein) |
| FarmCPU | S4_83821463 | 4 | 83.82 | 4.05 | 2.84E-07 | 0.23 | 12.83 | YC2017 | intergenic | Zm00001d050365 (ZIM-transcription factor 35 ZIM35); Zm00001d050368 (HMG-Y-related protein A HMGA) |
| FarmCPU | S5_17720377 | 5 | 17.72 | 5.03 | 5.46E-08 | 0.37 | 0.81 | BLUE | intronic | Zm00001d013694 (single myb histone 6) |
| FarmCPU | S7_127839936 | 7 | 127.84 | 7.02 | 5.41E-09 | 0.29 | 8.10 | SY2017 | exonic | Zm00001d020679 |
| MLMM | S4_29277313 | 4 | 29.28 | 4.04 | 7.96E-07 | 0.09 | 0.01 | YY2017 | exonic | Zm00001d049399 (putative nucleolin-like family protein) |
新窗口打开|下载CSV
3 讨论
全基因组关联分析是以连锁不平衡为基础来挖掘覆盖全基因组遗传变异的一种方法。目前, GWAS已发展了大量统计方法, 例如MLM、FarmCPU、CMLM、MLMM和Fast-LMM (factored spectrally transformed linear mixed models)等[16,17]。本研究利用FarmCPU、CMLM和MLMM方法对穗轴粗进行关联分析, 发现FarmCPU的拟合效果最好, CMLM和MLMM方法拟合效果不理想(图2、附图1和附图2)。Liu等[18]利用FarmCPU、MLM和CMLM方法对玉米籽粒性状进行分析时, 也发现FarmCPU方法的检测功效最高。本研究共发现12个穗轴粗显著关联SNP (P<8.6E-07)。其中, 9个SNP位于控制产量、穗部相关性状(穗粒数、穗行数、行粒数、穗长、穗粗、轴重和轴粗)和籽粒相关性状(粒长、粒宽、粒厚和百粒重)的QTL区间内。S1_29006330在Zhang等[10]鉴定的1个穗轴粗QTL (qCD1-1)区间内。S1_29006330解释穗轴粗的变异率为13.10%, 为主效SNP。因此, S1_29006330可能是影响穗轴粗的重要位点, 可用于分子标记辅助育种。S4_83821463是控制穗轴粗的主效SNP (PVE=12.83%), 位于bin4.05, 该区域内检测到1个控制穗长的QTL[1], 1个控制行粒数的QTL[1], 1个控制穗行数的QTL[10]和1个控制产量、穗部性状和籽粒大小性状的元QTL (MetaQTL-27)[15]。S2_170889116也是控制穗轴粗的主效SNP, 其PVE最高, 为14.17%, 位于bin2.06。该区域Choe等[1]检测到1个同时控制单穗重和百粒重的QTL。主效SNP S2_204602646 (PVE=10.23%)在单穗粒重QTL qKWPE2-5区间内(201,971,890~209,300,839)[8]和控制穗部性状和籽粒大小性状的MetaQTL-13内[18]。主效SNP S4_83821463、S2_170889116和S2_204602646均在整合穗轴粗的元QTL内, 说明这3个主效SNP也可能是影响穗轴粗的重要位点。S3_170875493的表型变异解释率较高, 为8.55%, 位于bin3.06区域内。Upadyayula等[5]在该区域内鉴定到1个控制行粒数QTL。此外, 微效位点S5_17720377位于bin5.03, 该区域内Choe等[1]检测到1个同时控制穗轴重和百粒重的QTL。Yi等[8]在bin5.03区域内检测1个穗行数QTL qRN5。S5_17720377还位于控制穗部相关性状和籽粒性状的MetaQTL-32[19]内。S2_170090146位于Chen等[19]通过元分析整合的MetaQTL-11区间内, 该区间影响产量、穗部和籽粒大小相关性状。在S1_143964620和S4_29277313相关的bin区段内, Choe等[1]分别检测到1个粒长QTL和1个穗粒数QTL。不管是主效位点还是微效位点, 穗轴粗显著关联位点主要与已定位的穗部性状QTL区间存在重叠, 这说明穗轴粗可能是穗部多个性状共同调控的产物。
12个穗轴粗显著关联位点共检测到17个候选基因。Zm00001d028280编码细胞壁连接类受体WAKL14, 为主效SNP S1_29006330的候选基因。WAK是植物类受体激酶, 由胞外域、跨膜域和胞内域组成, 能够跨越质膜, 使细胞识别并对外部环境进行响应[20]。OsiWAK1转录本沉默会导致植株矮化、根发育受损和花粉败育[21]。WAKL具有典型的WAK结构, 可能参与花粉发育等穗发育相关的过程。根据maizeGDB的转录表达数据, 尽管WAKL14在16~19 d的分生组织和雌小穗表达量较低(3.8~4.3), 但高于其余20个组织(附图3)。而且, 该基因对应的SNP S1_29006330在已定位的穗轴粗QTL区间内[10]。这表明, Zm00001d028280 (WAKL14)可能是穗轴粗的候选基因。
Zm00001d050365编码转录因子ZIM35, 为主效SNP S4_83821463挖掘的候选基因。ZIM具有GATA类锌指结构域即C-X2-C-X20-C-X2-C, 是一类植物特异的GATA转录因子[22]。Zhang等[10]利用连锁分析和全基因组关联分析挖掘的1个穗粗候选基因GRMZM2G404973是转录因子GATA11。ZIM35在16~19 d的分生组织和花丝中表达量较高(17.0~17.1) (附图3)。因此, Zm00001d050365 (ZIM35)可能是影响穗轴粗的重要基因。S4_83821463挖掘的另一个基因Zm00001d050368, 编码高速泳动族蛋白-Y HMGA。其在16~19 d的分生组织、2~4 mm穗原基、6~8 mm穗原基和雌小穗中表达量较高(61.5~107.5) (附图3)。HMGA与SQUAMOSA启动子绑定蛋白类家族(SQUAMOSA promoter-binding protein-LIKE, SPL)结合形成异二聚体, 参与调节楸树的花器官发育, 但并不参与调节花期[23]。玉米SBP转录因子unbranched 2 (UB2)和UB3是SQUAMOSA启动子绑定蛋白家族成员, 通过调节侧原基和花序发育, 影响穗行数和雄穗分支数[24,25]。因此, Zm00001d050368 (HMGA)也可能是影响穗轴粗的重要基因。
S2_170889116是解释穗轴粗变异最高的1个主效SNP, 其挖掘的候选基因为Zm00001d005358 (核孔复合蛋白GP210)。该基因在16~19 d的分生组织、2~4 mm穗原基和6~8 mm穗原基的表达量较高(38.0~61.7)。核孔复合蛋白是核膜上的运输通道, 在染色质组装和基因表达中发挥重要作用[26]。但目前, 尚没有该类蛋白参与穗发育相关过程的研究报道。主效SNP S2_204602646挖掘的候选基因Zm00001d006323 (组蛋白-赖氨素N-甲基转移酶ATX4)在16~19 d的分生组织、2~4 mm穗原基和6~8 mm穗原基的表达量均较高(97.0~119.2) (表2和附图3)。atx3-1/atx4-1/atx5-1突变体表现出矮化和结实率低[27]。而且, 从花发育的十二时期开始, 相比正常植株, 该突变体的雄蕊发育迟缓[27]。因此, Zm00001d006323 (ATX4)可能是影响穗轴粗的重要候选基因。
此外, Wang等[28]通过整合产量相关性状全基因组关联分析和元分析结果, 发现1个候选基因GRMZM2G413044编码木葡聚糖内糖基转移酶。木葡聚糖内糖基转移酶/水解酶是一类细胞壁松弛因子, 通过调节细胞壁弹性和延伸性来影响植物的生长发育和响应逆境胁迫等[29]。木葡聚糖内糖基转移酶/水解酶蛋白XTH33在ZIM过表达植株中表达上调, 从而导致了下胚轴和叶柄的延伸[30]。因此, Zm00001d029814 (XTH32)与ZIM35一样可能是控制穗轴粗的重要基因。穗轴粗候选基因的挖掘为下一步精细定位和克隆提供信息, 为解析玉米穗轴粗遗传机理提供研究基础。
4 结论
发现12个与穗轴粗显著关联的SNP (P<8.60E-07)。其中, 主效SNP 4个, 解释穗轴粗的变异率为10.23%~14.17%。挖掘候选基因17个, 其中WAKL14、转录因子ZIM35、HMGA、组蛋白-赖氨素N-甲基转移酶ATX4和XTH32可能是影响穗轴粗的重要基因。附图1
 新窗口打开|下载原图ZIP|生成PPT
附图1CMLM方法不同环境穗轴粗(CD)全基因组关联分析的曼哈顿图和QQ图
DC、YC、SY、YY分别表示郸城、虞城、三亚和原阳。2017和2019代表年份。
Fig. S1Manhattan plots and quantile-quantile plots for genome-wide association analysis for ear cob diameter using CMLM method in different environments
DC, YC, SY, and YY represent Dancheng, Yucheng, Sanya, and Yuanyang, respectively. 2017 and 2019 denote in 2017 and in 2019.
附图2
 新窗口打开|下载原图ZIP|生成PPT
附图2MLMM和FarmCPU方法没有检测到显著穗轴粗SNP的曼哈顿图和QQ图
DC、YC、SY、YY分别表示郸城、虞城、三亚和原阳。2017和2019代表年份。
Fig. S2Manhattan plots and quantile-quantile plots for no significant SNP for ear cob diameter using MLMM and FarmCPU
DC, YC, SY, and YY represent Dancheng, Yucheng, Sanya, and Yuanyang, respectively. 2017 and 2019 denote in 2017 and in 2019.
附图3
 新窗口打开|下载原图ZIP|生成PPT
附图3maizeGDB中17个候选基因在不同组织的表达情况
Fig. S3Expression profiles of 17 candidate genes in different tissues retrieved from maize GDB
参考文献 原文顺序
文献年度倒序
文中引用次数倒序
被引期刊影响因子
[本文引用: 12]
[本文引用: 6]
URLPMID:28533786 [本文引用: 3]
DOI:10.3389/fpls.2018.00966URLPMID:30038634 [本文引用: 6]

DOI:10.1007/s00122-005-0133-xURLPMID:16395569 [本文引用: 2]
Maize (Zea mays L.) ear inflorescence architecture is directly relevant to grain yield components, and tassel architecture is relevant to hybrid seed production. The objectives of this study were to (1) determine heritabilities and correlations of a comprehensive set of tassel and ear inflorescence architecture traits in a set of (Illinois Low ProteinxB73) B73 S1 families, (2) identify chromosomal positions of QTL affecting tassel and ear architecture, and (3) identify possible candidate genes associated with these QTL. For tassel traits, the number of detected QTL ranged from one to five, and explained between 6.5 and 35.9% of phenotypic variation. For ear traits, the number of detected QTL ranged from one to nine and phenotypic variation explained by those QTL varied between 7.9 and 53.0%. We detected QTL for tassel architecture traits that required calculation of ratios from measured traits. Some of these calculated traits QTL were detected in regions that did not show QTL for the measured traits, suggesting that calculation of ratios may reveal developmentally relevant patterns of tassel architecture. We detected a QTL on chromosome 7 for tassel branch number near the gene ramosa1 (ra1), which is known to control tassel branch number, making ra1 a candidate gene for tassel branch number. We detected QTL for several traits on chromosomes 6, 8, and 9, where no inflorescence architecture genes have been mapped, thus providing initial information towards new gene discovery for control of inflorescence architecture.
DOI:10.1038/s41598-019-52222-5URLPMID:31695075 [本文引用: 1]
Quantitative trait loci (QTLs) mapped in different genetic populations are of great significance for marker-assisted breeding. In this study, an F2:3 population were developed from the crossing of two maize inbred lines SG-5 and SG-7 and applied to QTL mapping for seven yield-related traits. The seven traits included 100-kernel weight, ear length, ear diameter, cob diameter, kernel row number, ear weight, and grain weight per plant. Based on an ultra-high density linkage map, a total of thirty-three QTLs were detected for the seven studied traits with composite interval mapping (CIM) method, and fifty-four QTLs were indentified with genome-wide composite interval mapping (GCIM) methods. For these QTLs, Fourteen were both detected by CIM and GCIM methods. Besides, eight of the thirty QTLs detected by CIM were identical to those previously mapped using a F2 population (generating from the same cross as the mapping population in this study), and fifteen were identical to the reported QTLs in other recent studies. For the fifty-four QTLs detected by GCIM, five of them were consistent with the QTLs mapped in the F2 population of SG-5 x SG-7, and twenty one had been reported in other recent studies. The stable QTLs associated with grain weight were located on maize chromosomes 2, 5, 7, and 9. In addition, differentially expressed genes (DEGs) between SG-5 and SG-7 were obtained from the transcriptomic profiling of grain at different developmental stages and overlaid onto the stable QTLs intervals to predict candidate genes for grain weight in maize. In the physical intervals of confirmed QTLs qKW-7, qEW-9, qEW-10, qGWP-6, qGWP-8, qGWP-10, qGWP-11 and qGWP-12, there were 213 DEGs in total. Finally, eight genes were predicted as candidate genes for grain size/weight. In summary, the stable QTLs would be reliable and the candidate genes predicted would be benefit for maker assisted breeding or cloning.
[本文引用: 1]
[本文引用: 3]
[本文引用: 1]
[本文引用: 1]
[本文引用: 5]
[本文引用: 1]
DOI:10.1371/journal.pgen.1005767URLPMID:26828793 [本文引用: 1]
False positives in a Genome-Wide Association Study (GWAS) can be effectively controlled by a fixed effect and random effect Mixed Linear Model (MLM) that incorporates population structure and kinship among individuals to adjust association tests on markers; however, the adjustment also compromises true positives. The modified MLM method, Multiple Loci Linear Mixed Model (MLMM), incorporates multiple markers simultaneously as covariates in a stepwise MLM to partially remove the confounding between testing markers and kinship. To completely eliminate the confounding, we divided MLMM into two parts: Fixed Effect Model (FEM) and a Random Effect Model (REM) and use them iteratively. FEM contains testing markers, one at a time, and multiple associated markers as covariates to control false positives. To avoid model over-fitting problem in FEM, the associated markers are estimated in REM by using them to define kinship. The P values of testing markers and the associated markers are unified at each iteration. We named the new method as Fixed and random model Circulating Probability Unification (FarmCPU). Both real and simulated data analyses demonstrated that FarmCPU improves statistical power compared to current methods. Additional benefits include an efficient computing time that is linear to both number of individuals and number of markers. Now, a dataset with half million individuals and half million markers can be analyzed within three days.
DOI:10.1038/ng.2314URLPMID:22706313 [本文引用: 2]
Population structure causes genome-wide linkage disequilibrium between unlinked loci, leading to statistical confounding in genome-wide association studies. Mixed models have been shown to handle the confounding effects of a diffuse background of large numbers of loci of small effect well, but they do not always account for loci of larger effect. Here we propose a multi-locus mixed model as a general method for mapping complex traits in structured populations. Simulations suggest that our method outperforms existing methods in terms of power as well as false discovery rate. We apply our method to human and Arabidopsis thaliana data, identifying new associations and evidence for allelic heterogeneity. We also show how a priori knowledge from an A. thaliana linkage mapping study can be integrated into our method using a Bayesian approach. Our implementation is computationally efficient, making the analysis of large data sets (n > 10,000) practicable.
DOI:10.1038/ng.546URLPMID:20208535 [本文引用: 1]
Mixed linear model (MLM) methods have proven useful in controlling for population structure and relatedness within genome-wide association studies. However, MLM-based methods can be computationally challenging for large datasets. We report a compression approach, called 'compressed MLM', that decreases the effective sample size of such datasets by clustering individuals into groups. We also present a complementary approach, 'population parameters previously determined' (P3D), that eliminates the need to re-compute variance components. We applied these two methods both independently and combined in selected genetic association datasets from human, dog and maize. The joint implementation of these two methods markedly reduced computing time and either maintained or improved statistical power. We used simulations to demonstrate the usefulness in controlling for substructure in genetic association datasets for a range of species and genetic architectures. We have made these methods available within an implementation of the software program TASSEL.
URLPMID:26926032 [本文引用: 2]
[本文引用: 1]
DOI:10.1038/nmeth.1681URLPMID:21892150 [本文引用: 1]
We describe factored spectrally transformed linear mixed models (FaST-LMM), an algorithm for genome-wide association studies (GWAS) that scales linearly with cohort size in both run time and memory use. On Wellcome Trust data for 15,000 individuals, FaST-LMM ran an order of magnitude faster than current efficient algorithms. Our algorithm can analyze data for 120,000 individuals in just a few hours, whereas current algorithms fail on data for even 20,000 individuals (http://mscompbio.codeplex.com/).
DOI:10.1111/pbi.13188URLPMID:31199064 [本文引用: 2]
[本文引用: 2]
[本文引用: 1]
DOI:10.1007/s12298-011-0050-1URLPMID:23572996 [本文引用: 1]
The Wall-Associated Kinase, one of the receptor-like kinase (RLK) gene families in plant, plays important roles in cell expansion, pathogen resistance and heavy metal stress tolerance in Arabidopsis thaliana. Here, we isolated a cDNA encoding a novel WAK from indica rice and designated as OsiWAK1 (Oryza sativa indica WAK-1). In this study, the RNAi construct with OsiWAK1 gene cloned in sense and antisense orientation separated by a functional intron under constitutive promoter, was introduced through biolistic gene gun method into the rice cultivar
DOI:10.1271/bbb.67.2495URLPMID:14646219 [本文引用: 1]
Arabidopsis ZIM is a putative transcription factor containing an atypical GATA-type zinc-finger motif. Transcriptional activation by ZIM was tested using a transient GAL4 fusion assay and measuring the expression of a luciferase reporter in tobacco BY-2 cells. ZIM functioned as a transcriptional activator, and the transactivation domain was found to occur in its N-terminal acidic region.
DOI:10.1186/s12870-020-2303-zURLPMID:32143577 [本文引用: 1]
BACKGROUND:
DOI:10.1073/pnas.1407401112URLPMID:25512525 [本文引用: 1]
The separation of male and female flowers in maize provides the potential for independent regulation of traits that affect crop productivity. For example, tassel branch number controls pollen abundance and length of shedding time, whereas ear row number directly affects kernel yield. Mutations in duplicate SBP-box transcription factor genes unbranched2 (ub2) and ub3 affect both of these yield traits. Double mutants display a decrease in tassel branch number and an increase in ear row number, both of which are enhanced by loss of a related gene called tasselsheath4 (tsh4). Furthermore, triple mutants have more tillers and leaves-phenotypes seen in Corngrass1 mutants that result from widespread repression of SBP-box genes. Immunolocalization of UB2 and UB3 proteins revealed accumulation throughout the meristem but absence from the central domain of the meristem where cells regenerate. Thus, ub2, ub3, and tsh4 function as redundant factors that limit the rate of cell differentiation to the lateral domains of meristems. When these genes are mutated, cells are allocated to lateral primordia at a higher rate, causing a net loss of cells from the central domain and premature termination of the inflorescence. The ub3 locus is tightly linked to quantitative trait loci (QTL) for ear row number and tassel branch number in both the nested association mapping (NAM) and intermated B73 by Mo17 (IBM) populations of maize recombinant inbreds, indicating that this gene may be agronomically important. Analysis of ear and tassel QTL across biparental families suggests that multiple mutations in ub3 independently regulate male and female inflorescence development.
DOI:10.1371/journal.pgen.1008764URLPMID:32330129 [本文引用: 1]
Enhancers are cis-acting DNA segments with the ability to increase target gene expression. They show high sensitivity to DNase and contain specific DNA elements in an open chromatin state that allows the binding of transcription factors (TFs). While numerous enhancers are annotated in the maize genome, few have been characterized genetically. KERNEL ROW NUMBER4 (KRN4), an intergenic quantitative trait locus for kernel row number, is assumed to be a cis-regulatory element of UNBRANCHED3 (UB3), a key inflorescence gene. However, the mechanism by which KRN4 controls UB3 expression remains unclear. Here, we found that KRN4 exhibits an open chromatin state, harboring sequences that showed high enhancer activity toward the 35S and UB3 promoters. KRN4 is bound by UB2-centered transcription complexes and interacts with the UB3 promoter by three duplex interactions to affect UB3 expression. Sequence variation at KRN4 enhances ub2 and ub3 mutant ear fasciation. Therefore, we suggest that KRN4 functions as a distal enhancer of the UB3 promoter via chromatin interactions and recruitment of UB2-centered transcription complexes for the fine-tuning of UB3 expression in meristems of ear inflorescences. These results provide evidence that an intergenic region helps to finely tune gene expression, providing a new perspective on the genetic control of quantitative traits.
DOI:10.1007/s00412-010-0289-2URLPMID:20721671 [本文引用: 1]
Nuclear pore complexes (NPCs) serve as transport channels across the nuclear membrane, a double lipid bilayer that physically separates the nucleoplasm and cytoplasm of eukaryotic cells. New evidence suggests that the multiprotein nuclear pores also play a role in chromatin organization and gene expression. Given the importance of NPC function, it is not surprising that a growing list of human diseases and developmental defects have been linked to its malfunction. In order to fully understand the functional repertoire of NPCs and their essential role for nuclear organization, it is critical to determine the sequence of events that lead to the formation of nuclear pores. This is particularly relevant since NPC number, and possibly composition, are tightly linked to metabolic activity. Most of our knowledge is derived from NPC formation that occurs in dividing cells at the end of mitosis when the nuclear envelope (NE) and NPCs reform from disassembled precursors. However, NPC assembly also takes place during interphase into an intact NE. Importantly, this process is not restricted to dividing cells but also occurs during cell differentiation. Here, we will review aspects unique to this process, namely the regulation of nuclear expansion and the mechanisms of fusion between the outer and inner nuclear membranes. We will then discuss conserved and diverging mechanisms between post-mitotic and interphase assembly of the proteinaceous structure in light of recently published data.
URLPMID:28550207 [本文引用: 2]
[本文引用: 1]
DOI:10.1093/jxb/ert107URLPMID:23585673 [本文引用: 1]
Growth and biomechanics of etiolated hypocotyls from Arabidopsis thaliana lines overexpressing xyloglucan endotransglucosylase/hydrolase AtXTH18, AtXTH19, AtXTH20, and PttXET16-34 were studied. Overexpression of AtXTH18, AtXTH19, and AtXTH20 stimulated growth of hypocotyls, while PttXET16-34 overexpression did not show this effect. In vitro extension of frozen/thawed hypocotyls measured by a constant-load extensiometer started from a high-amplitude initial deformation followed by a slow time-dependent creep. Creep of growing XTH-overexpressing (OE) hypocotyls was more linear in time compared with the wild type at pH 5.0, reflecting their higher potential for long-term extension. XTH-OE plants deposited 65-84% more cell wall material per hypocotyl cross-sectional area than wild-type plants. As a result, their wall stress under each external load was lower than in the wild-type. Growing XTH-OE hypocotyls had higher values of initial deformation.stress(-1) compared with the wild type. Plotting creep rates for each line under different loads against the respective wall stress values gave straight lines. Their slopes and intercepts with the abscissa correspond to varphi (in vitro cell wall extensibility) and y (in vitro cell wall yield threshold) values characterizing cell wall material properties. The wall material in XTH-OE lines was more pliant than in the wild type due to lower y values. In contrast, the acid-induced wall extension in vitro resulted from increasing varphi values. Thus, three factors contributed to the XTH-OE-stimulated growth in Arabidopsis hypocotyls: their more linear creep, higher values of initial deformation.stress(-1), and lower y values.
DOI:10.1093/jxb/erh078URLPMID:14966217 [本文引用: 1]
The Arabidopsis gene ZIM encodes a putative transcription factor containing a novel GATA-type zinc-finger domain with a longer spacer between its two sets of conserved cysteine residues (C-X2-C-X20-C-X2-C). In Arabidopsis, ZIM and homologous proteins, ZML1 and ZML2, were identified as GATA factors containing the C-X2-C-X20-C-X2-C motif, a CCT domain, and an uncharacterized conserved domain. Proteins that possess this domain structure were found exclusively in plants, indicating that they belong to a novel family of plant-specific GATA-type transcription factors. When ZIM was overexpressed using a CaMV 35S promoter in Arabidopsis, hypocotyls and petioles were elongated. The elongation phenotype was observed under all wavelengths of light tested and even in the presence of biosynthetic inhibitors of either brassinosteroid or gibberellin. In ZIM-overexpressing plants, XTH33 which is predicted to function in cell wall modification was detected as an up-regulated gene by microarray analysis, and this could account for the elongation phenotype. Genes in ZIM-overexpressing plants were identified that were up-regulated in a tissue-specific manner, which suggests that transcriptional regulation by ZIM and its consequent effects are spatially controlled.
