 ,1,**, 王旭文,2,**, 李保奇1, 余渝2, 田琴,2,*, 杨细燕,1,*
Association analysis of drought tolerance traits of upland cotton accessions (Gossypium hirsutum L.)
HAN Bei,1,**, WANG Xu-Wen,2,**, LI Bao-Qi1, YU Yu2, TIAN Qin,2,*, YANG Xi-Yan,1,*通讯作者:
收稿日期:2020-03-12接受日期:2020-10-14网络出版日期:2021-03-12
| 基金资助: |
Received:2020-03-12Accepted:2020-10-14Online:2021-03-12
| Fund supported: |
作者简介 About authors
韩贝, E-mail:
王旭文, E-mail:

摘要
关键词:
Abstract
Keywords:
PDF (1469KB)元数据多维度评价相关文章导出EndNote|Ris|Bibtex收藏本文
本文引用格式
韩贝, 王旭文, 李保奇, 余渝, 田琴, 杨细燕. 陆地棉种质资源抗旱性状的关联分析[J]. 作物学报, 2021, 47(3): 438-450. doi:10.3724/SP.J.1006.2021.04063
HAN Bei, WANG Xu-Wen, LI Bao-Qi, YU Yu, TIAN Qin, YANG Xi-Yan.
棉花在整个生育期会遭遇各种生物及非生物逆境胁迫, 包括黄萎病和枯萎病等疾病、蚜虫和棉铃虫等虫害以及干旱、盐碱、高温等非生物胁迫。当前解决作物生长过程中的干旱问题已成为世界上许多国家和地区的一个重大难题[1,2]。干旱限制了棉花根部从土壤中吸收水分, 从而导致棉花的渗透势升高、花芽脱落、纤维伸长率降低、纤维壁厚度改变、棉铃尺寸减小、纤维质量变差和棉花总产量降低[3]。新疆是我国最大的产棉区、长绒棉生产基地和优质商品棉生产基地, 属干旱半干旱地区, 年降雨量少且水资源时空分布不平衡, 干旱问题十分严重, 因此研究现有棉花种质资源耐旱性的遗传多样性以及挖掘耐旱优异等位基因具有十分重要的现实意义。
抗旱性是由微效多基因控制的数量遗传性状。目前, 世界各国在干旱胁迫条件下的抗性生理及生物技术方面已开展了大量研究。Xiao等[4]通过对184份水稻材料的卷曲叶、干叶等抗旱性状进行全基因组扫描和关联分析, 鉴定了16个与抗旱性相关的QTL位点。棉花应对干旱胁迫的研究最早集中在根系结构及形态生理上。早在1989年, 美国科学家William等[5]通过研究, 证明提高根系吸收水分能力减轻干旱抑制作用。棉花适应干旱的遗传变异性大, 很多性状都被作为选择抗旱性棉花品种的重要指标, 其中包括形态指标(主根长度、根重量、侧根数量、根系生长速率和根冠比等)和生理指标(蒸腾速率、气孔导度、光合作用速率、叶片含水量和冠层温度等)[6,7]。之后随着生物技术迅速发展, SSR分子标记和SNP分子标记被广泛应用于棉花抗旱性研究和关联分析。桑晓慧等[8]利用74个SSR标记在萌发期以15%的PEG-6000对191份陆地棉材料进行胁迫处理及关联分析, 最终鉴定了15个与萌发期抗旱性显著相关的分子标记。Asena等[9]利用177个SSR分子标记对99份陆地棉品种进行水分充足和水分胁迫2种不同的浇水方式处理, 并对籽棉产量、皮棉产量、水分利用率、干旱敏感指数、干旱胁迫指数等11个指标进行关联分析, 分别鉴定到了与性状相关联的15个和23个SSR标记。Ulloa等[10]利用63K棉花芯片对2个RIL群体进行基因分型, 在正常灌溉与水分亏缺2种条件下共鉴定到150多个与产量和纤维品质相关的QTL。Hou等[11]通过对319份陆地棉材料在温室进行PEG胁迫处理, 利用GWAS鉴定出20个与耐旱性状相关的SNP, 并通过RNA-seq与qRT-PCR等技术验证最终得到4个候选基因。
本研究以我国不同生态棉区及部分国外陆地棉品种资源为研究对象, 分别于2016—2017年在新疆石河子和库尔勒两地进行干旱处理试验, 采用全生育期处理组灌水量为对照组50%的干旱胁迫处理, 并在后期对217份材料的株高、衣分、单铃重等18个性状进行测定。通过SSR全基因组扫描的方法进行关联分析, 从而挖掘出与耐旱性相关的特异性位点, 以期为棉花抗旱遗传改良提供理论基础。
1 材料与方法
1.1 试验材料及干旱处理设置
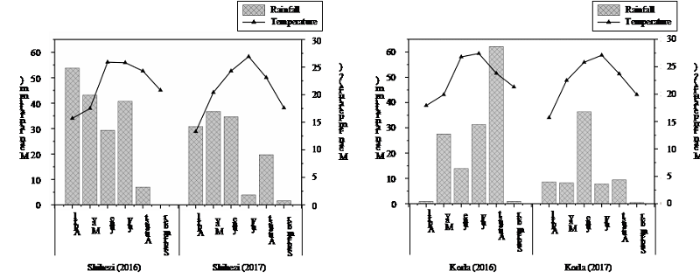
选取来自我国不同生态棉区及部分国外陆地棉品种组成的自然群体为试验材料, 共计217份, 由新疆农垦科学院棉花研究所收集保存(附表1)。试验于2016—2017年分别在新疆农垦科学院棉花研究所北疆石河子试验基地和新疆农垦科学院棉花研究所南疆库尔勒试验基地开展。设置2个水分处理: (1)对照组(正常灌水), 库尔勒全生育期共灌水12次, 总量合计6768 m3 hm-2; 石河子全生育期共灌水10次, 总量为4950 m3 hm-2; (2)干旱处理组, 两地各生育期灌水量为正常灌水量的50%, 即每次灌水减半(附表2)[10,11], 平膜覆盖地表及滴灌供水。南疆库尔勒试验基地于3月15日进行了额外的灌溉(4500 m3 hm-2)以减少土壤中盐分与碱的含量; 北疆石河子试验基地于4月20日进行了额外的灌溉(240 m3 hm-2)用于播种出苗。试验采用完全随机区组排列, 每组处理设置重复2次, 小区行长2.20 m, 平均行距0.45 m, 每个品种种植2行, 小区面积1.98 m2。机械覆盖地膜, 棉种人工点播, 株距10 cm, 实际收获株数16.5万株 hm-2。试验田土壤肥力均一, 其他管理措施同常规大田。在棉花生育期内同步统计2个试验点每月降雨量和均温(附图1)。Table s1
附表1
附表1材料编号与群体结构划分
Table s1
| 材料编号 Germplasm number | 品种名称 Cultivar name | 地理来源 Geographic origin | 生态区分布 Ecological division | 群体结构划分 Population structure division | |
|---|---|---|---|---|---|
| YU004 | 中棉所35 Zhongmiansuo 35 | 中国河南 Henan, China | 中国黄河流域棉区 YRR | Pop1 | |
| YU075 | 99B 99B | 美国 America | 美国 USA | Pop1 | |
| YU081 | SGK 321 SGK 321 | 中国河北 Hebei, China | 中国黄河流域棉区 YRR | Pop1 | |
| YU099 | 中棉所30 Zhongmiansuo 30 | 中国河南 Henan, China | 中国黄河流域棉区 YRR | Pop1 | |
| YU127 | 新陆早10号 Xinluzao 10 | 中国新疆 Xinjiang, China | 中国西北内陆棉区 NIR | Pop1 | |
| YU129 | 新陆早12号 Xinluzao 12 | 中国新疆 Xinjiang, China | 中国西北内陆棉区 NIR | Pop1 | |
| YU134 | 新陆早18号 Xinluzao 18 | 中国新疆 Xinjiang, China | 中国西北内陆棉区 NIR | Pop1 | |
| YU137 | 新陆早21号 Xinluzao 21 | 中国新疆 Xinjiang, China | 中国西北内陆棉区 NIR | Pop1 | |
| YU141 | 新陆早25号 Xinluzao 25 | 中国新疆 Xinjiang, China | 中国西北内陆棉区 NIR | Pop1 | |
| YU152 | 新陆早37号 Xinluzao 37 | 中国新疆 Xinjiang, China | 中国西北内陆棉区 NIR | Pop1 | |
| YU163 | 新陆早50号 Xinluzao 50 | 中国新疆 Xinjiang, China | 中国西北内陆棉区 NIR | Pop1 | |
| YU176 | 新陆中12 Xinluzhong 12 | 中国新疆 Xinjiang, China | 中国西北内陆棉区 NIR | Pop1 | |
| YU177 | 新陆中13 Xinluzhong 13 | 中国新疆 Xinjiang, China | 中国西北内陆棉区 NIR | Pop1 | |
| YU179 | 新陆中15 Xinluzhong 15 | 中国新疆 Xinjiang, China | 中国西北内陆棉区 NIR | Pop1 | |
| YU180 | 新陆中16 Xinluzhong 16 | 中国新疆 Xinjiang, China | 中国西北内陆棉区 NIR | Pop1 | |
| YU181 | 新陆中17 Xinluzhong 17 | 中国新疆 Xinjiang, China | 中国西北内陆棉区 NIR | Pop1 | |
| YU187 | 新陆中23 Xinluzhong 23 | 中国新疆 Xinjiang, China | 中国西北内陆棉区 NIR | Pop1 | |
| YU193 | 新陆中30 Xinluzhong 30 | 中国新疆 Xinjiang, China | 中国西北内陆棉区 NIR | Pop1 | |
| YU213 | 惠和28号 Huihe 28 | 中国新疆 Xinjiang, China | 中国西北内陆棉区 NIR | Pop1 | |
| YU270 | 中棉所50 Zhongmiansuo 50 | 中国河南 Henan, China | 中国黄河流域棉区 YRR | Pop1 | |
| YU275 | 晋中200 Jinzhong 200 | 中国山西 Shanxi, China | 中国黄河流域棉区 YRR | Pop1 | |
| YU291 | 鄂棉24 Emian 24 | 中国湖北 Hubei, China | 中国长江流域棉区 YtRR | Pop1 | |
| YU292 | 银山4号 Yinshan 4 | 中国河南 Henan, China | 中国黄河流域棉区 YRR | Pop1 | |
| YU293 | 中棉所12 Zhongmiansuo 12 | 中国河南 Henan, China | 中国黄河流域棉区 YRR | Pop1 | |
| YU294 | 鄂荆1号 Ejin 1 | 中国湖北 Hubei, China | 中国长江流域棉区 YtRR | Pop1 | |
| YU295 | 泗棉3号 Simian 3 | 中国江苏 Jiangsu, China | 中国长江流域棉区 YtRR | Pop1 | |
| YU296 | 鲁棉6号 Lumian 6 | 中国山东 Shandong, China | 中国黄河流域棉区 YRR | Pop1 | |
| YU297 | 鲁棉9号 Lumian 9 | 中国山东 Shandong, China | 中国黄河流域棉区 YRR | Pop1 | |
| YU298 | 斯字棉4B Sizimian 4B | 美国 America | 美国 USA | Pop1 | |
| YU299 | 晋棉28号 Jinmian 28 | 中国山西 Shanxi, China | 中国黄河流域棉区 YRR | Pop1 | |
| YU300 | 晋棉36号 Jinmian 36 | 中国山西 Shanxi, China | 中国黄河流域棉区 YRR | Pop1 | |
| YU301 | 冀棉8号 Jimian 8 | 中国河北 Hebei, China | 中国黄河流域棉区 YRR | Pop1 | |
| YU302 | 冀棉10号 Jimian 10 | 中国河北 Hebei, China | 中国黄河流域棉区 YRR | Pop1 | |
| YU303 | 冀棉11号 Jimian 11 | 中国河北 Hebei, China | 中国黄河流域棉区 YRR | Pop1 | |
| YU304 | 冀棉12号 Jimian 12 | 中国河北 Hebei, China | 中国黄河流域棉区 YRR | Pop1 | |
| YU305 | 冀棉228 Jimian 228 | 中国河北 Hebei, China | 中国黄河流域棉区 YRR | Pop1 | |
| YU306 | 冀合321 Jihe 321 | 中国河北 Hebei, China | 中国黄河流域棉区 YRR | Pop1 | |
| YU307 | 豫棉4号 Yumian 4 | 中国河南 Henan, China | 中国黄河流域棉区 YRR | Pop1 | |
| YU308 | 豫棉11号 Yumian 11 | 中国河南 Henan, China | 中国黄河流域棉区 YRR | Pop1 | |
| YU309 | 鄂棉16号 Emian 16 | 中国湖北 Hubei, China | 中国长江流域棉区 YtRR | Pop1 | |
| YU310 | 鄂棉17号 Emian 17 | 中国湖北 Hubei, China | 中国长江流域棉区 YtRR | Pop1 | |
| YU311 | 鄂棉21号 Emian 21 | 中国湖北 Hubei, China | 中国长江流域棉区 YtRR | Pop1 | |
| YU312 | 苏棉4号 Sumian 4 | 中国江苏 Jiangsu, China | 中国长江流域棉区 YtRR | Pop1 | |
| YU313 | 鄂抗棉2号 Ekangmian 2 | 中国湖北 Hubei, China | 中国长江流域棉区 YtRR | Pop1 | |
| YU314 | 鄂抗棉3号 Ekangmian 3 | 中国湖北 Hubei, China | 中国长江流域棉区 YtRR | Pop1 | |
| YU315 | 鄂抗棉6号 Ekangmian 6 | 中国湖北 Hubei, China | 中国长江流域棉区 YtRR | Pop1 | |
| YU317 | 徐州142 Xuzhou 142 | 中国江苏 Jiangsu, China | 中国长江流域棉区 YtRR | Pop1 | |
| YU318 | 苏棉9号 Sumian 9 | 中国江苏 Jiangsu, China | 中国长江流域棉区 YtRR | Pop1 | |
| YU319 | 苏棉12号 Sumian 12 | 中国江苏 Jiangsu, China | 中国长江流域棉区 YtRR | Pop1 | |
| YU320 | 苏抗191 Sukang 191 | 中国江苏 Jiangsu, China | 中国长江流域棉区 YtRR | Pop1 | |
| YU322 | 冈棉2号 Gangmian 2 | 中国湖北 Hubei, China | 中国长江流域棉区 YtRR | Pop1 | |
| YU323 | 珂字201 Kezi 201 | 美国 America | 美国 USA | Pop1 | |
| YU324 | 珂字312 Kezi 312 | 美国 America | 美国 USA | Pop1 | |
| YU325 | 陕401 Shaan 401 | 中国陕西 Shaanxi, China | 中国黄河流域棉区 YRR | Pop1 | |
| YU326 | 岱字棉15号 Daizimian 15 | 美国 America | 美国 USA | Pop1 | |
| YU327 | 岱红岱 Daihongdai | 美国 America | 美国 USA | Pop1 | |
| YU328 | 荆1246 Jin 1246 | 中国湖北 Hubei, China | 中国长江流域棉区 YtRR | Pop1 | |
| YU329 | 荆楚201 Jinchu 201 | 中国湖北 Hubei, China | 中国长江流域棉区 YtRR | Pop1 | |
| YU331 | 八一棉 Bayimian | 中国湖北 Hubei, China | 中国长江流域棉区 YtRR | Pop1 | |
| YU332 | 渤棉1号 Bomian 1 | 中国山东 Shandong, China | 中国黄河流域棉区 YRR | Pop1 | |
| YU333 | 洞庭1号 Dongting 1 | 中国湖南 Hunan, China | 中国长江流域棉区 YtRR | Pop1 | |
| YU334 | 孝棉1号 Xiaomian 1 | 中国湖北 Hubei, China | 中国长江流域棉区 YtRR | Pop1 | |
| YU336 | 宛棉3号 Wanmian 3 | 中国河南 Henan, China | 中国黄河流域棉区 YRR | Pop1 | |
| YU337 | 科棉4号 Kemian 4 | 中国江苏 Jiangsu, China | 中国长江流域棉区 YtRR | Pop1 | |
| YU338 | 南通5号 Nantong 5 | 中国江苏 Jiangsu, China | 中国长江流域棉区 YtRR | Pop1 | |
| YU339 | 赣棉11号 Ganmian 11 | 中国江西 Jiangxi, China | 中国长江流域棉区 YtRR | Pop1 | |
| YU340 | 赣棉12号 Ganmian 12 | 中国江西 Jiangxi, China | 中国长江流域棉区 YtRR | Pop1 | |
| YU341 | 湘棉13 Xiangmian 13 | 中国湖南 Hunan, China | 中国长江流域棉区 YtRR | Pop1 | |
| YU342 | 新棉33B Xinmian 33B | 美国 America | 美国 USA | Pop1 | |
| YU343 | 沪棉204 Humian 204 | 中国上海 Shanghai, China | 中国长江流域棉区 YtRR | Pop1 | |
| YU348 | 鸡脚德字棉 Jijiaodezimian | 美国 America | 美国 USA | Pop1 | |
| YU349 | 中棉所2 Zhongmiansuo 2 | 中国河南 Henan, China | 中国黄河流域棉区 YRR | Pop1 | |
| YU350 | 中棉所3号 Zhongmiansuo 3 | 中国河南 Henan, China | 中国黄河流域棉区 YRR | Pop1 | |
| YU352 | 中棉所21 Zhongmiansuo 21 | 中国河南 Henan, China | 中国黄河流域棉区 YRR | Pop1 | |
| YU353 | 中棉所43 Zhongmiansuo 43 | 中国河南 Henan, China | 中国黄河流域棉区 YRR | Pop1 | |
| YU354 | 中棉所69 Zhongmiansuo 69 | 中国河南 Henan, China | 中国黄河流域棉区 YRR | Pop1 | |
| YU355 | 中棉所79 Zhongmiansuo 79 | 中国河南 Henan, China | 中国黄河流域棉区 YRR | Pop1 | |
| YU356 | 中棉所8010 Zhongmiansuo 8010 | 中国河南 Henan, China | 中国黄河流域棉区 YRR | Pop1 | |
| YU360 | DP99B DP99B | 美国 America | 美国 USA | Pop1 | |
| YU361 | NC20B NC20B | 美国 America | 美国 USA | Pop1 | |
| YU363 | 北农1号 Beinong 1 | 中国河北 Hebei, China | 中国黄河流域棉区 YRR | Pop1 | |
| YU367 | 德字棉531 Dezimian 531 | 中国山东 Shandong, China | 中国黄河流域棉区 YRR | Pop1 | |
| YU368 | 敦棉1号 Dunmian 1 | 中国甘肃 Gansu, China | 中国西北内陆棉区 NIR | Pop1 | |
| YU371 | 赣棉3号 Ganmian 3 | 中国江西 Jiangxi, China | 中国长江流域棉区 YtRR | Pop1 | |
| YU372 | 赣棉13 Ganmian 13 | 中国江西 Jiangxi, China | 中国长江流域棉区 YtRR | Pop1 | |
| YU373 | 赣棉47 Ganmian 47 | 中国江西 Jiangxi, China | 中国长江流域棉区 YtRR | Pop1 | |
| YU374 | 关农1号 Guannong 1 | 中国辽宁 Liaoning, China | 中国北方特早熟棉区 NSEMR | Pop1 | |
| YU375 | 光叶岱字棉 Guangyedaizimian | 美国 America | 美国 USA | Pop1 | |
| YU376 | 邯棉885 Hanmian 885 | 中国河北 Hebei, China | 中国黄河流域棉区 YRR | Pop1 | |
| YU378 | 冀棉1号 Jimian 1 | 中国河北 Hebei, China | 中国黄河流域棉区 YRR | Pop1 | |
| YU379 | 冀棉19 Jimian 19 | 中国河北 Hebei, China | 中国黄河流域棉区 YRR | Pop1 | |
| YU380 | 冀棉25 Jimian 25 | 中国河北 Hebei, China | 中国黄河流域棉区 YRR | Pop1 | |
| YU382 | 晋棉3号 Jinmian 3 | 中国山西 Shanxi, China | 中国黄河流域棉区 YRR | Pop1 | |
| YU384 | 晋棉29 Jinmian 29 | 中国山西 Shanxi, China | 中国黄河流域棉区 YRR | Pop1 | |
| YU385 | 晋棉38 Jinmian 38 | 中国山西 Shanxi, China | 中国黄河流域棉区 YRR | Pop1 | |
| YU387 | 科遗181 Keyi 181 | 中国河北 Hebei, China | 中国黄河流域棉区 YRR | Pop1 | |
| YU388 | 克克1543 Keke 1543 | 前苏联 Former Soviet Union | 前苏联 SU | Pop1 | |
| YU391 | 鲁棉研28 Lumianyan 28 | 中国山东 Shandong, China | 中国黄河流域棉区 YRR | Pop1 | |
| YU392 | 鲁棉研32 Lumianyan32 | 中国山东 Shandong, China | 中国黄河流域棉区 YRR | Pop1 | |
| YU393 | 宁棉1号 Ningmian 1 | 中国江苏 Jiangsu, China | 中国长江流域棉区 YtRR | Pop1 | |
| YU394 | 宁棉12 Ningmian 12 | 中国江苏 Jiangsu, China | 中国长江流域棉区 YtRR | Pop1 | |
| YU395 | 宁棉22 Ningmian 22 | 中国江苏 Jiangsu, China | 中国长江流域棉区 YtRR | Pop1 | |
| YU396 | 农大94-7 Nongda 99-7 | 中国河北 Hebei, China | 中国黄河流域棉区 YRR | Pop1 | |
| YU397 | 农大棉8号 Nongdamian 8 | 中国河北 Hebei, China | 中国黄河流域棉区 YRR | Pop1 | |
| YU398 | 黔农465 Qiannong 465 | 中国贵州 Guizhou, China | 中国南方棉区 SCR | Pop1 | |
| YU399 | 蜀棉1号 Sumian 1 | 中国四川 Sichuan, China | 中国长江流域棉区 YtRR | Pop1 | |
| YU404 | 江苏棉1号 Jiangsumian 1 | 中国江苏 Jiangsu, China | 中国长江流域棉区 YtRR | Pop1 | |
| YU411 | 徐州58 Xuzhou 58 | 中国江苏 Jiangsu, China | 中国长江流域棉区 YtRR | Pop1 | |
| YU412 | 徐州219 Xuzhou 219 | 中国江苏 Jiangsu, China | 中国长江流域棉区 YtRR | Pop1 | |
| YU030 | 中棉所36 Zhongmiansuo36 | 中国河南 Henan, China | 中国黄河流域棉区 YRR | Pop2 | |
| YU032 | 渝棉1号 Yumian 1 | 中国重庆 Chongqing, China | 中国长江流域棉区 YtRR | Pop2 | |
| YU033 | 辽棉10号 Liaomian 10 | 中国辽宁 Liaoning, China | 中国北方特早熟棉区 NSEMR | Pop2 | |
| YU034 | 辽棉15号 Liaomian 15 | 中国辽宁 Liaoning, China | 中国北方特早熟棉区 NSEMR | Pop2 | |
| YU042 | 中棉所27 Zhongmiansuo 27 | 中国河南 Henan, China | 中国黄河流域棉区 YRR | Pop2 | |
| YU051 | 9456D 9456D | 中国新疆 Xinjiang, China | 中国西北内陆棉区 NIR | Pop2 | |
| YU054 | 系9 Xi 9 | 中国新疆 Xinjiang, China | 中国西北内陆棉区 NIR | Pop2 | |
| YU062 | 602 602 | 不详 Unknown | 不详 Unknown | Pop2 | |
| YU097 | GK26 GK26 | 不详 Unknown | 不详 Unknown | Pop2 | |
| YU100 | 中棉所41 Zhongmiansuo 41 | 中国河南 Henan, China | 中国黄河流域棉区 YRR | Pop2 | |
| YU101 | 鄂抗虫棉1号 Ekangchongmian 1 | 中国湖北 Hubei, China | 中国长江流域棉区 YtRR | Pop2 | |
| YU118 | 新陆早1号 Xinluzao 1 | 中国新疆 Xinjiang, China | 中国西北内陆棉区 NIR | Pop2 | |
| YU119 | 新陆早2号 Xinluzao 2 | 中国新疆 Xinjiang, China | 中国西北内陆棉区 NIR | Pop2 | |
| YU120 | 新陆早3号 Xinluzao 3 | 中国新疆 Xinjiang, China | 中国西北内陆棉区 NIR | Pop2 | |
| YU121 | 新陆早4号 Xinluzao 4 | 中国新疆 Xinjiang, China | 中国西北内陆棉区 NIR | Pop2 | |
| YU122 | 新陆早5号 Xinluzao 5 | 中国新疆 Xinjiang, China | 中国西北内陆棉区 NIR | Pop2 | |
| YU123 | 新陆早6号 Xinluzao 6 | 中国新疆 Xinjiang, China | 中国西北内陆棉区 NIR | Pop2 | |
| YU124 | 新陆早7号 Xinluzao 7 | 中国新疆 Xinjiang, China | 中国西北内陆棉区 NIR | Pop2 | |
| YU125 | 新陆早8号 Xinluzao 8 | 中国新疆 Xinjiang, China | 中国西北内陆棉区 NIR | Pop2 | |
| YU126 | 新陆早9号 Xinluzao 9 | 中国新疆 Xinjiang, China | 中国西北内陆棉区 NIR | Pop2 | |
| YU128 | 新陆早11 Xinluzao 11 | 中国新疆 Xinjiang, China | 中国西北内陆棉区 NIR | Pop2 | |
| YU130 | 新陆早13号 Xinluzao 13 | 中国新疆 Xinjiang, China | 中国西北内陆棉区 NIR | Pop2 | |
| YU131 | 新陆早15号 Xinluzao 15 | 中国新疆 Xinjiang, China | 中国西北内陆棉区 NIR | Pop2 | |
| YU132 | 新陆早16 Xinluzao 16 | 中国新疆 Xinjiang, China | 中国西北内陆棉区 NIR | Pop2 | |
| YU133 | 新陆早17号 Xinluzao 17 | 中国新疆 Xinjiang, China | 中国西北内陆棉区 NIR | Pop2 | |
| YU135 | 新陆早19 Xinluzao 19 | 中国新疆 Xinjiang, China | 中国西北内陆棉区 NIR | Pop2 | |
| YU136 | 新陆早20 Xinluzao 20 | 中国新疆 Xinjiang, China | 中国西北内陆棉区 NIR | Pop2 | |
| YU139 | 新陆早23 Xinluzao 23 | 中国新疆 Xinjiang, China | 中国西北内陆棉区 NIR | Pop2 | |
| YU140 | 新陆早24号 Xinluzao 24 | 中国新疆 Xinjiang, China | 中国西北内陆棉区 NIR | Pop2 | |
| YU142 | 新陆早26号 Xinluzao 26 | 中国新疆 Xinjiang, China | 中国西北内陆棉区 NIR | Pop2 | |
| YU143 | 新陆早27号 Xinluzao 27 | 中国新疆 Xinjiang, China | 中国西北内陆棉区 NIR | Pop2 | |
| YU144 | 新陆早28号 Xinluzao 28 | 中国新疆 Xinjiang, China | 中国西北内陆棉区 NIR | Pop2 | |
| YU145 | 新陆早29号 Xinluzao 29 | 中国新疆 Xinjiang, China | 中国西北内陆棉区 NIR | Pop2 | |
| YU146 | 新陆早30号Xinluzao 30 | 中国新疆 Xinjiang, China | 中国西北内陆棉区 NIR | Pop2 | |
| YU147 | 新陆早32号 Xinluzao 32 | 中国新疆 Xinjiang, China | 中国西北内陆棉区 NIR | Pop2 | |
| YU148 | 新陆早33号 Xinluzao 33 | 中国新疆 Xinjiang, China | 中国西北内陆棉区 NIR | Pop2 | |
| YU149 | 新陆早34号 Xinluzao 34 | 中国新疆 Xinjiang, China | 中国西北内陆棉区 NIR | Pop2 | |
| YU150 | 新陆早35号 Xinluzao 35 | 中国新疆 Xinjiang, China | 中国西北内陆棉区 NIR | Pop2 | |
| YU151 | 新陆早36号 Xinluzao 36 | 中国新疆 Xinjiang, China | 中国西北内陆棉区 NIR | Pop2 | |
| YU153 | 新陆早38号 Xinluzao 38 | 中国新疆 Xinjiang, China | 中国西北内陆棉区 NIR | Pop2 | |
| YU154 | 新陆早39号 Xinluzao 39 | 中国新疆 Xinjiang, China | 中国西北内陆棉区 NIR | Pop2 | |
| YU155 | 新陆早40号 Xinluzao 40 | 中国新疆 Xinjiang, China | 中国西北内陆棉区 NIR | Pop2 | |
| YU157 | 新陆早42号 Xinluzao 42 | 中国新疆 Xinjiang, China | 中国西北内陆棉区 NIR | Pop2 | |
| YU158 | 新陆早45号 Xinluzao 45 | 中国新疆 Xinjiang, China | 中国西北内陆棉区 NIR | Pop2 | |
| YU159 | 新陆早46号 Xinluzao 46 | 中国新疆 Xinjiang, China | 中国西北内陆棉区 NIR | Pop2 | |
| YU160 | 新陆早47号 Xinluzao 47 | 中国新疆 Xinjiang, China | 中国西北内陆棉区 NIR | Pop2 | |
| YU161 | 新陆早48号 Xinluzao 48 | 中国新疆 Xinjiang, China | 中国西北内陆棉区 NIR | Pop2 | |
| YU162 | 新陆早49号 Xinluzao 49 | 中国新疆 Xinjiang, China | 中国西北内陆棉区 NIR | Pop2 | |
| YU164 | 新陆早51号 Xinluzao 51 | 中国新疆 Xinjiang, China | 中国西北内陆棉区 NIR | Pop2 | |
| YU165 | 新陆中1号 Xinluzhong 1 | 中国新疆 Xinjiang, China | 中国西北内陆棉区 NIR | Pop2 | |
| YU166 | 新陆中2号 Xinluzhong 2 | 中国新疆 Xinjiang, China | 中国西北内陆棉区 NIR | Pop2 | |
| YU167 | 新陆中3号 Xinluzhong 3 | 中国新疆 Xinjiang, China | 中国西北内陆棉区 NIR | Pop2 | |
| YU168 | 新陆中4号 Xinluzhong 4 | 中国新疆 Xinjiang, China | 中国西北内陆棉区 NIR | Pop2 | |
| YU169 | 新陆中5号 Xinluzhong 5 | 中国新疆 Xinjiang, China | 中国西北内陆棉区 NIR | Pop2 | |
| YU170 | 新陆中6号 Xinluzhong 6 | 中国新疆 Xinjiang, China | 中国西北内陆棉区 NIR | Pop2 | |
| YU171 | 新陆中7号 Xinluzhong 7 | 中国新疆 Xinjiang, China | 中国西北内陆棉区 NIR | Pop2 | |
| YU172 | 新陆中8号 Xinluzhong 8 | 中国新疆 Xinjiang, China | 中国西北内陆棉区 NIR | Pop2 | |
| YU174 | 新陆中10 Xinluzhong 10 | 中国新疆 Xinjiang, China | 中国西北内陆棉区 NIR | Pop2 | |
| YU175 | 新陆中11 Xinluzhong 11 | 中国新疆 Xinjiang, China | 中国西北内陆棉区 NIR | Pop2 | |
| YU182 | 新陆中18 Xinluzhong 18 | 中国新疆 Xinjiang, China | 中国西北内陆棉区 NIR | Pop2 | |
| YU183 | 新陆中19 Xinluzhong 19 | 中国新疆 Xinjiang, China | 中国西北内陆棉区 NIR | Pop2 | |
| YU184 | 新陆中20 Xinluzhong 20 | 中国新疆 Xinjiang, China | 中国西北内陆棉区 NIR | Pop2 | |
| YU185 | 新陆中21 Xinluzhong 21 | 中国新疆 Xinjiang, China | 中国西北内陆棉区 NIR | Pop2 | |
| YU186 | 新陆中22 Xinluzhong 22 | 中国新疆 Xinjiang, China | 中国西北内陆棉区 NIR | Pop2 | |
| YU196 | 新陆中34 Xinluzhong 34 | 中国新疆 Xinjiang, China | 中国西北内陆棉区 NIR | Pop2 | |
| YU215 | 金垦1042 Jinken 1042 | 中国新疆 Xinjiang, China | 中国西北内陆棉区 NIR | Pop2 | |
| YU217 | 墨玉1号 Moyu 1 | 中国新疆 Xinjiang, China | 中国西北内陆棉区 NIR | Pop2 | |
| YU220 | 中植棉2号 Zhongzhimian 2 | 中国河南 Henan, China | 中国黄河流域棉区 YRR | Pop2 | |
| YU232 | 军棉1号 Junmian 1 | 中国新疆 Xinjiang, China | 中国西北内陆棉区 NIR | Pop2 | |
| YU240 | 芽黄 Yahuang | 不详 Unknown | 不详 Unknown | Pop2 | |
| YU243 | 辽棉16 Liaomain 16 | 中国辽宁 Liaoning, China | 中国北方特早熟棉区 NSEMR | Pop2 | |
| YU244 | 辽棉17号 Liaomian 17 | 中国辽宁 Liaoning, China | 中国北方特早熟棉区 NSEMR | Pop2 | |
| YU245 | 辽棉18 Liaomian 18 | 中国辽宁 Liaoning, China | 中国北方特早熟棉区 NSEMR | Pop2 | |
| YU246 | 辽棉19号 Liaomian 19 | 中国辽宁 Liaoning, China | 中国北方特早熟棉区 NSEMR | Pop2 | |
| YU250 | 晋棉10号 Jinmian 10 | 中国山西 Shanxi, China | 中国黄河流域棉区 YRR | Pop2 | |
| YU252 | 晋棉18号 Jinmian 18 | 中国山西 Shanxi, China | 中国黄河流域棉区 YRR | Pop2 | |
| YU257 | 锦棉2号 jinmian 2 | 中国辽宁 Liaoning, China | 中国北方特早熟棉区 NSEMR | Pop2 | |
| YU259 | 朝阳棉1号 Chaoyangmian 1 | 中国辽宁 Liaoning, China | 中国北方特早熟棉区 NSEMR | Pop2 | |
| YU266 | 黑山棉1号 Heishanmian 1 | 中国辽宁 Liaoning, China | 中国北方特早熟棉区 NSEMR | Pop2 | |
| YU268 | 中棉所37 Zhongmiansuo 37 | 中国河南 Henan, China | 中国黄河流域棉区 YRR | Pop2 | |
| YU269 | 中棉所45 Zhongmiansuo 45 | 中国河南 Henan, China | 中国黄河流域棉区 YRR | Pop2 | |
| YU271 | 中棉所58 Zhongmiansuo 58 | 中国河南 Henan, China | 中国黄河流域棉区 YRR | Pop2 | |
| YU276 | 晋中169 Jinzhong 169 | 中国山西 Shanxi, China | 中国黄河流域棉区 YRR | Pop2 | |
| YU283 | 晋棉6号 Jinmian 6 | 中国山西 Shanxi, China | 中国黄河流域棉区 YRR | Pop2 | |
| YU287 | 惠远718 Huiyuan 718 | 中国新疆 Xinjiang, China | 中国西北内陆棉区 NIR | Pop2 | |
| YU288 | 中705 Zhong 705 | 中国新疆 Xinjiang, China | 中国西北内陆棉区 NIR | Pop2 | |
| YU290 | FY11 FY 11 | 中国新疆 Xinjiang, China | 中国西北内陆棉区 NIR | Pop2 | |
| YU316 | 鄂岱棉 Edaimain | 中国湖北 Hubei, China | 中国长江流域棉区 YtRR | Pop2 | |
| YU321 | 冈棉1号 Gangmian 1 | 中国湖北 Hubei, China | 中国长江流域棉区 YtRR | Pop2 | |
| YU330 | 一树红 Yishuhong | 中国河北 Hebei, China | 中国黄河流域棉区 YRR | Pop2 | |
| YU335 | 科遗2号 Keyi 2 | 中国河北 Hebei, China | 中国黄河流域棉区 YRR | Pop2 | |
| YU344 | 斯字棉4号 Sizimian 4 | 美国 America | 美国 USA | Pop2 | |
| YU346 | 泾斯棉 Jingsimain | 中国陕西 Shaanxi, China | 中国黄河流域棉区 YRR | Pop2 | |
| YU347 | 鸭鹏棉 Yapengmian | 中国湖北 Hubei, China | 中国长江流域棉区 YtRR | Pop2 | |
| YU351 | 中棉所5号 Zhongmiansuo 5 | 中国河南 Henan, China | 中国黄河流域棉区 YRR | Pop2 | |
| YU358 | 108夫 108 Fu | 前苏联 Former Soviet Union | 前苏联 SU | Pop2 | |
| YU359 | 611波 611 Bo | 前苏联 Former Soviet Union | 前苏联 SU | Pop2 | |
| YU362 | 安农121 Annong 121 | 中国安徽 Anhui, China | 中国长江流域棉区 YtRR | Pop2 | |
| YU364 | 岱字棉14 Daizimian 14 | 美国 America | 美国 USA | Pop2 | |
| YU365 | 岱字棉16 Daizimian 16 | 美国 America | 美国 USA | Pop2 | |
| YU366 | 德夏棉1号 Dexiamian 1 | 中国山东 Shandong, China | 中国黄河流域棉区 YRR | Pop2 | |
| YU369 | 敦棉2号 Dunmian 2 | 中国甘肃 Gansu, China | 中国西北内陆棉区 NIR | Pop2 | |
| YU370 | 赣棉2号 Ganmian 2 | 中国江西 Jiangxi, China | 中国长江流域棉区 YtRR | Pop2 | |
| YU381 | 锦棉5号 Jinmian 5 | 中国辽宁 Liaoning, China | 中国北方特早熟棉区 NSEMR | Pop2 | |
| YU383 | 晋棉25 Jinmian 25 | 中国山西 Shanxi, China | 中国黄河流域棉区 YRR | Pop2 | |
| YU386 | 珂字棉100 Kezimain 100 | 美国 America | 美国 USA | Pop2 | |
| YU389 | 辽棉5号 Liaomian 5 | 中国辽宁 Liaoning, China | 中国北方特早熟棉区 NSEMR | Pop2 | |
| YU400 | 司1470 Si 1470 | 前苏联 Former Soviet Union | 前苏联 SU | Pop2 | |
新窗口打开|下载CSV
Table S2
附表2
附表2新疆库尔勒及石河子(2016/2017年)水分处理
Table S2
| 次数 Times | 库尔勒Korla | 石河子Shihezi | ||||
|---|---|---|---|---|---|---|
| 日期 Date (month/day) | 正常 CK (m3 hm-2) | 干旱 Drought (m3 hm-2) | 日期 Date (month/day) | 正常 CK (m3 hm-2) | 干旱 Drought (m3 hm-2) | |
| 1 | 6/12 | 423 | 211.5 | 6/5 | 525 | 262.5 |
| 2 | 6/19 | 564 | 282 | 6/15 | 525 | 262.5 |
| 3 | 6/27 | 564 | 282 | 6/25 | 525 | 262.5 |
| 4 | 7/4 | 564 | 282 | 7/5 | 525 | 262.5 |
| 5 | 7/12 | 564 | 282 | 7/15 | 525 | 262.5 |
| 6 | 7/20 | 634.5 | 317.25 | 7/25 | 525 | 262.5 |
| 7 | 7/28 | 705 | 352.5 | — | — | — |
| 8 | 8/3 | 564 | 282 | 8/5 | 525 | 262.5 |
| 9 | 8/10 | 564 | 282 | 8/15 | 525 | 262.5 |
| 10 | 8/18 | 564 | 282 | 8/25 | 450 | 225 |
| 11 | 8/26 | 564 | 282 | — | — | — |
| 12 | 9/3 | 493.5 | 246.75 | 9/10 | 300 | 150 |
| 合计Total | 6768 | 3384 | 4950 | 2475 | ||
新窗口打开|下载CSV
附图1
 新窗口打开|下载原图ZIP|生成PPT
附图12016-2017年新疆石河子和库尔勒棉花全生育期气象数据
Fig. s1Fig. S1 Meteorological data of the whole growth period of cotton in Shihezi and Korla, Xinjiang in 2016-2017
1.2 表型性状调查
自播种后, 以杜雄明等[12]制定的棉花种植资源性状描述规范调查棉花全生育期的18个表型性状。生育期(growth period, GP)从该小区50%的植株子叶平展到50%的植株开始吐絮计算; 每年9月下旬对每小区选择长势一致10株棉花调查株高(plant height, PH)、果枝始节高(first fruit spur height, FFSH)、第一果枝节位(first fruit spur branch number, FFSBN)、果枝数(fruit spur branch number, FSBN)、空果枝数(empty fruit spur branch number, EFSBN)、单株有效铃数(effective boll number, EBN)、外围铃数(peripheral boll number, PBN)等7项指标。吐絮后每个小区分别收获上、中、下部共30铃进行室内考种, 分别测定单铃重(boll weight, BW)、籽指(seed index, SI)、衣指(lint index, LI)及衣分(lint percentage, LP)等4项指标, 并估算理论籽棉产量(theoretical seed cotton yield, TSCY)=实际收获株数×单株有效铃数×单铃重。每个重复选取14 g左右皮棉测定纤维品质性状, 包括上半部纤维长度(fiber upper half mean length, FUHML)、纤维比强度(fiber strength, FS)、纤维整齐度(fiber uniformity, FU)、马克隆值(micronaire value, MV)及纤维伸长率(fiber elongation, FE)。在新疆农垦科学院棉花研究所测定纤维品质, 仪器型号为HFT9000, 检测温度为(20±2)℃, 相对湿度为(65±2)%。1.3 SSR标记及基因型鉴定
参照Paterson等[13]发表的CTAB法提取DNA, SSR试验操作程序和PCR参照张军等[14]方法, 采用毛细管电泳分析仪Fragment Analyzer-XL960 SSR/Tilling分析PCR产物, PCR扩增产物经6%聚丙烯酰胺凝胶电泳, 银染显色后照相。本试验所使用SSR标记来源四倍体棉花遗传图谱[15], 平均每8~10 cM选取1个标记, 并进一步结合钱能等[16]、Song等[17]、薛艳等[18]、Sun等[19]、艾先涛等[20]的研究结果, 从中选取557对标记对自然群体进行筛选, 得到的298对具有多态性的标记。选用12份地理来源差异大的材料(1: 标杂A父本; 2: 新陆早47号; 3: 15-23; 4: 169-57; 5: 新陆早48号; 6: 111-117; 7: 石K14; 8: 闫棉216; 9: 河南抗黄; 10: JF-2; 11: 中植棉2号; 12: 克克1543)对298对SSR标记进行筛选, 将条带差异大, 清晰易读的标记留下备用, 共得到214对多态性标记。SSR序列来自CMD (Cottonmaker Database)数据库(http://www.cottonmarker.org/), 由生工生物工程股份有限公司(上海)合成。对电泳结果使用ProSize2.0软件查看, 采用0、1统计法, 依据读胶视图中Ladder判断样品不同位点片段大小, 同一位点, 有条带记为“1”, 无条带记为“0”, 用“a”、“b”、“c”、“d” (对应片段大小由大到小)区别一个标记在材料中的多个多态性位点。
1.4 数据分析
采用R语言中Lme4包[21]的最佳线性无偏预测(Best Linear Unbiased Prediction; BLUP)分析2年2点的表型数据, 通过H2 = σ2g / [σ2g + σ2ll/nl + σ2ly/ny + σ2r/(nl*ny)]计算广义遗传力[22], 其中σ2g为基因型方差, σ2ll为地点方差, σ2ly为年份方差, σ2r为随机误差, nl为地点重复次数, ny为年份重复次数。材料间组内表型的离散程度用变异系数(coefficient of variation, CV)表示, 通过公式CV=标准偏差/均值进行计算; 材料的抗旱能力用各指标的抗旱系数(drought resistance coefficient, DRC)表示, 并以BLUP分析后的表型数据为基础, 通过公式DRC=处理组BLUP值/对照组BLUP值×100%计算[23,24]。18个正常灌水与干旱条件下的表型值通过软件IBM SPSS Statistics 22.0 (http://www.ibm.com/analytics/us/en/ technology/spss/spss.html)进行单因素方差分析(ANOVA); 同时利用该软件对18个性状的DRC值进行了相关性分析及正态性检验。使用POWERMARKER 3.25软件[25]计算多态性标记的基因多样性指数与多态性信息含量(PIC)。群体结构通过Structure 2.3软件[26]计算, 群组数K值设为1~9。独立运算5次, 将MCMC开始时的不作数迭代设为50,000次, 再将不作数迭代后的MCMC设为500,000次, 其余参数默认, 利用Structure harvester分析计算后的数据[27], 作图并得到最佳K值[28]。借助软件spagedi 1.4 [29]分析亲缘关系, 得到亲缘关系矩阵。利用Tassel 5.0软件[30], 以群体结构(Q)和亲缘关系(K)为协变量的混合线性模型MLM进行性状与标记之间的关联分析[31], 得到在P<0.01 [8]时的各标记位点及对表型变异的贡献率(R2)。借助软件Electronic PCR (e-PCR)与第3代棉花基因组序列进行序列比对, 得到各标记在基因组上的具体位置[32,33]。从CottonQTLdb (http://www2.cottonqtldb.org:8081/traits)下载查找已发表QTL [34,35,36]。
2 结果与分析
2.1 表型性状数据分析
在正常灌水和干旱处理下分别考察群体材料包括生育期、株高、果枝始节高、第一果枝始节位、果枝数、空果枝数、单株有效铃数、外围铃数、单铃重、衣分、籽指、衣分、理论籽棉产量、上半部纤维长度、纤维整齐度、马克隆值、纤维比强度、纤维伸长率等18个性状, 通过BLUP分析分别获得它们在不同环境下的预测表型值, 并计算得到每个性状在不同处理下的变异系数和广义遗传力。表1展示了18个性状在2种条件下的均值(mean)、最大值(max.)、最小值(min.)、标准偏差(SD)、变异系数(CV)以及广义遗传力(H2)。对正常灌水和干旱处理数据分析表明, 一些农艺性状受干旱处理影响较大。比如正常条件下, 生育期的变化范围为129.515~141.447 d, 均值135.433 d; 而在干旱条件下, 生育期的变化范围为128.001~138.175 d, 均值132.843 d。正常情况下, 株高为53.809~74.726 cm (均值65.876 cm); 而干旱处理下, 株高为42.913~72.811 cm (均值60.371 cm)。在正常条件下, 果枝始节高的范围为13.573~27.115 cm (均值20.999 cm); 在干旱处理下, 果枝始节高的范围为13.238~26.303 cm (均值20.032 cm)。生育期、株高、果枝始节高的均值分别降低1.909%、8.357%和4.604%。Table 1
表1
表12种处理下18个性状BLUP分析后的表型变异描述统计表
Table 1
| 性状 Trait | 对照 CK | 方差分析 ANOVA | 干旱 Drought | ||||||||||
|---|---|---|---|---|---|---|---|---|---|---|---|---|---|
| 均值 Mean | 最大值Max. | 最小值Min. | 标准偏差 SD | 变异系数CV(%) | 遗传力(H2) | P值 P-value | 均值 Mean | 最大值 Max. | 最小值 Min. | 标准偏差 SD | 变异系数CV (%) | 遗传力(H2) | |
| 生育期 GP (d) | 135.433 | 141.447 | 129.515 | 2.481 | 1.832 | 0.566 | 1.921E-26** | 132.847 | 138.175 | 128.001 | 2.232 | 1.680 | 0.548 |
| 株高 PH (cm) | 65.876 | 74.726 | 53.809 | 3.526 | 5.353 | 0.536 | 2.021E-37** | 60.371 | 72.811 | 42.913 | 4.525 | 7.496 | 0.572 |
| 果枝始节高 FFSH (cm) | 20.999 | 27.115 | 13.573 | 2.294 | 10.924 | 0.676 | 9.859E-06** | 20.032 | 26.303 | 13.238 | 2.196 | 10.963 | 0.670 |
| 第一果枝节位 FFSBN | 5.986 | 6.935 | 5.159 | 0.267 | 4.453 | 0.319 | 2.067E-03** | 6.045 | 6.250 | 5.736 | 0.088 | 1.459 | 0.112 |
| 果枝数 FSBN | 7.674 | 8.246 | 6.969 | 0.231 | 3.004 | 0.214 | 0.529 | 7.687 | 7.984 | 7.189 | 0.116 | 1.508 | 0.106 |
| 空果枝数 EFSBN | 2.504 | 3.676 | 1.714 | 0.361 | 14.434 | 0.361 | 1.580E-13** | 2.728 | 3.782 | 2.258 | 0.237 | 8.691 | 0.241 |
| 单株有效铃数 EBN | 6.377 | 7.515 | 5.378 | 0.400 | 6.278 | 0.470 | 8.657E-16** | 6.059 | 6.957 | 5.008 | 0.395 | 6.519 | 0.481 |
| 外围铃数 PBN | 1.166 | 2.144 | 0.773 | 0.196 | 16.832 | 0.286 | 5.132E-24** | 1.001 | 1.378 | 0.771 | 0.114 | 11.359 | 0.185 |
| 单铃重 BW (g) | 7.163 | 8.743 | 5.409 | 0.403 | 5.632 | 0.590 | 0.890 | 7.169 | 8.191 | 6.004 | 0.367 | 5.115 | 0.555 |
| 衣分 LP (%) | 39.038 | 42.635 | 32.480 | 1.716 | 4.396 | 0.621 | 4.718E-05** | 39.941 | 59.450 | 32.488 | 2.734 | 6.846 | 0.644 |
| 籽指 SI (g) | 11.126 | 14.043 | 9.638 | 0.775 | 6.964 | 0.711 | 0.098 | 11.000 | 14.328 | 9.352 | 0.811 | 7.375 | 0.714 |
| 衣指 LI (g) | 7.102 | 8.313 | 5.318 | 0.553 | 7.792 | 0.772 | 1.880E-03** | 7.269 | 8.658 | 5.630 | 0.558 | 7.683 | 0.753 |
| 理论籽棉产量TSCY (kg hm-2) | 7473.908 | 8357.364 | 6848.882 | 292.433 | 3.913 | 0.307 | 1.100E-25** | 7111.924 | 8282.359 | 6234.227 | 378.011 | 5.315 | 0.390 |
| 上半部纤维长度FUHML (mm) | 28.808 | 31.503 | 25.713 | 0.970 | 3.366 | 0.725 | 5.650E-08** | 28.285 | 30.877 | 25.880 | 0.998 | 3.528 | 0.702 |
| 纤维整齐度 FU (%) | 84.617 | 85.760 | 81.823 | 0.629 | 0.743 | 0.542 | 0.619 | 84.646 | 86.167 | 82.570 | 0.593 | 0.700 | 0.514 |
| 马克隆值 MV | 4.144 | 4.879 | 3.468 | 0.224 | 5.404 | 0.634 | 4.489E-36** | 4.437 | 5.056 | 3.817 | 0.218 | 4.913 | 0.602 |
| 纤维比强度 FS (cN tex-1) | 28.422 | 32.700 | 25.488 | 1.284 | 4.516 | 0.653 | 7.062E-03** | 28.076 | 32.203 | 25.412 | 1.371 | 4.885 | 0.683 |
| 纤维伸长率 FE (%) | 6.721 | 6.957 | 6.570 | 0.070 | 1.038 | 0.476 | 5.178E-22** | 6.651 | 6.835 | 6.466 | 0.073 | 1.090 | 0.529 |
新窗口打开|下载CSV
纤维品质也受到水分亏缺的不利影响。比如上半部纤维长度均值由28.808 mm降至28.285 mm; 纤维比强度均值也由28.422 cN tex-1降至28.076 cN tex-1; 马克隆值从4.144上升为4.437。理论籽棉产量在正常条件下为6848.882~8357.364 kg hm-2, 干旱条件下6234.227~8282.359 kg hm-2, 平均值由7473.908 kg hm-2降至7111.924 kg hm-2, 降低幅度为4.843%。
为了确定干旱处理是否对棉花的生长发育造成影响, 本研究利用软件IBM SPSS Statistics 22.0对2年2点BLUP分析后的表型数据进行分析, 结果表明, 干旱处理显著影响了大部分表型性状, 包括生育期及株型性状(生育期、株高、果枝始节高、第一果枝节位)、产量性状(空果枝数、单株有效铃数、外围铃数、衣指、衣分、理论籽棉产量)以及纤维品质性状(上半部纤维长度、纤维比强度、马克隆值、纤维伸长率)。但果枝数、单铃重、籽指以及纤维整齐度未达到显著性(表1)。
正常灌水条件下, 18个性状的变异系数为0.743%~16.832%; 干旱胁迫下, 变异系数在0.700%~11.359%。果枝始节高(CVc=10.924%; CVd= 10.963%)、空果枝数(CVc=14.434%; CVd=8.691%)以及外围铃数(CVc=16.832%; CVd=11.359%)的变异系数在2种条件下均为最高; 而纤维整齐度(CVc= 0.743%; CVd=0.700%)、纤维伸长率(CVc=1.038%; CVd=1.090%)及生育期(CVc=1.832%; CVd=1.680%)的变异系数均小于2%。
正常灌水条件下, 18个性状的广义遗传率在0.214~0.772, 干旱胁迫条件下的广义遗传力变化介于0.106~0.753, 其中2种条件下均在0.600以上的有7种性状, 包括衣分(H2c=0.621; H2d=0.644)、籽指(H2c=0.711; H2d=0.714)、衣指(H2c=0.772; H2d=0.753)、上半部纤维长度(H2c=0.725; H2d=0.702)、马克隆值(H2c=0.634; H2d=0.602)、纤维比强度(H2c=0.653; H2d=0.683)和果枝始节高(H2c=0.676; H2d=0.670), 说明这些性状较稳定。
2.2 干旱系数相关性分析及正态性检验
借助软件IBM SPSS Statistics 22.0分析了18个性状的干旱系数之间的相关性系数。各性状干旱系数之间的相关性反映了性状之间的相互联系, 可能会受到相似的遗传因子的调控。18个性状的相关性分析共产生153对相关系数, 范围为-0.433至0.904。其中有56对性状之间存在显著(P<0.05)或极显著(P<0.01)的相关(表2)。生育期、株高以及果枝始节高之间都存在着极显著的正相关。产量相关性状之间单株有效铃数与外围铃数、籽指与衣指、理论籽棉产量与衣指、理论籽棉产量与单铃重、理论籽棉产量与单株有效铃数、理论籽棉产量与外围铃数、理论籽棉产量与果枝数、果枝数与单株有效铃数均存在极显著的正相关。5个纤维品质性状之间, 上半部纤维长度与纤维整齐度、上半部纤维长度与纤维比强度、上半部纤维长度与纤维伸长率、纤维比强度与纤维整齐度和纤维比强度与纤维比强度均表现出极显著的正相关, 纤维比强度与马克隆值表现出极显著的负相关。Table 2
表2
表218个性状干旱系数(DRC)之间的相关性分析
Table 2
| 性状 Traits | 生育期 GP | 株高 PH | 果枝始节高 FFSH | 第一果枝节位 FFSBN | 果枝数 FSBN | 空果枝数 EFSBN | 单株有效铃数 EBN | 外围铃数 PBN | 单铃重 BW | 衣分 LP | 籽指 SI | 衣指 LI | 理论籽棉产量 TSCY | 上半部纤维长度 FUHML | 纤维整齐度 FU | 马克隆值 MV | 纤维比强度 FS |
|---|---|---|---|---|---|---|---|---|---|---|---|---|---|---|---|---|---|
| PH | 0.271** | ||||||||||||||||
| FFSH | 0.250** | 0.319** | |||||||||||||||
| FFSBN | 0.087 | 0.036 | 0.212** | ||||||||||||||
| FSBN | -0.110 | 0.282** | -0.153 | -0.269** | |||||||||||||
| EFSBN | 0.035 | -0.002 | 0.009 | 0.028 | -0.278** | ||||||||||||
| EBN | 0.004 | 0.292** | -0.185** | -0.065 | 0.490** | -0.433** | |||||||||||
| PBN | 0.174* | 0.238** | -0.007 | 0.192** | 0.147* | -0.274** | 0.335** | ||||||||||
| BW | -0.095 | -0.055 | 0.027 | -0.068 | -0.007 | -0.031 | -0.007 | -0.093 | |||||||||
| LP | -0.047 | 0.098 | -0.002 | -0.033 | 0.049 | 0.143* | 0.054 | 0.037 | 0.039 | ||||||||
| SI | -0.023 | -0.062 | -0.040 | -0.126 | 0.033 | -0.102 | 0.006 | -0.182** | 0.296** | -0.223** | |||||||
| LI | -0.146* | -0.088 | -0.076 | -0.209** | 0.002 | -0.050 | 0.033 | -0.102 | 0.490** | 0.068 | 0.477** | ||||||
| TSCY | -0.053 | 0.274** | -0.188** | -0.096 | 0.431** | -0.323** | 0.904** | 0.274** | 0.324** | 0.100 | 0.086 | 0.215** | |||||
| FUHML | 0.164* | 0.146* | -0.004 | -0.072 | 0.080 | -0.088 | 0.237** | 0.188** | 0.026 | -0.054 | 0.171* | 0.097 | 0.228** | ||||
| FU | 0.112 | 0.202** | 0.168* | 0.028 | 0.009 | 0.014 | -0.001 | 0.025 | 0.035 | -0.029 | 0.096 | 0.068 | 0.002 | 0.270** | |||
| MV | -0.264** | -0.223** | -0.131 | -0.097 | 0.037 | -0.031 | -0.027 | -0.257** | 0.426** | 0.025 | 0.200** | 0.497** | 0.104 | -0.130 | 0.042 | ||
| FS | 0.015 | 0.038 | -0.045 | -0.055 | 0.000 | -0.036 | 0.076 | 0.243** | -0.031 | -0.111 | -0.007 | -0.097 | 0.066 | 0.571** | 0.247** | -0.264** | |
| FE | 0.068 | -0.026 | -0.184** | -0.039 | 0.088 | -0.016 | 0.061 | 0.294** | -0.017 | -0.066 | -0.081 | -0.040 | 0.107 | 0.433** | -0.030 | -0.132 | 0.624** |
新窗口打开|下载CSV
为了检测18个性状是否符合正态分布, 本研究利用IBM SPSS Statistics 22.0对表型数据进行正态性检验(附表3), 得到各性状的偏度系数、峰度系数及标准误, 结合U检测及柯尔莫哥洛夫-斯米诺夫(Kolmogorov-Smirnov, K-S)检验法表明, 仅有果枝数不符合正态分布, 其他性状均符合正态分布, 可以进行关联分析。
Table s3
附表3
附表3正态性检验
Table s3
| 性状 Trait | 偏度 Skewness | 偏度标准误 Skewness error | 偏度U值 Skewness U value | 峰度 Kurtosis | 峰度标准误 Kurtosis error | 峰度U值 Kurtosis U value | K-S检验 Kolmogorov-Smirnov test |
|---|---|---|---|---|---|---|---|
| 生育期 GP | 0.225 | 0.165 | 1.364 | 0.568 | 0.329 | 1.726 | 0.200 |
| 株高 PH | 0.204 | 0.165 | 1.236 | 0.814 | 0.329 | 2.474 | 0.096 |
| 果枝始节高 FFSH | 0.114 | 0.165 | 0.691 | 0.497 | 0.329 | 1.511 | 0.200 |
| 第一果枝节位 FFSBN | 0.290 | 0.165 | 1.758 | 0.487 | 0.329 | 1.480 | 0.200 |
| 果枝数 FSBN | 0.436 | 0.165 | 2.642 | 0.471 | 0.329 | 1.432 | 0.009 |
| 空果枝数 EFSBN | 0.299 | 0.165 | 1.812 | 0.958 | 0.329 | 2.912 | 0.200 |
| 单株有效铃数 EBN | 0.229 | 0.165 | 1.388 | 0.276 | 0.329 | 0.839 | 0.200 |
| 外围铃数 PBN | 0.208 | 0.165 | 1.261 | 0.506 | 0.329 | 1.538 | 0.200 |
| 衣分 LP | -0.294 | 0.166 | -1.775 | 0.618 | 0.330 | 1.874 | 0.200 |
| 单铃重 BW | 0.199 | 0.165 | 1.206 | 0.615 | 0.329 | 1.869 | 0.200 |
| 籽指 SI | 0.114 | 0.165 | 0.691 | 0.218 | 0.329 | 0.663 | 0.200 |
| 衣指 LI | 0.271 | 0.165 | 1.642 | 0.278 | 0.329 | 0.845 | 0.200 |
| 理论籽棉产量 TSCY | 0.197 | 0.165 | 1.194 | -0.269 | 0.329 | -0.818 | 0.200 |
| 上半部纤维长度 FUHML | 0.179 | 0.165 | 1.085 | 0.104 | 0.329 | 0.316 | 0.200 |
| 纤维整齐度 FU | 0.260 | 0.165 | 1.576 | -0.275 | 0.329 | -0.836 | 0.200 |
| 马克隆值 MV | 0.403 | 0.165 | 2.442 | 1.310 | 0.329 | 3.982 | 0.200 |
| 纤维比强度 FS | -0.031 | 0.165 | -0.188 | -0.158 | 0.329 | -0.480 | 0.200 |
| 纤维伸长率 FE | 0.189 | 0.165 | cail45 | -0.293 | 0.329 | -0.891 | 0.200 |
新窗口打开|下载CSV
2.3 基因型数据及群体结构分析
在全基因组范围内共选取557个SSR标记对自然群体进行检测, 得到的298对具有多态性的标记。选取地理来源相距较远的12个材料, 从298对SSR标记中筛选出214对重复性好、条带清晰稳定的多态性标记用于此群体的遗传多样性分析, 占总体的38.420%, 平均每条染色体有8.231个标记。部分标记的筛选及群体扩增条带如下(图1)。图1
 新窗口打开|下载原图ZIP|生成PPT
图1标记筛选与扩增展示
A: 部分标记的筛选; B: 标记NAU3377在部分材料中的扩增结果。1~12: 12份地理来源差异大的材料; p1~p27: 217份自然群体中部分材料; M: marker。
Fig. 1Marker screening and amplification display
A: screening of partial markers; B: amplification products of marker NAU3377 in some accessions. 1-12: 12 accessions with extremely different geographical origins; p1-p27: some varieties from 217 natural populations; M: marker.
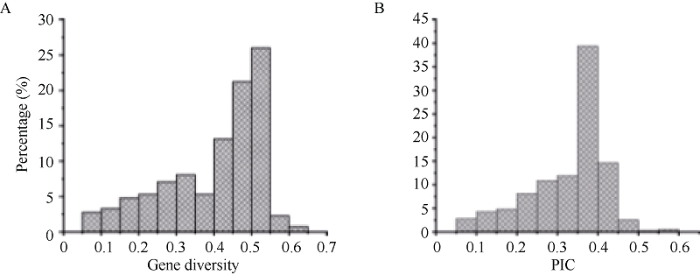
用筛选出的多态性好的214对标记对217份供试材料进行扩增, 共检测出393个等位变异, 平均每条标记约有1.836个等位基因, 变异范围为1~4个; 通过软件POWERMARKER V3.25计算得到214对SSR标记的基因多样性指数与PIC值(附表4), 其中214对SSR标记的基因多样性指数平均值为0.402, 范围为0.072~0.631, PIC值平均为0.329, 范围为0.070~0.560 (图2)。
图2
 新窗口打开|下载原图ZIP|生成PPT
图2214个标记位点的基因多样性(A)与多态性信息含量(B)频率分布图
Fig. 2Gene diversity (A) and PIC frequency (B) profiles of 214 marker sites
Table s4
附表4
附表4基因多样性与多态性信息含量
Table s4
| 标记 Marker | 染色体 Chromosome | 位置 Position | 基因多样性 Gene diversity | 多态性信息含量 PIC |
|---|---|---|---|---|
| NAU2083 | A01 | 2780968 | 0.485 | 0.380 |
| NAU2437a | A01 | 117610973 | 0.413 | 0.353 |
| NAU2437b | A01 | 117610973 | 0.507 | 0.411 |
| NAU2437c | A01 | 117610973 | 0.505 | 0.409 |
| NAU3911 | A01 | Unknown | 0.452 | 0.362 |
| NAU5163a | A01 | 110126985 | 0.442 | 0.356 |
| NAU5163b | A01 | 110126985 | 0.399 | 0.329 |
| NAU7195 | A01 | 101362742 | 0.516 | 0.401 |
| NAU2265a | A02 | 107706133 | 0.515 | 0.408 |
| NAU2265b | A02 | 107706133 | 0.519 | 0.410 |
| NAU437a | A02 | 100427971 | 0.510 | 0.405 |
| NAU437b | A02 | 100427971 | 0.503 | 0.401 |
| NAU5499a | A02 | 2635809 | 0.485 | 0.380 |
| NAU5499b | A02 | 2635809 | 0.501 | 0.389 |
| NAU1071b | A03 | 106637739 | 0.517 | 0.401 |
| NAU1167a | A03 | 4391385 | 0.495 | 0.385 |
| NAU1167b | A03 | 4391385 | 0.355 | 0.301 |
| NAU1167c | A03 | 4391385 | 0.390 | 0.324 |
| NAU1167d | A03 | 4391385 | 0.485 | 0.380 |
| NAU3016a | A03 | 4006753 | 0.325 | 0.292 |
| NAU3016b | A03 | 4006753 | 0.495 | 0.407 |
| NAU3016c | A03 | 4006753 | 0.225 | 0.212 |
| NAU3639a | A03 | 23809975 | 0.529 | 0.419 |
| NAU3639b | A03 | 23809975 | 0.530 | 0.420 |
| NAU483a | A03 | 110023937 | 0.336 | 0.299 |
| NAU483b | A03 | 110023937 | 0.324 | 0.290 |
| NAU6104 | A03 | 1350357 | 0.154 | 0.146 |
| BNL0530 | A04 | 77214336 | 0.533 | 0.472 |
| BNL3089a | A04 | 1540330 | 0.305 | 0.266 |
| BNL3089b | A04 | 1540330 | 0.509 | 0.393 |
| NAU7182 | A04 | 83581454 | 0.171 | 0.162 |
| NAU2701 | A04 | Unknown | 0.080 | 0.079 |
| BNL3452a | A05 | 4448024 | 0.460 | 0.354 |
| BNL3452b | A05 | 4448024 | 0.301 | 0.255 |
| CIR062a | A05 | 22056200 | 0.443 | 0.349 |
| CIR062b | A05 | 22056200 | 0.458 | 0.357 |
| DPL641a | A05 | 2941652 | 0.434 | 0.354 |
| DPL641b | A05 | 2941652 | 0.434 | 0.354 |
| DPL641c | A05 | 2941652 | 0.170 | 0.161 |
| DPL641d | A05 | 2941652 | 0.089 | 0.087 |
| JESPR065a | A05 | 98149721 | 0.355 | 0.301 |
| JESPR065b | A05 | 98149721 | 0.287 | 0.253 |
| JESPR065c | A05 | 98149721 | 0.281 | 0.249 |
| NAU1042a | A05 | 15535848 | 0.514 | 0.395 |
| NAU1042b | A05 | 15535848 | 0.507 | 0.392 |
| NAU1156a | A05 | 21325479 | 0.529 | 0.419 |
| NAU1156b | A05 | 21325479 | 0.530 | 0.420 |
| NAU2121a | A05 | 105667071 | 0.483 | 0.379 |
| NAU2121b | A05 | 105667071 | 0.514 | 0.395 |
| NAU2957 | A05 | 34370549 | 0.271 | 0.234 |
| NAU3036a | A05 | 107748182 | 0.380 | 0.318 |
| NAU3036b | A05 | 107748182 | 0.487 | 0.381 |
| NAU3529a | A05 | 32011590 | 0.437 | 0.342 |
| NAU3529b | A05 | 32011590 | 0.392 | 0.315 |
| NAU6094a | A05 | 103382079 | 0.509 | 0.393 |
| NAU6094b | A05 | 103382079 | 0.503 | 0.389 |
| NAU6966 | A05 | 108024271 | 0.299 | 0.262 |
| NAU797a | A05 | 15535921 | 0.517 | 0.401 |
| NAU797b | A05 | 15535921 | 0.498 | 0.391 |
| NAU934a | A05 | 107002392 | 0.385 | 0.321 |
| NAU934b | A05 | 107002392 | 0.262 | 0.234 |
| NAU1200a | A05 | 67092496 | 0.535 | 0.426 |
| NAU1200b | A05 | 67092496 | 0.427 | 0.362 |
| NAU4057a | A05 | 105666831 | 0.449 | 0.360 |
| NAU4057b | A05 | 105666831 | 0.340 | 0.291 |
| BNL3650a | A06 | 116539321 | 0.489 | 0.435 |
| BNL3650b | A06 | 116539321 | 0.236 | 0.215 |
| BNL3650c | A06 | 116539321 | 0.493 | 0.438 |
| CIR280 | A06 | 6580622 | 0.448 | 0.373 |
| NAU2679a | A06 | 67697637 | 0.416 | 0.340 |
| NAU2679b | A06 | 67697637 | 0.350 | 0.298 |
| NAU3206a | A06 | 120517070 | 0.407 | 0.335 |
| NAU3206b | A06 | 120517070 | 0.416 | 0.340 |
| NAU3427 | A06 | 123792689 | 0.339 | 0.282 |
| NAU7121a | A06 | 7809936 | 0.168 | 0.155 |
| NAU7121b | A06 | 7809936 | 0.190 | 0.174 |
| NAU874a | A06 | 112365204 | 0.522 | 0.408 |
| NAU874b | A06 | 112365204 | 0.464 | 0.376 |
| HAU1355a | A06 | 8067852 | 0.506 | 0.391 |
| HAU1355b | A06 | 8067852 | 0.470 | 0.372 |
| HAU1355c | A06 | 8067852 | 0.228 | 0.208 |
| NAU1043a | A07 | 5574496 | 0.521 | 0.407 |
| NAU1043b | A07 | 5574496 | 0.519 | 0.406 |
| NAU1043c | A07 | 5574496 | 0.244 | 0.223 |
| NAU1362a | A07 | 21914654 | 0.380 | 0.318 |
| NAU1362b | A07 | 21914654 | 0.485 | 0.380 |
| NAU1362c | A07 | 21914654 | 0.514 | 0.395 |
| NAU845a | A07 | 9082964 | 0.464 | 0.369 |
| NAU845b | A07 | 9082964 | 0.467 | 0.370 |
| NAU1085a | A07 | 17517122 | 0.501 | 0.410 |
| NAU1085b | A07 | 17517122 | 0.538 | 0.431 |
| BNL3257a | A08 | 75471450 | 0.452 | 0.362 |
| BNL3257b | A08 | 75471450 | 0.467 | 0.370 |
| BNL1231a | A08 | Unknown | 0.505 | 0.391 |
| BNL1231b | A08 | Unknown | 0.480 | 0.377 |
| NAU1369a | A08 | 116120479 | 0.452 | 0.365 |
| NAU1369b | A08 | 116120479 | 0.464 | 0.372 |
| NAU3201a | A08 | 111954481 | 0.284 | 0.257 |
| NAU3201b | A08 | 111954481 | 0.155 | 0.149 |
| NAU6761 | A08 | 121988408 | 0.238 | 0.221 |
| NAU5357a | A08 | 117866133 | 0.163 | 0.155 |
| NAU5357b | A08 | 117866133 | 0.098 | 0.095 |
| NAU5368a | A08 | 117866202 | 0.467 | 0.370 |
| NAU5368b | A08 | 117866202 | 0.080 | 0.079 |
| BNL3173a | A09 | 81621533 | 0.355 | 0.301 |
| BNL3173b | A09 | 81621533 | 0.483 | 0.379 |
| NAU2354a | A09 | 81112818 | 0.305 | 0.266 |
| NAU2354b | A09 | 81112818 | 0.345 | 0.294 |
| NAU2723 | A09 | 81084858 | 0.435 | 0.352 |
| NAU3052a | A09 | 70893120 | 0.467 | 0.370 |
| NAU3052b | A09 | 70893120 | 0.380 | 0.318 |
| NAU3414a | A09 | 78743809 | 0.513 | 0.395 |
| NAU3414b | A09 | 78743809 | 0.511 | 0.394 |
| NAU462 | A09 | 77167956 | 0.509 | 0.393 |
| NAU859a | A09 | 53596735 | 0.500 | 0.438 |
| NAU859b | A09 | 53596735 | 0.425 | 0.383 |
| BNL2960a | A10 | 104965293 | 0.445 | 0.361 |
| BNL2960b | A10 | 104965293 | 0.434 | 0.354 |
| HAU2147a | A10 | 114051471 | 0.337 | 0.294 |
| HAU2147b | A10 | 114051471 | 0.513 | 0.403 |
| NAU2317a | A10 | 135887 | 0.455 | 0.364 |
| NAU2317b | A10 | 135887 | 0.513 | 0.395 |
| STV031a | A10 | 1605517 | 0.445 | 0.361 |
| STV031b | A10 | 1605517 | 0.414 | 0.342 |
| BNL3442a | A11 | 3977035 | 0.511 | 0.394 |
| BNL3442b | A11 | 3977035 | 0.514 | 0.395 |
| BNL3442c | A11 | 3977035 | 0.192 | 0.178 |
| BNL3442d | A11 | 3977035 | 0.501 | 0.389 |
| BNL3594a | A11 | 111669374 | 0.442 | 0.356 |
| BNL3594b | A11 | 111669374 | 0.329 | 0.283 |
| BNL3594c | A11 | 111669374 | 0.485 | 0.380 |
| DPL209 | A11 | 114819462 | 0.467 | 0.381 |
| NAU1162a | A11 | 18951558 | 0.552 | 0.455 |
| NAU1162b | A11 | 18951558 | 0.552 | 0.455 |
| NAU2092a | A11 | Unknown | 0.340 | 0.291 |
| NAU2092b | A11 | Unknown | 0.439 | 0.354 |
| NAU2809 | A11 | 107267539 | 0.228 | 0.208 |
| NAU3390a | A11 | 118809408 | 0.371 | 0.320 |
| NAU3390b | A11 | 118809408 | 0.371 | 0.320 |
| NAU5428a | A11 | 119324448 | 0.551 | 0.465 |
| NAU5428b | A11 | 119324448 | 0.485 | 0.422 |
| NAU980a | A11 | 198980 | 0.498 | 0.387 |
| NAU980b | A11 | 198980 | 0.464 | 0.369 |
| BNL598a | A12 | 102746569 | 0.257 | 0.234 |
| BNL598b | A12 | 102746569 | 0.131 | 0.126 |
| HAU1434a | A12 | 82661602 | 0.297 | 0.266 |
| HAU1434b | A12 | 82661602 | 0.315 | 0.280 |
| NAU1274a | A12 | 7099421 | 0.526 | 0.414 |
| NAU1274b | A12 | 7099421 | 0.526 | 0.414 |
| NAU2671a | A12 | 103306465 | 0.416 | 0.347 |
| NAU2671b | A12 | 103306465 | 0.484 | 0.387 |
| NAU2672a | A12 | 103304492 | 0.403 | 0.332 |
| NAU2672b | A12 | 103304492 | 0.424 | 0.345 |
| NAU3519a | A12 | 107358613 | 0.514 | 0.395 |
| NAU3519b | A12 | 107358613 | 0.487 | 0.381 |
| NAU3778a | A12 | 105172457 | 0.476 | 0.379 |
| NAU3778b | A12 | 105172457 | 0.473 | 0.377 |
| NAU4047 | A12 | 1483263 | 0.455 | 0.364 |
| NAU3522a | A12 | 106203559 | 0.508 | 0.392 |
| NAU3522b | A12 | 106203559 | 0.501 | 0.389 |
| NAU3522c | A12 | 106203559 | 0.323 | 0.279 |
| BNL1421 | A13 | 6131449 | 0.519 | 0.406 |
| BNL2449a | A13 | 33336622 | 0.473 | 0.373 |
| BNL2449b | A13 | 33336622 | 0.293 | 0.258 |
| JESPR153a | A13 | 82266861 | 0.422 | 0.347 |
| JESPR153b | A13 | 82266861 | 0.513 | 0.399 |
| JESPR153c | A13 | 82266861 | 0.229 | 0.210 |
| JESPR153d | A13 | 82266861 | 0.448 | 0.363 |
| NAU1141a | A13 | 76854166 | 0.130 | 0.125 |
| NAU2285 | A13 | 107420232 | 0.122 | 0.117 |
| NAU3074a | A13 | Unknown | 0.528 | 0.422 |
| NAU3074b | A13 | Unknown | 0.511 | 0.413 |
| NAU3127 | A13 | 13749598 | 0.242 | 0.218 |
| NAU3468a | A13 | 97160131 | 0.349 | 0.321 |
| NAU3468b | A13 | 97160131 | 0.516 | 0.443 |
| NAU3653a | A13 | Unknown | 0.475 | 0.375 |
| NAU3653b | A13 | Unknown | 0.509 | 0.393 |
| NAU3653c | A13 | Unknown | 0.491 | 0.383 |
| NAU4045a | A13 | 102679122 | 0.501 | 0.389 |
| NAU4045b | A13 | 102679122 | 0.416 | 0.340 |
| NAU4045c | A13 | 102679122 | 0.334 | 0.287 |
| NAU3254a | D01 | 61038247 | 0.506 | 0.395 |
| NAU3254b | D01 | 61038247 | 0.517 | 0.401 |
| NAU3736a | D01 | 55892989 | 0.501 | 0.389 |
| NAU3736b | D01 | 55892989 | 0.452 | 0.362 |
| NAU3736c | D01 | 55892989 | 0.513 | 0.395 |
| CIR307a | D01 | 55938566 | 0.573 | 0.486 |
| CIR307b | D01 | 55938566 | 0.463 | 0.412 |
| CIR307c | D01 | 55938566 | 0.567 | 0.482 |
| NAU1103a | D01 | Unknown | 0.517 | 0.401 |
| NAU1103b | D01 | Unknown | 0.516 | 0.400 |
| NAU2165a | D01 | 28520686 | 0.497 | 0.386 |
| NAU2165b | D01 | 28520686 | 0.478 | 0.376 |
| NAU4073a | D01 | 7592761 | 0.504 | 0.390 |
| NAU4073b | D01 | 7592761 | 0.199 | 0.184 |
| NAU3820a | D02 | 67522720 | 0.518 | 0.401 |
| NAU3820b | D02 | 67522720 | 0.508 | 0.396 |
| CIR246a | D02 | 1034633 | 0.558 | 0.470 |
| CIR246b | D02 | 1034633 | 0.553 | 0.467 |
| HAU1741a | D02 | 60791378 | 0.466 | 0.392 |
| HAU1741b | D02 | 60791378 | 0.473 | 0.397 |
| NAU1070a | D02 | 64372944 | 0.526 | 0.414 |
| NAU1070b | D02 | 64372944 | 0.523 | 0.412 |
| NAU1070c | D02 | 64372944 | 0.507 | 0.403 |
| NAU2312 | D02 | 64647855 | 0.478 | 0.380 |
| NAU2336a | D02 | 60791352 | 0.446 | 0.358 |
| NAU2336b | D02 | 60791352 | 0.439 | 0.354 |
| NAU2960 | D02 | 68847512 | 0.359 | 0.309 |
| NAU3308a | D02 | 20723795 | 0.416 | 0.340 |
| NAU3308b | D02 | 20723795 | 0.407 | 0.335 |
| NAU5467 | D02 | 4547261 | 0.501 | 0.389 |
| NAU1190a | D02 | 52287611 | 0.185 | 0.172 |
| NAU1190b | D02 | 52287611 | 0.242 | 0.218 |
| NAU1190c | D02 | 52287611 | 0.446 | 0.358 |
| NAU1028a | D03 | 4208117 | 0.350 | 0.305 |
| NAU1028b | D03 | 4208117 | 0.422 | 0.354 |
| BNL2496a | D03 | 49769485 | 0.507 | 0.392 |
| BNL2496b | D03 | 49769485 | 0.508 | 0.392 |
| NAU2691a | D03 | 51541076 | 0.480 | 0.377 |
| NAU2691b | D03 | 51541076 | 0.089 | 0.087 |
| NAU2859a | D03 | 739946 | 0.488 | 0.386 |
| NAU2859b | D03 | 739946 | 0.503 | 0.394 |
| NAU5233a | D03 | 48828576 | 0.470 | 0.379 |
| NAU5233b | D03 | 48828576 | 0.384 | 0.326 |
| NAU5260a | D03 | 49769436 | 0.521 | 0.415 |
| NAU5260b | D03 | 49769436 | 0.521 | 0.415 |
| NAU3995a | D03 | 48818033 | 0.490 | 0.387 |
| NAU3995b | D03 | 48818033 | 0.362 | 0.309 |
| NAU3995c | D03 | 48818033 | 0.401 | 0.334 |
| NAU3995d | D03 | 48818033 | 0.498 | 0.391 |
| NAU2162 | D04 | 52748794 | 0.402 | 0.343 |
| NAU2477 | D04 | 52748794 | 0.423 | 0.334 |
| NAU5099 | D04 | 14627857 | 0.511 | 0.402 |
| NAU6109a | D04 | 7989666 | 0.497 | 0.386 |
| NAU6109b | D04 | 7989666 | 0.505 | 0.391 |
| BNL3875a | D05 | 19969852 | 0.162 | 0.152 |
| BNL3875b | D05 | 19969852 | 0.513 | 0.395 |
| BNL3875c | D05 | 19969852 | 0.511 | 0.394 |
| HAU1385a | D05 | 25837076 | 0.515 | 0.400 |
| HAU1385b | D05 | 25837076 | 0.498 | 0.391 |
| HAU139 | D05 | 1145554 | 0.154 | 0.146 |
| HAU1952a | D05 | 17158169 | 0.346 | 0.304 |
| HAU1952b | D05 | 17158169 | 0.252 | 0.233 |
| NAU1102a | D05 | 57144706 | 0.491 | 0.383 |
| NAU1102b | D05 | 57144706 | 0.462 | 0.367 |
| NAU1230a | D05 | 14213471 | 0.539 | 0.432 |
| NAU1230b | D05 | 14213471 | 0.539 | 0.432 |
| NAU1255a | D05 | 14213543 | 0.513 | 0.395 |
| NAU1255b | D05 | 14213543 | 0.508 | 0.392 |
| NAU2560a | D05 | 3199535 | 0.478 | 0.376 |
| NAU3092a | D05 | 1831191 | 0.080 | 0.079 |
| NAU3092b | D05 | 1831191 | 0.106 | 0.102 |
| NAU3095a | D05 | 62407901 | 0.582 | 0.498 |
| NAU3095b | D05 | 62407901 | 0.583 | 0.499 |
| NAU3110a | D05 | 57144758 | 0.488 | 0.386 |
| NAU3110b | D05 | 57144758 | 0.502 | 0.393 |
| NAU5005a | D05 | 19969727 | 0.515 | 0.408 |
| NAU5005b | D05 | 19969727 | 0.526 | 0.414 |
| NAU911a | D05 | 23685867 | 0.248 | 0.224 |
| NAU911b | D05 | 23685867 | 0.114 | 0.110 |
| NAU911c | D05 | 23685867 | 0.146 | 0.139 |
| HAU979 | D05 | 17796138 | 0.192 | 0.178 |
| JESPR181 | D05 | 10325076 | 0.323 | 0.279 |
| NAU2274a | D05 | 28099825 | 0.503 | 0.389 |
| NAU2274b | D05 | 28099825 | 0.501 | 0.389 |
| HAU1384 | D05 | 25837176 | 0.518 | 0.402 |
| NAU4907a | D05 | 55447507 | 0.377 | 0.319 |
| NAU4907b | D05 | 55447507 | 0.396 | 0.331 |
| DPL238a | D06 | 4585891 | 0.489 | 0.382 |
| DPL238b | D06 | 4585891 | 0.489 | 0.382 |
| HAU2022a | D06 | 1765934 | 0.513 | 0.395 |
| HAU2022b | D06 | 1765934 | 0.512 | 0.394 |
| NAU2119 | D06 | 18678530 | 0.295 | 0.261 |
| NAU3031a | D06 | 65581273 | 0.123 | 0.119 |
| NAU3031b | D06 | 65581273 | 0.279 | 0.254 |
| NAU3031c | D06 | 65581273 | 0.317 | 0.283 |
| NAU5463a | D06 | 9334593 | 0.498 | 0.387 |
| NAU5463b | D06 | 9334593 | 0.192 | 0.178 |
| BNL1122a | D07 | 30098941 | 0.505 | 0.395 |
| BNL1122b | D07 | 30098941 | 0.452 | 0.365 |
| BNL1395a | D07 | 30098949 | 0.445 | 0.361 |
| BNL1395b | D07 | 30098949 | 0.414 | 0.342 |
| HAU3101a | D07 | 4785009 | 0.527 | 0.422 |
| HAU3101b | D07 | 4785009 | 0.527 | 0.422 |
| NAU2078a | D07 | 8939270 | 0.345 | 0.294 |
| NAU2078b | D07 | 8939270 | 0.452 | 0.362 |
| NAU2152a | D07 | Unknown | 0.334 | 0.278 |
| NAU2152b | D07 | Unknown | 0.318 | 0.267 |
| NAU2680 | D07 | 54609116 | 0.106 | 0.102 |
| NAU2931a | D07 | 7149495 | 0.478 | 0.380 |
| NAU2931b | D07 | 7149495 | 0.498 | 0.391 |
| NAU2984a | D07 | 3548571 | 0.287 | 0.253 |
| NAU2984b | D07 | 3548571 | 0.480 | 0.377 |
| NAU3053a | D07 | 3934539 | 0.293 | 0.258 |
| NAU3053b | D07 | 3934539 | 0.275 | 0.244 |
| NAU3424a | D07 | 56343210 | 0.318 | 0.295 |
| NAU3424b | D07 | 56343210 | 0.304 | 0.283 |
| DPL176a | D08 | 55897848 | 0.239 | 0.224 |
| DPL176b | D08 | 55897848 | 0.313 | 0.283 |
| BNL1521a | D08 | 56957004 | 0.513 | 0.395 |
| BNL1521b | D08 | 56957004 | 0.507 | 0.392 |
| BNL3255a | D08 | Unknown | 0.275 | 0.244 |
| BNL3255b | D08 | Unknown | 0.323 | 0.279 |
| BNL3474a | D08 | 44314753 | 0.146 | 0.139 |
| BNL3474b | D08 | 44314753 | 0.475 | 0.375 |
| BNL3474c | D08 | 44314753 | 0.475 | 0.375 |
| BNL3474d | D08 | 44314753 | 0.512 | 0.394 |
| HAU1846a | D08 | 52349862 | 0.256 | 0.231 |
| HAU1846b | D08 | 52349862 | 0.448 | 0.363 |
| NAU1302 | D08 | 59501957 | 0.293 | 0.258 |
| NAU1350 | D08 | 5881541 | 0.209 | 0.195 |
| NAU478a | D08 | 60563256 | 0.497 | 0.386 |
| NAU478b | D08 | 60563256 | 0.493 | 0.384 |
| NAU478c | D08 | 60563256 | 0.072 | 0.070 |
| NAU5335a | D08 | 35689851 | 0.410 | 0.339 |
| NAU5335b | D08 | 35689851 | 0.155 | 0.147 |
| NAU1125a | D08 | 33046419 | 0.264 | 0.239 |
| NAU1125b | D08 | 33046419 | 0.163 | 0.155 |
| NAU2631a | D08 | 35689836 | 0.229 | 0.210 |
| NAU2631b | D08 | 35689836 | 0.229 | 0.210 |
| NAU5379 | D08 | 23238772 | 0.183 | 0.168 |
| BNL3140a | D09 | 41018983 | 0.449 | 0.360 |
| BNL3140b | D09 | 41018983 | 0.512 | 0.394 |
| NAU2873a | D09 | 50715379 | 0.495 | 0.385 |
| NAU2873b | D09 | 50715379 | 0.498 | 0.387 |
| NAU2954a | D09 | 44671699 | 0.449 | 0.360 |
| NAU2954b | D09 | 44671699 | 0.317 | 0.275 |
| NAU3100a | D09 | 1609129 | 0.330 | 0.286 |
| NAU3100b | D09 | 1609129 | 0.330 | 0.286 |
| NAU3277a | D09 | 44671639 | 0.438 | 0.357 |
| NAU3277b | D09 | 44671639 | 0.464 | 0.372 |
| NAU5189a | D09 | 49805569 | 0.493 | 0.384 |
| NAU5189b | D09 | 49805569 | 0.491 | 0.383 |
| NAU5508a | D09 | 36179107 | 0.461 | 0.371 |
| NAU5508b | D09 | 36179107 | 0.072 | 0.070 |
| NAU923 | D09 | 42608151 | 0.501 | 0.400 |
| NAU3603 | D09 | 52194600 | 0.424 | 0.345 |
| NAU1375a | D09 | 9223243 | 0.501 | 0.416 |
| NAU1375b | D09 | 9223243 | 0.479 | 0.403 |
| BNL1161 | D10 | 16772954 | 0.255 | 0.229 |
| BNL3948a | D10 | 21665070 | 0.512 | 0.394 |
| BNL3948b | D10 | 21665070 | 0.509 | 0.393 |
| NAU1169a | D10 | 65685416 | 0.207 | 0.190 |
| NAU1169b | D10 | 65685416 | 0.130 | 0.125 |
| NAU3368a | D10 | 57924983 | 0.147 | 0.141 |
| NAU3368b | D10 | 57924983 | 0.250 | 0.229 |
| NAU3404a | D10 | 54147837 | 0.495 | 0.385 |
| NAU3404b | D10 | 54147837 | 0.495 | 0.385 |
| NAU3992 | D10 | Unknown | 0.281 | 0.249 |
| NAU4921a | D10 | 65685334 | 0.243 | 0.221 |
| NAU4921b | D10 | 65685334 | 0.200 | 0.186 |
| BNL3997a | D11 | 26231376 | 0.409 | 0.345 |
| BNL3997b | D11 | 26231376 | 0.446 | 0.368 |
| NAU1366 | D11 | 5452094 | 0.357 | 0.305 |
| NAU2016a | D11 | Unknown | 0.507 | 0.403 |
| NAU2016b | D11 | Unknown | 0.510 | 0.405 |
| NAU3377a | D11 | 379087 | 0.072 | 0.070 |
| NAU3377b | D11 | 379087 | 0.192 | 0.178 |
| NAU3377c | D11 | 379087 | 0.281 | 0.249 |
| NAU3377d | D11 | 379087 | 0.214 | 0.196 |
| NAU3493a | D11 | 61968136 | 0.619 | 0.549 |
| NAU3493b | D11 | 61968136 | 0.631 | 0.560 |
| NAU4855 | D11 | 18618558 | 0.080 | 0.076 |
| BNL3976a | D11 | 17463647 | 0.223 | 0.208 |
| BNL3976b | D11 | 17463647 | 0.278 | 0.252 |
| BNL2495a | D12 | 51784271 | 0.467 | 0.370 |
| BNL2495b | D12 | 51784271 | 0.458 | 0.365 |
| CIR170a | D12 | 500220 | 0.401 | 0.362 |
| CIR170b | D12 | 500220 | 0.401 | 0.362 |
| CIR183a | D12 | Unknown | 0.517 | 0.401 |
| CIR183b | D12 | Unknown | 0.401 | 0.334 |
| HAU1292a | D12 | 44125895 | 0.263 | 0.237 |
| HAU1292b | D12 | 44125895 | 0.229 | 0.210 |
| NAU3881a | D12 | 38589423 | 0.390 | 0.324 |
| NAU3881b | D12 | 38589423 | 0.458 | 0.365 |
| NAU3881c | D12 | 38589423 | 0.192 | 0.178 |
| NAU4926a | D12 | 5980182 | 0.498 | 0.409 |
| NAU4926b | D12 | 5980182 | 0.401 | 0.347 |
| NAU4926c | D12 | 5980182 | 0.441 | 0.374 |
| NAU4926d | D12 | 5980182 | 0.313 | 0.283 |
| BNL3280 | D13 | 41263713 | 0.106 | 0.102 |
| BNL3558 | D13 | 5643212 | 0.121 | 0.113 |
| NAU2443a | D13 | 48572734 | 0.263 | 0.237 |
| NAU2443b | D13 | 48572734 | 0.229 | 0.210 |
| NAU2443c | D13 | 48572734 | 0.476 | 0.379 |
| NAU3589a | D13 | 55405550 | 0.288 | 0.256 |
| NAU3589b | D13 | 55405550 | 0.282 | 0.251 |
| NAU3861a | D13 | 60004305 | 0.509 | 0.393 |
| NAU3861b | D13 | 60004305 | 0.412 | 0.337 |
| NAU3948a | D13 | 5376165 | 0.357 | 0.305 |
| NAU3948b | D13 | 5376165 | 0.336 | 0.290 |
| NAU5262a | D13 | 59990797 | 0.532 | 0.425 |
| NAU5262b | D13 | 59990797 | 0.505 | 0.409 |
新窗口打开|下载CSV
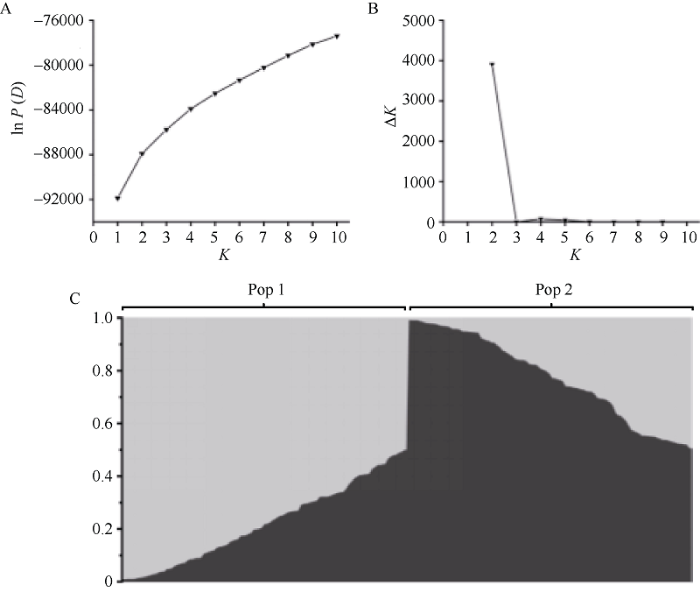
借助生物信息软件Structure V2.3软件分析217个材料的群体结构。模拟亚群数量设为K, 亚群数量取1~9, 得到5次重复的结果后, 利用Structure harvester进行分析, 统计在不同K值时的ln P(D), 绘制ln P(D)的趋势图。由于无法判断K的取值, 因此采用Evanno等的方法, 通过ΔK来确定K值。在K=2时ΔK达到最大, 由此将棉花材料划分为2个亚群(图3-A, B)。绘制材料的群体结构图(图3-C), 其中Pop1 (Population 1)有108材料, Pop2 (Population 2)有109材料, 并且与地理来源无明显对应关系, 各材料亚群分布与地理来源见附表1。
图3
 新窗口打开|下载原图ZIP|生成PPT
图3217份材料基于群体结构分析的K值与ln P(D)值和?K值变化图及群体结构图
A: K值与ln P(D)值的变化图; B: K值与?K值的变化图; C: 217份材料的群体结构图。
Fig. 3ln P(D) and ?K based on population structure analysis and population structure for 217 upland cotton accessions
A: magnitude of ln P(D) as a function of K; B: magnitude of ?K as a function of K; C: population structure of 217 upland cotton accessions.
2.4 关联分析
材料的抗旱能力用各指标的抗旱系数(DRC)表示, 借助软件Tassel 5.0并采用混合线性模型MLM(Q+K)对各性状的抗旱系数进行关联分析。在P<0.01的显著性阈值共关联到76个位点(表3)。我们首先对广义遗传率较高的纤维比强度、上半部纤维长度、衣分、马克隆值、果枝始节高、籽指、衣指的考察发现, 与纤维比强度关联到的位点有7个(NAU2152b、NAU2152a、JESPR181、NAU859a、NAU3589b、NAU3529a、NAU1362c), 表型变异解释率范围为3.020%~5.425%; 上半部纤维长度关联到5个位点, 分别是NAU1042b、NAU797a、HAU1355c、NAU5260b、NAU3277a, 表型变异解释率为3.332%~4.233%; 有14个位点(NAU3100b、NAU2016b、NAU2016a、CIR280、NAU1375b、NAU1156a、NAU3016a、NAU1156b、JESPR065b、HAU1434b、HAU2147b、NAU3100a、NAU1028a、BNL3976b)同时与衣分相关联, 表型变异解释率为3.049%~4.739%; 马克隆值作为衡量纤维品质的一个重要指标, 也关联到3个显著性位点(NAU5499a、NAU6104、JESPR065b), 变异解释率为3.592%~ 3.838%; 果枝始节高关联到5个显著性位点(NAU3948b、NAU3948a、HAU1355a、NAU3308b、NAU3522a), 其表型变异解释率为3.208%~7.218%。对于遗传力较高的籽指与衣指, 未检测到显著性的位点。对于第一果枝节位、果枝数、单株有效铃数、空果枝数等11个低广义遗传率的性状一共关联到42个显著性位点。Table 3
表3
表3表型性状抗旱系数与标记关联分析结果
Table 3
| 表型 Trait | 标记 Marker | P | R2 | 性状 Trait | 标记 Marker | P | R2 |
|---|---|---|---|---|---|---|---|
| 纤维比强度 FS | NAU2152b | 0 | 5.425 | 株高 PH | CIR280 | 0 | 6.320 |
| NAU2152a | 0.001 | 4.785 | NAU3377c | 0.003 | 4.327 | ||
| JESPR181 | 0.004 | 3.683 | CIR246b | 0.003 | 4.520 | ||
| NAU859a | 0.005 | 3.707 | NAU4926c | 0.005 | 3.879 | ||
| NAU3589b | 0.007 | 3.167 | NAU3881a | 0.006 | 3.616 | ||
| NAU3529a | 0.008 | 3.045 | NAU859b | 0.007 | 3.741 | ||
| NAU1362c | 0.009 | 3.020 | NAU3995a | 0.009 | 3.327 | ||
| 上半部纤维长度 FUHML | NAU1042b | 0.004 | 4.233 | 第一果枝节位 FFSBN | NAU911c | 0.001 | 4.894 |
| NAU797a | 0.007 | 3.628 | JESPR153c | 0.002 | 4.486 | ||
| HAU1355c | 0.005 | 3.704 | NAU1274b | 0.004 | 3.951 | ||
| NAU5260b | 0.006 | 3.716 | NAU6109b | 0.006 | 3.608 | ||
| NAU3277a | 0.008 | 3.332 | BNL1122a | 0.006 | 3.526 | ||
| NAU2274a | 0.008 | 3.331 | |||||
| 衣分 LP | NAU3100b | 0.002 | 4.379 | NAU1375b | 0.010 | 3.201 | |
| NAU2016b | 0.002 | 4.232 | |||||
| NAU2016a | 0.003 | 4.137 | 果枝数 | NAU3522b | 0.002 | 4.754 | |
| CIR280 | 0.003 | 3.983 | NAU3522a | 0.003 | 4.152 | ||
| NAU1375b | 0.005 | 3.672 | NAU3031b | 0.004 | 4.017 | ||
| NAU1156a | 0.006 | 3.523 | BNL1122a | 0.007 | 3.461 | ||
| NAU3016a | 0.008 | 3.292 | |||||
| NAU1156b | 0.008 | 3.262 | 空果枝 EFSBN | NAU5189a | 0.001 | 4.684 | |
| JESPR065b | 0.008 | 3.239 | NAU1167a | 0.003 | 3.931 | ||
| HAU1434b | 0.008 | 3.229 | NAU4926b | 0.006 | 3.564 | ||
| HAU2147b | 0.008 | 3.171 | |||||
| NAU3100a | 0.009 | 3.140 | 理论籽棉产量 TSCY | NAU4073a | 0.004 | 3.913 | |
| BNL3976b | 0.010 | 3.071 | NAU2016a | 0.009 | 3.269 | ||
| NAU1028a | 0.010 | 3.049 | |||||
| 单株有效铃数 EBN | NAU4926b | 0.006 | 3.653 | ||||
| 马克隆值 MV | NAU5499a | 0.004 | 3.838 | NAU2078b | 0.008 | 3.325 | |
| NAU6104 | 0.005 | 3.595 | |||||
| JESPR065b | 0.005 | 3.592 | 单铃重 BW | NAU6104 | 0 | 5.791 | |
| NAU1156b | 0.003 | 4.174 | |||||
| 果枝始节高 FFSH | NAU3948b | 0 | 7.218 | NAU1156a | 0.005 | 3.827 | |
| NAU3948a | 0.001 | 4.854 | NAU478b | 0.007 | 3.439 | ||
| HAU1355a | 0.002 | 4.758 | NAU478a | 0.009 | 3.200 | ||
| NAU3308b | 0.008 | 3.337 | |||||
| NAU3522a | 0.009 | 3.208 | 纤维伸长率 FE | BNL3875b | 0.003 | 3.880 | |
| CIR183b | 0.003 | 3.755 | |||||
| 外围铃数 PBN | NAU6104 | 0.003 | 4.151 | NAU5428b | 0.004 | 4.076 | |
| NAU1028a | 0.004 | 3.965 | JESPR181 | 0.004 | 3.613 | ||
| NAU5428b | 0.005 | 3.950 | NAU2317a | 0.006 | 3.258 | ||
| NAU3377a | 0.007 | 3.170 | |||||
| 生育期GP | JESPR065b | 0.004 | 4.058 | NAU5005b | 0.009 | 2.931 | |
| NAU4926c | 0.010 | 2.970 |
新窗口打开|下载CSV
有多种性状同时与同一标记相关联, 由表4可知, 共发现13个标记在2种及2种以上性状同时检测到, 例如标记JESPR181能被纤维比强度、纤维伸长率和外围铃数3个性状同时检测到, 标记JESPR065b同时与性状生育期、马克隆值、衣分相关联。
Table 4
表4
表4多效应标记位点
Table 4
| 标记 Marker | 染色体 Chromosome | 位置 Position (bp) | 性状 Trait |
|---|---|---|---|
| NAU6104 | A03 | 1,350,357 | 马克隆值MV, 单铃重BW, 外围铃数 PBN |
| NAU1156a | A05 | 21,325,479 | 单铃重 BW, 衣分 LP |
| JESPR065b | A05 | 98,149,579 | 生育期 GP, 马克隆值 MV, 衣分 LP |
| CIR280 | A06 | 6,580,622 | 株高 PH, 衣分 LP |
| HAU1355 | A06 | 8,067,852 | 果枝始节高 FFSH, 上半部纤维长度 FUHML |
| NAU859 | A09 | 53,596,735 | 纤维比强度 FS, 株高 PH |
| NAU3377c | D11 | 379,087 | 纤维伸长率 FE, 株高 PH |
| NAU5428b | A11 | 119,324,448 | 纤维伸长率 FE, 外围铃数 PBN |
| NAU3522a | A12 | 106,203,559 | 果枝数 FSBN, 果枝始节高 FFSH |
| JESPR181 | D05 | 10,325,076 | 纤维比强度 FS, 纤维伸长率 FE |
| BNL1122a | D07 | 30,098,941 | 第一果枝节位 FFSBN, 果枝数 FSBN |
| NAU1375b | D09 | 9,223,243 | 衣分 LP, 第一果枝节位 FFSBN |
| NAU4926c | D12 | 5,980,182 | 株高 PH, 纤维伸长率 FE |
| NAU4926b | D12 | 5,980,182 | 空果枝数 EFSBN, 单株有效铃数 EBN |
新窗口打开|下载CSV
3 讨论
3.1 表型数据分析
在关联分析中, 表型确定最关键, 良好地表型数据有利于关联分析的准确性, 特别是对于抗旱性这一数量性状, 表型数据更是起决定性作用[7]。目前在植物抗旱领域研究中, 尤其是大田抗旱性的研究, 如何减少环境因素的影响, 获取准确有效的表型数据一直是个难题。本研究中我们在棉花生育期同步获取新疆石河子和库尔勒两地气象数据(附图1), 两地的月均温在不同年份差异不大, 在棉花全生育期降雨量上存在一定差异(石河子2016: 174.000 mm; 石河子2017: 127.300 mm; 库尔勒2016: 136.600 mm; 库尔勒2017: 70.800 mm), 但新疆地区属于干旱少雨地区, 且日蒸发量较高[37,38], 降雨对试验的影响较小, 且研究中我们对多种表型数据进行了精准测定, 在后期分析前也对数据进行人工矫正, 剔除了由于操作失误等原因造成的误差, 而且在最终的表型数据处理上采用最佳线性无偏预测来综合多年多点的表型值进一步降低环境因素的影响, 结果也表明, 有些性状的广义遗传力较高, 年度间重复性较好。我们对18种表型数据进行了人工采集及统计分析, 但在植物生长发育过程中存在很多人工无法获取和采集的信息, 研究开发更多表型的获取方式, 比如搭建高通量表型组自动分析平台, 通过使用数字成像和近红外光谱等技术自动无损的获得植物对干旱胁迫反应的准确表型数据, 是解决表型鉴定困难的重要途径[7]。由于近年气候变暖, 年降雨量少, 水资源缺乏, 新疆的干旱问题愈发严重。棉花的产量、纤维品质等性状是基因型和环境因素的共同作用[39,40,41]。干旱胁迫会影响棉花的整个生长发育过程。在本研究中, 株高受到干旱胁迫的显著影响, 变异系数从正常情况下的5.353%扩大到7.496%; 而重要机采指标果枝始节高则在正常与干旱情况下均表现较高的变异(CVc=10.924%; CVd=10.963%), 表明该群体本身在这一性状具有较高的变异。尽管生育期与纤维伸长率的变异系数都小于2%。但是这2项指标仍受到干旱胁迫的严重影响(P<0.01)。而果枝数、铃重、籽指和纤维整齐度4种性状受干旱胁迫的影响不显著(P>0.01)。此外, 本研究表明, 纤维品质性状(上半部纤维长度、纤维整齐度、马克隆值、纤维比强度、纤维伸长率)在多年不同条件下表现出较高的遗传力, 这与前人的研究结果相似[10,42]。而且采用HFT9000棉花纤维测定仪测定纤维品质, 避免了人工测定误差, 更具有可靠性以及准确性。
3.2 关联分析
传统育种方法主要依赖于育种家对植株表型的选择, 育种周期长, 效率低; 棉花抗旱性受微效多基因控制, 极易受环境影响, 因此借助分子标记从而找到与抗旱性状紧密连锁的位点, 并应用到育种实践中, 可加快育种进程。Zheng等[43]通过对F2:3群体苗期耐旱性状的定位, 共鉴定到16个重要的QTL, 包括5个与株高相关、1个与叶数相关、3个与叶绿素相关、3个丙二醛相关和4个脯氨酸相关。Li等[42]通过对517份陆地棉种质资源进行重测序, 确定了与抗旱系数相关的33个QTL以及与综合抗旱指数关联的6个QTL, 并进一步结合RNA-seq的数据确定6个候选基因。本研究利用多年多环境的表型数据进行关联分析, 在P<0.01的显著性阈值下共检测到76个显著性位点, 各位点对表型变异的解释率为 2.931%~7.218%。将18个性状关联到的QTL数量与变异系数、遗传力等的综合分析发现, 株高、单株有效铃数、衣分, 上半部纤维长度、马克隆值、纤维比强度及纤维伸长率等7个指标遗传力较高, 受到干旱胁迫的显著影响(P<0.01), 并且关联到QTL的数量占总体的70%, 因此我们认为, 在以后的抗旱性研究中应对这几个性状重点关注。为了筛选出对分子标记辅助选择育种有用的QTL位点, 本研究将GWAS鉴定到的QTL与前人报道的QTL进行比较, 并通过软件e-PCR锚定到参考基因组发现, 纤维比强度、纤维伸长率、衣分和株高这4个性状所关联到的QTL在前人研究中有报道。在这4个性状中, 与纤维比强度相关的标记为NAU2152b, 该标记位点和已报道的QTL q-FS-c11-2及q-FS-A11-1a十分接近, P值为4.510×10⁻⁴, 表型变异解释率为5.425%; 与纤维伸长率相关联的标记CIR183b, P值为0.003, 表型变异解释率为3.755%, 该标记位点与已报道QTL q-FEc22-2及qFE-c22-1距离相近; 与衣分相关的标记JESPR065b被发现与已报道QTL qLP-A5的位置相近, 该标记位点P值为0.008, 表型变异解释率为3.239%; 发现与株高相关的标记CIR246附近有4个已报道的QTL, 分别是qPH-D2-2、qPH-14(F2:3)、PH8.w、PH2.y, 该标记位点表型变异解释率为4.520% [34,35,36]。这4个SSR标记在棉花中控制重要的农艺性状, 还可能参与棉花干旱逆境的响应, 是作为分子标记辅助选择育种的潜在基因位点。本研究也为有效解决育种进展缓慢以及育种进程中优异基因丢失提供参考依据。
3.3 QTL的一因多效性
本研究出现QTL的一因多效性也值得关注, 在之前的研究中就出现了在植物同一染色体区段的QTL可能控制不同条件下的同一表型的相关报道。Frova等[44]发现, 在水分胁迫条件下玉米2号染色体上m28标记同时在穗长、穗重、穗粒重、穗粒数等性状中被检测到, m66也在穗重、穗粒重、穗粒数等性状下被检测到。吴迷等[45]发现, InDel标记HAU_ID_D07-09同时与5个性状(上半部纤维长度、纤维比强度、纤维伸长率、纤维整齐度、短纤维率)相关联, 以及标记HAU_ID_D12-10同时与4个性状(上半部纤维长度、纤维比强度、纤维整齐度、短纤维率)相关联。本研究中也检测到13个多效性标记, 推其原因, 多效性可能是因为这些性状相关性较高, 且由同一QTL所控制。4 结论
217份陆地棉资源群体被分为2个群体, 在P<0.01的显著性阈值下共关联到76个与干旱相关的位点, 表型变异解释率范围为2.931%~7.218%, 其中广义遗传率较高的纤维比强度关联到7个与干旱相关的标记位点; 上半部纤维长度检测到5个与干旱相关的标记位点; 衣分也关联到14个与干旱相关的标记位点。这些位点可为棉花抗旱遗传改良提供理论基础, 并用于后期棉花抗旱性状的分子标记辅助选择育种。附图和附表 请见网络版: 1) 本刊网站
参考文献 原文顺序
文献年度倒序
文中引用次数倒序
被引期刊影响因子
[本文引用: 1]
DOI:10.1093/jxb/erl212URLPMID:17122406 [本文引用: 1]

'Drought' has many meanings in relation to crop production. These range from: statistical (say, the lowest decile of annual rainfall) to a meteorologist; through yield being limited by too little water to an agronomist; to sudden severe water deficits to many molecular biologists. To a farmer, the corresponding management issues, respectively, are risk management (how best to manage a meteorologically drought-prone farm over several years), how best to match cultivar and agronomic operations to the developing growing season, and how best to minimize possible major damage to (say) floral fertility induced by severe water deficits during flowering. All these definitions and the issues they imply are relevant to improving crop production when water is limiting. How can scientists best help? The answers depend on the scales (temporal and spatial) being addressed. Agronomists and breeders, interacting, can help improve components of seasonal water balance in the field, for example, minimizing evaporative losses from the soil surface by better matching the development of a crop to its environment. Physiologists, biochemists, and molecular biologists can help by identifying ways of improving the competence of particular organs. A promising target is floral infertility resulting from water deficits, which results from lesions in tissue, and cellular and molecular processes. Choosing problems whose solutions will have implications in the field and be attractive to farmers requires knowledge of what is important in the field.
[本文引用: 1]
[本文引用: 1]
[本文引用: 1]
[本文引用: 1]
DOI:10.3389/fphys.2012.00347URLPMID:23049510 [本文引用: 3]
Improving crops yield under water-limited conditions is the most daunting challenge faced by breeders. To this end, accurate, relevant phenotyping plays an increasingly pivotal role for the selection of drought-resilient genotypes and, more in general, for a meaningful dissection of the quantitative genetic landscape that underscores the adaptive response of crops to drought. A major and universally recognized obstacle to a more effective translation of the results produced by drought-related studies into improved cultivars is the difficulty in properly phenotyping in a high-throughput fashion in order to identify the quantitative trait loci that govern yield and related traits across different water regimes. This review provides basic principles and a broad set of references useful for the management of phenotyping practices for the study and genetic dissection of drought tolerance and, ultimately, for the release of drought-tolerant cultivars.
[本文引用: 2]
[本文引用: 2]
[本文引用: 1]
DOI:10.3389/fpls.2018.01276URLPMID:30233620 [本文引用: 3]
Cotton is an important industrial crop worldwide and upland cotton (Gossypium hirsutum L.) is most widely cultivated in the world. Due to ever-increasing water deficit, drought stress brings a major threat to cotton production. Thus, it is important to reveal the genetic basis under drought stress and develop drought tolerant cotton cultivars. To address this issue, in present study, 319 upland cotton accessions were genotyped by 55,060 single nucleotide polymorphisms (SNPs) from high-density CottonSNP80K array and phenotyped nine drought tolerance related traits. The two datasets were used to identify quantitative trait nucleotides (QTNs) for the above nine traits using multi-locus random-SNP-effect mixed linear model method. As a result, a total of 20 QTNs distributed on 16 chromosomes were found to be significantly associated with six drought tolerance related traits. Of the 1,326 genes around the 20 QTNs, 205 were induced after drought stress treatment, and 46 were further mapped to Gene ontology (GO) term
[本文引用: 2]
[本文引用: 1]
[本文引用: 1]
[本文引用: 1]
[本文引用: 1]
[本文引用: 1]
[本文引用: 1]
[本文引用: 1]
[本文引用: 1]
[本文引用: 1]
[本文引用: 1]
[本文引用: 1]
[本文引用: 1]
[本文引用: 1]
[本文引用: 1]
[本文引用: 1]
[本文引用: 1]
[本文引用: 1]
[本文引用: 1]
[本文引用: 1]
[本文引用: 1]
[本文引用: 1]
DOI:10.1111/j.1755-0998.2009.02591.xURLPMID:21564903 [本文引用: 1]
Genetic clustering algorithms require a certain amount of data to produce informative results. In the common situation that individuals are sampled at several locations, we show how sample group information can be used to achieve better results when the amount of data is limited. New models are developed for the structure program, both for the cases of admixture and no admixture. These models work by modifying the prior distribution for each individual's population assignment. The new prior distributions allow the proportion of individuals assigned to a particular cluster to vary by location. The models are tested on simulated data, and illustrated using microsatellite data from the CEPH Human Genome Diversity Panel. We demonstrate that the new models allow structure to be detected at lower levels of divergence, or with less data, than the original structure models or principal components methods, and that they are not biased towards detecting structure when it is not present. These models are implemented in a new version of structure which is freely available online at http://pritch.bsd.uchicago.edu/structure.html.
[本文引用: 1]
URLPMID:15969739 [本文引用: 1]
[本文引用: 1]
[本文引用: 1]
URLPMID:19067183 [本文引用: 1]
DOI:10.1101/gr.7.5.541URLPMID:9149949 [本文引用: 1]
The highly specific and sensitive PCR provides the basis for sequence-tagged sites (STSs), unique landmarks that have been used widely in the construction of genetic and physical maps of the human genome. Electronic PCR (e-PCR) refers to the process of recovering these unique sites in DNA sequences by searching for subsequences that closely match the PCR primers and have the correct order, orientation, and spacing that they could plausibly prime the amplification of a PCR product of the correct molecular weight. A software tool was developed to provide an efficient implementation of this search strategy and allow the sort of en masse searching that is required for modern genome analysis. Some sample searches were performed to demonstrate a number of factors that can affect the likelihood of obtaining a match. Analysis of one large sequence database record revealed the presence of several microsatellite and gene-based markers and allowed the exact base-pair distances among them to be calculated. This example provides a demonstration of how e-PCR can be used to integrate the growing body of genomic sequence data with existing maps, reveal relationships among markers that existed previously on different maps, and correlate genetic distances with physical distances.
DOI:10.1038/s41588-018-0282-xURLPMID:30510239 [本文引用: 1]
Allotetraploid cotton species (Gossypium hirsutum and Gossypium barbadense) have long been cultivated worldwide for natural renewable textile fibers. The draft genome sequences of both species are available but they are highly fragmented and incomplete(1-4). Here we report reference-grade genome assemblies and annotations for G. hirsutum accession Texas Marker-1 (TM-1) and G. barbadense accession 3-79 by integrating single-molecule real-time sequencing, BioNano optical mapping and high-throughput chromosome conformation capture techniques. Compared with previous assembled draft genomes(1,3), these genome sequences show considerable improvements in contiguity and completeness for regions with high content of repeats such as centromeres. Comparative genomics analyses identify extensive structural variations that probably occurred after polyploidization, highlighted by large paracentric/pericentric inversions in 14 chromosomes. We constructed an introgression line population to introduce favorable chromosome segments from G. barbadense to G. hirsutum, allowing us to identify 13 quantitative trait loci associated with superior fiber quality. These resources will accelerate evolutionary and functional genomic studies in cotton and inform future breeding programs for fiber improvement.
DOI:10.1007/s00438-015-1021-yURLPMID:25758743 [本文引用: 2]
KEY MESSAGE: A specialized database currently containing more than 2200 QTL is established, which allows graphic presentation, visualization and submission of QTL. In cotton quantitative trait loci (QTL), studies are focused on intraspecific Gossypium hirsutum and interspecific G. hirsutum x G. barbadense populations. These two populations are commercially important for the textile industry and are evaluated for fiber quality, yield, seed quality, resistance, physiological, and morphological trait QTL. With meta-analysis data based on the vast amount of QTL studies in cotton it will be beneficial to organize the data into a functional database for the cotton community. Here we provide a tool for cotton researchers to visualize previously identified QTL and submit their own QTL to the Cotton QTLdb database. The database provides the user with the option of selecting various QTL trait types from either the G. hirsutum or G. hirsutum x G. barbadense populations. Based on the user's QTL trait selection, graphical representations of chromosomes of the population selected are displayed in publication ready images. The database also provides users with trait information on QTL, LOD scores, and explained phenotypic variances for all QTL selected. The CottonQTLdb database provides cotton geneticist and breeders with statistical data on cotton QTL previously identified and provides a visualization tool to view QTL positions on chromosomes. Currently the database (Release 1) contains 2274 QTLs, and succeeding QTL studies will be updated regularly by the curators and members of the cotton community that contribute their data to keep the database current. The database is accessible from http://www.cottonqtldb.org.
DOI:10.1186/1471-2164-14-776URLPMID:24215677 [本文引用: 2]
BACKGROUND: The study of quantitative trait loci (QTL) in cotton (Gossypium spp.) is focused on traits of agricultural significance. Previous studies have identified a plethora of QTL attributed to fiber quality, disease and pest resistance, branch number, seed quality and yield and yield related traits, drought tolerance, and morphological traits. However, results among these studies differed due to the use of different genetic populations, markers and marker densities, and testing environments. Since two previous meta-QTL analyses were performed on fiber traits, a number of papers on QTL mapping of fiber quality, yield traits, morphological traits, and disease resistance have been published. To obtain a better insight into the genome-wide distribution of QTL and to identify consistent QTL for marker assisted breeding in cotton, an updated comparative QTL analysis is needed. RESULTS: In this study, a total of 1,223 QTL from 42 different QTL studies in Gossypium were surveyed and mapped using Biomercator V3 based on the Gossypium consensus map from the Cotton Marker Database. A meta-analysis was first performed using manual inference and confirmed by Biomercator V3 to identify possible QTL clusters and hotspots. QTL clusters are composed of QTL of various traits which are concentrated in a specific region on a chromosome, whereas hotspots are composed of only one trait type. QTL were not evenly distributed along the cotton genome and were concentrated in specific regions on each chromosome. QTL hotspots for fiber quality traits were found in the same regions as the clusters, indicating that clusters may also form hotspots. CONCLUSIONS: Putative QTL clusters were identified via meta-analysis and will be useful for breeding programs and future studies involving Gossypium QTL. The presence of QTL clusters and hotspots indicates consensus regions across cultivated tetraploid Gossypium species, environments, and populations which contain large numbers of QTL, and in some cases multiple QTL associated with the same trait termed a hotspot. This study combines two previous meta-analysis studies and adds all other currently available QTL studies, making it the most comprehensive meta-analysis study in cotton to date.
DOI:10.1007/s00438-014-0963-9URLPMID:25501533 [本文引用: 2]
KEY MESSAGE: Based on 1075 and 1059 QTL from intraspecific Upland and interspecific Upland x Pima populations, respectively, the identification of QTL clusters and hotspots provides a useful resource for cotton breeding. Mapping of quantitative trait loci (QTL) is a pre-requisite of marker-assisted selection for crop yield and quality. Recent meta-analysis of QTL in tetraploid cotton (Gossypium spp.) has identified regions of the genome with high concentrations of QTL for various traits called clusters and specific trait QTL called hotspots or meta-QTL (mQTL). However, the meta-analysis included all population types of Gossypium mixing both intraspecific G. hirsutum and interspecific G. hirsutum x G. barbadense populations. This study used 1,075 QTL from 58 publications on intraspecific G. hirsutum and 1,059 QTL from 30 publications on G. hirsutum x G. barbadense populations to perform a comprehensive comparative analysis of QTL clusters and hotspots between the two populations for yield, fiber and seed quality, and biotic and abiotic stress tolerance. QTL hotspots were further analyzed for mQTL within the hotspots using Biomercator V3 software. The ratio of QTL between the two population types was proportional yet differences in hotspot type and placement were observed between the two population types. However, on some chromosomes QTL clusters and hotspots were similar between the two populations. This shows that there are some universal QTL regions in the cultivated tetraploid cotton which remain consistent and some regions which differ between population types. This study for the first time elucidates the similarities and differences in QTL clusters and hotspots between intraspecific and interspecific populations, providing an important resource to cotton breeding programs in marker-assisted selection .
[本文引用: 1]
[本文引用: 1]
[本文引用: 1]
[本文引用: 1]
DOI:10.1007/s00122-002-1025-yURLPMID:12589538 [本文引用: 1]
Cotton is unusual among major crops in that large acreages are grown under both irrigated and rainfed conditions, making genotype x environment interactions of even greater importance than usual in designing crop-improvement strategies. We describe the impact of well-watered versus water-limited growth conditions on the genetic control of fiber quality, a complex suite of traits that collectively determine the utility of cotton. Fiber length, length uniformity, elongation, strength, fineness, and color (yellowness) were influenced by 6, 7, 9, 21, 25 and 11 QTLs (respectively) that could be detected in one or more treatments. The genetic control of cotton fiber quality was markedly affected both by general differences between growing seasons (
[本文引用: 1]
[本文引用: 1]
[本文引用: 2]
[本文引用: 1]
[本文引用: 1]
[本文引用: 1]
[本文引用: 1]
