 ,2,4,*, 詹克慧,1,*
Fine mapping and candidate gene analysis of awn inhibiting gene B2 in common wheat
JIN Di1,*, WANG Dong-Zhi2,*, WANG Huan-Xue3, LI Run-Zhi3, CHEN Shu-Lin1, YANG Wen-Long2, ZHANG Ai-Min2, LIU Dong-Cheng,2,4,*, ZHAN Ke-Hui,1,*通讯作者:
收稿日期:2018-12-19接受日期:2019-01-19网络出版日期:2019-03-12
| 基金资助: |
Received:2018-12-19Accepted:2019-01-19Online:2019-03-12
| Fund supported: |
作者简介 About authors
金迪,E-mail:
王冬至,E-mail:

摘要
关键词:
Abstract
Keywords:
PDF (6260KB)元数据多维度评价相关文章导出EndNote|Ris|Bibtex收藏本文
本文引用格式
金迪, 王冬至, 王焕雪, 李润枝, 陈树林, 阳文龙, 张爱民, 刘冬成, 詹克慧. 小麦芒长抑制基因B2的精细定位与候选基因分析[J]. 作物学报, 2019, 45(6): 807-817. doi:10.3724/SP.J.1006.2019.81090
JIN Di, WANG Dong-Zhi, WANG Huan-Xue, LI Run-Zhi, CHEN Shu-Lin, YANG Wen-Long, ZHANG Ai-Min, LIU Dong-Cheng, ZHAN Ke-Hui.
芒是小麦穗器官的重要组成部分, 由小花外稃的末端延伸形成, 属于叶的变态, 是植物长期进化与适应环境的结果。一般有长芒、无芒、半芒和顶芒之分, 芒在麦穗上的分布情况可以概括为芒长均匀分布、从顶部到基部逐渐变短的倒塔形分布与中上部最长而顶部和基部较短的钟形分布等类型[1]。小麦品种之间芒的差异如芒的有无、形状、长短及颜色是非常容易识别的特性, 可以作为区分不同小麦品种以及基因定位的重要形态标记[2,3,4,5]。
小麦芒的横切面呈锐角三角形, 3个角上斜生着许多刺毛, 远轴端两侧表皮中部具有带状分布的气孔, 气孔带下方是绿色组织, 富含叶绿体与线粒体, 叶绿体沿壁排列, 而近轴端没有气孔和绿色组织[6]。从芒中分离出来的叶绿体能进行光合作用, 尤其是在小麦籽粒灌浆后期, 旗叶开始衰老光合能力下降时, 芒仍保持较高的光合速率, 其光合产物成为小麦籽粒同化物来源的重要补充[7]。芒的光合作用产物就近向籽粒运输, 14C同位素标记证实芒的同化产物99%运入着生该芒的小穗[8], 包括芒在内的小麦穗部光合对籽粒干重的贡献依据环境条件不同约为10%~44%[9,10,11,12]。在干旱少水条件下, 叶片与芒的蒸腾作用均会减弱, 叶片光合速率亦相应降低, 而芒光合速率能保持相对稳定。因此, 在干旱条件下, 有芒小麦可比无芒小麦增产15%~30%[13]。此外, 芒刺及芒的机械特性, 使得芒在减少收获前种子损失[12]、促进小麦的传播与进化方面起着重要作用[14]。
影响芒长度的基因较多, 目前在1B、2A、2D、3B、4A、5A、6B、7D等染色体上均发现与芒长相关的位点[4,15-17], 其中B1、B2、B3、A和Hd 5个基因在芒的发育过程中发挥主要作用, Hd是产生钩芒的基因, A基因促进芒的伸长, 而B1、B2和B3抑制芒的伸长, 且B1的抑制作用最强, B2次之, B3的抑制作用最弱[6,15,18]。Hd的芒缩短成钩状, 基部特征性弯曲, 通常自身弯曲成闭合螺旋, 有时会出现芒基部膨大成膜状[15,18]; B1会造成穗基部和中部极短的芒或无芒, 顶端约1/4处芒长增加, 最长可达到1 cm, 这些芒一般基部不弯曲故呈竖直状[15,18]; B2基因型会造成整个穗部的短芒, 通常麦穗各部位的芒长基本没有差异, 偶尔出现穗中部芒较长的现象, 但芒长度大多在6 mm以下, 偶有弯曲[15,18]。芒长控制基因均遵循孟德尔遗传定律, 其不同等位基因的不同组合产生了芒的不同类型[15], 如携有纯合3个隐性等位基因hd、b1和b2的小麦表现为长芒, 而基因型为Hd B2 (如中国春)、B1 B2 (如Federation)则表现为完全无芒[15]。
在禾本科作物中, 已有多个控制芒性状的基因被克隆, 如水稻An-1[19]、An-2/LABA1[20,21]、DL[22]、GAD1/RAE2[23,24]和大麦Lks2[25]、Hooded[26]及ROUGH AWN1[27]等。在小麦中, Hd、B1和B2在染色体上的位置已经通过中国春单体系统、中国春染色体片段缺失系、全基因组关联分析、QTL等手段进行了定位, Hd位于4A染色体短臂[1,15,18], B1位于5A染色体长臂[3-5,15-18,28], B2位于6B染色体长臂[15,17-18,29], 然而到目前为止, 小麦中尚无有关控制芒性状的基因被克隆的报道。本研究对小麦短芒材料‘六柱头’的芒长发育及芒长抑制基因的遗传进行探讨, 旨在精细定位其基因位点, 分析其候选基因的序列和表达谱, 为该基因的克隆及功能分析奠定基础。
1 材料与方法
1.1 供试材料及遗传群体的构建
试验材料为‘六柱头’、‘石矮1号’及其配制的遗传分离群体(简称SL)。‘六柱头’是中国小麦微核心种质资源, 生物学形态表现: 较高株高, 短芒, 整穗各部分芒长均不超过0.5 cm; ‘石矮1号’为河北石家庄农林科学研究院与河北省小麦工程技术研究中心利用花药组织培养育种方法创制的小麦矮秆新种质, 穗部遍布长芒, 芒长度超过5 cm。利用‘六柱头’和‘石矮1号’杂交获得F1, 自交获得的F2群体(SL-F2)用于基因定位, 部分F2单株自交得到F2:3家系, 以鉴定F2单株基因型和进行芒的细胞学观察。分别于2016—2017年和2017—2018年在河南农业大学郑州科教园区种植F2群体和F2:3家系。1.2 芯片分型
利用植物基因组DNA提取试剂盒(天根生化科技有限公司, 北京, DP305)提取F2单株幼苗叶片DNA, 根据F2:3家系的芒性状分离情况对F2单株进行选择, 分别将短芒纯合、短芒杂合与长芒材料各15株的DNA等量混合, 构建显性混合池、杂合混合池和隐性混合池, 利用Wheat660 SNP芯片进行全基因组SNP分型检测(北京博奥晶典生物技术有限公司)。将SNP侧翼序列进行BLAST中国春参考基因组(IWGSC.Ref.V1.0)[30], 参考SNP标记的遗传图谱及遗传位置信息(中国农业科学研究院作物科学研究所赵光耀研究员提供), 获得SNP在中国春参考基因组上的物理位置信息。利用Microsoft Excel进行混合池之间差异SNP的筛选与染色体分布统计。1.3 标记开发与遗传图谱构建
采用CTAB法提取SL-F2群体叶片DNA [31], 利用SSRLocator软件[32]及内置的Primer 3程序进行SSR搜索与引物设计, 参考Li等[33]采用CAPS/ dCAPS Designer基于Wheat660K SNP芯片开发的标记进行修改完成CAPS和dCPAS标记的开发, 所用标记的信息如表1所示, 所有引物均由北京博迈德基因技术有限公司合成。PCR扩增体系总体积为20 μL, 包括50 ng模板DNA, 0.2 μmol L-1引物和1×Taq MasterMix (江苏康为世纪生物科技有限公司, CW0682L, 包含0.2 mmol L-1 dNTPs、0.15 mmol L-1 MgCl2和1 U Taq DNA聚合酶)。PCR扩增采用94℃预变性5 min, 然后按照94℃变性30 s, 55℃退火30 s (对于个别引物需根据具体情况调节退火温度), 72℃延伸30 s (对于EST标记, 延伸时间延长至2 min)的条件进行35个循环, 最后72℃延伸10 min。SSR标记在PCR扩增后直接进行电泳, CAPS标记、dCAPS标记及EST标记在PCR扩增后采用相应的限制性内切酶酶切后电泳检测。限制性内切酶(美国NEB公司, 购自生工生物工程(上海)股份有限公司)的酶切反应按照相应说明书进行。对于SSR标记PCR扩增产物和dCAPS标记的酶切产物, 用8%非变性聚丙烯酰胺凝胶电泳进行分离, 而CAPS标记与EST标记的PCR产物和酶切产物用2%琼脂糖凝胶电泳分离检测。Table 1
表1
表1本研究所用到的引物
Table 1
| 引物名称 Primer ID | 正向引物序列 Forward sequence (5'-3') | 反向引物序列 Reverse sequence (5'-3') | 内切酶 Restriction enzyme | 片段大小 Size (bp) |
|---|---|---|---|---|
| B2精细定位 Markers for mapping B2 | ||||
| Xgwm88 * | CACTACAACTATGCGCTCGC | TCCATTGGCTTCTCTCTCAA | — | 120 |
| SSR43 | ACTATCACAAGCCGGAGTAA | AGTGGTTAAATCGCCACTAA | — | 172 |
| SSR122 | CATGTTACCACCAAAGGATT | CTATGTGGCTGACCGTTACT | — | 205 |
| EST-499300LC | TCCAAAGAATCCTGGAGGTG | TGTTCTGACCATCCCACGTA | Pvu II | 393/270 |
| dCAPS-18 | GACCACCCGACACCGCCGCTGCA | GCTCATCTCCAATAGCTCGC | Pst I | 204/184 |
| dCAPS-19 | CAAAACTTCTTGGGAGAATATAC | CCCTGACATCGTCTCGAACT | Mlu I | 192/172 |
| dCAPS-4 | GTAAGCAGCGAGGTTAGCACTGC | CTGGTGCTCATGAGTTGTGG | Pst I | 296/276 |
| EST-263300 | CGTGTGCTTAAATGCTCCATGG | GCTGACTTATGCTGCTTTACTTTCTAA | Taq I | 521/472 |
| CAPS-12 | ATTGATGCAAAGGAACCAGG | GAGTTCCATGGCCTCATTGT | Eco RI | 308/236 |
| CAPS-14 | GGAAGGTCCACTTTGCATGT | CACCACAGGGACGAAATTCT | Bam HI | 281/265 |
| dCAPS-39 | GTTTTCTTTGTAGAAGTCCCATA | AAACACCTGAAAATCGTGGC | Nde I | 185/165 |
| EST-265400 | CCATCAGTCCAACCATGACTTGT | TAACATAAGCGTCGCTGTGGC | Pst I | 246/(111+135) |
| CAPS-19 | TGTCCTTGAAGGGGGTAGTG | TCCTGCATTATGCCACAAAA | Nde I | 483/(217+266) |
| WABM232658 * | AAGTTCGCCTCTTCACCAGT | TCTGCCCCTACATCTGTTGC | — | 130 |
| SSR74 | CATAATCACAATTCATCGGA | TTCATACCTGACCCATCTTC | — | 214 |
| SSR116 | AGAATCAGTTTTCAGCCAGA | AACTATCCCGTATACTTGCG | — | 168 |
| WABM214868 * | GGGTGCCTGAACATTGATGC | CCCCAAGTGCTGTCGTGTAT | — | 126 |
| 候选基因克隆 Gene cloning primers | ||||
| 6B01G262600 | AGCGAAGCAGTCAGTACTCAGT | CTTGCATGGATAATCGAAACATAGGA | — | 1041 |
| 6B01G263300 | CGTGTGCTTAAATGCTCCATGG | GCTGACTTATGCTGCTTTACTTTCTAA | — | 1110 |
| 6B01G264600 | GCCCATTTTTGCAGTCATGACATCA | CGGGATGAAAACCTGCTCTTC | — | 1760 |
| 6B01G265400 | CCATCAGTCCAACCATGACTTGT | TAACATAAGCGTCGCTGTGGC | — | 1071 |
| 6B01G504500LC | CACACACACACACACCAAAACTC | GGCATACTGCGAACAACCCA | — | 985 |
| 6B01G505500LC | AGCAGCTGGGTGAAGTTAACTA | TTCCAGCCCCCTTTTACAAGAT | — | 1437 |
新窗口打开|下载CSV
对SL-F2群体的标记基因型和表型用JoinMap v4.0 (Kyazma B.V.)软件[34]完成遗传图谱的构建, 采用极大似然算法进行重组率计算, 使用Kosambi作图函数进行重组率和遗传距离(cM)的转换, 用Mapchart v2.3软件[35]绘制遗传图谱。
1.4 石蜡切片
将10个短芒和5个长芒SL-F2:3株系分别种植于中国科学院遗传与发育生物学研究所植物温室(IGDB, CAS), 分别取芒长性状没有分离的显性纯合和隐性纯合单株进行芒发育的细胞学观察。对护颖分化期的幼穗(长度约0.5~1.0 cm)用FAA固定液(冰醋酸5 mL, 37%甲醛溶液5 mL, 无水乙醇50 mL, 补充双蒸水定容至100 mL)室温固定24 h, 50%乙醇洗涤3次后进行梯度乙醇(70%、80%、90%、95%和100%)脱水和二甲苯(25%、50%、75%和100%)脱色, 65℃浸蜡后使用石蜡切片机(德国徕卡, RM2235)将芒中段纵向切成4 μm厚的薄片, 番红-固绿溶液(1.0%番红, 0.5%固绿)染色后封片, NIKON CI-S生物显微镜观察和拍照。1.5 基因微共线性分析和候选基因分析
以中国春B2区间基因的CDS序列(IWGSC RefSeq v1.0 annotation), TBLASTX比对中国春参考基因组CDS数据库(IWGSC RefSeq v1.0 annotation)和矮抗58参考基因组的CDS数据库(中国农业科学研究院作物科学研究所赵光耀研究员提供), 按照一致性>80%、覆盖度>80%、比对E值<1E-10、序列长度>200 bp进行初筛, 综合比对得分、E值、Gaps和Mismatch选取比对最好的序列作为同源基因, 使用Mapchart v2.3软件[35]绘制图谱, 用InKscape软件进行调整。以中国春IWGSC.Ref.V1.0包含2000 bp启动子区域和500 bp 3°-UTR区域在内的基因序列BLASTN比对矮抗58基因组序列(中国农业科学研究院作物科学研究所赵光耀研究员提供), 获得矮抗58中的同源基因序列, 用SeqMan软件进行候选基因中国春和矮抗58基因组序列及中国春CDS序列的比对。
使用Wheat Expression Browser (http://www. wheat-expression.com/)网站进行B2区间候选基因的表达谱数据调取, 使用的数据集为“Developmental time-course of Chinese Spring”和“Developmental time-course of Azhurnaya”, 使用TBtools软件进行热图的绘制[36], 用InKscape软件进行美化调整。
2 结果与分析
2.1 ‘六柱头’的短芒主要由细胞的变短所致
为了解析SL-F2群体芒性状差异形成的发育生物学机制, 对SL-F2:3株系显性纯合和隐性纯合幼穗的芒切片进行了显微镜观察。在长芒材料(图1-A)和短芒材料(图1-B)的芒中均有维管束的存在, 短芒材料芒刺较为稀少, 但芒的解剖结构并没有大的差别。由图1可知, 长芒材料的细胞长度明显大于短芒材料, 细胞长度分别为21.49 μm和8.30 μm, 说明SL-F2群体‘六柱头’的短芒性状主要由细胞的变短所致。图1
 新窗口打开|下载原图ZIP|生成PPT
图1长芒材料(A)和短芒材料(B)芒的石蜡切片
Fig. 1Longitudinal section of middle region in long awn (A) and short awn (B)
2.2 SL-F2群体的短芒性状是由显性单基因控制
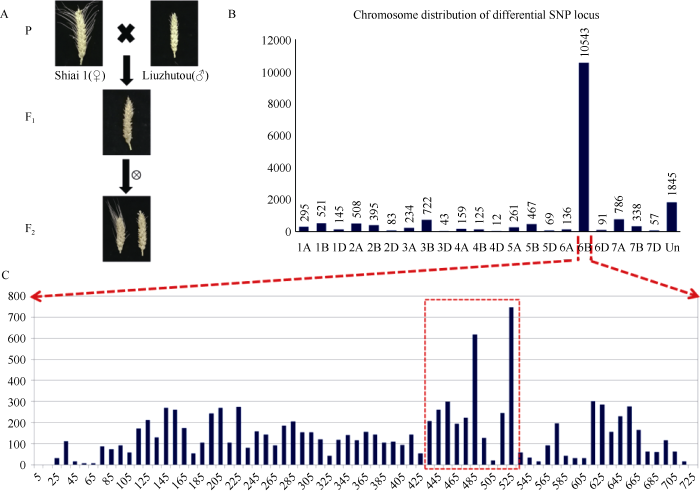
短芒亲本‘六柱头’与长芒亲本‘石矮1号’杂交, 杂种F1代全部表现为短芒, F2代(SL-F2)出现芒长的分离(图2-A), 但只有长芒、短芒2种类型而没有中间型, 长芒植株穗中部芒长均超过5 cm, 短芒植株穗中部芒长均小于0.5 cm。F2群体共统计1413株, 其中长芒350株, 短芒1063株(表2)。χ2检验表明, 短芒和长芒单株的数量符合3∶1的分离比例(P = 0.84)(表2)。说明, 在SL-F2群体中短芒对长芒为完全显性, ‘六柱头’中的短芒性状受显性单基因遗传控制。图2
 新窗口打开|下载原图ZIP|生成PPT
图2SL-F2群体的构建及Wheat660K芯片分型结果分析
(A) 群体构建和芒长表现; (B) SL-F2群体混池间差异SNP标记的染色体分布; (C) SL-F2群体混池6B染色体差异SNP标记的分布。
Fig. 2Population construction and analysis of Wheat660K SNP chip
(A) Population construction of SL-F2 and the awn character of ‘ShiAi 1’, ‘Liuzhutou’ F1 and F2; (B) The distribution of differential SNP locus on each chromosome and between bulks of SL-F2 population; (C) The distribution of differential SNP locus on chromosome 6B between bulks of SL-F2 population. Un: unknown.
2.3 芒长抑制基因B2控制SL-F2群体的芒长性状
根据短芒纯合、短芒杂合与长芒材料构建的显性混合池、杂合混合池和隐性混合池, 利用Wheat660K芯片进行全基因组SNP分型, 共得到3个混合池间差异SNP标记145,915个, 其中显性池及隐性池为纯合基因型且杂合池为杂合基因型的SNP标记有17,835个。在这17,835个差异标记中,59.11% (10,543个)位于6B染色体, 10.34% (1845个)尚未定位, 定位到其他染色体上的均不超过5% (图2-B), 由此推断控制SL-F2群体芒长性状的基因很可能位于6B染色体。对6B染色体的SNP标记以10 Mb为滑窗统计平均每Mb中含有的差异SNP标记数量, 发现在430~530 Mb差异SNP最多, 尤其以480 Mb附近及525 Mb附近最为集中(图2-C)。Table 2
表2
表2SL-F2群体的遗传分析及卡方检验结果
Table 2
| 单株数 No. of F2 plants | 观察值 Observed value | 理论值 Expected value | 理论比值 Expected ratio | χ2值 χ2-value | P值 P-value | |||
|---|---|---|---|---|---|---|---|---|
| 长芒 Long awn | 短芒 Short awn | 长芒 Long awn | 短芒 Short awn | |||||
| 1413 | 350 | 1063 | 353 | 1060 | 3:1 | 0.04 | 0.84 | |
新窗口打开|下载CSV
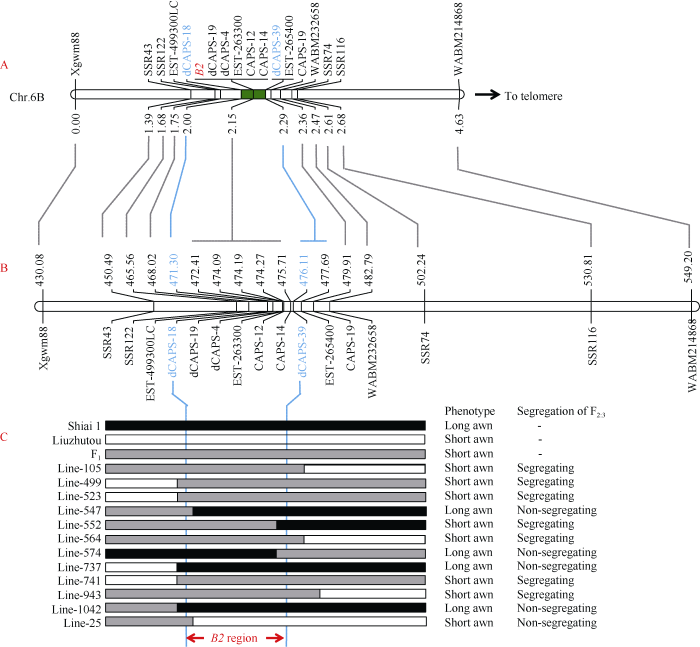
芒长抑制基因B2定位于6B染色体长臂[15,17-18,29], 与Wheat660K芯片SNP分型的富集结果一致, 因此推测SL-F2群体中控制芒长性状的基因可能就是B2基因。为了验证这一推测, 选取96个无芒单株和96个有芒单株组成SL-F2亚群体, 用前人报道[18]的B2连锁标记Xgwm88、WABM232658、WABM214868进行基因型扫描, 将表型与基因型进行遗传图谱构建, 结果表明SL-F2群体芒性控制基因被定位在Xgwm88与WABM232658之间, 标记顺序与前人报道的一 致[18]。此外, SL-F2全群体的遗传图谱构建也得到了相同的结果(图3-A)。因此, SL-F2群体中的芒性控制基因应该是前人报道的B2基因。
2.4 芒长抑制基因B2定位在4.84 Mb的物理区间内
通过引物序列比对, Xgwm88和WABM232658分别被定位到中国春参考基因组IWGSC.Ref.V1.0染色体6B的430.08 Mb和482.79 Mb附近。为了确认初步定位结果并精细定位B2基因, 在中国春参考基因组6B染色体450~451 Mb、465~466 Mb、500~505 Mb及530~531 Mb区间内用SSRLocator软件及内置的Primer 3程序进行SSR搜索与引物设计, 将亲本间及混池间存在差异的SSR标记SSR43、SSR74、SSR116和SSR122加密到遗传图谱中, 将B2定位在SSR122与WABM232658之间的0.79 cM的遗传区间(图3-A)。根据显性池、杂合池和隐性池的Wheat660K全基因组SNP分型结果, 借助前人根据Wheat660K SNP芯片开发的CAPS/dCAPS标记[33], 将3个CAPS标记CAPS12、CAPS14、CAPS19和3个dCAPS标记dCAPS4、dCAPS18、dCAPS19加密到遗传图谱。
此外, 还通过对亲本‘六柱头’、‘石矮1号’克隆基因并测序, 开发了3个EST标记EST-499300LC、EST-263300和EST-265400。最终, 这些CAPS标记、dCAPS标记和EST标记被加密到B2区段的遗传图谱中, 标记dCAPS19、dCAPS4、EST-499300LC、CAPS12及CAPS14与B2共分离, B2与标记dCAPS18和dCAPS39之间各存在2个重组事件(图3-C), 重组单株的表型通过F2:3的芒性状分离情况得到了确认。最终, B2被定位于dCAPS18和dCAPS39之间0.29 cM的遗传区间(图3-A), 对应于IWGSC.Ref.V1.0参考基因组6B染色体4.84 Mb的物理距离(图3-B, C)。
图3
 新窗口打开|下载原图ZIP|生成PPT
图3B2基因的精细定位
(A) SL-F2群体B2位点的遗传图谱; (B) SL-F2群体B2位点的物理图谱; (C) SL-F2群体关键重组体的标记基因型及子代验证表型。
Fig. 3Fine mapping of awn inhibiting gene B2
(A) The linkage map of B2 locus in SL-F2 population; (B) The physical map of B2 locus in SL-F2 population; (C) The marker genotype and progeny validation phenotype of key recombinants in SL-F2 population.
2.5 B2区间分析与候选基因预测
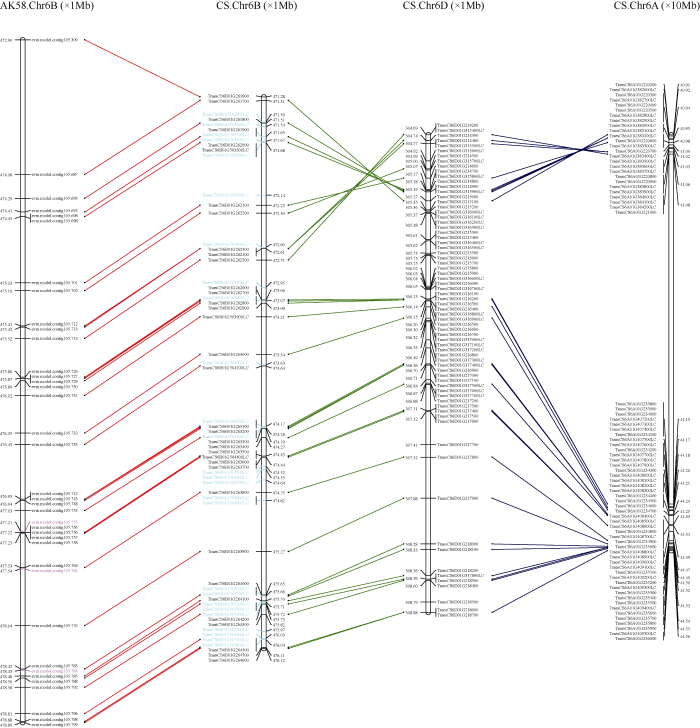
根据中国春参考基因组注释, 在B2区间内共有61个基因(图5), 其中包括30个高可信度基因和31个低可信度基因。这些基因主要为酶类(如E3泛素蛋白质连接酶、类受体激酶)、转录因子(如碱性螺旋-环-螺旋bHLH转录因子、乙烯响应转录因子)、调节蛋白(如pH响应调节蛋白、细胞壁松弛蛋白及含钙依赖脂质结合蛋白)及反转录转座子蛋白等。为了评估B2区间的序列保守程度, 对中国春B2区间基因A、B、D亚基因组同源基因及矮抗58基因组6B染色体的微共线性进行分析(图4)。中国春B2区段4.84 Mb (471.28~476.12 Mb)的物理区间对应于矮抗58中6B染色体长臂上5.99 Mb (472.90~ 478.89 Mb)的物理距离, 除位于边界的基因 evm.model.contig105.687外, 矮抗58基因组B2区间的大小为4.81 Mb, 与中国春B2区间基本一致。中国春所有高可信度基因以及4个低可信度基 因在矮抗58中存在同源基因, 其他27个低可信 度基因在矮抗58不存在基因注释, 而矮抗58 在B2区段共注释出35个基因, 除3个基因(evm.model.contig105.755、evm.model.contig105.766和evm.model.contig105.784)外均在中国春中找到同源基因, 这些基因排列顺序均一致, 表明2个基因组在B2区段的共线性关系很好(图4)。此外, B2区段在中国春A、B、D亚基因组的共线性表现为6B区段473.07~476.12 Mb在3个亚基因组间基因顺序一致, 6B区段471.28~472.71 Mb与6A染色体基因顺序一致, 而与6D染色体区段之间存在倒位, 在6A染色体上两个区段间存在这一个约40 Mb的大片段插入(图4)。
图4
 新窗口打开|下载原图ZIP|生成PPT
图4B2区段的基因微共线性分析
自左向右依次为矮抗58的6B染色体及中国春6B、6A和6D染色体; 图中标为红色和青色的基因分别表示在中国春6B和矮抗58的6B染色体中没有同源基因。
Fig. 4Micro-collinearity analysis of B2 region
From left to right are chromosome 6B of AK58, chromosomes 6B, 6A, and 6D of CS; genes in red and cyan colors indicate no homologous genes on chromosomes 6B of CS and AK58, respectively.
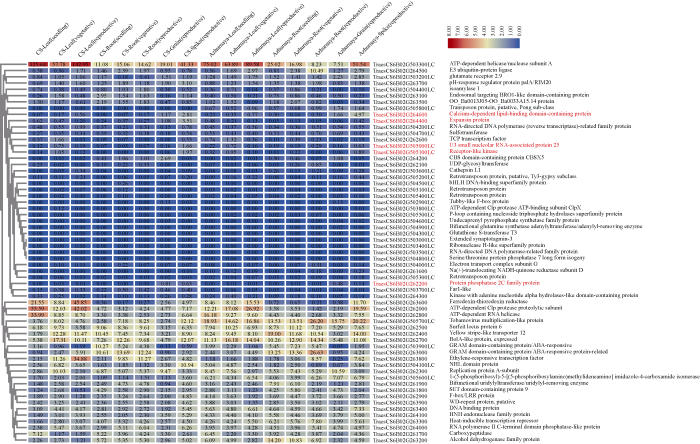
中国春含有芒长抑制基因B2[15,17-18], 而矮抗58是长芒品种, 比较这2个品种定位区段内基因序列的差别有助于确定候选基因。序列比对结果表明, 在这61个基因中, 有13个基因在中国春和矮抗58基因组间不存在序列差异, 12个基因仅仅在启动子区或3°-UTR区存在序列变异, 6个基因在内含子区存在序列变异而外显子序列无差异, 30个基因的外显子存在序列差异导致编码氨基酸的改变, 其中4个基因出现移码突变(TraesCS6B01G503600LC、TraesCS6B01G503700LC、TraesCS6B01G263100和TraesCS6B01G505300LC)。
同时, 对中国春(含有芒长抑制基因B2B2)和长芒材料Azhurnaya (基因型b2b2)的表达谱数据(http://www.wheat-expression.com/)进行分析。通过计算穗部表达量相对于各时期根、茎、叶和籽粒表达量平均值的Fold-Change, 按照Fold-Change (TPMSpike/TPMMean(Leaf, Root, Grain)) ≥ 2 (即穗部表达量是各时期根、茎、叶和籽粒表达量平均值的4倍或4倍以上)为条件进行筛选, 共得到5个基因 (TraesCS6B02G262200, TraesCS6B02G505000LC、TraesCS6B02G505100LC、TraesCS6B02G264400和TraesCS6B02G264600)(图5), 其中, 中国春和Azhurnaya之间仅有TraesCS6B02G264400在幼穗中的表达量差异达到Fold-Change ≥ 2的阈值(5.32-fold)。
图5
 新窗口打开|下载原图ZIP|生成PPT
图5中国春B2区间基因注释与表达谱分析
热图中蓝色越深代表其表达量(TPM)越低, 红色越深则表达量越高, 标红色的基因代表在中国春中Fold-Change (TPMSpike/TPMMean(Leaf, Root, Grain)) ≥ 2, 基因名称后面为其基因注释信息。
Fig. 5Annotation and expression profiling of genes in B2 region
The expression level of each sample is printed as deep blue representing the lowest value to deep red representing the highest value in the heat map. The gene names are followed closely by their annotation information, and the genes in red indicate that its expression reaches the threshold of Fold-Change (TPMSpike/TPMMean (Leaf, Root, Grain)) ≥ 2 in Chinese Spring.
3 讨论
芒是禾本科作物中典型的形态特征之一, 也是一种重要的驯化性状。在自然驯化阶段, 芒可以使种子粘在动物的皮毛上借助动物的运动迅速传播; 种子从母体脱离并下落的过程中, 芒能起平衡作用, 使其胚一端先着地并埋入土壤, 有利于种子萌发; 芒的吸湿作用可以推动种子入土进行“自我掩埋”, 芒剌还能够提供根扎入泥土中的反作用力, 有利于幼苗的成活[14,37-39]。然而, 进入人工驯化阶段, 芒的存在不利于人们的收获、储存等农业活动, 作为一个驯化靶点承受了较大的选择压[37,38]。大麦和小麦的芒具有相似的解剖结构, 如三角形的横截面, 包含两个绿色细胞的区域和三个维管束, 芒表面具有气孔, 可以进行光合作用和蒸腾作用, 大麦和小麦的长芒是它们对干旱环境条件的适应, 有芒品种具有一定的产量优势(Abebe et al., 2010; Evans et al., 1972b; Yuo et al., 2012)。麦芒对产量的作用主要体现在: (1)芒可进行光合作用, 尤其是在植株发育的后期, 叶片光合速率迅速下降时芒的光合速率仍能保持相对稳定, 可作为叶片光合作用的重要补充; (2)芒着生在植株的冠层顶部, 通风透光条件良好, 且同化产物就近向籽粒运输; (3)芒可以进行蒸腾作用, 且在干旱条件下, 芒的光合速率能保持相对稳定; (4)芒具有一定的机械强度, 可以减少因碰撞引起的落粒; (5)芒的存在可以减少鸟类啄食和一些病虫的滋生。在水稻和大麦中, 已有多个控制芒发育的基因被克隆, 小麦中功能基因的定位与克隆工作受限于参考基因组而进展缓慢。随着小麦参考基因组数据的完善、TILLING突变体库的释放和RNA-seq等高通量测序技术的发展, 小麦重要功能基因的定位和功能研究即将迎来一个黄金期。自集群分离分析方法(Bulked Segregant Analysis, BSA)被提出进行遗传学研究来[40], 该策略被广泛用于筛选与目标性状或基因连锁的分子标记, 进行基因或QTL的快速定位, 并已开发出BSA-seq、BSR-seq、MutMap等基因快速克隆方法[41,42,43,44]。本研究探讨了一种基于小麦高密度基因芯片的极端集群分析法(BSA+CHIP)对芒长抑制基因B2进行快速定位。首先, 选择极端个体构建混池进行芯片分型, 分析差异SNP标记将基因定位到目标染色体较小的染色体区段; 再根据SNP分型结果, 针对性地筛选差异SNP, 借助CAPS/dCAPS Designer工具[33]开发CAPS或dCAPS标记对候选区段进行验证和精细定位。理论上, 遗传定位群体只要有足够的重组事件, 采用这种方式便可以在短期内将基因定位到Mb水平。混池所用的群体类型、混池个体数目、目的基因染色体区域的重组频率均对芯片分型的初步定位精度有着较大影响。为提高芯片分型定位效率, 可优先选用多代自交衍生F2群体或近等基因系, 使用2个或2个以上群体进行芯片分型以互相参考降低噪音干扰。在定位过程中, 可结合使用SSR标记验证区间和初步定位以降低成本, 在重组单株较少的精细定位阶段, 选择差异SNP有针对性地开发标记以进行快速定位。
通过SNP芯片分型及精细定位, B2基因被定 位到了6B染色体上0.29 cM的遗传区间, 对应着IWGSC.Ref.V1.0参考基因组4.84 Mb的物理距 离。在该区间内, 共注释有61个基因, 其中 TraesCS6B02G504500LC编码一个碱性螺旋-环-螺旋类的bHLH转录因子, 其拟南芥同源基因AtbHLH137是GA信号传导途径关键基因REPRESSOR OF GIBBERELLIC ACID INSENSITIVE3 (RGA, 赤霉素不敏感阻遏子)的下游靶基因[45], 可能参与GA介导的发育过程调控。此外, 水稻An-1也编码一个bHLH转录因子, 调控芒的发育、籽粒大小和穗粒数[19]。该基因CDS区在中国春和矮抗58基因组之间存在一个SNP, 此SNP也存在于亲本‘石矮1号’与‘六柱头’之间, 它引起编码蛋白在bHLH的转角处一个氨基酸的替换, 可能导致蛋白质二级结构的改变; TraesCS6B02G262600编码TCP类转录因子, 该类转录因子是一类植物特有蛋白, 含有保守的TCP结构域。TCP转录因子广泛参与调控植物的生长发育过程(如分枝、株高、叶型、花型等)和植物逆境胁迫应答(如低温和高盐)[46,47,48]。TCP蛋白参与多种信号转导途径(如油菜素内酯、茉莉酸、赤霉素、细胞分裂素等), 可能是连接生长发育和介导胁迫响应的一个交叉点; 基因TraesCS6B01G264600编码一个钙依赖脂质结合蛋白, 可能与钙离子通道及细胞周期相关, 表达谱分析表明其在中国春和Azhurnaya的幼穗中特异表达(相对其他组织分别为8.89-Fold和9.27- Fold); 基因TraesCS6B01G264400是一个细胞壁松弛蛋白, 它是一种能使植物细胞壁松弛的非酶类细胞壁糖蛋白, 普遍存在于发育中的植物组织和成熟的果实之中。该基因在中国春的幼穗中特异表达(相对其他组织4.88-Fold), 相比Azhurnaya的幼穗, 其在中国春幼穗中的表达量显著上调(5.32-Fold), 和矮抗58相比, 中国春中该基因在外显子、内含子和启动子区均存在大量SNP。因此, 在定位的4.84 Mb B2物理区间内, 含有若干可能的候选基因, 上述基因都有可能参与芒的发育调控, 要明确具体哪个基因导致‘六柱头’短芒的表型, 还需进一步的精细定位与更深入的功能研究。
4 结论
利用‘六柱头’与‘石矮1号’构建的F2群体, 探讨了一种基于高密度SNP芯片的极端集群分析(BSA+CHIP)进行小麦基因快速定位的方法, 并首次将小麦中控制芒长的基因进行了精细定位。‘六柱头’的短芒主要是由细胞长度变短引起, 由显性单基因B2控制, 其被定位到6B染色体4.84 Mb的物理区间内, 该区段在中国春与矮抗58间具有良好的共线性。在B2定位区间共有61个基因, 通过表达谱分析与序列分析, 鉴定了几个可能的候选基因。参考文献 原文顺序
文献年度倒序
文中引用次数倒序
被引期刊影响因子
DOI:10.1007/BF02982493URL [本文引用: 2]

The different types of awns in wheat are described and the results of other workers on their inheritance reviewed.On the basis of their own and other studies the authors postulate the following factors: B1, producing the condition known as "tipped 1", in which only a few awn tips up to 1 or 2 cm. occur, the longest tips being found near the top of the ear; b1 is the recessiye gene for bearded ...
[本文引用: 1]
[本文引用: 1]
.
DOI:10.1007/s00122-006-0216-3URLPMID:16435125 [本文引用: 2]
An uncharacterized source of seedling resistance to Puccinia striiformis f.sp. tritici was identified in an advanced wheat breeding line WAWHT2046. Genetic analysis based on a WAWHT2046/Carnamah-derived double haploid (DH) population demonstrated monogenic inheritance of seedling stripe rust resistance in WAWHT2046. The gene controlling stripe rust resistance in line WAWHT2046 was tentatively designated YrWA. The chromosome 5AL located awn inhibitor gene B1, possessed by WAWHT2046, also showed monogenic inheritance when the DH population was scored for the presence and absence of awns. Joint segregation analysis at the B1 and YrWA loci indicated genetic linkage between the two loci. A recombination value of 12.2 cM was computed using Mapmanager. This association located YrWA in the chromosome arm 5AL. Molecular mapping using microsatellite markers placed YrWA distal to B1. All molecular markers mapped proximal to the awn inhibitor locus B1. As no other stripe rust resistance gene is reported to be located in the chromosome arm 5AL, YrWA was permanently designated as Yr34. Yr34 produced an intermediate (23C) seedling infection type and expressed very low stripe rust response (10R-MR) on adult plants in the field, similar to the resistance gene Yr17. In addition to Yr34, this mapping population segregated for three genetically independent adult plant stripe rust resistance genes. The detection of DH lines with completely susceptible response, higher than that shown by the Yr34-lacking parent Carnamah, suggested that both parents contributed adult plant resistance. The use of WAWHT2046 as a parent in breeding programs would also contribute APR in addition to Yr34.
DOI:10.1007/s00122-008-0804-5URLPMID:18516583 [本文引用: 2]
An F 1 derived doubled haploid (DH) population of 402 lines from the adapted spring wheat cross Superb (high yielding)/BW278 (low yielding) was developed to identify quantitative trait loci (QTL) associated with yield and yield components. A subset of the population (186 lines) was evaluated in replicated field trials in 2001 and 2002 at six locations in Manitoba and Saskatchewan, Canada. Agronomic parameters, grain yield and yield components including 1,000 grain weight, harvest index, average seed weight spike 611 , seed number spike 611 and spikes number m 612 were measured. A genetic map was constructed with 268 microsatellite marker loci and included two morphological genes, reduced plant height, Rht-B1b, and the presence/absence of awns, B1. Composite interval mapping was conducted to estimate the location and effect of QTL associated with the evaluated traits. A total of 53 QTL were identified on 12 chromosomes for the 9 evaluated traits with the coefficient of determination ranging from 0.03 to 0.21 of the total variation. The increase in yield and yield components ranged from 4.5 to 17.1% over the population mean. The five grain yield QTL were detected on chromosomes 1A, 2D, 3B, and 5A and showed a combined increase of 34.4%, over the population mean. The alleles from Superb were associated with increased yield for four of the five QTL. This study identified potential chromosome segments for use in marker-assisted selection to improve yield and yield components in spring wheat.
[本文引用: 2]
[本文引用: 2]
[本文引用: 2]
DOI:10.1111/j.1399-3054.2006.00679.xURL [本文引用: 1]
In wheat ( Triticum aestivum L), the leaves particularly flag leaves have been considered to be the key organs contributing to higher yields, whereas awns have been considered subsidiary organs. Compared with extensive investigations on the assimilation contribution of leaves, the photosynthetic characteristics of awns have not been well studied. In this study, we investigated the ultrastructure of chloroplasts, oxygen evolution, and phosphoenolpyruvate carboxylase [phosphoenolpyruvate carboxylase (PEPCase) EC 4.1.1.31)] activity in both flag leaves and awns during the ontogenesis of wheat. Transmission electron microscope observations showed initial increases in the sizes of grana and the degree of granum stacks from the florescence-emergence stage both in flag leaves and in awns, followed by the breakdown of membrane systems after the milk-development stage. The results of oxygen evolution assays revealed that in both organs, the rate of photosynthesis increased in the first few stages and then decreased, but the decrease occurred much earlier in flag leaves than in awns. A PEPCase activity assay demonstrated that the activity of PEPCase was much higher in awns than in flag leaves throughout ontogeny; the value was particularly high at the late stages of grain filling. Our results suggest that awns play a dominant role in contributing to large grains and a high grain yield in awned wheat cultivars, particularly during the grain-filling stages.
DOI:10.1111/j.1744-7348.1978.tb02616.xURL [本文引用: 1]
The pattern of distribution of carbon assimilated by awns was investigated in two lines of Triticum aestivum. Single awns on basal florets of spikelets in the central part of the ear were dosed with 14 CO 2 . Five days after dosing, 99% of the carbon-14 recovered was in the spikelet bearing the awn. Of the carbon-14 exported from the treated awn 57% went to the grain of the first floret, 1% to the second, 28% to the third and 7% to the fourth.
DOI:10.1093/oxfordjournals.aob.a084081URL [本文引用: 1]
The contribution made by ear photosynthesis to grain yield was found to vary from io per cent to 44 per cent depending on the technique used, and on environmental conditions. A modified ear-shading technique is described which overcomes some of the undesirable features of previous ear-shading methods. It was also found that ear photosynthesis comprises two processes, (a) the assimilation of atmospheric CO60 and (b) the photosynthetic refixation of the ear's respiratory CO60. Dry-weight data and measurements of CO60 exchange both indicated that this latter component can make a significant contribution to grain yield.
DOI:10.1111/j.1365-3040.1993.tb00884.xURL [本文引用: 1]
DOI:10.1093/jxb/36.3.432URL [本文引用: 1]
Abstract Carbon exchange rate (CER) and transpiration were measured in flag leaves, whole ears, glumes (referring to the total area of glumes and lemmas) and awns, in six hexaploid spring wheats (Triticum aestivum L.), three cultivated tetraploid spring wheats (T. turgidum L.), four wild tetraploid wheats (T. dicoccoides), eight six-rowed barleys (Hordeum vulgare L.) and five two-rowed barleys (H. vulgare L.).Differences between varieties and between species in total ear CER and transpiration were associated largely with differences in ear surface area rather than with rates per unit area. Rates of CER and transpiration per unit area of ears were 40-80% of those of flag leaves, depending on the species.However, since ear surface area was greater than flag leaf area by a factor of 1.1, 3.9, 5.5 and 4.4, in hexaploid wheat, tetraploid wheat, six-rowed barley, and two-rowed barley, respectively, total ear CER reached up to 90% of that of the flag leaf.The contribution of awns to total ear CER depended largely on total awn surface area per ear, rather than on CER per unit awn area. Awns contributed about 40-80% of total spike CER, depending on the species, but only 10-20% of spike transpiration. The disproportionately small contribution of awns to ear transpiration was caused by the very low rate of transpiration per unit area of awns. Thus, while transpiration ratio (CER/transpiration) was about the same in flag leaves and glumes, it was higher by several orders of magnitude in the awns.A large amount of awns in the ear is therefore a drought adaptive attribute in these cereals, for which tetraploid wheat exceeded hexaploid wheat and six-rowed barley exceeded two-rowed barley.
[本文引用: 2]
[本文引用: 1]
DOI:10.1126/science.1140097URLPMID:17495170 [本文引用: 2]
The dispersal unit of wild wheat bears two pronounced awns that balance the unit as it falls. We discovered that the awns are also able to propel the seeds on and into the ground. The arrangement of cellulose fibrils causes bending of the awns with changes in humidity. Silicified hairs that cover the awns allow propulsion of the unit only in the direction of the seeds. This suggests that the dead tissue is analogous to a motor. Fueled by the daily humidity cycle, the awns induce the motility required for seed dispersal.
DOI:10.1046/j.1439-0523.2002.728336.xURL [本文引用: 12]
Quantitative trait loci (QTL) for three traits related to awning (awn length at the base, the middle and the top of the ear) in wheat were mapped in a doubled-haploid line (DH) population derived from the cross between the cultivars 'Courtot' (awned) and 'Chinese Spring' (awnless) and grown in Clermont-Ferrand, France, under natural field conditions. A molecular marker linkage map of this cross that was previously constructed based on 187 DH lines and 550 markers was used for the QTL mapping. The genome was well covered (more than 95%) and a set of anchor loci regularly spaced (one marker every 20.8 cM) was chosen for marker regression analysis. For each trait, only two consistent QTL were identified with individual effects ranging from 8.5 to 45.9% of the total phenotypic variation. These two QTL cosegregated with the genes Hd on chromosome 4A and B2 on chromosome 6B, which are known to inhibit awning. The results were confirmed using 'Chinese Spring' deletion lines of these two chromosomes, which have awned spikes, while 'Chinese Spring' is usually awnless. No quantitative trait locus was detected on chromosome 5A where the B1 awn-inhibitor gene is located, suggesting that both 'Courtot' and 'Chinese Spring' have the same allelic constitution at this locus. The occurrence of awned speltoid spikes on the deletion lines of this chromosome suggests that 'Chinese Spring' and 'Courtot' have the dominant B1 allele, indicating that B1 alone has insufficient effect to induce complete awn inhibition.
DOI:10.1258/ijsa.2009.008443URLPMID:12589554 [本文引用: 4]
We made an update of the intervarietal molecular marker linkage map of the wheat genome developed using a doubled-haploid (DH) population derived from the cross between the cultivars 'Courtot' and 'Chinese Spring'. This map was constructed using 187 DH lines and 659 markers. The genome was well covered (more than 95%) except for chromosomes from homoeologous group 4 and chromosomes 5D and 7D, which had gaps slightly larger than 50 cM. A core-map based on a set of 200 anchor loci (one marker each 18.4 cM) was developed. The total length of this map was 3,685 cM which is similar to the size of the international reference map of the ITMI population (3,551 cM). Map coverage was identical for the three genomes (A, B and D) and for the number of anchor loci, as well as for the size of the map. Using this map, QTLs for several agronomic traits were detected on phenotypic data from the population grown in Clermont-Ferrand (France) under natural field conditions over 6 years, and in Norwich (UK) in controlled conditions and under natural field conditions in 1 year. Almost all of the 21 chromosomes were involved in at least one trait. However, several regions seemed to contain gene clusters either for grain traits (and thus breadmaking quality) or plant development traits. [References: 68]
DOI:10.1371/journal.pone.0176148URLPMID:5402986 [本文引用: 13]
The awn is a long needle-like structure formed at the tip of the lemma in the florets of some grass species. It plays a role in seed dispersal and protection against animals, and can contribute to the photosynthetic activity of spikes. Three main dominant inhibitors of awn development (Hd,B1andB2) are known in hexaploid wheat, but the causal genes have not been cloned yet and a genetic association with awn length diversity has been found only for theB1allele. To analyze the prevalence of these three awning inhibitors, we attempted to predict the genotypes of 189 hexaploid wheat varieties collected worldwide using markers tightly linked to these loci. Using recombinant inbred lines derived from two common wheat cultivars, Chinese Spring and Mironovskaya 808, both with short awns, and a high-density linkage map, we performed quantitative trait locus analysis to identify tightly linked markers. Because this linkage map was constructed with abundant array-based markers, we converted the linked markers to PCR-based markers and determined the genotypes of 189 hexaploids. A significant genotype-phenotype correlation was observed at theHdandB1regions. We also found that interaction among these three awning inhibitors is involved in development of a membranous outgrowth at the base of awn resembling theHoodedmutants of barley. For the hooded awn phenotype, presence of theHddominant allele was essential but not sufficient, soB2and other factors appear to act epistatically to produce the ectopic tissue. On the other hand, the dominantB1allele acted as a suppressor of the hooded phenotype. These three awning inhibitors largely contribute to the genetic variation in awn length and shape of common wheat.
[本文引用: 2]
DOI:10.1016/j.molp.2015.08.001URLPMID:26283047 [本文引用: 1]
DOI:10.1105/tpc.15.00260URLPMID:26082172 [本文引用: 1]
Common wild rice (Oryza rufipogon), the wild relative of Asian cultivated rice (Oryza sativa), flaunts long, barbed awns, which are necessary for efficient propagation and dissemination of seeds. By contrast, O. sativa cultivars have been selected to be awnless or to harbor short, barbless awns, which facilitate seed processing and storage. The transition from long, barbed awns to short, barbless awns was a crucial event in rice domestication. Here, we show that the presence of long, barbed awns in wild rice is controlled by a major gene on chromosome 4, LONG AND BARBED AWN1 (LABA1), which encodes a cytokinin-activating enzyme. A frame-shift deletion in LABA1 of cultivated rice reduces the cytokinin concentration in awn primordia, disrupting barb formation and awn elongation. Sequencing analysis demonstrated low nucleotide diversity and a selective sweep encompassing an 鈭800-kb region around the derived laba1 allele in cultivated rice. Haplotype analysis revealed that the laba1 allele originated in the japonica subspecies and moved into the indica gene pool via introgression, suggesting that humans selected for this locus in early rice domestication. Identification of LABA1 provides new insights into rice domestication and also sheds light on the molecular mechanism underlying awn development.
[本文引用: 1]
[本文引用: 1]
DOI:10.1105/tpc.16.00379URLPMID:27634315 [本文引用: 1]
Abstract Cultivated rice (Oryza sativa) was domesticated from wild rice (Oryza rufipogon), which typically displays fewer grains per panicle and longer grains than cultivated rice. In addition, wild rice has long awns, whereas cultivated rice has short awns or lacks them altogether. These changes represent critical events in rice domestication. Here, we identified a major gene, GRAIN NUMBER, GRAIN LENGTH AND AWN DEVELOPMENT1 (GAD1), that regulates those critical changes during rice domestication. GAD1 is located on chromosome 8 and is predicted to encode a small secretary signal peptide belonging to the EPIDERMAL PATTERNING FACTOR-LIKE family. A frame-shift insertion in gad1 destroyed the conserved cysteine residues of the peptide, resulting in a loss of function, and causing the increased number of grains per panicle, shorter grains, and awnless phenotype characteristic of cultivated rice. Our findings provide a useful paradigm for revealing functions of peptide signal molecules in plant development and helps elucidate the molecular basis of rice domestication. 2016 American Society of Plant Biologists. All rights reserved.
[本文引用: 1]
DOI:10.1038/374727a0URLPMID:7715728 [本文引用: 1]
In barley (Hordeum vulgare L.) the unit of inflorescence is the spikelet, which bears a fertile bract, the lemma, and the floret consisting of palea, two lodicules, three stamens and the pistil. The Hooded mutation causes the appearance of an extra flower of inverse polarity on the lemma. This phenotype is governed by the single dominant genetic locus K3. Here we show that the homeobox gene Knox3 represents this locus. Ectopic Knox3 gene expression in the primordium of the extra floret is caused by a 305-base pair duplication in intron 4, and phenocopies of the mutation are obtained in the heterologous tobacco system by Knox3 overexpression. It is concluded that homeotic genes of the Knox gene family are involved in floral evocation. Furthermore, the study of polarity of reproductive organs in K and related mutants can now focus on homeobox genes.
DOI:10.1038/s41588-018-0266-xURL [本文引用: 1]
[本文引用: 1]
DOI:10.1007/s10722-014-0167-5URL [本文引用: 2]
Plentiful awn variations have been discovered in hexaploid wheats, while less were observed in diploid and tetraploid wheats. However, a double ditelosomic line of 6B (dDT6B) in tetraploid wheat cultivar DR147 specifically displayed awnless phenotype, which arised from the presence of awning inhibitor B2 located in telosome 6BL derived from hexaploid wheat cultivar Chinese Spring (CS). B2 locus was definitely proved to be essential for the awnless phenotype and the partial dominance effect of B2 locus was thus indicated. Furthermore, employing microsatellite markers, the CS genetic background of telosome 6BL and 6BS of dDT6B proved to be distinctly and partially retained in dDT6B, indicated by a genetic similarities coefficient 0.542 with CS. According to the genetic and physical map of chromosome 6B, B2 locus was anchored to a region between 6BL-5 and the distal boundary of 6BL-6's interstitial deletion, adjacent to three markers-Xwmc539, Xgpw5130 and Xwmc748. Inspired by recalcitrant retention after 16 generations' backcross with tetraploid wheat, B2 locus was demonstrated to be located in recombination coldspots of telosome 6BL, which was the proximal region of Xwmc748 to centromere.
[本文引用: 1]
.
DOI:10.1046/j.1439-0523.2001.00615.xURL [本文引用: 1]
Gene mapping and marker-assisted selection in complex, polyploid genomes still relies strongly on restriction fragment length polymorphism (RFLP) analysis, as conversion of RFLP to polymerase chain reaction (PCR) markers can be very difficult. DNA extraction in amounts suitable for RFLP analysis represents the most time-consuming and labour-intensive step in molecular marker analysis of plant populations. In this paper, a new flexible method for plant DNA extraction is presented. It allows a high-throughput of samples in a short time without the need for freezing or lyophilizing the plant material. The method allows the isolation of genomic DNA with a yield of 100 渭g for a minimal amount of 200 mg of leaf material. This is sufficient for work with large-genome plant species such as hexaploid wheat, where 20 渭g of genomic DNA are required for a single RFLP analysis.
DOI:10.1155/2008/412696URLPMID:18670612 [本文引用: 1]
Microsatellites or SSRs (simple sequence repeats) are ubiquitous short tandem duplications occurring in eukaryotic organisms. These sequences are among the best marker technologies applied in plant genetics and breeding. The abundant genomic, BAC, and EST sequences available in databases allow the survey regarding presence and location of SSR loci. Additional information concerning primer sequences is also the target of plant geneticists and breeders. In this paper, we describe a utility that integrates SSR searches, frequency of occurrence of motifs and arrangements, primer design, and PCR simulation against other databases. This simulation allows the performance of global alignments and identity and homology searches between different amplified sequences, that is, amplicons. In order to validate the tool functions, SSR discovery searches were performed in a database containing 28 469 nonredundant rice cDNA sequences.
DOI:10.1007/s11427-017-9286-yURLPMID:29656340 [本文引用: 3]
正Dear Editor,An increasing number of single-nucleotide polymorphisms(SNP)have been identified and extensively used in genetics studies with advances in next-generation sequencing(NGS)and SNP arrays.However,due to frequent calling errors,the accuracy of SNPs of interest must usually be validated.In recent years,the single-nucleotide polymorphism genotyping by fluorescent competitive allele-specific polymerase chain reaction(Ni PTag,the commercial technology named KASP),a relatively new and powerful SNP genotyping
[本文引用: 1]
DOI:10.1093/jhered/93.1.77URLPMID:12011185 [本文引用: 2]
Over the last 15 years a wealth of linkage maps and quantitative trait loci (QTL) mapping results have become available. The pace of generating this genetic information is accelerating owing to advances in molecular marker technology and the development of software for linkage analysis and QTL mapping. A graphical presentation of this information is often needed, both for publication purposes and for easy and intuitive interpretation. However, the development of tools for the graphical presentation of linkage maps and QTLs has lagged behind. DrawMap (Van Ooijen 1994) was an early program capable of drawing genetic linkage maps. However, the output of this program was not very well suited for use in modern word processors and presentation software. Authors in this field have therefore, of necessity, resorted to the use of general graphics software to compose charts of their linkage and QTL maps. This is always a laborious process, with sometimes disappointing results. Also, each time a map is recalculated when new data become available, this process has to be repeated. For this reason I developed MapChart, a software package that takes as input the linkage and QTL data and generates charts of linkage maps and QTLs. These charts can easily be exported to word processing or presentation software. The charts are exported as vector graphics (Windows enhanced metafiles) rather than bitmaps, which makes them easy to rescale and to edit further if desired.
URL [本文引用: 1]
Various softwares or pipelines have been developed for biological information mining from high-throughput sequencing (HTS) data, and most of them relies on programming and command-line environment with which most biologists are unfamiliar. Bioinformatic tools with an user-friendly interface are preferred by wet-lab biologists. Here, we describe TBtools, a Toolkit for Biologists integrating various HTS-data handling tools with a user-friendly interface. It includes a large collection of functions, which facilitate many simple, routine but elaborate tasks working on HTS data, such as bulk sequence extraction, gene set functional enrichment, venn diagram and etc. TBtools can run under all operating systems with JRE1.6 and is freely available at github.com/CJ-Chen/TBtools. Since its development, it has been used by many researchers. It will be a useful toolkit for wet-lab biologists to work on all kinds of high-throughput data.
[本文引用: 2]
DOI:10.1111/j.1744-7909.2007.00510.xURL [本文引用: 1]
The origin of cultivated rice has puzzled plant biologists for decades. This is due, at least in part, to the complex evolutionary dynamics in rice cultivars and wild progenitors, particularly rapid adaptive differentiation and continuous gene flow within and between cultivated and wild rice. The long-standing controversy over single versus multiple and annual versus perennial origins of cultivated rice has been brought into shaper focus with the rapid accumulation of genetic and phylogenetic data. Molecular phylogenetic analyses revealed ancient genomic differentiation between rice cultivars, suggesting that they were domesticated from divergent wild populations. However, the recently cloned domestication gene sh4, responsible for the reduction of grain shattering from wild to cultivated rice, seems to have originated only once. Herein, we propose two models to reconcile apparently conflicting evidence regarding rice domestication. The snow-balling model considers a single origin of cultivated rice. In this model, a core of critical domestication alleles was fixed in the founding cultivar and then acted to increase the genetic diversity of cultivars through hybridization with wild populations. The combination model considers multiple origins of cultivated rice. In this model, initial cultivars were domesticated from divergent wild populations and fixed different sets of domestication alleles. Subsequent crosses among these semi-domesticated cultivars resulted in the fixation of a similar set of critical domestication alleles in the contemporary cultivars. In both models, introgression has played an important role in rice domestication. Recent and future introgression of beneficial genes from the wild gene pool through conventional and molecular breeding programs can be viewed as the continuation of domestication.
[本文引用: 1]
.
[本文引用: 1]
DOI:10.1073/pnas.88.21.9828URLPMID:1682921 [本文引用: 1]
We developed bulked segregant analysis as a method for rapidly identifying markers linked to any specific gene or genomic region. Two bulked DNA samples are generated from a segregating population from a single cross. Each pool, or bulk, contains individuals that are identical for a particular trait or genomic region but arbitrary at all unlinked regions. The two bulks are therefore genetically dissimilar in the selected region but seemingly heterozygous at all other regions. The two bulks can be made for any genomic region and from any segregating population. The bulks are screened for differences using restriction fragment length polymorphism probes or random amplified polymorphic DNA primers. We have used bulked segregant analysis to identify three random amplified polymorphic DNA markers in lettuce linked to a gene for resistance to downy mildew. We showed that markers can be reliably identified in a 25-centimorgan window on either side of the targeted locus. Bulked segregant analysis has several advantages over the use of near-isogenic lines to identify markers in specific regions of the genome. Genetic walking will be possible by multiple rounds of bulked segregation analysis; each new pair of bulks will differ at a locus identified in the previous round of analysis. This approach will have widespread application both in those species where selfing is possible and in those that are obligatorily outbreeding.
URL [本文引用: 1]
[本文引用: 1]
[本文引用: 1]
[本文引用: 1]
[本文引用: 1]
[本文引用: 1]
[本文引用: 1]
[本文引用: 1]
DOI:10.1046/j.1365-313X.1999.00444.xURLPMID:10363373 [本文引用: 1]
Summary The cycloidea ( cyc ) and teosinte branched 1 ( tb1 ) genes code for structurally related proteins implicated in the evolution of key morphological traits. However, the biochemical function of CYC and TB1 proteins remains to be demonstrated. To address this problem, we have analysed the predicted secondary structure of regions conserved between CYC and TB1, and looked for related proteins of known function. One of the conserved regions is predicted to form a non-canonical basic-Helix-Loop-Helix (bHLH) structure. This domain is also found in two rice DNA-binding proteins, PCF1 and PCF2, where it has been shown to be involved in DNA-binding and dimerization. This indicates that the conserved domain most probably defines a new family of transcription factors, which we have termed the TCP family after its first characterised members (TB1, CYC and PCFs). Other plant proteins of unknown function also belong to this family. We have studied two of these in Arabidopsis and have shown that they are expressed in rapidly growing floral primordia. This, together with the proposed involvement of cyc and tb1 in influencing meristem growth, suggests that many members of the TCP family may affect cell division. Some of these genes may have been recruited during plant evolution to generate new morphological traits.
DOI:10.1016/j.tplants.2009.11.003URLPMID:19963426 [本文引用: 1]
TCP genes encode plant-specific transcription factors with a bHLH motif that allows DNA binding and protein-損rotein interactions. The TCP gene family has five members in the lycophytes and >20 members in the eudicots. Gene duplication and diversification has generated two clades (class I and II) with slightly different TCP domains. Here, we summarize our current knowledge of the evolution of this family, their regulation, the biochemical activity of their proteins and the biological function of some members, in particular, in the control of cell proliferation in developing tissues. Increasing knowledge of the functions of TCP genes should enable their use as tools to modulate plant growth patterns and to generate novel morphologies in species of agronomical interest.
DOI:10.1016/j.cub.2015.05.024URLPMID:26073137 [本文引用: 1]
Plant organs grow via waves of cell division followed by cell expansion. Using theArabidopsispetal as a model, Huang and Irish show that negative regulators of cell division are transcriptionally repressed in petal primordia; temporal alleviation of that repression allows for the transition from cell division to post-mitotic cell expansion.
