 ,1,*, 张福耀,1,*
Mapping of genes confessing same height of tiller and main stem in sorghum
WANG Rui1,*, LING Liang2,*, ZHAN Peng-Jie1, YU Ji-Zhen1, CHU Jian-Qiang1, PING Jun-Ai,1,*, ZHANG Fu-Yao,1,*通讯作者:
收稿日期:2018-08-21接受日期:2019-01-19网络出版日期:2019-02-26
| 基金资助: |
Received:2018-08-21Accepted:2019-01-19Online:2019-02-26
| Fund supported: |
作者简介 About authors
王瑞,E-mail:
凌亮,E-mail:

摘要
关键词:
Abstract
Keywords:
PDF (6489KB)元数据多维度评价相关文章导出EndNote|Ris|Bibtex收藏本文
本文引用格式
王瑞, 凌亮, 詹鹏杰, 于纪珍, 楚建强, 平俊爱, 张福耀. 控制高粱分蘖与主茎株高一致性的基因定位[J]. 作物学报, 2019, 45(6): 829-838. doi:10.3724/SP.J.1006.2019.84111
WANG Rui, LING Liang, ZHAN Peng-Jie, YU Ji-Zhen, CHU Jian-Qiang, PING Jun-Ai, ZHANG Fu-Yao.
高粱[Sorghum bicolor (L.) Moench]是全球农业生态系统中重要的粮食和饲料作物。全球年种植面积4000多万公顷, 总产约6000万吨。高粱抗旱且耐盐碱和瘠薄土壤, 具有在恶劣环境下生长的能力, 被视为干旱和盐碱土壤农业区农业可持续发展的一种重要作物[1,2,3]。随着对淡水资源需求的增加、边际农田利用的增多和全球气候变暖, 耐干旱、盐碱作物——高粱将在全球粮食需求不断增加的今天显的越来越重要。高粱也是我国的重要旱粮作物之一, 全国年种植面积约80万公顷。目前, 我国的农业生产进入新的转型期, 劳动力成本逐年提高, 农民对机械化栽培高粱的渴求与日俱增, 但推广的高粱品种基本不适宜机械化栽培, 一是株高本身偏高, 不适宜机械化作业, 二是分蘖高度与主茎不一致, 高粱穗不在一个层面, 造成收获时丢损严重, 极大地制约了高粱机械化生产的发展[4,5]。因此, 高粱分蘖和主茎株高一致的研究, 对指导高粱育种和选育适宜机械化生产高粱品种具有十分重要的理论意义和应用价值。
国内外对机械化生产高粱品种的研究主要集中在株高和分蘖力这2个性状。Quinby等[6]研究确定了植株高度由4个基因位点控制, 依此命名为Dwl、Dw2、Dw3和Dw4; Pereira等[7]以CK60和PI229828为亲本杂交得到F2群体, 计算出4个控制株高的QTL; Lin等[8]以杂交F2代群体鉴定出6个控制株高的QTL; Rami等[9]以IS2807分别与种质库中2种高粱杂交, 得到2个RIL群体, 以此为研究对象, 得到3个与株高相关的QTL; Klein等[10]以Sureno和RTx430为亲本杂交, 选取125株F2鉴定得到2个控制株高性状的QTL; Upadhyaya等[11]用242份微核心种质与39个标记关联分析, 得出5个标记与熟期或株高关联; Upadhyaya等[12]开发了14,739个SNP标记评估株高, 结果发现, 6个SNP位点与株高关联; Harris-Shultz等[13]以F2群体发现了1个新的株高QTL位于第3染色体上; 苏舒等[14]以T70和P607为亲本, 杂交得到F6代RIL检测到6个控制株高的QTL; 刘娟等[15]利用‘河农16’与‘千三’的F2:3遗传作图群体的后代材料建立的F8代的132个重组自交系, 检测到2个与株高相关的QTL。分蘖数表现出数量性状的遗传特点, 受多个数量基因位点和环境因子的共同作用[16]。Feltus等[17]利用BTx623 × IS3620C的F6-8代作为构图群体, 检测到9个控制高粱分蘖数的QTL; Shehzad等[18]对来自亚洲和非洲27个国家的代表性高粱品种多样性研究发现7个影响分蘖数的QTL; Shiringani等[19]利用甜高粱SS79和粒用高粱M71杂交得到的F6代重组自交系群体为定位群体, 检测到6个影响高粱分蘖数的QTL; 董维等[20]以T70 × P607杂交得到的F6代RIL群体构建遗传连锁图, 检测到7个与分蘖数相关的QTL。对高粱分蘖和主茎株高一致的研究尚未见报道。本研究通过杂交、自交等方法构建F2分离群体, 基于SLAF-seq技术, 利用F2遗传分离群体和集群分离法(BSA)对高粱分蘖与主茎株高一致性状进行关联分析, 定位该基因在染色体上的位置, 以期提高我国适宜机械化高粱品种选育水平以及选择的准确性和科学性。
1 材料与方法
1.1 材料
本实验田间部分在山西省农业科学院高粱研究所试验基地(山西榆次和海南三亚)进行, 选用矮杆多分蘖且分蘖整齐一致的品种K35-Y5为母本, 中高杆有分蘖且分蘖明显高于主茎的恢复系1383为父本杂交得F1代, 冬季在海南三亚种植F1代, 第2年夏在山西榆次种植F2代, 株行距为25 cm × 50 cm, 每公顷留苗约8万株, 保证每个单株充分表达其性状。开花后调查分蘖与主茎株高的一致性, 分蘖株高与主茎株高同等或株高差≤ 5 cm, 记为株高一致, 分蘖株高与主茎株高差> 5 cm记为不一致。选取F2分离群体中分蘖与主茎株高一致和分蘖明显高于主茎的植株各45株, 构建分蘖与主茎株高一致与分蘖明显高于主茎的2个极端性状混池, 连同2个亲本作为定位群体进行关联分析。
1.2 SLAF-seq文库构建
选择已经测序完成的高粱基因组作为参考基因组(下载地址: ftp://ftp.ensemblgenomes.org/pub/ plants/release-25/fasta/sorghum_bicolor/, 组装出的基因组大小738.61 Mb, GC含量为43.93%), 根据基因组大小以及GC含量等信息作为参考基因组进行酶切预测, 根据选定的最适酶切方案, 对检测合格的各样品基因组DNA分别进行酶切。对得到的酶切片段(SLAF标签)进行3′端加A处理、连接Dual-index[21]测序接头、PCR扩增、纯化、混样、切胶选取目的片段, 文库质检合格后用Illumina HiSeq 2500测序。为评估酶切实验的准确性, 选用水稻(Oryza sativa)[22]作为对照进行测序。1.3 SNP位点的开发与关联分析
利用Dual-index对测序得到的原始数据进行识别, 得到各个样品的reads。过滤测序reads的接头后, 进行测序质量和数据量的评估。通过Control数据评估酶切效率, 以此判断实验过程的准确性和有效性。通过将reads与参考基因组比对, 在亲本和混池中开发SLAF标签, 寻找在亲本中存在多态性的SLAF标签和有reads覆盖区域的SNP。将得到的SNP利用SNP-index方法[23]和ED方法[24]进行关联分析, 获得与性状紧密关联的位点。1.4 关联分析方法
1.4.1 SNP-index方法原理 SNP-index是通过混池间的基因型频率差异进行标记关联分析的方法[23], 主要是寻找混池之间基因型频率的显著差异。利用两亲本的SNP数据, 分别计算两混池的SNP-index, 并通过ΔSNP-index观测可能与性状分离相关的位点。
SNP-index (Mut) = ρx/(ρX+ρx)
SNP-index (WT) = ρx/(ρX+ρx)
ΔSNP-index = SNP-index(Mut)-SNP-index(WT)
式中, Mut和WT分别为子代的突变池与野生池, ρX和ρx分别为野生型亲本的等位基因, 以及突变型亲本的等位基因在各自池中出现的read数目。通过ΔSNP-index可以观察每个位点在突变池与野生池之间的差异。
为了消除假阳性的位点, 利用标记在基因组上的位置, 对同一条染色体上标记的ΔSNP-index值进行拟合, 并根据关联阈值, 选择阈值以上的区域作为与性状相关的区域。
1.4.2 欧氏距离方法原理 欧式距离(Euclidean distance, ED)是利用测序数据寻找混池间存在的显著差异标记, 并以此评估与性状关联区域的方法[24]。ED值越大, 表明该标记在两混池间的差异越大。
$\text{ED}=\sqrt{{{\left( {{A}_{\text{mut}}}-{{A}_{\text{wt}}} \right)}^{2}}+{{\left( {{C}_{\text{mut}}}-{{C}_{\text{wt}}} \right)}^{2}}+{{\left( {{G}_{\text{mut}}}-{{G}_{\text{wt}}} \right)}^{2}}+{{\left( {{T}_{\text{mut}}}-{{T}_{\text{wt}}} \right)}^{2}}}$
式中, Amut、Cmut、Gmut和Tmut分别为A、C、G和T碱基在突变混池中的频率, Awt、Cwt、Gwt和Twt分别为A、C、G和T碱基在野生型混池中的频率。
利用两混池间基因型存在差异的SNP位点, 统计各个碱基在不同混池中的深度, 并计算每个位点ED值, 为消除背景噪音, 对原始ED值进行乘方处理[24]。
为了消除假阳性的位点, 利用标记在基因组上的位置, 对同一条染色体上标记的ED值进行拟合[24], 并根据关联阈值, 选择阈值以上的区域作为与性状相关的区域。
2 结果与分析
2.1 亲本及群体分蘖高度的遗传
K35-Y5是从美国引进的种质, 通过在山西和海南多年种植鉴定, 表现为矮杆多分蘖且分蘖整齐一致, 是适宜机械化生产品种选育的优良亲本系。1383是我国主干高粱杂交种‘晋杂12号’的恢复系, 中高杆有分蘖且明显高于主茎, 由它配制的晋杂12号在生产中一直表现分蘖高、弱苗高、整齐 度差。选用K35-Y5与1383杂交, F1植株表现为有分蘖且分蘖比主茎高, 说明分蘖与主茎株高一致性状为隐形, 而分蘖高于主茎性状为显性。F2分离群体中分蘖与主茎株高不一致与一致的分离比例为239∶72, 经卡方(χ2)检验, χ2=0.57﹤χ20.05=3.84, 分离符合3∶1, 说明分蘖与主茎株高一致性状受一对隐性核基因控制。
2.2 酶切方案与建库评估
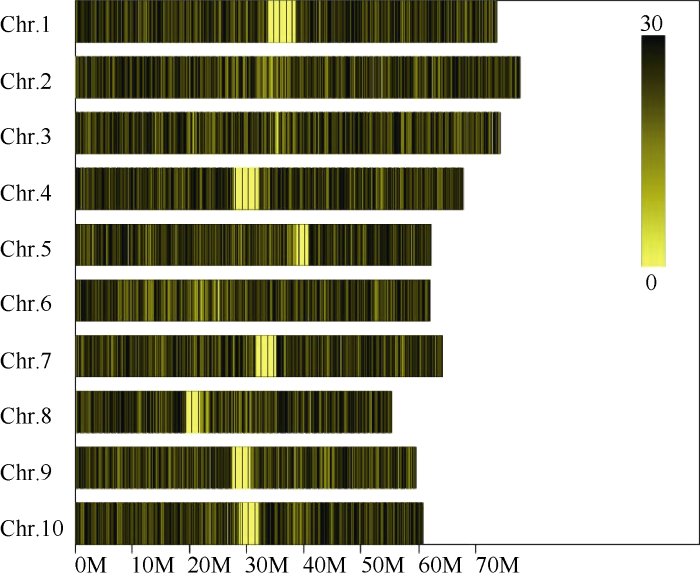
对高粱参考基因组序列进行电子酶切预测, 确定限制性内切酶为Rsa I + Hae III, 酶切片段长度在364~414 bp的序列定义为SLAF标签, 预测可得到103,902个SLAF标签。统计SLAF标签在各染色体上的数量(表1), 绘制SLAF标签在染色体上的分布图(图1)。由图可知, SLAF标签在基因组各染色体上分布基本均匀, 酶切方案可行。Table 1
表1
表1SLAF标签在各染色体上的数量统计
Table 1
| 染色体 Chromosome | 染色体长度 Chromosome length | 预测SLAF标签数 Expected SLAF number | 平均SLAF间距 Average SLAF distance (bp) |
|---|---|---|---|
| Chr.1 | 84007898 | 11859 | 7083.89 |
| Chr.2 | 88663305 | 12527 | 7077.78 |
| Chr.3 | 84691115 | 11983 | 7067.61 |
| Chr.4 | 77402132 | 10684 | 7244.68 |
| Chr.5 | 70937750 | 9529 | 7444.41 |
| Chr.6 | 70774438 | 9694 | 7300.88 |
| Chr.7 | 73201405 | 10007 | 7315.02 |
| Chr.8 | 63096686 | 8854 | 7126.35 |
| Chr.9 | 67846938 | 9319 | 7280.50 |
| Chr.10 | 69378333 | 9446 | 7344.73 |
| 合计Total | 750000000 | 103902 | 7218.34 |
新窗口打开|下载CSV
图1
 新窗口打开|下载原图ZIP|生成PPT
图1SLAF标签在参考基因组各染色体上的分布
横坐标为染色体长度, 图中颜色越深的区域即SLAF标签集中分布的区域。
Fig. 1Distribution of SLAF on reference genome
Abscissa represents the length of the chromosome; the deep color area is SLAF label concentrated distribution area.
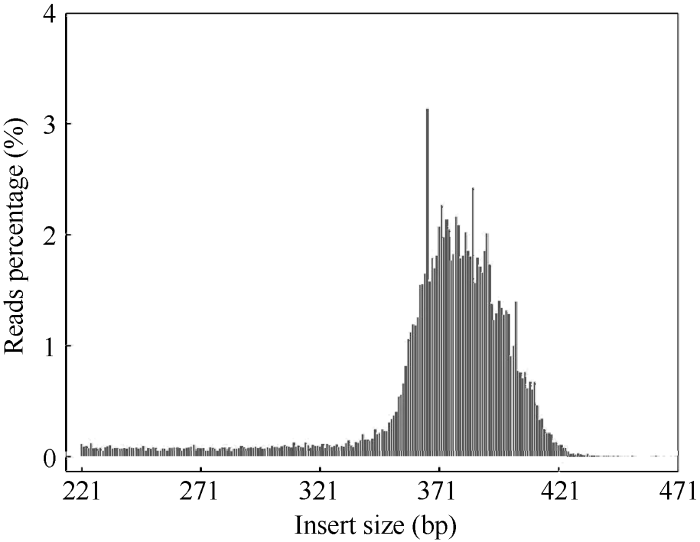
为进一步评估酶切方案的有效性, 以水稻(Oryza sativa)作对照, 其基因组大小为374.31 Mb (下载地址: http://rice.plantbiology.msu.edu), 通过BWA[25]软件将对照的测序reads与参考基因组比对(表2和图2) 显示, 本次实验双端比对效率在93.35%, 酶切效率为90.60%, 对照测序reads插入片段的长度均集中分布在360~410 bp之间, 说明SLAF建库正常。
图2
 新窗口打开|下载原图ZIP|生成PPT
图2对照reads插入片段分布
Fig. 2Distribution of observed control insert size
Table 2
表2
表2水稻测序reads比对分析
Table 2
| 样品 Sample | 双端比对 Paired-end mapped reads (%) | 单端比对 Single-end mapped reads (%) | 未比对成功 Unmap reads (%) | 正常酶切比例 Digestion normally (%) | 部分酶切 Digestion partly (%) |
|---|---|---|---|---|---|
| 水稻 Oryza sativa | 93.35 | 2.79 | 3.86 | 90.60 | 9.40 |
新窗口打开|下载CSV
2.3 测序数据统计与评估
采用100 bp×2作为后续使用的数据, 进行数据评估和分析。测序质量值(Q)是评估高通量测序单碱基错误率的重要指标, 测序质量值越高对应的碱基测序错误率越低。共获得30.80 M reads数据, 测序平均Q30为91.70%, 平均GC含量为45.79% (表3)。用于评估实验建库的准确性的水稻(Control)测序获得0.19 M reads的数据量。Table 3
表3
表3各样品测序数据统计表
Table 3
| 样品编号 Sample ID | 总reads数 Total reads | Q30 (%) | GC (%) |
|---|---|---|---|
| 父本 Male parent | 4040595 | 92.05 | 45.96 |
| 母本 Female parent | 3591789 | 92.49 | 45.96 |
| 混池aa Pool aa | 10734806 | 92.02 | 45.58 |
| 混池ab Pool ab | 12433150 | 90.24 | 45.67 |
| 水稻(对照) Rice (control) | 192955 | 92.22 | 43.57 |
新窗口打开|下载CSV
2.4 SLAF标记开发
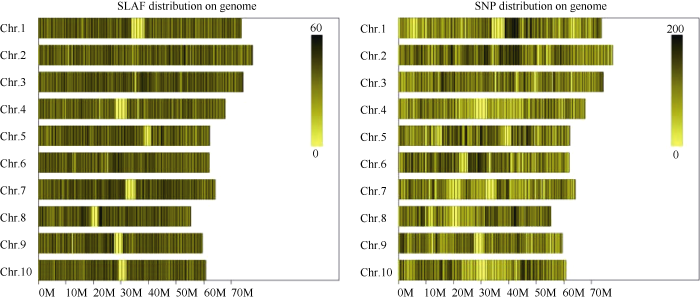
利用参考基因组共开发133,246个SLAF标签, SLAF标签亲本平均测序深度为22.68×, 混池平均测序深度为61.94× (表4); SNP的检测主要使用GATK软件工具包实现, 所有样品的SNP统计信息见表5。统计不同染色体上的SLAF标签与SNP标记的分布(表6); 根据SLAF在染色体上的分布, 绘制SLAF标签和多态性SLAF标签的染色体分布图, 由图3可以看出, 开发的SLAF标记分布较均匀。Table 4
表4
表4SLAF标签统计
Table 4
| 样品编号 Sample ID | SLAF标签数 SLAF number | 测序总深度 Total depth | 平均测序深度 Average depth |
|---|---|---|---|
| 父本 Male parent | 117244 | 2922769 | 24.93× |
| 母本 Female parent | 119317 | 2438178 | 20.43× |
| 混池aa Pool aa | 131993 | 8387924 | 63.55× |
| 混池ab Pool ab | 132818 | 8011244 | 60.32× |
新窗口打开|下载CSV
Table 5
表5
表5SNP信息统计
Table 5
| 样品编号 Sample ID | SNP总数 Total SNP | SNP个数 SNP number | 杂合率 Heterozygote ratio (%) |
|---|---|---|---|
| 父本 Male parent | 319428 | 221552 | 3.42 |
| 母本 Female parent | 319428 | 233073 | 5.54 |
| 混池aa Pool aa | 319428 | 265665 | 48.54 |
| 混池ab Pool ab | 319428 | 312515 | 68.51 |
新窗口打开|下载CSV
Table 6
表6
表6SLAF标签和SNP标记在染色体上的分布统计
Table 6
| 染色体 Chromosome | SLAF标签数 SLAF number | SNP数 SNP number |
|---|---|---|
| Chr.1 | 12565 | 31481 |
| Chr.2 | 14026 | 40153 |
| Chr.3 | 14064 | 35216 |
| Chr.4 | 11159 | 24654 |
| Chr.5 | 10947 | 29394 |
| Chr.6 | 11411 | 31105 |
| Chr.7 | 11939 | 24799 |
| Chr.8 | 10144 | 25585 |
| Chr.9 | 10634 | 27338 |
| Chr.10 | 10933 | 25189 |
| 其他Other | 15424 | 24514 |
| 合计Total | 133246 | 319428 |
新窗口打开|下载CSV
图3
 新窗口打开|下载原图ZIP|生成PPT
图3SLAF标签和SNP标记在染色体上的分布
横坐标为染色体长度, 图中颜色越深的区域即SLAF标签集中分布的区域。左图为SLAF标签的分布图, 右图为SNP标记的分布图。
Fig. 3Distribution of SLAF and SNP on genome
Abscissa represents the length of the chromosome; the darker area is SLAF label concentrated distribution area.
2.5 关联分析
2.5.1 SNP-index方法关联结果 在SNP-index关联分析前, 先从319,428个SNP中, 过滤掉有多重突变的SNP位点、混池中read支持度小于4的位点、亲本中不存在的SNP位点, 最终获得59,407个SNP。利用SNP-index方法[23]计算关联值, 并采用SNPNUM方法对ΔSNP-index进行拟合, 取每个SNP附近200个SNP的ΔSNP-index的中值作为该位点拟合后的关联值。两个混池分别的SNP-index及ΔSNP-index的分布如图4所示:图4
 新窗口打开|下载原图ZIP|生成PPT
图4SNP-index关联值在染色体上的分布
红色的线代表置信度为0.99的阈值线, 蓝色的线代表置信度为0.95的阈值线, 绿色的线代表置信度为0.90的阈值线。
Fig. 4Distribution of SNP-index associated values on genome
The red line represents the threshold line of 0.99. The blue line represents the threshold line of 0.95, and the green line represents the threshold line of 0.90.
根据计算机模拟实验[26]计算结果, 当置信度为0.90时, 定位区域在第9染色体上的54,788,026~ 56,740,873 (1.95 M)区间内(表7)。
Table 7
表7
表7关联区域信息统计表
Table 7
| 染色体 Chromosome | 关联区域起始位置 Start | 关联区域终止位置 End | 关联区域大小 Size (Mb) | 关联区域内的基因数量 Gene number |
|---|---|---|---|---|
| Chr.9 | 54788026 | 56740873 | 1.95 | 265 |
| Total | — | — | 1.95 | 265 |
新窗口打开|下载CSV
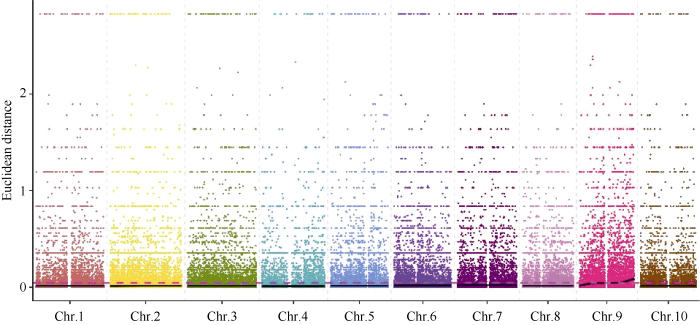
2.5.2 ED方法关联结果 在ED法关联分析前, 先从319,428个SNP中过滤任一混池中read支持度小于4的位点212,186个, 得到高质量的可信SNP位点共107,242个, 并在此基础上识别两混池间差异的位点共100,261个。利用ED方法[24]计算关联值, 并取原始ED的3次方作为关联值以达到消除背景噪音的功能, 然后采用局部线性回归LOESS方法对ED值进行拟合, 关联值分布见图5。
图5
 新窗口打开|下载原图ZIP|生成PPT
图5ED关联值在染色体上的分布
Fig. 5Distribution of ED associated values on genome
取所有位点拟合值的median+3SD作为分析的关联阈值[24], 计算得0.0457, 根据关联阈值判定, 定位区域在第9染色体的30,964,929~38,410,608 (7.45 M)和43,824,552~59,633,348 (15.81 M)区间内(表8)。
Table 8
表8
表8关联区域信息统计表
Table 8
| 染色体 Chromosome | 关联区域起始位置 Start | 关联区域终止位置 End | 关联区域大小 Size (Mb) | 关联区域内的基因数量 Gene number |
|---|---|---|---|---|
| Chr.9 | 30964929 | 38410608 | 7.45 | 44 |
| Chr.9 | 43824552 | 59633348 | 15.81 | 1538 |
| 合计Total | — | — | 23.26 | 1582 |
新窗口打开|下载CSV
2.5.3 候选关联区域筛选与功能分析 对这2种方法取交集, 以期得到更准确的结果, 得到的交集是定位区域在第9染色体上的54,788,026~ 56,740,873区间内, 该关联区域长度1.95 Mb, 在关联区域内共有265个候选基因。针对关联区域内的基因, 分析在外显子区域两个亲本之间差异的SNP信息, 对SNP进行变异的注释(表9), 共发现存在非同义突变的SNP4个, 对应到Sobic.009G197901.1、Sobic.009G213300.1和Sobic.009G221200.1三个基因, 初步确定这些基因是与性状直接相关的功能基因。
Table 9
表9
表9SNP标记信息
Table 9
| 染色体 Chromosome | 位置 Position | 碱基替换 Transform | 基因 Gene |
|---|---|---|---|
| Chr.9 | 55037659 | C→A | Sobic.009G197901.1 |
| Chr.9 | 55037906 | T→G | Sobic.009G197901.1 |
| Chr.9 | 56069487 | T→G | Sobic.009G213300.1 |
| Chr.9 | 56613839 | A→G | Sobic.009G221200.1 |
新窗口打开|下载CSV
2.6 相关连锁分子标记的开发及验证
在4个非同义突变的SNP两端设计引物(表10), 对双亲的基因组DNA进行PCR扩增, 用琼脂糖凝胶电泳检测扩增产物。将扩增产物回收, 测序; 对测序结果进行多序列对比, 获得基因序列特异差异(图6)。分蘖与主茎株高不一致亲本1383和分蘖与主茎株高一致亲本K35-Y5在第55,037,659 bp处分别为A和C; 在第55,037,906 bp处分别为G和T; 在第56,069,487 bp处分别为G和T; 在第56,613,839 bp处分别为G和A。说明这4个SNP是与分蘖与主茎株高一致性状直接相关的。Table 1
表1
表10 引物序列和信息
Table 1
| 引物名称 Primer ID | 引物序列 Forward primer (5'-3') | 引物序列 Reverse primer (5'-3') | 产物大小 Size (bp) |
|---|---|---|---|
| SNP1 | AAAATCACGTGGATAGGCCA | AGATCCGGCAATGATAGTGG | 269 |
| SNP2 | CCACTATCATTGCCGGATCT | ATCTGAGGAAGCAAGCGAGA | 233 |
| SNP3 | GGAGGAAATGCTGTGCTTCT | AAGCGATGGTCCATTGAATC | 245 |
| SNP4 | TGATTCCTTCGTTGGAGGAG | TCACTAACATTGGGCAACCA | 199 |
新窗口打开|下载CSV
图6
 新窗口打开|下载原图ZIP|生成PPT
图6引物SNP1(A)、SNP2(B)、SNP3(C)、SNP4(D)对双亲的测序结果
Fig. 6Sequencing results of the parents with primer SNP1(A), SNP2(B), SNP3(C), and SNP4(D)
3 讨论
对高粱分蘖性已有广泛研究, 影响分蘖性的主要因素有水肥条件、温度、密度等[27]。水肥条件充分, 分蘖期早且长, 分蘖早且多; 不同品种分蘖性具有随播种至分蘖期土壤温度的升高而降低的趋势, 温度高, 生长快, 迅速进入拔节期, 缩短分蘖时期; 在北方地区, 随着种植密度的增加单株分蘖数明显减少, 高粱分蘖性受环境影响较大。但高粱分蘖与主茎的高度差这一性状基本不受环境的影响, 分蘖与主茎高度一致这一性状遗传稳定, 已在适宜高粱机械化育种中应用, 育成一批适宜机械化生产的高粱品种[28]。Upadhyaya等[11]用242份微核心种质与39个标记关联分析, 得出5个标记与熟期或株高关联, 分别位于第6、第9、第10染色体上。Brown等[29]用包含119个单株的RIL群体鉴定得到与株高相关的4个QTL, 分别位于第3、第6、第7、第9染色体上。Shiringani等[30]建立了包含188个单株的RIL群体, 利用157对引物, 得到5个关于株高的QTL, 分别位于第1、第2、第5、第6、第9染色体上。Feltus等[17]利用BTx623×IS3620C的F6-8代作为构图群体, 共检测到9个控制高粱分蘖数的QTL, 多数集中于第1和第6染色体上, 第5、第7和第9染色体上各检测到1个QTL。不同的研究者研究结果不尽相同, 但大多研究结果都关联到第9染色体。本研究对高粱分蘖与主茎株高一致性基因的定位与前人研究结果一致, 所定位到的基因也位于高粱第9染色体上, 说明高粱第9染色体不仅存在分蘖性状的基因, 而且还有分蘖与主茎株高一致性的基因。基于SLAF-seq技术的基因定位, 是集BSA技术、生物信息学和高通量测序技术为一体的一种简单高效的基因定位方法。目前, 利用此类方法定位的有番茄雄性不育基因[31], 甘蓝型油菜抗霜霉病基因[32], 油菜与种子重量高度相关的基因[33]等。本研究利用SLAF-seq技术, 将高粱分蘖与主茎株高一致基因定位于第9染色体上的54,788,026~56,740,873区间内, 关联区域长度1.95 Mb。
4 结论
分蘖与主茎株高一致性状由1对隐性核基因控制。利用SNP-index法和Euclidean distance法及取两者交集进行关联分析, 得到一个关联区域, 位于第9染色体上的54,788,026~56,740,873区间内, 关联区域长度1.95 Mb。在该关联区域内发现4个非同义突变的SNP, 它们和分蘖与主茎株高一致性状相关。对应到Sobic.009G197901.1、Sobic.009G213300.1和Sobic.009G221200.1三个基因上, 这些基因可能是与性状直接相关的功能基因。通过进一步精细定位, 可以确定该目标基因。参考文献 原文顺序
文献年度倒序
文中引用次数倒序
被引期刊影响因子
[本文引用: 1]
[本文引用: 1]
[本文引用: 1]
[本文引用: 1]
[本文引用: 1]
[本文引用: 1]
[本文引用: 1]
[本文引用: 1]
[本文引用: 1]
[本文引用: 1]
DOI:10.2134/agronj1954.00021962004600050007xURL [本文引用: 1]

Height in sorghum is shown to be due to four independently inherited genes, which in the recessive state produce dwarfness, and to a modifying complex. Tallness is partly dominant. One of the recessive height genes is unstable and reverts to the dominant condition at the rate of 1 to 1200.
DOI:10.1139/g94-033URLPMID:18470074 [本文引用: 1]
An F2 population derived from a cross between . bicolor ('CK60') and . drummondii ('PI229828') was used to develop an RFLP genetic linkage map of . The map consists of 201 loci distributed among 10 linkage groups covering a map distance of 1530 cM, with an average 8 cM between adjacent loci. genomic probes (52), cDNA probes (124), and genomic probes (10) were used to define the loci (55, 136, and 10, respectively). Ninety-five percent of the loci fit expected segregation ratios. The loci with distorted segregation ratios were confined almost exclusively to a region of one linkage group. Comparison of and maps indicated high correspondence between the two genomes in terms of loci order and genetic distance. Many loci linked in (45 of 55) were also linked in . Instances of both conserved and rearranged locus orders were detected.
DOI:10.1101/gad.9.17.2193URLPMID:8536986 [本文引用: 1]
Abstract Correspondence among QTLs affecting height and/or flowering was investigated across the five races of sorghum, an interspecific sorghum F2 population, and 32 previously published sorghum, maize, rice, wheat, and barley populations revealing 185 QTLs or discrete mutants. Among nine QTLs mapped in the interspecific sorghum population (six affecting height and three affecting flowering), at least seven (78%) are associated with "conversion," backcross-introgression of alleles imparting reduced height or earlier flowering from cultivated sorghums into one or more exotic Sorghum bicolor races. One chromosomal region was "converted" in all S. bicolar races--in the interspecific F2, this region explained 54.8% of height variation (putatively the Dw2 gene) and 85.7% of flowering time variation (putatively Ma1). Comparative data suggest that Ma1 and Dw2 orthologs influence height and flowering of other Poaceae taxa and support classical dogma that the sorghum phenotypes attributed to Ma1 and Dw2 (respectively) are due to different genetic loci. Other sorghum QTLs also showed correspondence with those in other Poaceae, more frequently than would be expected by chance. Possible homoeologous QTLs were found within both the maize and sorghum genomes. Comparative QTL mapping provides a means to unify, and thereby simplify, molecular analysis of complex phenotypes.
DOI:10.1007/s001220050936URL [本文引用: 1]
Quantitative trait loci (QTLs) for grain quality, yield components and other traits were investigated in two Sorghum caudatum guinea recombinant inbred line (RIL) populations. A total of 16 traits were evaluated (plant height, panicle length, panicle compactness, number of kernels/panicle, thousand-kernel weight, kernel weight/panicle, threshing percentage, dehulling yield, kernel flouriness, kernel friability, kernel hardness, amylose content, protein content, lipid content, germination rate and molds during germination and after harvest) and related to two 113- and 100-point base genetic maps using simple (SIM) and composite (CIM) interval mapping. The number, effects and relative position of QTLs detected in both populations were generally in agreement with the distributions, heritabilities and correlations among traits. Several chromosomal segments markedly affected multiple traits and were suspected of harbouring major genes. The positions of these QTLs are discussed in relation to previously reported studies on sorghum and other grasses. Many QTLs, depending on their relative effects and position, could be used as targets for marker-assisted selection and provide an opportunity for accelerating breeding programmes.
DOI:10.1007/s001220051647URL [本文引用: 1]
Grain-mould is a major problem in grain sorghum utilization as mouldy grain has a reduced quality due to the deterioration of the endosperm and reduced embryo viability. Here, our objective was to use genome mapping to improve knowledge of genetic variation and co-variation for grain-mould incidence and other interrelated agronomic traits. Grain-mould incidence, kernel-milling hardness, grain density, plant height, panicle peduncle length, foliar-disease incidence, and plant color were measured on 125 F5 genotypes derived from a cross of Sureno and RTx430. Quantitative trait loci were detected by means of 130 mapped markers (44 microsatellites, 85 AFLPs, one morphological-trait locus) distributed among ten linkage groups covering 970 cM. One to five QTLs affected each trait, with the exception of grain density for which no QTLs were detected. Grain-mould incidence was affected by five QTLs each accounting for between 10 and 23% of the phenotypic variance. The effects and relative positions of QTLs for grain-mould incidence were in accordance with the QTL distribution of several inter-related agronomic traits (e.g., plant height, peduncle length) and with the correlation between these phenotypic traits and grain-mould incidence. The detection of QTLs for grain-mould incidence was dependent on the environment, which is consistent with heritibility estimates that show strong environmental and genotype X environment effects. Several genomic regions affected multiple traits including one region that affected grain-mould incidence, plant height, panicle peduncle length, and grain-milling hardness, and a second region that influenced grain-mould (in four environments) and plant height. One genomic region, which harbors loci for plant color, influenced the severity of foliar disease symptoms and the incidence of grain-mould in one environment. Collectively QTLs detected in the present population explained between 10% and 55% of the phenotypic variance observed for a given trait.
DOI:10.1139/g2012-034URLPMID:22680231 [本文引用: 2]
Abstract Sorghum is a potential energy crop thanks to its high biomass productivity and low input. Biomass yield in sorghum is defined by height and maturity. To develop molecular breeding tools for genetic improvement of these two traits, we have identified simple sequence repeat markers linked to height and maturity using a pool-based association mapping technique. The sorghum mini core collection was evaluated across five environments for height and maturity. Seven tall and seven short accessions were selected based on their height in all environments. Likewise, six early- and 10 late-maturing accessions were selected mostly based on their maturity in two post-rainy seasons. Two additional height pools were constructed based on phenotypes in one environment. The three pairs of pools were screened with 703 SSR markers and 39 polymorphic markers were confirmed by individual genotyping. Association mapping of the 39 markers with 242 accessions from the mini core collection identified five markers associated with maturity or height. All were clustered on chromosomes 6, 9, and 10 with previously mapped height and maturity markers or QTLs. One marker associated with both height and maturity was 84kb from recently cloned Ma1. These markers will lay a foundation for identifying additional height and maturity genes in sorghum.
DOI:10.1007/s00122-014-2318-7URLPMID:23649651 [本文引用: 1]
Plant height and maturity are two critical traits in sorghum breeding. To develop molecular tools and to identify genes underlying the traits for molecular breeding, we developed 14,739 SNP markers used to genotype the complete sorghum [ Sorghum bicolor (L.) Moench] mini core collection. The collection was evaluated in four rainy and three post-rainy season environments for plant height and maturity. Association analysis identified six marker loci linked to height and ten to maturity in at least two environments with at least two SNPs in each locus. Of these, 14 were in close proximity to previously mapped height/maturity QTL in sorghum. Candidate genes for maturity or plant height close to the marker loci include a sugar transporter ( SbSUC9 ), an auxin response factor ( SbARF3 ), an FLC and FT regulator ( SbMED12 ), and a photoperiod response gene ( SbPPR1 ) for maturity and peroxidase 53, and an auxin transporter ( SbLAX4 ) for plant height. Linkage disequilibrium analysis showed that SbPPR1 and SbARF3 were in regions with reduced sequence variation among early-maturing accessions, suggestive of past purifying selection. We also found a linkage disequilibrium block that existed only among the accessions with short plant height in rainy season environments. The block contains a gene homologous to the Arabidopsis flowering time gene, LUMINIDEPENDENS ( LD ). Functional LD promotes early maturity while mutation delays maturity, affecting plant height. Previous studies also found reduced sequence variations within this gene. These newly-mapped SNP markers will facilitate further efforts to identify plant height or maturity genes in sorghum.
[本文引用: 1]
[本文引用: 1]
[本文引用: 1]
[本文引用: 1]
[本文引用: 1]
DOI:10.1093/aob/mcf152URLPMID:4233856 [本文引用: 1]
Most studies of tiller have not related the physiological and morphological features of each culm to its subsequent fertility. This introduces problems when trying to account for the effects of tillering on yield in crop models. The objective of this study was to detect the most likely early determinants of tiller fertility in by identifying hierarchies for emergence, fertility and grain number of tillers over a wide range of assimilate availabilities. Emergence, phenology, leaf area and dry weight partitioning were quantified weekly for individual tillers and main culms of tillering and uniculm grown at one of four densities, from two to 16 m(-2). For a given plant in any given density, the same tiller hierarchy applied for emergence of tillers, fertility of the emerged tillers and their subsequent grain number. These results were observed over a range of tiller fertility rates (from 7 to 91%), fertile tiller number per plant at maturity (from 0.2 to 4.7), and tiller contribution to grain yield (from 5 to 78 %). Tiller emergence was most probably related to assimilate supply and light quality. , fertility and contribution to yield of a specific tiller were highly dependent on growing conditions at the time of tiller emergence, particularly via early leaf area of the tiller, which affected its subsequent leaf area accumulation. Assimilate availability in the main culm at the time of tiller emergence was the most likely early determinant of subsequent tiller fertility in this study.
[本文引用: 2]
[本文引用: 1]
[本文引用: 1]
[本文引用: 1]
[本文引用: 1]
DOI:10.1128/AEM.01043-13URLPMID:23793624 [本文引用: 1]
Rapid advances in sequencing technology have changed the experimental landscape of microbial ecology. In the last 10 years, the field has moved from sequencing hundreds of 16S rRNA gene fragments per study using clone libraries to the sequencing of millions of fragments per study using next-generation sequencing technologies from 454 and Illumina. As these technologies advance, it is critical to assess the strengths, weaknesses, and overall suitability of these platforms for the interrogation of microbial communities. Here, we present an improved method for sequencing variable regions within the 16S rRNA gene using Illumina's MiSeq platform, which is currently capable of producing paired 250-nucleotide reads. We evaluated three overlapping regions of the 16S rRNA gene that vary in length (i.e., V34, V4, and V45) by resequencing a mock community and natural samples from human feces, mouse feces, and soil. By titrating the concentration of 16S rRNA gene amplicons applied to the flow cell and using a quality score-based approach to correct discrepancies between reads used to construct contigs, we were able to reduce error rates by as much as two orders of magnitude. Finally, we reprocessed samples from a previous study to demonstrate that large numbers of samples could be multiplexed and sequenced in parallel with shotgun metagenomes. These analyses demonstrate that our approach can provide data that are at least as good as that generated by the 454 platform while providing considerably higher sequencing coverage for a fraction of the cost.
DOI:10.1038/nature03895URLPMID:16100779 [本文引用: 1]
Abstract Rice, one of the world's most important food plants, has important syntenic relationships with the other cereal species and is a model plant for the grasses. Here we present a map-based, finished quality sequence that covers 95% of the 389 Mb genome, including virtually all of the euchromatin and two complete centromeres. A total of 37,544 non-transposable-element-related protein-coding genes were identified, of which 71% had a putative homologue in Arabidopsis. In a reciprocal analysis, 90% of the Arabidopsis proteins had a putative homologue in the predicted rice proteome. Twenty-nine per cent of the 37,544 predicted genes appear in clustered gene families. The number and classes of transposable elements found in the rice genome are consistent with the expansion of syntenic regions in the maize and sorghum genomes. We find evidence for widespread and recurrent gene transfer from the organelles to the nuclear chromosomes. The map-based sequence has proven useful for the identification of genes underlying agronomic traits. The additional single-nucleotide polymorphisms and simple sequence repeats identified in our study should accelerate improvements in rice production.
DOI:10.1038/nbt.2095URLPMID:22267009 [本文引用: 3]
The majority of agronomic traits are controlled by multiple genes that cause minor phenotypic effects, making the identification of these genes difficult. Here we introduce MutMap, a method based on whole-genome resequencing of pooled DNA from a segregating population of plants that show a useful phenotype. In MutMap, a mutant is crossed directly to the original wild-type line and then selfed, allowing unequivocal segregation in second filial generation (F
DOI:10.1101/gr.146936.112URLPMID:23299975 [本文引用: 6]
Forward genetic screens in model organisms are vital for identifying novel genes essential for developmental or disease processes. One drawback of these screens is the labor-intensive and sometimes inconclusive process of mapping the causative mutation. To leverage high-throughput techniques to improve this mapping process, we have developed a Mutation Mapping Analysis Pipeline for Pooled RNA-seq (MMAPPR) that works without parental strain information or requiring a preexisting SNP map of the organism, and adapts to differential recombination frequencies across the genome. MMAPPR accommodates the considerable amount of noise in RNA-seq data sets, calculates allelic frequency by Euclidean distance followed by Loess regression analysis, identifies the region where the mutation lies, and generates a list of putative coding region mutations in the linked genomic segment. MMAPPR can exploit RNA-seq data sets from isolated tissues or whole organisms that are used for gene expression and transcriptome analysis in novel mutants. We tested MMAPPR on two known mutant lines in zebrafish, nkx2.5 and tbx1, and used it to map two novel ENU-induced cardiovascular mutants, with mutations found in the ctr9 and cds2 genes. MMAPPR can be directly applied to other model organisms, such as Drosophila and Caenorhabditis elegans, that are amenable to both forward genetic screens and pooled RNA-seq experiments. Thus, MMAPPR is a rapid, cost-efficient, and highly automated pipeline, available to perform mutant mapping in any organism with a well-assembled genome.
URLPMID:2705234 [本文引用: 1]
The enormous amount of short reads generated by the new DNA sequencing technologies call for the development of fast and accurate read alignment programs. A first generation of hash table-based methods has been developed, including MAQ, which is accurate, feature rich and fast enough to align short reads from a single individual. However, MAQ does not support gapped alignment for single-end reads, which makes it unsuitable for alignment of longer reads where indels may occur frequently. The speed of MAQ is also a concern when the alignment is scaled up to the resequencing of hundreds of individuals. We implemented Burrows-Wheeler Alignment tool (BWA), a new read alignment package that is based on backward search with Burrows-Wheeler Transform (BWT), to efficiently align short sequencing reads against a large reference sequence such as the human genome, allowing mismatches and gaps. BWA supports both base space reads, e.g. from Illumina sequencing machines, and color space reads from AB SOLiD machines. Evaluations on both simulated and real data suggest that BWA is approximately 10-20x faster than MAQ, while achieving similar accuracy. In addition, BWA outputs alignment in the new standard SAM (Sequence Alignment/Map) format. Variant calling and other downstream analyses after the alignment can be achieved with the open source SAMtools software package. http://maq.sourceforge.net.
DOI:10.1111/tpj.12105URLPMID:23289725 [本文引用: 1]
The majority of agronomically important crop traits are quantitative, meaning that they are controlled by multiple genes each with a small effect (quantitative trait loci, QTLs). Mapping and isolation of QTLs is important for efficient crop breeding by marker-assisted selection (MAS) and for a better understanding of the molecular mechanisms underlying the traits. However, since it requires the development and selection of DNA markers for linkage analysis, QTL analysis has been time-consuming and labor-intensive. Here we report the rapid identification of plant QTLs by whole-genome resequencing of DNAs from two populations each composed of 20-50 individuals showing extreme opposite trait values for a given phenotype in a segregating progeny. We propose to name this approach QTL-seq as applied to plant species. We applied QTL-seq to rice recombinant inbred lines and F2 populations and successfully identified QTLs for important agronomic traits, such as partial resistance to the fungal rice blast disease and seedling vigor. Simulation study showed that QTL-seq is able to detect QTLs over wide ranges of experimental variables, and the method can be generally applied in population genomics studies to rapidly identify genomic regions that underwent artificial or natural selective sweeps.
[本文引用: 1]
[本文引用: 1]
[本文引用: 1]
[本文引用: 1]
DOI:10.1109/LPT.2002.806092URLPMID:16847662 [本文引用: 1]
The grass inflorescence is the primary food source for humanity, and has been repeatedly shaped by human selection during the domestication of different cereal crops. Of all major cultivated cereals, sorghum [Sorghum bicolor (L.) Moench] shows the most striking variation in inflorescence architecture traits such as branch number and branch length, but the genetic basis of this variation is little understood. To study the inheritance of inflorescence architecture in sorghum, 119 recombinant inbred lines from an elite by exotic cross were grown in three environments and measured for 15 traits, including primary, secondary, and tertiary inflorescence branching. Eight characterized genes that are known to control inflorescence architecture in maize (Zea mays L.) and other grasses were mapped in sorghum. Two of these candidate genes, Dw3 and the sorghum ortholog of ramosa2, co-localized precisely with QTL of large effect for relevant traits. These results demonstrate the feasibility of using genomic and mutant resources from maize and rice (Oryza sativa L.) to investigate the inheritance of complex traits in related cereals.
[本文引用: 1]
[本文引用: 1]
[本文引用: 1]
[本文引用: 1]
[本文引用: 1]
DOI:10.1371/journal.pone.0147580URLPMID:26824525 [本文引用: 1]
Seed weight is a critical and direct trait for oilseed crop seed yield. Understanding its genetic mechanism is of great importance for yield improvement in Brassica napus breeding. Two hundred and fifty doubled haploid lines derived by microspore culture were developed from a cross between a large-seed line G-42 and a small-seed line 7-9. According to the 1000-seed weight (TSW) data, the individual DNA of the heaviest 46 lines and the lightest 47 lines were respectively selected to establish two bulked DNA pools. A new high-throughput sequencing technology, Specific Locus Amplified Fragment Sequencing (SLAF-seq), was used to identify candidate genes of TSW in association analysis combined with bulked segregant analysis (BSA). A total of 1,933 high quality polymorphic SLAF markers were developed and 4 associated markers of TSW were procured. A hot region of ~0.58 Mb at nucleotides 25,401,885-25,985,931 on ChrA09 containing 91 candidate genes was identified as tightly associated with the TSW trait. From annotation information, four genes (GSBRNA2T00037136001, GSBRNA2T00037157001, GSBRNA2T00037129001 and GSBRNA2T00069389001) might be interesting candidate genes that are highly related to seed weight.
