 ,1,*
,1,*QTL mapping of salt and alkaline tolerance-related traits at the germination and seedling stage in maize (Zea mays L.) using three analytical methods
ZHANG Chun-Xiao1, LI Shu-Fang1, JIN Feng-Xue1, LIU Wen-Ping1, LI Wan-Jun2, LIU Jie1,3, LI Xiao-Hui,1,*通讯作者:
收稿日期:2018-08-17接受日期:2019-01-12网络出版日期:2019-02-01
| 基金资助: |
Received:2018-08-17Accepted:2019-01-12Online:2019-02-01
| Fund supported: |
作者简介 About authors

摘要
关键词:
Abstract
Keywords:
PDF (4401KB)元数据多维度评价相关文章导出EndNote|Ris|Bibtex收藏本文
本文引用格式
张春宵, 李淑芳, 金峰学, 刘文平, 李万军, 刘杰, 李晓辉. 用3种方法定位玉米萌发期和苗期的耐盐和耐碱相关性状QTL[J]. 作物学报, 2019, 45(4): 508-521. doi:10.3724/SP.J.1006.2019.83060
ZHANG Chun-Xiao, LI Shu-Fang, JIN Feng-Xue, LIU Wen-Ping, LI Wan-Jun, LIU Jie, LI Xiao-Hui.
玉米(Zea mays L.)的种植面积已跃居我国粮食作物首位[1], 高产及稳产对国家粮食安全起到至关重要的作用。我国的可耕地面积逐渐缩小, 过量施肥、不合理灌溉及环境恶化等多种因素导致土壤盐碱化加重, 盐碱地面积已逾6.7×10⁶ hm2, 成为影响农业生产的第二大灾害, 同时也成为当前阻碍玉米生产的“瓶颈”[2]。围绕耐盐碱相关性状, 定位主效基因并培育具有盐碱抗性的品种是解决上述问题的最有效途径, 意义重大。
近年来, 国内外已围绕耐盐碱性状相继开展了QTL定位研究。管飞翔等[3]利用RA×M5P构建F6分离群体, 在盐、碱、对照3种环境下, 共检测到10个与相对胚根长、相对胚芽长相关的QTL, 响应盐胁迫的2个QTL分别位于第1、第7染色体, 响应碱胁迫的3个QTL分别位于第1、第3染色体, 对照条件下检测到5个QTL分别位于第1、第2、第6、第8、第10染色体。王士磊等[4]选用黄早四与Mo17杂交, 构建F7及F8, 以250 mmol L-1 NaCl为胁迫溶液, 共检测到6个与存活时间、株高变化率、干/鲜重变化率等性状相关的QTL, 它们分别位于第1、第5、第6染色体。马晓军等[5]利用耐碱郑58×碱敏感昌7-2构建的F2分离群体, 在100 mmol L-1 Na2CO3溶液胁迫下调查玉米幼苗耐碱率, 共检测到4个位于第2、第5、第7染色体上的QTL。吴丹丹[6]采用9个表型性状, 包括鲜重(SFW)、干重(SDW)、出苗率(FGR)、组织含水量(TWC)、耐盐指数(STR、FSTR)、钠、钾含量比(SNC/SKC)、地上钠离子含量(SNC)、地上钾离子含量(SKC)等, 共检测到20个加性QTL与盐胁迫相关, 且分布于玉米7条染色体上, 能够解释0.98%~58.33%的变异范围, 其中有5个QTL解释的变异率达到20%以上。Mohammad[7]利用盐敏感材料B73×耐盐CZ-7构建的F2群体, 在对照和200 mmol L-1 NaCl胁迫下调查茎长(SL)、根长(RL)、茎/根长度比(RRLSL)、地上部分鲜重(SFW)、根鲜重(RFW)、植物鲜重(PFW)、地上部分干重(SDW)、根干重(RDW)、植株干重(PDW)、地上部分/根干重(RRDWSDW) 10个性状, 得到16个正常条件下和25个盐胁迫条件下的QTL, 其中14个QTL可解释10%的表型变异。Luo等[8]以PH6WC和PH4CV构建240个DH系的作图群体, 分别在盐池和正常土壤下调查株高并计算耐盐指数, 共检测到26个QTL, 在第1染色体上检测到盐土植株高度(SPH)主效QTL, 可解释表型变异的31.2%。
土壤盐碱化相伴而生, 通常包括以土壤盐度升高为特征的盐化和以土壤pH升高为特征的碱化[9]。尽管玉米对盐、碱的耐性高度相关, 但碱对玉米的伤害程度高于盐。关于玉米苗期耐盐性QTL定位的文章已有大量报道, 但鲜有关于玉米耐碱性QTL的。本研究利用同一套试材, 分别开展耐盐性、耐碱性遗传机制的研究, 力求全面揭示玉米耐盐碱遗传机制, 以利玉米耐盐碱育种。
1 材料与方法
1.1 材料
以全国种植面积连续10年一直保持在3.30×10⁶ hm2以上的玉米杂交种郑单958的双亲, “耐盐碱型”郑58和“盐碱敏感型”昌7-2杂交并通过“单粒传”获得的151份F2:5重组自交系作为试验材料。1.2 试验设计
试验于2015年在吉林省农业科学院公主岭试验基地进行。1.2.1 萌发试验 以151份家系及双亲为试验材料, 从每份材料取30粒种子, 设3次重复, 分别于盐胁迫处理液(200 mmol L-1 NaCl)、碱胁迫处理液(100 mmol L-1 Na2CO3, pH 11.17)及对照(蒸馏水)中。于光照培养箱中暗培养, 温度为25℃, 湿度为60%。
1.2.2 苗期试验 151份家系及双亲每份选取30粒种子、3次重复, 种植于装有蛭石的营养钵(直径9 cm), 置光照培养箱中。培养条件为16 h光照及8 h黑暗交替, 湿度为60%, 温度为(25±2)℃/(20±2)℃昼/夜交替, 光强为50~60 μmol m-2 s-1。待幼苗长至三叶一心时, 使用盐胁迫液(200 mmol L-1 NaCl)或碱胁迫液(100 mmol L-1 Na2CO3)浇灌, 对照为浇灌霍格兰营养液, 以蛭石持水量的2倍为浇灌量。
1.3 表型测定
1.3.1 萌发试验 培养7 d后测定151份家系及双亲发芽率。遵照《粮油检验发芽试验GB/T 5520-2011》, 以幼根达籽粒长、幼芽至少达籽粒长的1/2为发芽标准, 调查记载种子的发芽率[10]。1.3.2 苗期试验 胁迫4 d后调查统计每个家系及亲本的苗期耐盐率(STR)或耐碱率(ATR)。用数字0~5级来表示幼苗叶片的盐碱伤害程度, 统计F2:5重组自交系耐盐碱指数。0级, 幼苗生长正常, 没有盐碱害症状; 1级, 幼苗生长受盐碱害较轻, 仅叶尖焦枯; 2级, 幼苗30%的叶片枯黄或失绿; 3级, 幼苗50%的叶片枯黄或失绿; 4级, 幼苗大部分枯黄仅心叶绿; 5级, 幼苗完全枯死[11]。
以幼苗地上部分伸直后最高点的高度为株高(PH)[12]。
取完整植株, 用蒸馏水快速冲洗掉蛭石和灰尘, 滤纸吸干植株表面残留水分, 称鲜重(FW), 放入烘箱中, 105℃杀青20 min后80℃烘干至恒重, 称干重(DW)[13]。
根据称得的鲜重、干重, 计算玉米幼苗组织含水量(TWC)[14]。
将烘干后的地上部分磨成粉末, 采用火焰分光光度计法, 测定幼苗的地上部分钠含量(SNC)、钾含量(SKC)、钠/钾含量比(NKR)。
1.4 基因分型和连锁图谱构建
采用CTAB法提取151份F2:5重组自交系及双亲本叶片DNA, 通过琼脂糖凝胶电泳及分光光度计(Nanodrop 2000)检测DNA的质量。对符合要求的DNA样品, 通过MaizeSNP 3072微阵列[15]进行基因型分析。对具有多态性的SNPs数据, 使用QTL IciMapping 3.3[16]构建遗传连锁图谱, 设置最小LOD值为3.0, 且用Kosambifunction[17]功能来启动程序, 用厘摩(cM)来表示图谱上标记的间距。1.5 数据分析及QTL定位
依靠SPSS 22.0软件(SPSS Inc, Chicago, USA)统计分析表型数据和检验相关性。分别利用QTL Cartographer 2.5软件[18]、QTL IciMapping v3.3软件及QTL Network 2.1[9]软件中的复合区间作图法(CIM, composite interval mapping)、完备区间作图法(inclusive composite interval mapping, ICIM)和基于混合线性模型的复合区间作图法(mixed composite interval mapping, MCIM)进行耐盐或耐碱QTL定位分析。采用CIM和ICIM进行加性QTL定位时, 设阈值LOD=2.5, 采用MCIM进行耐盐性或耐碱性相关性状定位加性QTL及QTL与处理间的互作时设临界阈值P=0.05。参照McCouch等[20]的方式命名上述QTL。2 结果与分析
2.1 表型变异与性状相关分析
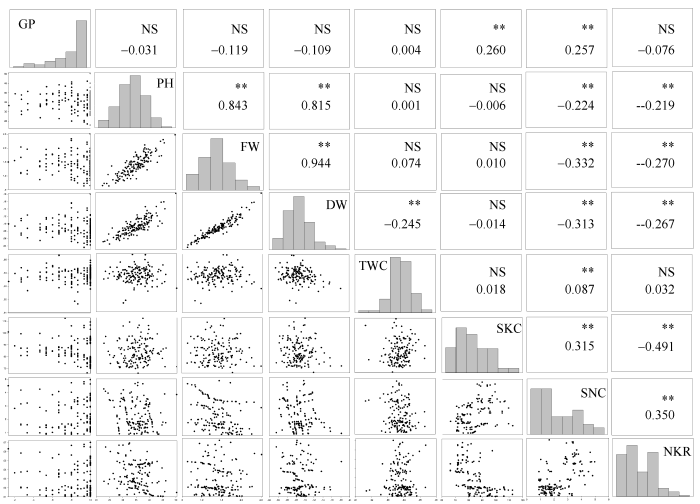
表1表明, 对照条件下, 6个指标GP、PH、FW、DW、TWC、SKC在双亲间差异不大, 均未达到显著水平。盐胁迫条件下, 6个指标PH、FW、STR、SKC、SNC、NKR在双亲间表现出显著或极显著差异; 碱胁迫条件下, 8个指标GP、PH、FW、DW、ATR、SKC、SNC、NKR在双亲间表现出显著或极显著差异, 二者均为QTL分析提供了较好的遗传背景; 胁迫条件下, SNC、NKR等指标值均大于对照值。而盐、碱胁迫条件下, 除了TWC其余性状各表型值的变异系数均超过10%, 且存在超亲分离家系。除了盐胁迫条件下的TWC外, 其余性状各表型值基本符合正态分布, 峰度、偏斜度的绝对值≤1.0 (图1~图3)。Table 1
表1
表1苗期151个家系以及亲本在对照、盐及碱处理条件下各性状的表型值
Table 1
| 性状 Trait | 处理 Treatment | 亲本Parents | 重组自交系群体 RIL populations | |||||||
|---|---|---|---|---|---|---|---|---|---|---|
| 郑58 Zheng 58 | 昌7-2 Chang 7-2 | 均值 Mean | 最小值 Min. | 最大值 Max. | 变异系数 CV (%) | 偏度 Kurtosis | 峰度 Skewness | |||
| 发芽率 | 对照N | 1.00 | 1.00 | 0.83 | 0.13 | 1.00 | 25.62 | -1.36 | 1.06 | |
| GP (%) | 盐胁迫S | 0.40 | 0.33* | 0.50 | 0.00 | 1.00 | 54.30 | -0.10 | -1.07 | |
| 碱胁迫A | 0.60 | 0.33** | 0.26 | 0.00 | 0.73 | 65.21 | 0.61 | 0.03 | ||
| 株高 | 对照N | 30.50 | 32.20 | 35.34 | 22.90 | 50.30 | 13.64 | -0.03 | 0.20 | |
| PH (cm) | 盐胁迫S | 34.10 | 26.65** | 34.03 | 21.35 | 49.40 | 15.10 | 0.17 | -0.11 | |
| 碱胁迫A | 29.95 | 20.50** | 27.53 | 18.00 | 40.50 | 16.46 | 0.54 | 0.12 | ||
| 地上鲜重 | 对照N | 1.18 | 1.38 | 1.41 | 0.64 | 2.51 | 25.93 | 0.25 | -0.14 | |
| FW (g) | 盐胁迫S | 0.91 | 0.64** | 1.20 | 0.48 | 2.74 | 30.80 | 0.67 | 1.41 | |
| 碱胁迫A | 0.99 | 0.75* | 0.99 | 0.46 | 2.09 | 31.23 | 1.03 | 1.16 | ||
| 地上干重 | 对照N | 0.09 | 0.09 | 0.09 | 0.04 | 0.18 | 27.37 | 0.72 | 1.29 | |
| DW (g) | 盐胁迫S | 0.07 | 0.07 | 0.10 | 0.04 | 0.23 | 27.50 | 0.93 | 2.32 | |
| 碱胁迫A | 0.08 | 0.06* | 0.07 | 0.03 | 0.16 | 27.24 | 0.94 | 1.04 | ||
| 组织含水量 | 对照N | 0.92 | 0.93 | 0.94 | 0.92 | 0.95 | 0.57 | -0.44 | 0.95 | |
| TWC (%) | 盐胁迫S | 0.91 | 0.88 | 0.91 | 0.85 | 0.94 | 1.30 | -1.38 | 4.47 | |
| 碱胁迫A | 0.90 | 0.93 | 0.92 | 0.89 | 0.96 | 1.04 | -0.42 | 0.61 | ||
| 耐盐率STR | 盐胁迫S | 2.80 | 4.00** | 2.86 | 1.56 | 4.30 | 19.10 | 0.30 | -0.30 | |
| 耐碱率ATR | 盐胁迫A | 1.67 | 3.22** | 2.17 | 1.00 | 4.78 | 41.52 | 0.35 | -0.67 | |
| 钾含量 | 对照N | 82.45 | 81.40 | 81.43 | 66.32 | 112.52 | 48.91 | 0.66 | -0.05 | |
| SKC (mg g-1) | 盐胁迫S | 9.13 | 8.42 | 9.18 | 6.64 | 11.88 | 10.60 | 0.04 | 0.12 | |
| 碱胁迫A | 9.25 | 7.91 | 9.04 | 6.83 | 11.71 | 10.89 | 0.27 | -0.55 | ||
| 钠含量 | 对照N | 2.02 | 3.16* | 2.23 | 0.88 | 4.97 | 39.18 | 0.63 | -0.64 | |
| SNC (mg g-1) | 盐胁迫S | 59.70 | 71.02** | 69.14 | 42.18 | 105.13 | 18.40 | 0.28 | -0.32 | |
| 碱胁迫A | 23.91 | 39.38** | 37.99 | 24.38 | 79.70 | 28.24 | -0.08 | -0.28 | ||
| 钠钾比 | 对照N | 0.02 | 0.04** | 0.03 | 0.01 | 0.06 | 37.18 | 0.45 | -0.59 | |
| NKR (%) | 盐胁迫S | 0.15 | 0.12* | 7.62 | 4.50 | 13.45 | 59.90 | -0.53 | -1.02 | |
| 碱胁迫A | 2.59 | 4.98** | 4.36 | 1.34 | 9.24 | 29.40 | -0.15 | -0.48 | ||
新窗口打开|下载CSV
图1
 新窗口打开|下载原图ZIP|生成PPT
图1F2:5群体对照条件下相关性状的相关性分析与频数分布
*和**分别表示在5%和1%; NS: 不显著; 缩写同
Fig. 1Correlation analysis and frequency distribution of related traits of F2:5 in N treatment
* and ** significant at the 5% and 1% probability levels, respectively; NS: no significant. Abbreviations are the same as those given in
图2
 新窗口打开|下载原图ZIP|生成PPT
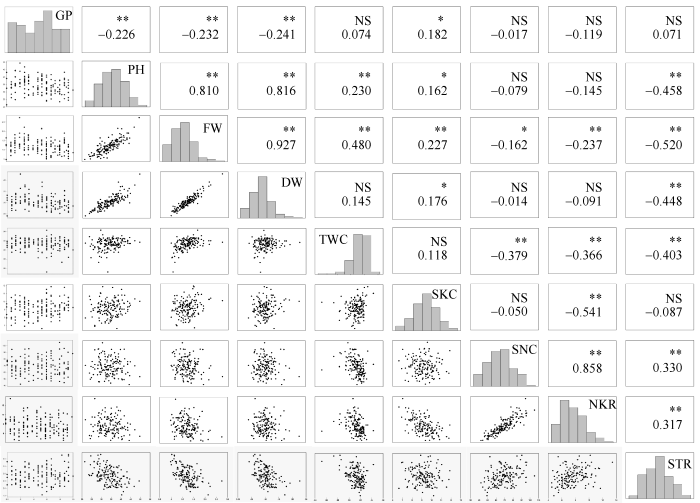
图2F2:5群体盐胁迫条件下耐盐相关性状的相关性分析与频数分布
*和**分别表示在 5%和1%水平显著性; NS: 不显著; 缩写同
Fig. 2Correlation analysis and frequency distribution of salt tolerance-related traits of F2:5 in salt treatment
* and ** significant at the 5% and 1% probability levels, respectively; NS: no significant. Abbreviations are the same as those given in
图3
 新窗口打开|下载原图ZIP|生成PPT
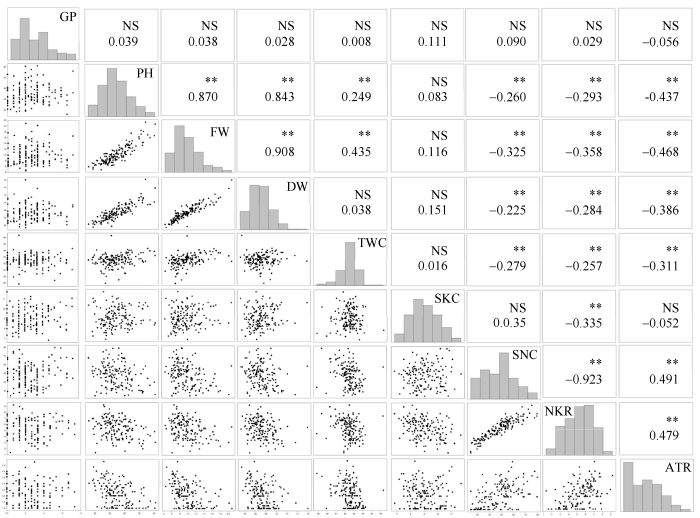
图3F2:5群体碱胁迫条件下耐碱相关性状的相关性分析与频数分布
*和**分别表示在5%和1%水平显著性; NS: 不显著; 缩写同
Fig. 3Correlation analysis and frequency distribution of alkali tolerance-related traits of F2:5 in alkaline treatment
* and ** significant at the 5% and 1% probability levels, respectively; NS: no significant. Abbreviations are the same as those given in
2.2 玉米苗期盐/碱胁迫条件下相关表型性状的相关分析
综合分析图1至图3, 碱胁迫与盐胁迫条件下GP间呈极显著正相关, 相关系数为0.67; 在碱胁迫条件下, PH与盐胁迫下PH、FW、DW呈极显著正相关, 相关系数依次为0.49、0.37、0.33; 在碱胁迫条件下, FW与盐胁迫下PH、FW、DW呈极显著正相关, 相关系数依次为0.45、0.40、0.39; 在碱胁迫条件下, DW与盐胁迫下PH、FW、DW呈极显著正相关, 相关系数依次为0.46、0.43、0.46。与对照条件下各性状表型值相比, 耐碱相关性状降低较耐盐明显, 碱胁迫下ATR降低幅度大于盐胁迫下STR, 表明与盐胁迫相比, 玉米对Na2CO3胁迫更加敏感且伤害更严重。两胁迫下SKC相当而SNC差异较大, 说明Na+、K+的吸收和运输是相互独立的两个过程, 玉米盐、碱胁迫可能是两种性质不同的胁迫。2.3 遗传连锁图谱构建
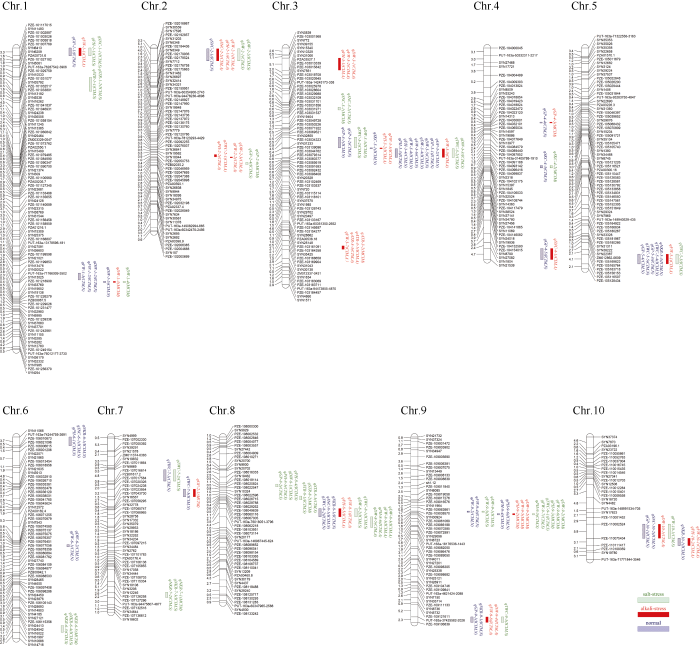
用151个F2:5 RILs群体构建连锁图谱, 从3072个SNP标记中筛选出1407个有效多态性标记, 使用IciMapping 3.3软件绘图(图4), 该图谱总长度1145.42 cM, SNP标记分布于玉米10条染色体上, 各染色体标记数是84~191个, 标记间的平均距离为0.81 cM。图4
 新窗口打开|下载原图ZIP|生成PPT
图4基于SNP标记的玉米遗传连锁图谱
Fig. 4Maize genetic linkage map based on SNP markers
2.4 玉米耐盐、耐碱相关性状的QTL定位分析
2.4.1 利用CIM对玉米耐盐、耐碱相关性状的QTL定位分析 在3种条件下, 分别检测到27、28、40个加性QTL (附表1)。在自然条件下, 27个QTL分布于玉米第1~第7和第9染色体, LOD值在2.6~17.9之间, 能够解释2.3%~26.2%的变异; 在盐胁迫条件下, 28个QTL遍布于玉米10条染色体, LOD值在2.5~7.3之间, 能够解释2.0%~11.4%的变异; 在碱胁迫条件下, 40个QTL遍布于玉米10条染色体, LOD值在2.6~9.3之间, 能够解释2.1%~25.4%的变异。Supplementary table 1
附表1
附表1基于CIM模型的耐盐、耐碱 QTL定位
Supplementary table 1
| QTL | 性状 Trait | 处理 Treatment | 染色体 Chr. | 位置 Position (cM) | 左标记 Left marker | 右标记 Right marker | 置信区间 LOD | 加性效应 Additive | 贡献率 R2 |
|---|---|---|---|---|---|---|---|---|---|
| qGP-1-2 | GP | N | 1 | 118.1 | SYN15309 | SYN25375 | 3.26 | 0.54 | 2.40 |
| qGP-3-2 | GP | N | 3 | 52.4 | PZE-103034323 | SYN31233 | 8.01 | -0.50 | 3.00 |
| qGP-4-4 | GP | N | 4 | 34.1 | PZE-104022472 | PZE-104023120 | 4.28 | 0.90 | 9.30 |
| qGP-5-4 | GP | N | 5 | 118.5 | PZE-105156153 | PZE-105116507 | 7.85 | -0.85 | 4.13 |
| qGP-7-3 | GP | N | 7 | 78.5 | PZE-107136612 | SYN18602 | 2.64 | -0.46 | 6.55 |
| qGP-2-3 | GP | S | 2 | 64.8 | PZE-102076037 | SYN36641 | 4.44 | 1.04 | 9.07 |
| qGP-5-1 | GP | S | 5 | 12.3 | SYN3124 | SYN29224 | 3.67 | -0.29 | 4.57 |
| qGP-5-2 | GP | S | 5 | 67.0 | PUT-163a-148940529-435 | PZE-105164922 | 2.58 | 0.02 | 2.05 |
| qGP-8-1 | GP | S | 8 | 33.8 | PZE-108018114 | PZE-108020824 | 2.81 | -0.36 | 5.06 |
| qGP-1-3 | GP | A | 1 | 121.5 | SYN36600 | PZE-101199598 | 5.12 | 0.50 | 3.60 |
| qGP-2-1 | GP | A | 2 | 37.8 | SYN8349 | PZE-102179936 | 3.83 | 0.53 | 9.56 |
| qGP-4-1 | GP | A | 4 | 0.0 | PZE-104000045 | PUT-163a-50332311-2217 | 2.63 | -0.47 | 5.59 |
| qGP-7-2 | GP | A | 7 | 21.9 | PZE-107017584 | PZE-107020326 | 6.53 | 0.73 | 16.02 |
| qPH-1-2 | PH | N | 1 | 81.4 | PZE-101060842 | SYN29464 | 2.61 | -0.82 | 5.47 |
| qPH-2-3 | PH | N | 2 | 81.2 | SYN30561 | SYN11378 | 4.08 | -0.72 | 5.95 |
| qPH-3-4 | PH | N | 3 | 55.3 | PZE-103139096 | PZE-103044762 | 3.08 | -0.71 | 2.70 |
| qPH-6-1 | PH | N | 6 | 1.0 | SYN11566 | PUT-163a-74244759-3691 | 2.73 | 4.12 | 8.19 |
| qPH-9-4 | PH | N | 9 | 37.1 | PZE-109061069 | PZE-109066188 | 3.53 | 1.66 | 9.59 |
| qPH-1-1 | PH | S | 1 | 23.0 | PZE-101117015 | SYN11490 | 2.61 | -1.76 | 5.58 |
| qPH-6-3 | PH | S | 6 | 104.0 | SYN27121 | PZE-106115356 | 3.33 | 1.43 | 7.16 |
| qPH-8-3 | PH | S | 8 | 33.8 | PZE-108018114 | PZE-108020824 | 4.64 | 1.55 | 11.43 |
| qPH-9-5 | PH | S | 9 | 37.1 | PZE-109061069 | PZE-109066188 | 3.68 | 1.70 | 6.26 |
| qPH-2-2 | PH | A | 2 | 66.7 | PZE-102050753 | PZB02035.2 | 2.68 | -0.80 | 4.75 |
| qPH-3-1 | PH | A | 3 | 7.2 | SYN39155 | SYN15340 | 3.58 | -0.29 | 2.65 |
| qPH-5-1 | PH | A | 5 | 33.6 | SYN1390 | SYN34468 | 3.05 | 1.48 | 7.17 |
| qPH-8-2 | PH | A | 8 | 30.2 | SYN20702 | PZE-108016333 | 5.47 | 1.50 | 5.27 |
| qPH-10-1 | PH | A | 10 | 59.5 | PZE-110075434 | PZE-110111417 | 6.64 | 3.08 | 8.10 |
| qFW-1-3 | FW | N | 1 | 130.3 | SYN13476 | SYN30022 | 2.96 | 0.98 | 3.43 |
| qFW-3-6 | FW | N | 3 | 59.3 | PZE-103139096 | PZE-103044762 | 2.69 | -1.90 | 26.16 |
| qFW-6-1 | FW | N | 6 | 77.2 | PZE-106074560 | PZE-106075137 | 2.94 | -0.70 | 5.16 |
| qFW-7-2 | FW | N | 7 | 39.9 | SYN29953 | SYN18186 | 4.49 | -1.02 | 10.65 |
| qFW-9-2 | FW | N | 9 | 36.1 | PZE-109038570 | SYN30924 | 3.90 | 1.21 | 5.83 |
| qFW-3-1 | FW | S | 3 | 4.2 | SYN772 | SYN39155 | 2.73 | 1.05 | 4.06 |
| qFW-9-7 | FW | S | 9 | 37.1 | PZE-109061069 | PZE-109066188 | 4.03 | 1.33 | 11.16 |
| qFW-10-1 | FW | S | 10 | 57.6 | PZE-110002524 | PZE-110075434 | 4.74 | -1.86 | 2.49 |
| qFW-1-1 | FW | A | 1 | 5.0 | PZE-101117015 | SYN11490 | 3.06 | 3.45 | 25.45 |
| qFW-2-2 | FW | A | 2 | 68.1 | PZB02035.2 | PZE-102046959 | 6.61 | -0.57 | 8.51 |
| qFW-3-2 | FW | A | 3 | 8.2 | SYN39155 | SYN15340 | 2.83 | -0.34 | 3.37 |
| qFW-3-5 | FW | A | 3 | 57.3 | PZE-103139096 | PZE-103044762 | 2.71 | -0.38 | 2.89 |
| qFW-3-7 | FW | A | 3 | 107.0 | SYN31043 | SYN30138 | 2.95 | 0.89 | 5.16 |
| qFW-5-1 | FW | A | 5 | 117.5 | PZE-105156153 | PZE-105116507 | 3.46 | -0.99 | 3.40 |
| qFW-10-2 | FW | A | 10 | 59.5 | PZE-110075434 | PZE-110111417 | 8.75 | 2.85 | 18.78 |
| qDW-1-1 | DW | N | 1 | 79.5 | PZE-101058154 | SYN11245 | 2.81 | -0.61 | 4.60 |
| qDW-1-5 | DW | N | 1 | 130.9 | PUT-163a-71766009-3502 | SYN13025 | 4.01 | 0.81 | 8.07 |
| qDW-3-5 | DW | N | 3 | 58.3 | PZE-103139096 | PZE-103044762 | 2.58 | -1.33 | 16.57 |
| qDW-6-2 | DW | N | 6 | 77.2 | PZE-106074560 | PZE-106075137 | 3.37 | -0.40 | 4.61 |
| qDW-7-1 | DW | N | 7 | 32.4 | PZE-107065747 | PZE-107068965 | 4.55 | -0.71 | 11.44 |
| qDW-2-1 | DW | S | 2 | 1.4 | SYN30559 | SYN17595 | 2.81 | 2.93 | 7.34 |
| qDW-8-1 | DW | S | 8 | 33.8 | PZE-108018114 | PZE-108020824 | 2.53 | 0.68 | 6.95 |
| qDW-2-3 | DW | A | 2 | 68.1 | PZB02035.2 | PZE-102046959 | 2.69 | -0.34 | 5.05 |
| qDW-3-1 | DW | A | 3 | 7.2 | SYN39155 | SYN15340 | 3.68 | -0.30 | 5.70 |
| qDW-3-2 | DW | A | 3 | 12.3 | SYN10329 | SYN31006 | 3.19 | -0.39 | 5.80 |
| qDW-6-1 | DW | A | 6 | 22.6 | PZE-106010873 | PZE-106021096 | 3.22 | -0.17 | 2.97 |
| qDW-8-5 | DW | A | 8 | 59.5 | PZE-108103951 | PZE-108073114 | 3.88 | 2.21 | 24.44 |
| qDW-10-1 | DW | A | 10 | 58.5 | PZE-110002524 | PZE-110111417 | 9.31 | 1.46 | 2.51 |
| qTWC-5-1 | TWC | N | 5 | 53.4 | PZE-105134931 | PZE-105146550 | 3.01 | -1.20 | 7.84 |
| qTWC-5-5 | TWC | N | 5 | 119.5 | PZE-105156153 | PZE-105116507 | 3.96 | -4.43 | 9.93 |
| qTWC-7-1 | TWC | N | 7 | 17.7 | SYN9669 | PZE-107016614 | 3.64 | -1.14 | 4.88 |
| qTWC-3-2 | TWC | S | 3 | 38.4 | PZE-103034323 | SYN31233 | 7.32 | 0.21 | 2.03 |
| qTWC-7-2 | TWC | S | 7 | 17.7 | SYN9669 | PZE-107016614 | 6.41 | 0.17 | 2.74 |
| qTWC-9-2 | TWC | S | 9 | 40.3 | PZE-109070385 | PZE-109072991 | 3.20 | 0.35 | 10.31 |
| qTWC-2-1 | TWC | A | 2 | 66.7 | PZE-102050753 | PZB02035.2 | 2.74 | -1.23 | 4.26 |
| qTWC-3-4 | TWC | A | 3 | 88.7 | PUT-163a-60351350-2652 | PZE-103149597 | 4.45 | 3.11 | 12.83 |
| qTWC-5-2 | TWC | A | 5 | 75.3 | PZE-105166634 | PZE-105180267 | 3.30 | -2.57 | 8.93 |
| qSNC-2-4 | SNC | S | 2 | 42.6 | PZE-102176758 | PZE-102175663 | 3.48 | -3.85 | 2.34 |
| qSNC-3-2 | SNC | S | 3 | 25.8 | PZE-103028604 | PZE-103029988 | 2.71 | -4.30 | 7.78 |
| qSNC-3-4 | SNC | S | 3 | 34.0 | PZE-103049728 | PZE-103050226 | 2.70 | -3.85 | 6.59 |
| qSNC-1-3 | SNC | A | 1 | 146.6 | SYN11155 | SYN3285 | 3.12 | 3.84 | 4.33 |
| qSNC-2-2 | SNC | A | 2 | 8.3 | SYN30559 | SYN17595 | 4.70 | 6.38 | 13.78 |
| qSNC-3-5 | SNC | A | 3 | 98.2 | SYN25148 | PZE-103161091 | 3.28 | -4.48 | 6.99 |
| qSNC-4-1 | SNC | A | 4 | 109.1 | SYN1804 | SYN21539 | 3.63 | -1.95 | 8.23 |
| qSNC-10-1 | SNC | A | 10 | 11.6 | PZE-110052763 | PZE-110037004 | 2.75 | 3.35 | 2.07 |
| qSKC-1-1 | SKC | N | 1 | 60.0 | SYN35792 | PZE-101032517 | 2.93 | 12.79 | 8.04 |
| qSKC-4-3 | SKC | N | 4 | 52.8 | PZE-104102175 | SYN1845 | 2.86 | -12.01 | 7.64 |
| qSKC-4-4 | SKC | S | 4 | 54.9 | PZE-104108744 | SYN14363 | 2.74 | -7.15 | 3.07 |
| qSKC-5-1 | SKC | A | 5 | 14.2 | SYN37537 | PZE-105022648 | 2.58 | -1.45 | 4.46 |
| qSKC-5-2 | SKC | A | 5 | 67.0 | PUT-163a-148940529-435 | PZE-105164922 | 3.64 | -4.49 | 9.48 |
| qSKC-5-3 | SKC | A | 5 | 79.8 | PZE-105180266 | SYN31311 | 3.29 | 3.42 | 10.38 |
| qSKC-9-1 | SKC | A | 9 | 31.9 | PZE-109019058 | PZE-109016576 | 2.69 | -1.13 | 4.47 |
| qSKC-10-1 | SKC | A | 10 | 35.7 | PZE-110001452 | PZE-110002524 | 2.73 | -0.73 | 2.10 |
| qNKR-4-1 | NKR | N | 4 | 27.9 | SYN33243 | PZE-104018854 | 10.86 | -0.10 | 3.30 |
| qNKR-5-2 | NKR | N | 5 | 100.4 | PZE-105163718 | PZE-105156153 | 17.94 | 0.14 | 2.33 |
| qNKR-1-1 | NKR | S | 1 | 77.1 | SYN24238 | SYN36556 | 2.67 | 0.88 | 4.75 |
| qNKR-6-2 | NKR | S | 6 | 90.6 | PZB00942.1 | PZE-106088503 | 3.19 | 0.68 | 5.86 |
| qNKR-6-3 | NKR | S | 6 | 112.1 | SYN31997 | SYN10686 | 2.57 | 0.97 | 7.05 |
| qNKR-7-2 | NKR | S | 7 | 72.2 | PZE-107127296 | PUT-163a-94475607-4877 | 4.54 | 1.27 | 11.02 |
| qNKR-4-2 | NKR | A | 4 | 71.3 | SYN19936 | PZE-104152590 | 2.65 | 0.21 | 3.84 |
| qSTR-1-1 | STR | S | 1 | 42.2 | SYN6209 | PZE-101027182 | 2.84 | -1.59 | 5.56 |
| qSTR-1-3 | STR | S | 1 | 90.7 | PZE-101090700 | SYN21374 | 2.73 | 1.63 | 5.97 |
| qSTR-2-1 | STR | S | 2 | 69.0 | PZE-102047695 | PZE-102047388 | 3.11 | 1.22 | 7.32 |
| qSTR-8-3 | STR | S | 8 | 39.8 | PZE-108028788 | PZE-108060116 | 3.35 | -1.57 | 2.73 |
| qATR-2-1 | ATR | A | 2 | 72.4 | SYN26838 | SYN9944 | 2.66 | 0.93 | 3.12 |
| qATR-3-3 | ATR | A | 3 | 107.0 | SYN31043 | SYN30138 | 6.34 | -3.46 | 4.61 |
| qATR-5-1 | ATR | A | 5 | 32.1 | SYN35104 | PZE-105105471 | 3.34 | -2.83 | 7.23 |
| qATR-5-2 | ATR | A | 5 | 39.9 | PZA00300.16 | PZE-105110447 | 2.74 | -2.74 | 6.72 |
新窗口打开|下载CSV
2.4.2 利用ICIM对玉米耐盐、耐碱相关性状的加性QTL定位分析 由附表2可知, 在自然条件下, 共检测到遍布于玉米10条染色体上的28个QTL, LOD值分布在2.7~9.6之间, 分别解释性状变异的1.5%~14.4 %; 在盐胁迫条件下, 共检测到遍布于玉米第1~第3、第5~第9染色体上的23个QTL, LOD值分布在2.7~7.1之间, 分别解释性状变异的1.0%~12.1%; 在碱胁迫条件下, 共检测到遍布于玉米第2、第3、第5、第8和第9染色体上的17个QTL, LOD值分布在2.5~ 5.2之间, 分别解释性状变异的1.3%~16.3%。
Supplementary table 2
附表2
附表2附基于ICIM模型的耐盐、耐碱QTL定位
Supplementary table 2
| QTL | 性状 Trait | 处理 Treatment | 染色体 Chr. | 位置 Position (cM) | 左标记 Left marker | 右标记 Right marker | 置信区间 LOD | 加性效应 Additive | 贡献率 PVE (%) |
|---|---|---|---|---|---|---|---|---|---|
| qGP-1-1 | GP | N | 1 | 4.9 | PZE-101117015 | SYN11490 | 7.72 | -0.27 | 1.63 |
| qGP-3-1 | GP | N | 3 | 50.8 | PZE-103034323 | SYN31233 | 4.93 | -0.28 | 1.59 |
| qGP-4-5 | GP | N | 4 | 109 | SYN1804 | SYN21539 | 4.45 | -0.25 | 1.72 |
| qGP-5-3 | GP | N | 5 | 115.9 | PZE-105156153 | PZE-105116507 | 6.46 | -0.26 | 1.66 |
| qGP-9-1 | GP | N | 9 | 130.8 | PUT-163a-37425582-2026 | PZE-109106839 | 3.87 | -0.27 | 1.53 |
| qGP-10-1 | GP | N | 10 | 53.8 | PZE-110002524 | PZE-110075434 | 6.3 | -0.29 | 1.53 |
| qGP-2-4 | GP | S | 2 | 70.0 | PZE-102045898 | PZA00590.1 | 4.03 | 0.09 | 12.12 |
| qGP-2-2 | GP | A | 2 | 64.3 | PZE-102092255 | PZE-102076037 | 2.95 | 0.05 | 8.70 |
| qPH-3-3 | PH | N | 3 | 55.3 | PZE-103139096 | PZE-103044762 | 4.29 | -3.71 | 8.71 |
| qPH-8-1 | PH | N | 8 | 9.5 | PZE-108003557 | SYN27442 | 5.47 | 1.66 | 11.02 |
| qPH-8-7 | PH | N | 8 | 99.9 | PZE-108131283 | PUT-163a-60347965-2588 | 2.73 | -1.19 | 5.3 |
| qPH-9-6 | PH | N | 9 | 37.6 | PZE-109061069 | PZE-109066188 | 5.75 | 1.77 | 11.68 |
| qPH-6-2 | PH | S | 6 | 104.0 | SYN4185 | SYN27121 | 2.67 | 1.28 | 7.40 |
| qPH-8-4 | PH | S | 8 | 34.4 | PZE-108018114 | PZE-108020824 | 3.45 | 1.52 | 10.36 |
| qPH-9-1 | PH | S | 9 | 36.8 | SYN30924 | PZE-109061069 | 3.15 | 1.45 | 8.89 |
| qPH-2-1 | PH | A | 2 | 5.5 | SYN30559 | SYN17595 | 2.69 | 3.88 | 5.55 |
| qPH-3-2 | PH | A | 3 | 55.2 | SYN31233 | PZE-103139096 | 3.02 | -3.25 | 6.33 |
| qPH-5-2 | PH | A | 5 | 36.3 | PZE-105121226 | PZE-105116521 | 2.54 | 1.18 | 1.26 |
| qPH-8-5 | PH | A | 8 | 54.1 | PZE-108062218 | PZE-108103951 | 4.43 | 3.51 | 7.41 |
| qPH-8-6 | PH | A | 8 | 60.6 | PZE-108103951 | PZE-108073114 | 3.52 | 3.59 | 6.74 |
| qPH-9-7 | PH | A | 9 | 37.7 | PZE-109066188 | PZE-109070385 | 3.74 | 1.49 | 1.89 |
| qFW-1-2 | FW | N | 1 | 129.7 | SYN13476 | SYN30022 | 2.8 | 0.1 | 5.93 |
| qFW-3-4 | FW | N | 3 | 56.3 | PZE-103139096 | PZE-103044762 | 3.62 | -0.26 | 13.76 |
| qFW-9-4 | FW | N | 9 | 36.5 | PZE-109038570 | SYN30924 | 2.78 | 0.1 | 5.63 |
| qFW-8-2 | FW | S | 8 | 57.5 | PZE-108103951 | PZE-108073114 | 5.16 | 0.81 | 11.90 |
| qFW-9-3 | FW | S | 9 | 36.3 | PZE-109038570 | SYN30924 | 5.11 | 0.14 | 12.13 |
| qFW-2-1 | FW | A | 2 | 4.00 | SYN30559 | SYN17595 | 2.76 | 0.27 | 5.68 |
| qFW-3-3 | FW | A | 3 | 55.2 | SYN31233 | PZE-103139096 | 2.56 | -0.21 | 6.93 |
| qFW-8-1 | FW | A | 8 | 56.0 | PZE-108062218 | PZE-108103951 | 5.06 | 0.30 | 7.73 |
| qFW-8-3 | FW | A | 8 | 58.9 | PZE-108103951 | PZE-108073114 | 4.78 | 0.31 | 7.11 |
| qFW-9-1 | FW | A | 9 | 16.9 | PZE-109006381 | PZE-109007075 | 3.38 | 0.09 | 1.91 |
| qFW-9-8 | FW | A | 9 | 133.7 | PUT-163a-37425582-2026 | PZE-109106839 | 2.59 | 0.33 | 3.63 |
| qDW-1-2 | DW | N | 1 | 129.6 | SYN13476 | SYN30022 | 4.04 | 0.01 | 7.79 |
| qDW-3-4 | DW | N | 3 | 55.8 | PZE-103139096 | PZE-103044762 | 5.21 | -0.02 | 14.37 |
| qDW-2-2 | DW | S | 2 | 1.5 | SYN30559 | SYN17595 | 4.05 | 0.04 | 5.96 |
| qDW-3-3 | DW | S | 3 | 54.3 | PZE-103034323 | SYN31233 | 3.08 | 0.04 | 4.66 |
| qDW-8-2 | DW | S | 8 | 57.1 | PZE-108062218 | PZE-108103951 | 7.04 | 0.05 | 9.02 |
| qDW-8-4 | DW | S | 8 | 57.9 | PZE-108103951 | PZE-108073114 | 7.09 | 0.05 | 9.00 |
| qDW-9-1 | DW | S | 9 | 36.2 | PZE-109038570 | SYN30924 | 3.23 | 0.01 | 2.65 |
| qDW-8-3 | DW | A | 8 | 57.5 | PZE-108103951 | PZE-108073114 | 5.15 | 0.04 | 16.26 |
| qDW-9-4 | DW | A | 9 | 134.8 | PUT-163a-37425582-2026 | PZE-109106839 | 3.37 | 0.02 | 10.46 |
| qTWC-5-4 | TWC | N | 5 | 119.0 | PZE-105156153 | PZE-105116507 | 3.06 | -0.01 | 7 |
| qTWC-7-3 | TWC | N | 7 | 25.1 | PZE-107020326 | PZE-107024238 | 3.93 | 0 | 3.89 |
| qTWC-8-2 | TWC | N | 8 | 57.1 | PZE-108062218 | PZE-108103951 | 2.66 | -0.01 | 6.72 |
| qTWC-3-1 | TWC | S | 3 | 0.0 | SYN5839 | PZE-103001968 | 3.10 | 0.00 | 1.02 |
| qTWC-5-3 | TWC | S | 5 | 118.6 | PZE-105156153 | PZE-105116507 | 4.55 | -0.02 | 3.70 |
| qTWC-8-1 | TWC | S | 8 | 55.9 | PZE-108062218 | PZE-108103951 | 3.17 | -0.01 | 4.31 |
| qTWC-8-3 | TWC | S | 8 | 58.9 | PZE-108103951 | PZE-108073114 | 3.87 | -0.02 | 4.32 |
| qTWC-9-1 | TWC | S | 9 | 37.6 | PZE-109061069 | PZE-109066188 | 3.97 | 0.00 | 1.34 |
| qTWC-9-3 | TWC | S | 9 | 132.0 | PUT-163a-37425582-2026 | PZE-109106839 | 3.58 | -0.01 | 3.91 |
| qTWC-3-3 | TWC | A | 3 | 88.4 | PZE-103133167 | PUT-163a-60351350-2652 | 2.92 | 0.00 | 8.38 |
| qSTR-1-2 | STR | S | 1 | 42.3 | SYN6209 | PZE-101027182 | 3.09 | -0.16 | 9.32 |
| qSTR-8-1 | STR | S | 8 | 39.3 | PZE-108028788 | PZE-108060116 | 3.58 | -0.17 | 10.80 |
| qATR-3-1 | ATR | A | 3 | 107.0 | SYN31043 | SYN30138 | 3.52 | -0.29 | 10.46 |
| qSNC-2-1 | SNC | N | 2 | 5.3 | SYN30559 | SYN17595 | 4.85 | 5.23 | 1.87 |
| qSNC-6-1 | SNC | N | 6 | 3.8 | SYN11566 | PUT-163a-74244759-3691 | 4.83 | 5.17 | 3.87 |
| qSNC-8-1 | SNC | N | 8 | 55.4 | PZE-108062218 | PZE-108103951 | 4.95 | 5.17 | 1.87 |
| qSNC-10-2 | SNC | N | 10 | 56.9 | PZE-110002524 | PZE-110075434 | 9.63 | 5.23 | 2.87 |
| qSNC-1-1 | SNC | S | 1 | 0.30 | PZE-101117015 | SYN11490 | 2.84 | -32.41 | 5.70 |
| qSNC-3-3 | SNC | S | 3 | 27.1 | PZE-103032109 | PZE-103031701 | 3.30 | -4.28 | 3.77 |
| qSKC-3-1 | SKC | N | 3 | 55.1 | SYN31233 | PZE-103139096 | 6.26 | 37.93 | 2.04 |
| qNKR-5-3 | NKR | N | 5 | 116.4 | PZE-105156153 | PZE-105116507 | 3.55 | 0.17 | 2.94 |
| qNKR-6-1 | NKR | N | 6 | 3.1 | SYN11566 | PUT-163a-74244759-3691 | 3.79 | 0.18 | 3.93 |
| qNKR-8-1 | NKR | N | 8 | 54.4 | PZE-108062218 | PZE-108103951 | 6.57 | 0.16 | 2.95 |
| qNKR-9-1 | NKR | N | 9 | 130.7 | PUT-163a-37425582-2026 | PZE-109106839 | 3.48 | 0.18 | 1.93 |
| qNKR-10-1 | NKR | N | 10 | 62.3 | PZE-110075434 | PZE-110111417 | 3.58 | 0.18 | 2.92 |
| qNKR-6-4 | NKR | S | 6 | 112.5 | SYN31997 | SYN10686 | 2.95 | 0.99 | 8.14 |
| qNKR-7-3 | NKR | S | 7 | 73.4 | PZE-107127296 | PUT-163a-94475607-4877 | 4.18 | 1.19 | 10.36 |
新窗口打开|下载CSV
2.4.3 利用MCIM对玉米耐盐、耐碱相关性状的QTL定位分析 在盐胁迫条件下, 共检测到11个加性QTL及4个环境互作QTL, 遍布于玉米除第10染色体外的其余染色体上, 分别解释性状变异的3.1%~13.8 %。在碱胁迫条件下, 共检测到11个加性QTL及3个环境互作QTL, 遍布于玉米第1~第4、第7~第9染色体上, 分别解释性状变异的1.1%~11.5% (附表3)。
Supplementary table 3
附表3
附表3附基于MCIM模型的耐盐、耐碱QTL定位
Supplementary table 3
| QTL | 性状 Trait | 处理 Treatment | 染色体 Chr. | 位置 Position (cM) | 左标记 Left marker | 右标记 Right marker | A | 贡献率 H2(A) | AE1 | AE2 | 贡献率 H2(AE) |
|---|---|---|---|---|---|---|---|---|---|---|---|
| qGP-2-6 | GP | S | 2 | 70.0 | PZE-102045898 | PZA00590.1 | 0.07*** | 7.74 | |||
| qGP-4-2 | GP | S | 4 | 30.6 | PZE-104018854 | PZE-104019423 | 0.07*** | 7.15 | |||
| qGP-2-5 | GP | A | 2 | 70.0 | PZE-102045898 | PZA00590.1 | 0.04** | 5.02 | |||
| qGP-4-3 | GP | A | 4 | 34.1 | PZE-104022472 | PZE-104023120 | 0.05*** | 5.06 | |||
| qGP-7-1 | GP | A | 7 | 21.9 | PZE-107020326 | PZE-107024238 | 0.04*** | 6.37 | |||
| qPH-9-3 | PH | S | 9 | 37.1 | PZE-109061069 | PZE-109066188 | 2.17*** | 13.79 | |||
| qPH-9-2 | PH | A | 9 | 37.1 | PZE-109061069 | PZE-109066188 | 1.86*** | 11.53 | |||
| qFW-9-6 | FW | S | 9 | 37.1 | PZE-109061069 | PZE-109066188 | 0.15*** | 11.39 | |||
| qFW-7-1 | FW | A | 7 | 36.2 | PZE-107068965 | SYN28758 | -0.07** | 2.53 | |||
| qFW-8-4 | FW | A | 8 | 89.7 | SYN29240 | PZE-108125717 | -0.07*** | 1.08 | |||
| qFW-9-5 | FW | A | 9 | 37.1 | PZE-109061069 | PZE-109066188 | 0.141** | 10.02 | |||
| qDW-1-4 | DW | S | 1 | 130.8 | PUT-163a-71766009-3502 | SYN13025 | 0.01*** | 6.23 | |||
| qDW-9-3 | DW | S | 9 | 37.1 | PZE-109061069 | PZE-109066188 | 0.01*** | 7.7 | |||
| qDW-1-3 | DW | A | 1 | 130.8 | PUT-163a-71766009-3502 | SYN13025 | 0.00** | 3.68 | |||
| qDW-9-2 | DW | A | 9 | 37.1 | PZE-109061069 | PZE-109066188 | 0.01*** | 6.34 | |||
| qSTR-8-2 | STR | S | 8 | 39.3 | PZE-108028788 | PZE-108060116 | -0.20*** | 11.09 | - | - | - |
| qATR-3-2 | ATR | A | 3 | 107.0 | SYN31043 | SYN30138 | -0.325*** | 10.31 | - | - | - |
| qSNC-2-3 | SNC | S | 2 | 41.1 | SYN7712 | PZE-102176758 | -1.50** | 4.11 | |||
| qSNC-3-1 | SNC | S | 3 | 25.8 | PZE-103028604 | PZE-103029988 | -1.69** | 5.3 | 1.54* | -1.53* | 4.79 |
| qSNC-3-6 | SNC | S | 3 | 99.1 | PZE-103161091 | PZE-103164358 | -1.53** | 3.83 | |||
| qTNC-7-1 | SNC | S | 7 | 31.6 | SYN32778 | PZE-107065747 | -1.84** | 3.11 | |||
| qSNC-1-2 | SNC | A | 1 | 106.6 | SYN38769 | SYN31544 | 2.29*** | 4.23 | -1.98* | 2.01* | 0.04 |
| qSKC-4-2 | SKC | S | 4 | 52.8 | SYN15397 | SYN1845 | -9.41*** | 6.44 | |||
| qSKC-4-1 | SKC | A | 4 | 52.8 | SYN15397 | SYN1845 | -6.71*** | 3.93 | -6.37** | 6.36** | 0.04 |
| qSKC-8-1 | SKC | A | 8 | 4.0 | SYN5929 | PZE-108002532 | 5.50** | 1.75 | 4.57* | -4.77* | 0.02 |
| qNKR-5-1 | NKR | S | 5 | 25.6 | PZE-105039652 | SYN29076 | 0.41** | 3.25 | -0.36* | 0.36* | 3.13 |
| qNKR-6-5 | NKR | S | 6 | 113.1 | SYN31997 | SYN10686 | 0.64*** | 4.52 | -0.58** | 0.60** | 4.37 |
| qNKR-7-1 | NKR | S | 7 | 71.2 | PZE-107127296 | PUT-163a-94475607-4877 | 0.53*** | 5.54 | -0.53** | 0.54** | 5.81 |
| qNKR-2-1 | NKR | A | 2 | 91.9 | PZA00396.9 | PZE-102006385 | -0.21** | 2.61 |
*, **, and *** significant at 5%, 1%, and 0.1% levels, respectively; NS: no significant. Abbreviations as in table 1.
新窗口打开|下载CSV
2.4.4 3种QTL作图方法耐盐定位结果比较 基于上述3种QTL作图方法, 比较全部耐盐、耐碱定位结果(表2、表3和图4)。在自然及盐胁迫条件下, qPH-9、qSTR-8、qNKR-6与qNKR-7能被3种作图方法重复检测到, 表型贡献率分别为6.26%~ 13.79%、2.73%~11.09%、4.52%~8.14%和5.54%~ 11.02%。在自然及碱胁迫条件下, qPH-9与qATR-3能被3种作图方法重复检测到, 表型贡献率分别为9.59%~11.53%和4.61%~10.46%。
3 讨论
3.1 盐碱胁迫对玉米苗期表型性状的影响
土壤盐碱化影响作物的正常生理代谢和生理活动, 主要表现在离子毒害、渗透胁迫和营养吸收不平衡等方面。从萌发到成熟的各个生长发育阶段, 玉米均受到不同程度盐碱危害, 尤其在生长发育前期(萌发期和苗期)对胁迫最为敏感。盐碱胁迫下, 影响细胞分裂和伸长, 叶片失绿、植株生长缓慢, 根系相对活力降低, 相对生长量减少, 胁迫时间延长受害加剧[21]。本研究表明, 碱胁迫对玉米植株伤害大于盐胁迫, 这与前人研究结果一致[22]。原因可归结为, 碱胁迫下pH值升高, 严重破坏细胞原生质膜系统和光合结构, 使有氧呼吸及光合功能下降[23]。此外, pH值升高还可能使某些微量元素利用率降低, 如Fe、Mg等直接影响叶绿素合成[24], 光合色素含量降低[25], 作物生长受限, 产量下降。众多研究报道指出, GP、PH、FW、DW、TWC、SKC、SNC、NKR、STR/ATR等指标在作物耐盐碱鉴定中具可行性[4,6-7,14,27]。这些指标均具有可操作性强、周期短、效率高等优点, 而且鉴定结果与全生育期鉴定结果极显著相关, 适宜大量材料的耐盐碱性筛选[26]。耐盐/碱率作为植物耐盐碱性鉴定指标中最直观的指标广泛被使用[27,28,29], 本研究也将其作为重要指标评价家系耐盐碱性, 并用于QTL定位。
3.2 CIM、ICIM和MCIM对玉米苗期耐盐碱相关性状的加性QTL定位分析
基于多种QTL作图方法对玉米耐盐碱相关性状进行QTL定位, 与以往研究中采用的单一遗传模型相比, 增强了QTL检出率, 提高了QTL位置及效应估计的精准度。因此, 本研究认为采用CIM、ICIM和MCIM 3种作图方法共同发现的QTL可信度较高。比较发现, CIM定位到的QTL基本覆盖了ICIM及MCIM的定位结果, 且贡献率也相对较高, ICIM定位结果次之, MCIM定位结果最少, 这与梁银培等[30]的研究结果吻合。其原因可能是MCIM较ICIM除考虑加性、上位性互作外, 还包括与环境互作效应[31]。当然, QTL的作图原理都是数学统计中的概率事件, 尽管CIM检测到的QTL数量较多, 但不能排除存在假阳性的可能, 导致遗漏一些重要遗传信息[32]。本研究检测到的55、66和71个相关QTL中, qDW-1-4与qDW-1-3、qSKC-4-2与qSKC-4-1、qFW-8-2与qFW-8-3、qDW-9-3与qDW-9-2分别以盐胁迫和碱胁迫作为环境因子被MCIM共同检测到; qPH-9-3、qPH-9-2与qPH-9-5, qFW-9-6、qFW-9-5与qFW-9-7分别以碱胁迫与盐胁迫作为环境因子被MCIM和CIM的盐胁迫条件下共同检测到; qGP-2-6、qGP-2-5与qGP-2-4分别以碱胁迫和盐胁迫作为环境因子被MCIM与ICIM的盐胁迫条件下共同检测到; qDW-8-3、qDW-8-4与qDW-8-5被ICIM的盐胁迫、碱胁迫与ICIM的盐胁迫条件下共同检测到。大量的研究表明, 植物的耐盐碱相关性状表现为连续性变异, 是受多个基因共同调控的复杂数量性状[33,34,35]。本研究以200 mmol L-1 NaCl和100 mmol L-1 Na2CO3溶液分别作为盐、碱胁迫溶液, 二者Na+含量相同。上述性状同时在盐、碱胁迫条件下重复检测到, 表明这些QTL可能是响应Na+胁迫的QTL。盐、碱胁迫条件下重复检测到qSKC-4-2与qSKC-4-1表明, Na+、K+浓度的遗传是互为独立的。qDW-8-3、qDW-8-4、qDW-8-5、qFW-8-2、qFW-8-3共区间, qDW-9-3、qDW-9-2、qPH-9-3、qPH-9-2、qPH-9-5、qFW-9-6、qFW-9-5、qFW-9-7共区间, 它们形成2个QTL簇, 表明这些性状可能是由单基因或多个紧密连锁基因共同调控的。
值得注意的是, qSTR-8-3、qSTR-8-1与qSTR-8-2, qNKR-6-3、qNKR-6-4与qNKR-6-5, qNKR-7-1、qNKR-7-2与qNKR-7-3同时被CIM、ICIM的盐胁迫条件下和MCIM共同检测到。qATR-3-1、qATR-3-2与qATR-3-3同时被CIM、ICIM的碱胁迫条件下和MCIM共同检测到。qPH-9-4、qPH-9-6、qPH-9-5与qPH-9-3、qPH-9-2同时被CIM和ICIM在自然条件下、CIM的盐胁迫条件下以及碱胁迫作为环境因子的MCIM共同检测到。因此, 盐胁迫下的qPH-9、qSTR-8、qNKR-6、qNKR-7和碱胁迫下的qPH-9、qATR-3将为下一步精细定位耐盐碱主效QTL, 进而图位克隆玉米耐盐碱主效基因奠定了试验基础。
3.3 与前人耐盐碱性分析结果比较
与前人研究比较, 本研究结果尽管有部分QTL处于相邻区域, 但大部分QTL结果处于不同区间, 这可能与作图群体不同和盐/碱两种处理方式对玉米伤害作用机制不同有关。本研究将拟开展下步精细定位进而图位克隆的5个QTL qATR-3、qNKR-6、qNKR-7、qSTR-8、qPH-9, 与前人玉米耐盐碱定位结果比较(表4, 附表1~附表3)表明, qATR-3位于第3染色体, 区间为219.78~219.97 Mb, 与管飞翔[3]检测到影响碱环境下相对胚根长的qRLR-3定位在相邻区域; qNKR-6位于第6染色体, 区间为163.71~165.05 Mb, 与吴丹丹[6]检测到影响植株K+含量的QSkn6和管飞翔[3]检测到影响植株胚芽长的qLR-6定位在相邻区域; qNKR-7位于第7染色体, 区间为169.88~172.62 Mb, 该QTL在前人的耐盐碱定位中未发现相关报道; qSTR-8位于第8染色体, 区间为26.59~106.74 Mb, 与Luo等[8]检测到影响株高的qNPH8定位到相同区间, 与管飞翔[3]检测到影响植株胚芽长的qLR-8定位在相邻区域; qPH-9位于第9染色体, 区间为103.92~109.32 Mb, 与Luo等[8]检测到影响株高系数的qPHI9定位在相邻区域。Table 4
表4
表4前人耐盐碱研究结果
Table 4
| 性状 Trait | QTL | 染色体 Chr. | 左标记 Left marker | 右标记 Right marker | 位置 Position (cM) | LOD | 加性效应 Additive effect | 贡献率 R2 (%) | 参考文献 References |
|---|---|---|---|---|---|---|---|---|---|
| SRLP | qSRLP-1 | 1 | umc1568 | umc1403 | 55.30 | 2.49 | -0.07 | 7.50 | 管飞翔[3] |
| SRLR | qSRLR-7 | 7 | umc2160 | phi034 | 6.80 | 3.47 | -0.06 | 6.05 | Guan [3] |
| ARLP | qARLP-1 | 1 | phi120 | umc1744 | 34.22 | 2.58 | -0.09 | 4.75 | |
| SRLR | qARLR-3-1 | 3 | umc1052 | umc2050 | 29.01 | 3.82 | 0.11 | 10.20 | |
| SRLR | qARLR-3-2 | 3 | dupssr17 | bnlg197 | 48.01 | 2.25 | -0.06 | 3.96 | |
| LP | qLP-10 | 10 | umc1196 | umc2043 | 18.25 | 2.34 | -0.40 | 4.15 | |
| LR | qLR-1 | 1 | umc1306 | phi120 | 12.01 | 2.06 | 0.97 | 6.06 | |
| LR | qLR-2 | 2 | umc2129 | umc2110 | 2.01 | 2.15 | 0.81 | 4.15 | |
| LR | qLR-6 | 6 | umc1490 | umc1762 | 21.46 | 2.29 | 0.94 | 5.74 | |
| LR | qLR-8 | 8 | umc1777 | umc2075 | 135.33 | 2.31 | 0.84 | 4.48 | |
| FW | qFW-1 | 1 | phi064 | phi26545 | 28.83 | 3.58 | -0.5678 | 7 | 王士磊等[4] |
| DW | qDW-1 | 1 | phi064 | phi26545 | 28.83 | 3.13 | -0.5219 | 8 | Wang et al.[4] |
| PH | qPH-1 | 1 | phi064 | phi26545 | 29.00 | 2.79 | -0.2478 | 7 | |
| DW | qDW-5 | 5 | phi024 | umc1692 | 25.60 | 2.68 | -0.0683 | 8 | |
| ST | qST-5 | 5 | phi087 | phi048 | 88.09 | 4.34 | 1.3376 | 10 | |
| ST | qST-6 | 6 | phi126 | phi42379 | 6.57 | 2.65 | 1.1471 | 6 | |
| FGR | QFgr1 | 1 | PZE101140869 | PZE101138116 | 77.1 | -12.220 | 30.43 | 吴丹丹[6] | |
| FSTR | QFstr1 | 1 | PZE101140869 | PZE101138116 | 77.1 | 0.783 | 58.33 | Wu [6] | |
| STR | QStr1 | 1 | PZE101130082 | PZE101119342 | 85.9 | 0.222 | 14.25 | ||
| STR | QStr3 | 3 | PZE103072593 | PZE103072415 | 44.1 | 0.318 | 24.98 | ||
| STR | QStr7 | 7 | PZE07012564 | PZB02215.4 | 92.9 | -0.142 | 3.37 | ||
| TWC | QTwc1 | 1 | PZE101130082 | PZE101119342 | 85.9 | -0.489 | 1.65 | ||
| TWC | QTwc3 | 3 | PZE103083718 | SYN16519 | 47.1 | -0.682 | 11.65 | ||
| TWC | QTwc7 | 7 | PZE107020363 | SYN24186 | 82.1 | 0.364 | 2.41 | ||
| TWC | QTwc9 | 9 | PZA03596.1 | PZE109061997 | 48.3 | -0.384 | 4.19 | ||
| SNC | QSnc3 | 3 | PZE103052343 | PZE103072593 | 43.7 | -0.948 | 4.33 | ||
| SNC | QSnc5 | 5 | SYN22663 | PZE105006095 | 119.7 | -0.881 | 4.37 | ||
| SKC | QSkc3 | 3 | PZE103072593 | PZE103072415 | 44.1 | 3.936 | 15.43 | ||
| SKC | QSkc5 | 5 | SYN29254 | PZE105137112 | 34.1 | -2.328 | 8.22 | ||
| SKC | QSkc7 | 7 | PZE107104709 | PZE107103294 | 35.6 | -1.660 | 4.36 | ||
| SKC | QSkc9 | 9 | PZE109034705 | PZE109037929 | 47.1 | 2.307 | 5.43 | ||
| SKN | QSkn3 | 3 | PZE103072415 | PZE103073770 | 44.1 | 17.358 | 2.32 | ||
| SKN | QSkn4.1 | 4 | PZE104049567 | PZE104052175 | 82.2 | 40.294 | 16.81 | ||
| SKN | QSkn4.2 | 4 | PZE104033683 | PZE104031374 | 84.4 | 32.667 | 16.85 | ||
| SKN | QSkn5 | 5 | PZE105182641 | PZE105177818 | 1.00 | 16.189 | 1.21 | ||
| SKN | QSkn6 | 6 | SYN9304 | SYN22989 | 73.80 | -12.795 | 1.17 | ||
| NPH(2014) | qNPH4 | 4 | PZE104023902 | SYN4889 | 49.71 | 4.39 | 8.40 | 8.33 | Luo等[8] |
| NPH(2014) | qNPH8 | 8 | PZE108041337- | PZE108090114 | 56.01 | 3.67 | 8.12 | 6.90 | Luo et al.[8] |
| NPH(2015) | qNPH4 | 4 | PZE104023902 | PZE104081530 | 46.01 | 6.28 | 7.78 | 10.11 | |
| NPH(2015) | qNPH5 | 5 | PZE105045981 | PZE105128581 | 73.51 | 3.19 | 5.55 | 4.98 | |
| NPH(2015) | qNPH8 | 8 | PZE108028588 | PZE108103365 | 61.61 | 5.03 | 6.94 | 7.07 | |
| NPH(2015) | qNPH9-2 | 9 | PZE109064469 | SYN27201 | 71.31 | 4.56 | 6.61 | 7.24 | |
| NPH(2016) | qNPH8 | 8 | PZE108041337 | PZE108097446 | 57.31 | 4.29 | 8.11 | 7.75 | |
| NPH(2016) | qNPH9-1 | 9 | PZE109011840 | PZE109040519 | 45.81 | 5.79 | 8.93 | 10.74 | |
| NPH(mean) | qNPH4 | 4 | PZE104023902 | PZE104081530 | 49.71 | 6.97 | 8.13 | 11.90 | |
| NPH(mean) | qNPH8 | 8 | PZE108028588 | PZE108090114 | 57.31 | 3.88 | 6.40 | 6.36 | |
| NPH(mean) | qNPH9-2 | 9 | PZE109064469 | SYN27201 | 71.31 | 4.80 | 6.66 | 7.97 | |
| SPH(2014) | qSPH1 | 1 | SYN309 | SYN25920 | 95.21 | 4.47 | 13.79 | 13.28 | |
| SPH(2015) | qSPH1 | 1 | PZE101094436 | PZE101150513 | 88.51 | 11.46 | 16.86 | 16.99 | |
| SPH(2015) | qSPH5-1 | 5 | SYN16675 | PZE105128581 | 77.31 | 3.50 | 8.82 | 5.01 | |
| SPH(2016) | qSPH1 | 1 | PZE101109084 | SYN25920 | 90.21 | 19.47 | 24.69 | 35.03 | |
| SPH(2016) | qSPH5-2 | 5 | PZE105049283 | PZE105117757 | 71.01 | 4.26 | 19.86 | 6.17 | |
| SPH(mean) | qSPH1 | 1 | PZE101094436 | PZE101150513 | 88.51 | 22.40 | 19.14 | 31.24 | |
| SPH(mean) | qSPH5-1 | 5 | SYN1390 | PZE105128581 | 77.31 | 3.32 | 6.55 | 3.96 | |
| PHI(2014) | qPHI1 | 1 | PZE101109084 | SYN25920 | 94.81 | 8.94 | 0.10 | 28.10 | |
| PHI(2014) | qPHI3 | 3 | SYN28626 | PZE103019163 | 23.51 | 4.63 | 0.67 | 13.64 | |
| PHI(2015) | qPHI1 | 1 | SYN5444 | SYN25920 | 90.21 | 10.59 | 0.08 | 19.51 | |
| PHI(2016) | qPHI1 | 1 | PZE101109084 | SYN25920 | 90.21 | 14.27 | 0.09 | 27.51 | |
| PHI(mean) | qPHI1 | 1 | PZE101109084 | SYN25920 | 90.21 | 16.20 | 0.07 | 25.94 | |
| PHI(mean) | qPHI4 | 4 | SYN4889 | SYN4250 | 56.91 | 4.14 | 0.03 | 5.63 | |
| PHI(mean) | qPHI9 | 9 | SYN24345 | SYN5732 | 130.34 | 3.39 | 0.03 | 5.59 | |
| PHI(mean) | qPHI10 | 10 | PZE110100655 | SYN19213 | 108.16 | 3.29 | 0.03 | 4.47 | |
| ATR | qATR2 | 2 | phi402893 | umc2246 | 2.40 | -0.29 | 6.0 | 马晓军等[5] | |
| ATR | qATR5.1 | 5 | umc1894 | phi024 | 2.10 | -0.10 | 1.1 | Ma et al.[5] | |
| ATR | qATR5.2 | 5 | umc2306 | phi087 | 2.40 | -0.24 | 8.6 | ||
| ATR | qATR7 | 7 | bnlg2132 | phi057 | 3.70 | -0.21 | 7.0 |
新窗口打开|下载CSV
3.4 作物耐盐碱QTL定位存在问题与解决对策
3.4.1 表型鉴定滞后与高通量精准表型鉴定平台搭建 QTL定位有表型鉴定和遗传连锁图谱构建两个关键环节。然而, 由于难以模拟实际生境, 作物耐盐碱性状表型鉴定最容易出现偏差。相比迅猛发展的高通量基因型检测技术, 发展迟缓的精准表型鉴定技术已成为制约数量性状基因定位的主要瓶颈。为了有效地解决上述难题, 必须搭建可控环境下的高通量精准表型鉴定平台。它主要基于机器视觉技术, 对单株植物近距离观测分析其长势信息和表型参数, 在自动化流水线和智能图像处理系统支持下, 开展大规模观测与分析研究。3.4.2 亟须挖掘微效QTL与全基因组测序 作物耐盐碱性状是复杂的数量性状, 尽管通过图位克隆的方法在主效QTL区段已挖掘到耐盐碱基因, 但继续在微效QTL区段开展图位克隆则需要更大的工作量。随着高通量基因测序技术与仪器的发展, 测序成本大幅下降和测序速度不断加快。目前, 玉米、水稻等10多种作物已完成全基因组测序, 一些跨国公司实现了基因型检测从样品制备到分子检测的全自动处理。随着人们对植物基因组认知的不断深入, 植物功能基因组研究进入了高通量分析的阶段, 针对数量性状的QTL定位和克隆得到了一系列的优化[36]。
最新测序技术的逐步应用, 依靠高通量测序仪, 揭示了许多作物全基因组测序结果, 对基因型鉴定起到革命性推动作用。同时, 高通量、全自动的表型检测技术的不断成熟, 构建精准表型鉴定平台, 提高表型鉴定的精度和效率。最终, 必然会缩短挖掘耐盐碱等数量性状的基因的时间, 并提高其准确性。
4 结论
玉米对Na2CO3胁迫更加敏感且伤害更严重, 其对Na+、K+的吸收和运输是相互独立的两个过程, 玉米盐、碱胁迫可能是两种性质不同的胁迫。在自然、盐和碱胁迫条件下, 运用CIM分别检测到27、28、40个加性QTL; 运用ICIM分别检测到28、23、17个加性QTL; 运用MCIM共检测到11个耐盐加性QTL、4个环境互作效应QTL以及11个耐碱加性QTL、3个环境互作效应QTL。盐胁迫条件下的qPH-9、qSTR-8、qNKR-6、qNKR-7和碱胁迫条件下的qPH-9、qATR-3能被3种作图方法重复检测到。与前人研究结果比较, qPH-9、qSTR-8、qNKR-6、qATR-3定位在相同或邻近区域, qNKR-7尚未见报道。本研究结果为精细定位玉米耐盐碱主效基因、挖掘候选基因和开发用于标记辅助选择的实用功能标记奠定基础。附表 请见网络版: 1) 本刊网站http://zwxb.chinacrops.org/; 2) 中国知网http://www.cnki.net/; 3) 万方数据http://c.wanfangdata.com.cn/Periodical-zuowxb.aspx。
参考文献 原文顺序
文献年度倒序
文中引用次数倒序
被引期刊影响因子
[本文引用: 1]
[本文引用: 1]
[本文引用: 1]
[本文引用: 1]
[本文引用: 6]
[本文引用: 6]
[本文引用: 4]
[本文引用: 4]
[本文引用: 3]
[本文引用: 3]
[本文引用: 5]
[本文引用: 5]
[本文引用: 2]
[本文引用: 2]
DOI:10.1186/s12870-017-1090-7URLPMID:5556339 [本文引用: 5]

Salt stress significantly restricts plant growth and production. Maize is an important food and economic crop but is also a salt sensitive crop. Identification of the genetic architecture controlling salt tolerance facilitates breeders to select salt tolerant lines. However, the critical quantitative trait loci (QTLs) responsible for the salt tolerance of field-grown maize plants are still unknown. To map the main genetic factors contributing to salt tolerance in mature maize, a double haploid population (240 individuals) and 1317 single nucleotide polymorphism (SNP) markers were employed to produce a genetic linkage map covering 1462.05cM. Plant height of mature maize cultivated in the saline field (SPH) and plant height-based salt tolerance index (ratio of plant height between saline and control fields, PHI) were used to evaluate salt tolerance of mature maize plants. A major QTL for SPH was detected on Chromosome 1 with the LOD score of 22.4, which explained 31.2% of the phenotypic variation. In addition, the major QTL conditioning PHI was also mapped at the same position on Chromosome 1, and two candidate genes involving in ion homeostasis were identified within the confidence interval of this QTL. The detection of the major QTL in adult maize plant establishes the basis for the map-based cloning of genes associated with salt tolerance and provides a potential target for marker assisted selection in developing maize varieties with salt tolerance. The online version of this article (doi:10.1186/s12870-017-1090-7) contains supplementary material, which is available to authorized users.
.
[本文引用: 2]
[本文引用: 2]
[本文引用: 1]
[本文引用: 1]
[本文引用: 1]
[本文引用: 1]
[本文引用: 1]
[本文引用: 1]
[本文引用: 1]
[本文引用: 1]
[本文引用: 2]
[本文引用: 2]
DOI:10.1371/journal.pone.0028334URLPMID:22174790 [本文引用: 1]
Abstract SNP genotyping arrays have been useful for many applications that require a large number of molecular markers such as high-density genetic mapping, genome-wide association studies (GWAS), and genomic selection. We report the establishment of a large maize SNP array and its use for diversity analysis and high density linkage mapping. The markers, taken from more than 800,000 SNPs, were selected to be preferentially located in genes and evenly distributed across the genome. The array was tested with a set of maize germplasm including North American and European inbred lines, parent/F1 combinations, and distantly related teosinte material. A total of 49,585 markers, including 33,417 within 17,520 different genes and 16,168 outside genes, were of good quality for genotyping, with an average failure rate of 4% and rates up to 8% in specific germplasm. To demonstrate this array's use in genetic mapping and for the independent validation of the B73 sequence assembly, two intermated maize recombinant inbred line populations - IBM (B73Mo17) and LHRF (F2F252) - were genotyped to establish two high density linkage maps with 20,913 and 14,524 markers respectively. 172 mapped markers were absent in the current B73 assembly and their placement can be used for future improvements of the B73 reference sequence. Colinearity of the genetic and physical maps was mostly conserved with some exceptions that suggest errors in the B73 assembly. Five major regions containing non-colinearities were identified on chromosomes 2, 3, 6, 7 and 9, and are supported by both independent genetic maps. Four additional non-colinear regions were found on the LHRF map only; they may be due to a lower density of IBM markers in those regions or to true structural rearrangements between lines. Given the array's high quality, it will be a valuable resource for maize genetics and many aspects of maize breeding.
DOI:10.1016/j.cj.2015.01.001URL [本文引用: 1]
QTL IciMapping is freely available public software capable of building high-density linkage maps and mapping quantitative trait loci (QTL) in biparental populations. Eight functionalities are integrated in this software package: (1) BIN: binning of redundant markers; (2) MAP: construction of linkage maps in biparental populations; (3) CMP: consensus map construction from multiple linkage maps sharing common markers; (4) SDL: mapping of segregation distortion loci; (5) BIP: mapping of additive, dominant, and digenic epistasis genes; (6) MET: QTL-by-environment interaction analysis; (7) CSL: mapping of additive and digenic epistasis genes with chromosome segment substitution lines; and (8) NAM: QTL mapping in NAM populations. Input files can be arranged in plain text, MS Excel 2003, or MS Excel 2007 formats. Output files have the same prefix name as the input but with different extensions. As examples, there are two output files in BIN, one for summarizing the identified bin groups and deleted markers in each bin, and the other for using the MAP functionality. Eight output files are generated by MAP, including summary of the completed linkage maps, Mendelian ratio test of individual markers, estimates of recombination frequencies, LOD scores, and genetic distances, and the input files for using the BIP, SDL, and MET functionalities. More than 30 output files are generated by BIP, including results at all scanning positions, identified QTL, permutation tests, and detection powers for up to six mapping methods. Three supplementary tools have also been developed to display completed genetic linkage maps, to estimate recombination frequency between two loci, and to perform analysis of variance for multi-environmental trials.
DOI:10.1111/j.1469-1809.1943.tb02321.xURL [本文引用: 1]
The articles published by the Annals of Eugenics (1925–1954) have been made available online as an historical archive intended for scholarly use. The work of eugenicists was often pervaded by prejudice against racial, ethnic and disabled groups. The online publication of this material for scholarly research purposes is not an endorsement of those views nor a promotion of eugenics in any way.
URL [本文引用: 1]
DOI:10.1093/bioinformatics/btm143URLPMID:17459962
Abstract SUMMARY: Understanding how interactions among set of genes affect diverse phenotypes is having a greater impact on biomedical research, agriculture and evolutionary biology. Mapping and characterizing the isolated effects of single quantitative trait locus (QTL) is a first step, but we also need to assemble networks of QTLs and define non-additive interactions (epistasis) together with a host of potential environmental modulators. In this article, we present a full-QTL model with which to explore the genetic architecture of complex trait in multiple environments. Our model includes the effects of multiple QTLs, epistasis, QTL-by-environment interactions and epistasis-by-environment interactions. A new mapping strategy, including marker interval selection, detection of marker interval interactions and genome scans, is used to evaluate putative locations of multiple QTLs and their interactions. All the mapping procedures are performed in the framework of mixed linear model that are flexible to model environmental factors regardless of fix or random effects being assumed. An F-statistic based on Henderson method III is used for hypothesis tests. This method is less computationally greedy than corresponding likelihood ratio test. In each of the mapping procedures, permutation testing is exploited to control for genome-wide false positive rate, and model selection is used to reduce ghost peaks in F-statistic profile. Parameters of the full-QTL model are estimated using a Bayesian method via Gibbs sampling. Monte Carlo simulations help define the reliability and efficiency of the method. Two real-world phenotypes (BXD mouse olfactory bulb weight data and rice yield data) are used as exemplars to demonstrate our methods. AVAILABILITY: A software package is freely available at http://ibi.zju.edu.cn/software/qtlnetwork
[本文引用: 1]
[本文引用: 1]
[本文引用: 1]
[本文引用: 1]
[本文引用: 1]
[本文引用: 1]
[本文引用: 1]
DOI:10.1007/s11104-007-9251-3URL [本文引用: 1]
Kochia sieversiana (Pall.) C. A. M., a naturally alkali-resistant halophyte, was chosen as the test organism for our research. The seedlings of K. sieversiana were treated with varying (0–40002mM) salt stress (1:1 molar ratio of NaCl to Na 2 SO 4 ) and alkali stress (1:1 molar ratio of NaHCO 3 to Na 2 CO 3 ). The concentrations of various solutes in fresh shoots, including Na + , K + , Ca 2+ , Mg 2+ , Cl 61 , SO 4 261 , NO 3 61 , H 2 PO 3 61 , betaine, proline, soluble sugar (SS), and organic acid (OA), were determined. The water content (WC) of the shoots was calculated and the OA components were analyzed. Finally, the osmotic adjustment and ion balance traits in the shoots of K. sieversiana were explored. The results showed that the WC of K. sieversiana remained higher than 6 [g02g 611 Dry weight (DW)] even under the highest salt or alkali stress. At salinity levels >24002mM, proline concentrations increased dramatically, with rising salinity. We proposed that this was not a simple response to osmotic stress. The concentrations of Na + and K + all increased with increasing salinity, which implies that there was no competitive inhibition for absorption of either in K. sieversiana . Based on our results, the osmotic adjustment feature of salt stress was similar to that of alkali stress in the shoots of K. sieversiana . The shared essential features were that the shoots maintained a state of high WC, OA, Na + , K + and other inorganic ions, accumulated largely in the vacuoles, and betaine, accumulated in cytoplasm. On the other hand, the ionic balance mechanisms under both stresses were different. Under salt stress, K. sieversiana accumulated OA and inorganic ions to maintain the intracellular ionic equilibrium, with close to equal contributions of OA and inorganic ions to anion. However, under alkali stress, OA was the dominant factor in maintaining ionic equilibrium. The contribution of OA to anion was as high as 84.2%, and the contribution of inorganic anions to anion was only 15.8%. We found that the physiological responses of K. sieversiana to salt and alkali stresses were unique, and that mechanisms existed in it that were different from other naturally alkali-resistant gramineous plants, such as Aneurolepidium chinense , Puccinellia tenuiflora .
[本文引用: 1]
[本文引用: 1]
[本文引用: 1]
[本文引用: 1]
DOI:10.1371/journal.pone.0051202URLPMID:23236455 [本文引用: 2]
The key to plant survival under NaCl salt stress is maintaining a low Na(+) level or Na(+)/K(+) ratio in the cells. A population of recombinant inbred lines (RILs, F(2:9)) derived from a cross between the salt-tolerant japonica rice variety Jiucaiqing and the salt-sensitive indica variety IR26, was used to determine Na(+) and K(+) concentrations in the roots and shoots under three different NaCl stress conditions (0, 100 and 120 mM NaCl). A total of nine additive QTLs were identified by QTL Cartographer program using single-environment phenotypic values, whereas eight additive QTLs were identified by QTL IciMapping program. Among these additive QTLs, five were identified by both programs. Epistatic QTLs and QTL-by-environment interactions were detected by QTLNetwork program in the joint analyses of multi-environment phenotypic values, and one additive QTL and nine epistatic QTLs were identified. There were three epistatic QTLs identified for Na(+) in roots (RNC), three additive QTLs and two epistatic QTLs identified for Na(+) in shoots (SNC), four additive QTLs identified for K(+) in roots (RKC), four additive QTLs and three epistatic QTLs identified for K(+) in shoots (SKC) and one additive QTL and one epistatic QTL for salt tolerance rating (STR). The phenotypic variation explained by each additive, epistatic QTL and QTL脳environment interaction ranged from 8.5 to 18.9%, 0.5 to 5.3% and 0.7 to 7.5%, respectively. By comparing the chromosomal positions of these additive QTLs with those previously identified, five additive QTLs, qSNC9, qSKC1, qSKC9, qRKC4 and qSTR7, might represent novel salt tolerance loci. The identification of salt tolerance in selected RILs showed that a major QTL qSNC11 played a significant role in rice salt tolerance, and could be used to improve salt tolerance of commercial rice varieties with marker-assisted selection (MAS) approach.
DOI:10.1139/g11-075URLPMID:22181322 [本文引用: 1]
Effect of genetic background on detection of quantitative trait locus (QTL) governing salinity tolerance (ST) was studied using two sets of reciprocal introgression lines (ILs) derived from a cross between a moderately salinity tolerant japonica variety, Xiushui09 from China, and a drought tolerant but salinity susceptible indica breeding line, IR2061–520–6-9 from the Philippines. Salt toxicity symptoms (SST) on leaves, days to seedling survival (DSS), and sodium and potassium uptake by shoots were measured under salinity stress of 14002mmol/L of NaCl. A total of 47 QTLs, including 26 main-effect QTLs (M-QTLs) and 21 epistatic QTLs (E-QTLs), were identified from the two sets of reciprocal ILs. Among the 2602M-QTLs, only four (15.4%) were shared in the reciprocal backgrounds while no shared E-QTLs were detected, indicating that ST QTLs, especially E-QTLs, were very specific to the genetic background. Further, 78.6% of the M-QTLs for SST and DSS identified in the reciprocal ILs were also detected in the recombinant inbred lines (RILs) from the same cross, which clearly brings out the background effect on ST QTL detection and its utilization in ST breeding. The detection of ILs with various levels of pyramiding of nonallelic M-QTL alleles for ST from Xiushui09 into IR2061-520-6-9 allowed us to further improve the ST in rice.
DOI:10.1007/s00122-004-1783-9URLPMID:15365627 [本文引用: 1]
Deployment of salt tolerant cultivars is an effective approach to minimize yield loss in a saline soil. In soybean, Glycine max (L.) Merr., substantial genetic variation exists for salt response. However, breeding for salt tolerance is hampered because no economically viable screening method has been developed for practical breeding. To facilitate the development of an effective screening method for salt tolerance in soybean, the present study was conducted to determine the heritability of salt tolerance and to identify associated quantitative trait loci (QTL). F 2:5 lines from the cross of ‘S-100’ (salt tolerant) × ‘Tokyo’ (salt sensitive) were evaluated in a saline field in Hyde County, N.C., USA, in 1999 and in a greenhouse located in Raleigh, N.C., USA, in 2001. S-100 and Tokyo are ancestors of popular soybean cultivars released for the southern USA. The visual salt tolerance ratings of the F 2:5 lines ranged from 0 (complete death) to 5 (normal healthy appearance). The entry-mean heritability for salt tolerance was 0.85, 0.48, and 0.57 in the field (four replications), greenhouse (two replications), and combined environments, respectively. The genotypic correlation between field and greenhouse ratings was 0.55, indicating reasonably good agreement between the two screening environments. To identify QTL associated with salt tolerance, each line was characterized with RFLP markers and an initial QTL single-factor analysis was completed. These results were used to identify genomic regions associated with the trait and to saturate the selected genomic regions with SSR markers to improve mapping precision. Subsequently, a major QTL for salt tolerance was discovered near the Sat_091 SSR marker on linkage group (LG) N, accounting for 41, 60, and 79% of the total genetic variation for salt tolerance in the field, greenhouse, and combined environments, respectively. The QTL allele associated with tolerance was derived from S-100. Pedigree tracking was used to examine the association between the salt tolerance QTL and flanking SSR marker alleles in U.S. cultivars descended from S-100 or Tokyo through 6002years of breeding. The presence of alleles from S-10002at the Sat_091 and Satt237 marker loci was always associated with salt tolerance in descendants. Alleles from Tokyo for these same markers were generally associated with salt sensitivity in descendent cultivars. The strong relationship between the SSR marker alleles and salt tolerance suggests that these markers could be used for marker-assisted selection in commercial breeding.
[本文引用: 1]
[本文引用: 1]
[本文引用: 1]
[本文引用: 1]
[本文引用: 1]
[本文引用: 1]
[本文引用: 1]
DOI:10.1007/s10681-014-1250-xURL [本文引用: 1]
Salinity is a major constraint to the sustainability and expansion of maize cultivation. Plant salt tolerance is a quantitative trait controlled by multiple genes. In the present study, we constructed a high density genetic map based on high quality SNP markers from 161 F 2:5 recombinant inbred line populations derived from the cross between two maize inbred lines contrasting in salinity tolerance. QTL analysis was conducted in saline field and the hydroponic culture. For saline field, field germination rate and field salt tolerance ranking were used as salinity tolerance indicators to conduct QTL detection. For hydroponic culture, salt tolerance ranking, shoot fresh weight, shoot dry weight, tissue water content, shoot Na + concentration, shoot K + concentration, and shoot K + /Na + ratio were used. Through unconditional QTL analysis, we detected 20 additive and nine epistatic QTLs, of which 12 and two showed significant QTL by treatment ( Q T ) interaction effects, respectively. Moreover, the use of conditional analysis model allowed us to detect nine conditional QTLs. The QTLs were mainly clustered on chromosomes 1, 3 and 5. The five unconditional and three conditional QTLs reported here could individually explain more than 20% of the phenotypic variation. The QTLs identified here could be helpful to improve salt tolerance in maize by marker-assisted selection and shed new light on understanding the genetic basis of salt tolerance in maize.
[本文引用: 1]
[本文引用: 1]
[本文引用: 1]
