 ,1,*1
,1,*12
3
Spatio-temporal Changes of Rice Production in China Based on County Unit
WANG Xiao-Hui1, JIANG Yu-Lin1, LIU Yang1, LU Jie1, YIN Xiao-Gang1, SHI Lei-Gang2, HUANG Jing3, CHU Qing-Quan1, CHEN Fu,1,*1 2
3
通讯作者:
第一联系人:
收稿日期:2018-03-28接受日期:2018-07-20网络出版日期:2018-07-26
| 基金资助: |
Received:2018-03-28Accepted:2018-07-20Online:2018-07-26
| Fund supported: |

摘要
关键词:
Abstract
Keywords:
PDF (1257KB)元数据多维度评价相关文章导出EndNote|Ris|Bibtex收藏本文
本文引用格式
王小慧, 姜雨林, 刘洋, 卢捷, 尹小刚, 史磊刚, 黄晶, 褚庆全, 陈阜. 基于县域单元的我国水稻生产时空动态变化[J]. 作物学报, 2018, 44(11): 1704-1712. doi:10.3724/SP.J.1006.2018.01704
WANG Xiao-Hui, JIANG Yu-Lin, LIU Yang, LU Jie, YIN Xiao-Gang, SHI Lei-Gang, HUANG Jing, CHU Qing-Quan, CHEN Fu.
水稻是我国三大粮食作物之一, 全国有60%的人以大米为主食, 水稻生产可持续发展对保障我国粮食安全意义重大。受气候变化[1]、栽培耕作技术和品种更新、生产成本上升、劳动力短缺、机械化水平较低等多因素[2]的影响, 我国水稻生产出现“南稻北移”、“双改单”、“籼退粳进”、“北粳南移”等现象[3]。因此, 明确我国水稻生产时空变化规律对保障国家粮食安全具有重要意义。
前人研究表明, 我国水稻总播种面积减少, 主要表现为南方稻区播种面积减少, 而东北稻区播种面积增多[4], 单产在1991—2007年间涨幅11.98%[5]; 刘珍环等[6]用SPAM-China模型分析水稻种植面积和产量的时空变化特征, 认为过半地区水稻种植面积缩减, 近70%水稻产量增加。刘书通等[7]用生产集中度分析我国各省和地区水稻生产变化, 认为东南沿海地区水稻生产集中度下降, 东北三省集中度上升。程勇翔等[8]用重心拟合模型对全国各省水稻生产时空动态分析认为, 我国水稻播种面积重心和产量重心均向东北方向迁移。杨万江等[3]通过归纳分析, 将全国各省水稻生产变化分为收缩型、扩张型、稳定型和波动型, 代表省市分别为浙江、黑龙江、湖北和天津。然而, 前人研究大多基于省级统计数据, 较多关注水稻种植面积和产量而忽略单产变化, 而且分析指标较为单一, 不能准确系统分析我国水稻种植生产时空动态变化。本研究利用全国县域水稻生产数据, 结合全国稻作区划, 从我国水稻生产变化周期、变化幅度、重心迁移和贡献率角度, 重点分析我国水稻产量、面积和单产的时空动态, 并对驱动因素进行讨论, 以期为我国水稻生产结构优化和区域布局调整提供数据支撑和理论依据。
1 材料与方法
1.1 研究数据来源
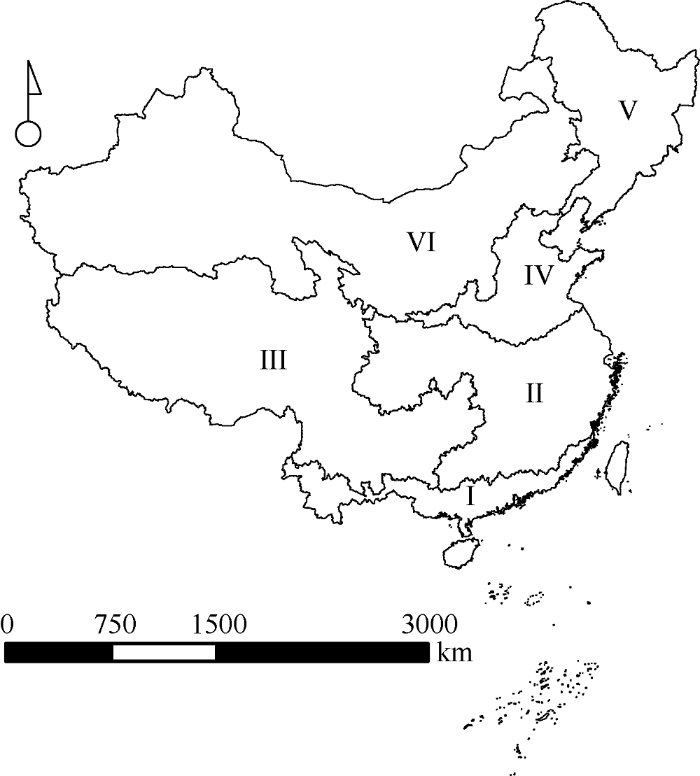
根据《中国水稻种植区划》[9]和中国科学院资源环境科学数据中心提供的2012年我国行政分布图, 绘制形成我国稻作区分布图(图1)。1949—2015年全国水稻产量、面积和单产数据来自农业部种植业司县级农作物数据库[10], 2016年和2017年产量和面积来自国家统计局[11]。全国县域农业经济统计数据由中国农业科学院农业信息研究所提供, 综合1985—2015年《中国农业年鉴》中省级水稻生产数据[12]以及30年间我国行政区域变化, 整理获得一套含全国2624个县级、31个省市(港澳台地区除外)、7个时间节点(1985—2015年, 每5年一个节点)的水稻分布数据库, 包含水稻产量、面积及由此计算出的单产。图1
 新窗口打开|下载原图ZIP|生成PPT
图1我国稻作区划
I、II、III、IV、V和VI分别表示华南双季稻稻作区、华中双单季稻稻作区、西南高原单双季稻稻作区、华北单季稻稻作区、东北早熟单季稻稻作区和西北干燥区单季稻稻作区。
Fig. 1National regionalization of rice cropping
I, II, III, IV, V, and VI mean regionalization of rice cropping in South China, Central China, Southwest, North China, Northeast and Northwest.
1.2 研究方法
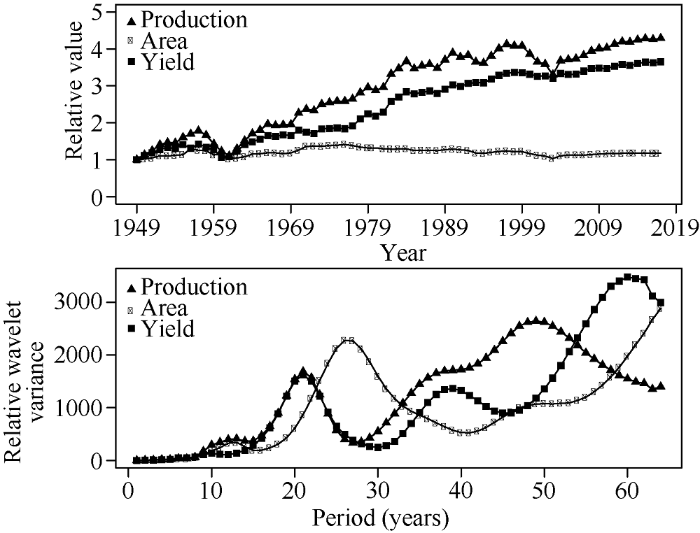
1.2.1 小波分析与周期小波分析是20世纪80年代开发的分析方法[13], 通过尺度的伸缩和时间轴上的平移构成一簇函数系, 用以计算变量变化周期及其周期强度。本研究用Morlet小波, 通过Matlab 2016a对1949—2017全国水稻产量、面积和单产的离均差计算小波方差获得其周期和周期强度。式中, var为小波方差, Wf(a,b)为小波变换系数,a为尺度因子, 反映小波的周期长度; b为平移因子, 反映小波时间上的平移。本研究将全国水稻生产总量和小波方差除以该指标最小值进行无量纲化。
1.2.2 水稻产量、面积和单产变化幅度 2003年为我国水稻生产低谷期, 本研究将水稻生产分为1985—2000年和2000—2015年2个阶段, 对1985、2000和2015年的水稻产量、面积和单产进行空间变化分析。为方便讨论, 将变化幅度分为5类, 大于20%为高度增加区, 5%~20%为低度增加区, -5%~5%为无变化区, -20%~ -5%为低度减少区, 小于-20%为高度减少区[6]。
式中,RC为指标变化幅度,S2为期末量, S1为期初量。
1.2.3 重心迁移本研究以各县几何中心代表该县坐标, 以水稻产量和面积为权重, 用ArcGIS 10.4.1计算并展示我国和各稻作区水稻产量和面积重心[8], 用Haversine公式计算两点地表距离。
1.2.4 产量贡献率计算产量构成可由播种面积和单产共同决定, 因此, 本研究将水稻产量变化分解为面积贡献、单产贡献和面积单产互作贡献3个部分[14]。
式中, i为期末年, j为期初年,${{C}_{{{A}_{ij}}}}$、${{C}_{{{Y}_{ij}}}}$、${{C}_{{{(A\times Y)}_{ij}}}}$分别表示第j年到第i年间面积、单产和两者互作对产量的贡献率, $\Delta {{P}_{ij}}$表示期初年到期末年水稻产量变化,$\Delta {{P}_{{{A}_{ij}}}}$、$\Delta {{P}_{{{Y}_{ij}}}}$和$\Delta {{P}_{{{(A\times Y)}_{ij}}}}$分别表示由面积、单产和互作导致的产量变化。由于上式计算结果有正有负, 为便于比较各部分的贡献率, 对贡献率进行校正。
当$C_{{{A}_{n}}}^{T}\ge 1.95\text{Max}(C_{{{Y}_{n}}}^{T},\ C_{{{A}_{n}}\times {{Y}_{n}}}^{T})$时, 为面积绝对主导型; 当$C_{Yn}^{T}\ge \text{1}\text{.95Max}(C_{{{A}_{n}}}^{T},\ C_{{{A}_{n}}\times {{Y}_{n}}}^{T})$时, 为单产绝对主导型; 当$C{{_{{{A}_{n}}}^{T}}_{\times {{Y}_{n}}}}\ge 1.95\text{Max}(C_{{{A}_{n}}}^{T},\ C_{{{Y}_{n}}}^{T})$时, 为互作绝对主导型, 包括由无水稻种植到有水稻种植和水稻播种面积或单产剧烈增加两种情况; 当$1.05\text{Max}(C_{{{Y}_{n}}}^{T},C_{{{A}_{n}}\times {{Y}_{n}}}^{T})\ge C_{{{A}_{n}}}^{T}<\text{1}\text{.95Max}(C_{{{A}_{n}}}^{T},C_{{{A}_{n}}\times {{Y}_{n}}}^{T})$时, 为面积主导型; 当$1.05\text{Max}(C_{{{A}_{n}}}^{T},C_{{{A}_{n}}\times {{Y}_{n}}}^{T})\le $ $C_{{{Y}_{n}}}^{T}<\text{1}\text{.95Max}(C_{{{A}_{n}}}^{T},C_{{{A}_{n}}\times {{Y}_{n}}}^{T})$时, 为单产主导型; 否则, 为互作主导型, 包括$C_{{{A}_{n}}\times {{Y}_{n}}}^{T}$很小但$C_{{{A}_{n}}}^{T}$、$C_{{{Y}_{n}}}^{T}$无显著区别, $C_{{{A}_{n}}\times {{Y}_{n}}}^{T}$与$C_{{{A}_{n}}}^{T}$、$C_{{{Y}_{n}}}^{T}$任一项无显著区别以及$C_{{{A}_{n}}\times {{Y}_{n}}}^{T}$与$C_{{{A}_{n}}}^{T}$、$C_{{{A}_{n}}}^{T}$两项均无显著区别3种情况。
2 结果与分析
2.1 水稻生产周期和分布变化规律
水稻产量和单产小幅波动上升, 变化周期相对较长; 面积波动幅度相对较小, 但变化周期短(图2)。1949—1976年和2003年至今, 我国水稻产量、面积和单产同步升降; 1976—2003年, 我国水稻产量和单产持续上升, 但面积下降。水稻产量、面积和单产在1960年前后和2003年均达到极小值, 产量和单产水平在1960年前后与1949年基本持平, 而面积则在1962年和2003年均与1949年持平。水稻产量的最高周期强度对应年份为49年, 21年紧随其后, 即以长周期为主, 短周期为辅; 面积和单产分别为26年和60年, 分别为短周期和长周期。图2
 新窗口打开|下载原图ZIP|生成PPT
图2我国水稻产量、面积和单产变化及其周期相对值
Fig. 2Relative value of change and variation period of national rice production, area, and yield
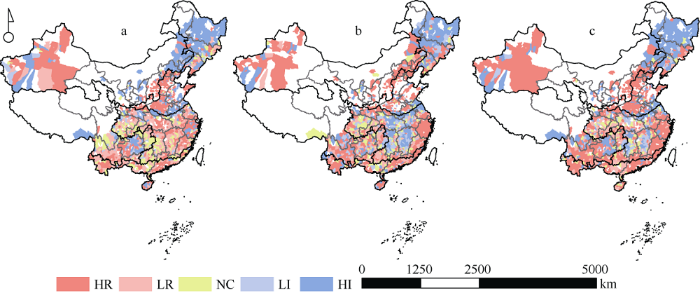
1985—2015年间, 东北早熟单季稻区种植面积增加而南方沿海稻区减少, 华北单季稻区和西北干燥区单季稻区分布范围缩减(图3)。1985—2000年, 东北早熟单季稻区水稻面积增加, 南方稻区面积缩减; 2000—2015年东北早熟单季稻区面积持续增长, 且播种区域北扩, 华中双单季稻区中部水稻种植面积有一定增长, 但南方沿海和西南高原单双季稻区东部、华中双单季稻区西部面积缩减。30年间, 东北早熟单季稻区和华中双单季稻区湖南、江西中部种植面积增加; 我国南方稻区种植面积呈现减少趋势, 尤其在沿海地区。
图3
 新窗口打开|下载原图ZIP|生成PPT
图3我国水稻1985-2000年(a)、2000-2015年(b)和1985-2015年(c)种植面积分布变化
HR:大幅缩减; LR: 略有缩减; NC: 无变化; LI: 略有增长; HI: 大幅增长。
Fig. 3Distribution change of national rice-producing in 1985-2000 (a), 2000-2015 (b), and 1985-2015 (c) for planting area
HR: highly reduction; LR: low reduction; NC: no change; LI: low increase; HI: highly increased.
2.2 水稻生产结构构成
华中双单季稻区和华南双季稻区是我国水稻生产主要区域, 近年来东北早熟单季稻区比例趋重(表1)。华中双单季稻区水稻产量和面积比例占全国水稻的62%~72%, 但其比例逐步下降; 1985—2000年间, 该区域水稻单产水平为全国最高。华南双季稻区产量和面积比例在9.5%~16.0%之间, 但近10年来比例下降加快; 该区域长年单产水平为全国最低。东北早熟单季稻区面积由3.83%增长至12.41%, 产量由3.95%增长至13.39%, 其单产水平逐年提升。西南高原单双季稻区水稻面积比例为8%~9%。华北单季稻区产量和面积比例小幅上升, 由3.3%上升至4.8%。西北干燥区单季稻区产量和面积长年占比不足1%, 但近年来水稻单产水平较高。Table 1
表1
表1各稻作区水稻种植产量、面积比例和单产变化
Table 1
| 稻作 Regionalization | 年份Year | ||||||
|---|---|---|---|---|---|---|---|
| 1985 | 1990 | 1995 | 2000 | 2005 | 2010 | 2015 | |
| 产量比例Proportion of production (%) | |||||||
| 华南 South China | 12.77 | 13.41 | 13.45 | 13.15 | 11.08 | 9.63 | 9.57 |
| 华中Central China | 71.44* | 69.07* | 68.11* | 64.83* | 65.50* | 63.70* | 62.91* |
| 西南 Southwest | 7.51 | 7.26 | 7.70 | 8.54 | 8.72 | 7.98 | 7.59 |
| 华北 North China | 3.86 | 4.41 | 4.72 | 5.08 | 5.00 | 5.69 | 5.50 |
| 东北 Northeast | 3.95 | 5.22 | 5.36 | 7.48 | 8.85 | 11.84 | 13.39 |
| 西北 Northwest | 0.46 | 0.63 | 0.66 | 0.92 | 0.84 | 1.15 | 1.04 |
| 面积比例 Proportion of rice-planting area (%) | |||||||
| 华南 South China | 16.27 | 15.89 | 15.53 | 14.87 | 12.96 | 12.39 | 11.71 |
| 华中Central China | 67.66* | 66.61* | 66.43* | 64.08* | 64.95* | 63.26* | 61.99* |
| 西南 Southwest | 8.48 | 8.10 | 8.14 | 8.65 | 8.80 | 8.17 | 8.30 |
| 华北 North China | 3.35 | 3.80 | 3.97 | 4.62 | 4.59 | 4.84 | 4.69 |
| 东北 Northeast | 3.83 | 4.96 | 5.26 | 6.84 | 8.01 | 10.37 | 12.41 |
| 西北 Northwest | 0.42 | 0.64 | 0.68 | 0.93 | 0.71 | 0.98 | 0.89 |
| 单产水平Yield (kg hm-2) | |||||||
| 华南 South China | 4040 | 4767 | 5372 | 5799 | 5597 | 5405 | 5854 |
| 华中Central China | 5429* | 5934* | 6364* | 6788* | 6623 | 6893 | 7073 |
| 西南 Southwest | 4684 | 5295 | 5952 | 6659 | 6564 | 6847 | 6572 |
| 华北 North China | 3806 | 5428 | 6167 | 6338 | 6594 | 7180* | 7044 |
| 东北 Northeast | 4746 | 5502 | 5870 | 6526 | 6766 | 7103 | 7209 |
| 西北 Northwest | 4401 | 4898 | 5551 | 5889 | 7327* | 7040 | 7507* |
新窗口打开|下载CSV
30年来, 我国水稻生产变化各阶段表现不一; 总的来说, 近50%种植地区水稻产量增加, 约70%水稻面积减少, 但有80%以上水稻单产增加(图3和图4)。华中双单季稻区、华南双季稻区和西南高原单双季稻区产量增长区范围逐渐小于减少区, 增长区比例分别由54.4%、70.3%和73.0%下降至37.9%、24.1%和29.0%, 前期单产增长区比例分别为89.4%、96.0%和94.3%, 后期面积缩减范围分别为52.8%、70.6%和62.3%。东北早熟单季稻区产量增长范围持续高于缩减范围, 最后达到77.5%, 前期高度增长区比例为75%, 后期为56.3%, 不同阶段面积和单产增长区范围均高于减少区。华北单季稻区和西北干燥区单季稻区产量增长区范围持续接近或小于减少区, 增长区比例分别由32.2%和54.4%下降至27.4%和20.0%。
图4
 新窗口打开|下载原图ZIP|生成PPT
图4我国水稻产量和单产变化幅度
1和2分别表示产量和单产; a、b和c为年份排列, 同
Fig. 4Range of variation of national rice production and yield
1 and 2 mean production and yield; a, b, and c mean years, corresponding with those given in
2.3 水稻生产重心迁移规律
我国水稻生产重心在近30年发生较大迁移, 产量重心迁移幅度略大于面积重心迁移; 东北早熟单季稻区重心迁移距离远于全国(图5)。全国产量重心由湖北与湖南、江西交界的崇阳县北上, 先后历经赤壁市、汉南区、黄陂区, 直达湖北与河南交界的红安县, 向东北方向移动229 km, 其中北移218 km; 面积重心由湖南平江县一直北上, 历经湖北通城县、赤壁市、嘉鱼县、蔡甸区, 止于湖北黄陂区, 向东北方向移动225 km, 其中北移214 km。各稻作区中, 东北早熟单季稻区产量重心由双阳区迁至五常市, 共向北偏东方向迁移238 km, 面积重心由永吉县迁至阿城区, 共向北偏东方向迁移242 km; 华中双单季稻区产量重心东迁19 km, 面积重心由武宁县西迁67 km至通城县; 西南高原单双季稻区产量和面积重心在1985—2005年间分别向东北方向迁移50 km和55 km, 2005—2015年间分别向西南回移64 km和45 km, 30年内, 产量重心向西偏北方向迁移19 km, 面积重心向北偏东方向迁移13 km; 华南双季稻区产量重心由罗定市西迁117 km至北流市, 面积重心由岑溪市西迁58 km至北流市。图5
 新窗口打开|下载原图ZIP|生成PPT
图5全国(a)、IV区(b)、II区(c)、III区(d)和I区(e)水稻生产面积和产量重心变化
Fig. 5Gravity migration of rice area and production in nation (a), IV (b), II (c), III (d), and I (e)
2.4 水稻产量贡献率时空分布规律
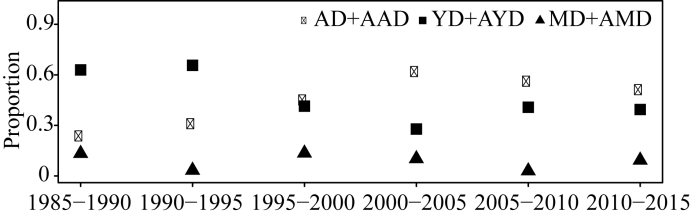
我国水稻产量贡献逐步由单产主导转为面积主导(图6)。水稻种植县市中, 面积绝对主导和面积主导比例由1985年的23.7%增加至2005年的62%后下降至51.2%, 单产绝对主导和单产主导比例由1985年的62.9%下降至2005年的27.8%, 随后增加至40.8%, 互作绝对主导和互作主导比例长年低于15%。1995年之前, 单产绝对主导和单产主导县数多于面积绝对主导和面积主导县数, 1995年之后则表现为相反的态势, 但未来一段时间总单产主导比例可能超过总面积主导比例。图6
 新窗口打开|下载原图ZIP|生成PPT
图6不同产量贡献率主导类型县比例
Fig. 6Proportion of counties of different production dominant
AD: area-dominant; AAD: absolute area-dominant;
YD: yield-dominant; AYD: absolute yield-dominant;
MD: mutual-dominant; AMD: absolute mutual-dominant.
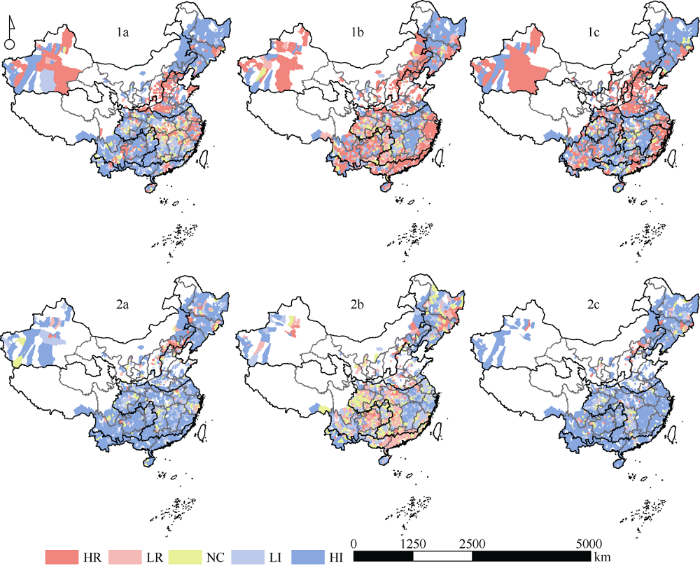
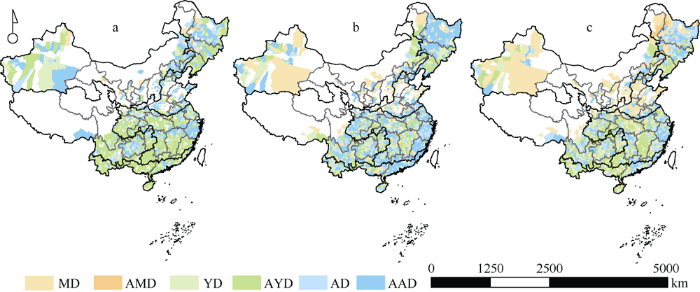
各稻作区在各阶段产量贡献主导因素不一, 总的来说, 东北早熟单季稻区和南方沿海地区为面积主导, 西南高原单双季稻区等内陆地区为单产主导(图7)。华中双单季稻区、华南双季稻区和西南高原单双季稻区产量贡献主导由单产转为面积, 总单产主导比例分别由1985—1995年的65.8%、80.2%和64.8%下降至1995—2015年的27.9%、29.0%和37.5%, 且在1985—1995年间, 单产绝对主导比例均接近50%。东北早熟单季稻区在1985—1995年总面积主导比例和总单产主导比例均为45.3%, 但在1995—2015年, 总面积主导比例涨至50.7%, 总单产主导比例降至22%。华北单季稻区和西北干燥区单季稻区产量主导因素为互作, 总互作主导比例均接近60%。
图7
 新窗口打开|下载原图ZIP|生成PPT
图71985-2000年(a)、2000-2015年(b)和1985-2015年(c)不同产量贡献率主导类型分布
缩写同
Fig. 7Distribution of different production dominant during 1985-2000 (a), 2000-2015 (b), and 1985-2015 (c)
Abbreviations are the same as those given in
3 讨论
3.1 我国水稻时空分布特点及其驱动因素
1985—2015年间, 我国水稻单产在全国范围内持续上升; 东北早熟单季稻区水稻产量和面积持续增加; 南方稻区呈U型分布, 即东南沿海地区和贵州、四川、云南等地区产量和面积下降, 江西、湖南、湖北产量和面积上升。水稻生产改善东北地区的白浆土和盐碱土[15], 气候变暖增强光温生产潜力和生产适宜性[16], 新品种的育成, 机械化、信息化程度不断提高和较高比较效益[17]等因素推动东北早熟单季稻区水稻生产。我国东南沿海地区经济发展迅速, 吸纳大量农村人口, 导致水稻生产比较效益逐年降低[4], 再加上农户对于新品种和新技术的采纳程度有限, 各地区出现大量“双改单”和撂荒现象[18]。西南双季稻区耕地和水资源在数量、质量和集中度上优势较弱, 再加上该地区气象灾害频发, 导致水稻生产效益下降, 水改旱现象增多[4]。3.2 我国水稻生产重心迁移
本研究结果表明, 我国水稻产量和面积重心均向东北方向迁移, 1985—2015年我国水稻产量重心迁移距离略长于面积迁移距离, 分别为229 km和225 km, 与前人[6,8,19]研究结论相似。不同之处在于, 刘珍环等[6]的迁移路线整体偏东, 王连喜等[19]的面积重心迁移轨迹整体偏西, 产量重心迁移轨迹整体偏北。程勇翔等[8]的产量和面积迁移轨迹均整体偏西。不同迁移轨迹的产生可能与数据精度和中心坐标有关。刘珍环等利用SPAM-China模型将全国水稻生产单元栅格化至10 km水稻生产单元, 其数据精度高于本研究; 王连喜等[19]和程勇翔等[8]均利用全国各省水稻生产数据, 分别使用省会坐标和几何坐标作为中心坐标, 其数据精度低于本研究。进一步分析精度越高, 迁移轨迹越偏东的原因, 可能与部分省市水稻生产集中分布于该区东部有关, 包括黑龙江、四川、内蒙古等省、区。3.3 我国水稻生产贡献率变化
本研究结果表明, 我国水稻产量贡献在1995—2000年间由单产主导转向面积主导, 但未来一段时间有转向单产主导的趋势; 不同地区主导因素存在差异, 东北早熟单季稻区和南方沿海地区以稳定面积为主, 内陆地区控制单产为要。前人[8,14,20]研究有相似结论, 刘巽浩等[20]通过计算1949—2007年粮食面积、单产与总产的相关系数发现, 面积与总产的关系更为密切, 认为以面积保总产的作用在由小变大; 程勇翔等[8]通过敏感性分析发现在1999—2009年水稻播种面积和播种面积年变化是造成水稻总产量出现较大波动的主要因素, 认为在水稻单产相对稳定且变化较小的前提下, 水稻播种面积是引起水稻总产变化的主因; 刘忠等[14]通过计算2003—2011年单产贡献率、面积贡献率和结构调整贡献率发现13个粮食增产省区中的5个稻谷增产省区内, 有4个为面积主导型, 认为水稻增产以面积扩张为主, 单产增加为辅。本研究创新之处在于, 相比于前人的相关性分析、敏感性分析和增产贡献率分析, 通过计算水稻面积和单产变化对产量变化的影响, 本研究提供了一个量化计算作物产量变化中面积和单产贡献率的思路和方法。4 结论
水稻产量变化以长周期为主, 短周期为辅; 面积以短周期为主; 单产以长周期为主。我国近50%水稻种植区产量上升, 约70%水稻播种面积减少, 80%以上区域单产增加。我国水稻面积变化在大范围内对我国水稻产量产生较大影响, 单产在大范围内长期持续提升。南方稻区六成以上水稻种植面积下降, 尤其在其沿海地区, 东北早熟单季稻区水稻种植区域北扩, 是我国水稻面积增加的主力地区。全国水稻产量和面积重心迁移距离小于东北早熟单季稻区。我国水稻产量变化主导因素由单产转为面积, 其中东北和南方沿海地区为面积主导, 内陆则多为单产主导。因此, 合理布局的水稻种植面积是当前稳定水稻产量的主要措施, 进一步增长的水稻单产对提升我国水稻产量至关重要。参考文献 原文顺序
文献年度倒序
文中引用次数倒序
被引期刊影响因子
DOI:10.1073/pnas.0403720101URL [本文引用: 1]
DOI:10.3724/SP.J.1006.2016.00313URL [本文引用: 1]

杂交水稻技术是我国自主创新并领先于世界的重大技术,杂交水稻技术在水稻生产中的成功应用为保障我国粮食安全做出了巨大贡献。由于杂交稻品种选育策略和种子生产与经营方式没有适应目前水稻生产的转型变化,最近几年我国杂交稻的种植面积有下降的趋势。这并不是杂交稻技术本身的问题,国内外的生产实践证明杂交稻仍然代表先进的水稻生产技术。如果我们尽快地调整杂交稻的育种目标,培育出适合于轻简化和机械化水稻生产方式、综合抗性好、资源利用效率高、稻米品质优良的杂交稻组合,通过轻简化和机械化栽培技术降低杂交稻的种子生产成本和种子价格,我国的杂交稻有望迅速走出目前的困境。
DOI:10.3724/SP.J.1006.2016.00313URL [本文引用: 1]
杂交水稻技术是我国自主创新并领先于世界的重大技术,杂交水稻技术在水稻生产中的成功应用为保障我国粮食安全做出了巨大贡献。由于杂交稻品种选育策略和种子生产与经营方式没有适应目前水稻生产的转型变化,最近几年我国杂交稻的种植面积有下降的趋势。这并不是杂交稻技术本身的问题,国内外的生产实践证明杂交稻仍然代表先进的水稻生产技术。如果我们尽快地调整杂交稻的育种目标,培育出适合于轻简化和机械化水稻生产方式、综合抗性好、资源利用效率高、稻米品质优良的杂交稻组合,通过轻简化和机械化栽培技术降低杂交稻的种子生产成本和种子价格,我国的杂交稻有望迅速走出目前的困境。
URL [本文引用: 2]
基于1978--2009年中国各地区(省、市、区)水稻生产面板数据,运用区域重心分析法测定并描绘中国水稻生产空间布局变迁轨迹,应用空间计量经济学方法实证分析水稻生产空间布局变迁影响因素。研究表明,中国水稻生产存在显著的正向空间效应,由南向北变动轨迹十分明显,水稻生产空间布局变化与农业劳动力、化肥施用量、有效灌溉面积、水稻单产和耕地面积呈显著正相关,与非农就业机会呈显著负相关。
URL [本文引用: 2]
基于1978--2009年中国各地区(省、市、区)水稻生产面板数据,运用区域重心分析法测定并描绘中国水稻生产空间布局变迁轨迹,应用空间计量经济学方法实证分析水稻生产空间布局变迁影响因素。研究表明,中国水稻生产存在显著的正向空间效应,由南向北变动轨迹十分明显,水稻生产空间布局变化与农业劳动力、化肥施用量、有效灌溉面积、水稻单产和耕地面积呈显著正相关,与非农就业机会呈显著负相关。
[本文引用: 3]
[本文引用: 3]
[本文引用: 1]
[本文引用: 1]
DOI:10.1007/s11442-013-1059-xURL [本文引用: 4]
AbstractRice’s spatial-temporal distributions, which are critical for agricultural, environmental and food security research, are affected by natural conditions as well as socio-economic developments. Based on multi-source data, an effective model named the Spatial Production Allocation Model (SPAM) which integrates arable land distribution, administrative unit statistics of crop data, agricultural irrigation data and crop suitability data, was used to get a series of spatial distributions of rice area and production with 10-km pixels at a national scale — it was applied from the early 1980s onwards and used to analyze the pattern of spatial and temporal changes. The results show that significant changes occurred in rice in China during 1980–2010. Overall, more than 50% of the rice area decreased, while nearly 70% of rice production increased in the change region during 1980–2010. Spatially, most of the increased area and production were in Northeast China, especially, in Jilin and Heilongjiang; most of the decreased area and production were located in Southeast China, especially, in regions of rapidly urbanization in Guangdong, Fujian and Zhejiang. Thus, the centroid of rice area was moved northeast approximately 230 km since 1980, and rice production about 320 km, which means rice production moved northeastward faster than rice area because of the significant rice yield increase in Northeast China. The results also show that rice area change had a decisive impact on rice production change. About 54.5% of the increase in rice production is due to the expansion of sown area, while around 83.2% of the decrease in rice production is due to contraction of rice area. This implies that rice production increase may be due to area expansion and other non-area factors, but reduced rice production could largely be attributed to rice area decrease.
DOI:10.3969/j.issn.1006-8082.2014.04.002URLMagsci [本文引用: 1]
基于1985-2011年中国各省份水稻生产情况的面板数据,运用水稻生产集中度和比较优势指标,分析我国水稻生产区域变化以及水稻主产区比较优势情况。结果表明,自1985年以来,长江中下游地区的水稻生产集中度在48.00%左右,东南沿海地区水稻生产集中度从1985年的27.21%下降到2011年的17.36%,而东北三省水稻生产集中度则由1985年的3.16%上升到2011年的15.87%。比较优势分析结果表明,长江中下游地区和东南沿海地区水稻生产比较优势显著,东北地区比较优势低于全国平均水平。上述三大稻区应利用各自的生产优势,保障全国的水稻供给和需求均衡,从而确保我国的水稻生产以及粮食安全。
DOI:10.3864/j.issn.0578-1752.2012.17.003URL [本文引用: 7]
【Objective】The trajectories of center of gravity rice acreage and production in China’s north and south regions and different rice systems were drawn respectively, the causes are analyzed, and the main factors that affect the total rice production was found at present stage.【Method】Using gravity fitting model, the temporal-spatial dynamic of rice production in China was analyzed. The main factors affecting China’s total rice production at present were found with sensitivity analysis.【Result】 In addition to the 1960s and 1970s center of gravity of rice sown acreage and production in China had skewed toward the southeast and eastern, it general moved toward the northeast direction since the founding of China. In 1979-2009, the center of gravity of rice in north moved quickly to the Songliao Basin of northeast of China. Center of gravity of middle-season rice and single cropping later rice moved firstly toward northeast then toward southeast, and its direction of movement was consistent with the order of the change of southern rice system, i.e. “double cropping rice changes to single cropping rice” from north to south. Center of gravity of early-season rice and double-season later rice both moved toward southwest. The percentage of single cropping rice was increased significantly in south China; the phenomenon “change double rice to single one” was obvious, which was the main reason leading to the decline of China’s rice acreage. Combined with sensitivity analysis, we can see that the sown acreage becomes the key factor most possibly affecting rice production stability.【Conclusion】 Regulation of market mechanism and technological progress were the two main factors currently affecting the temporal-spatial dynamic changes of rice in China. Under the precondition of keeping on the guidance of the market, from the perspective of food security, according to national conditions, especially to regulate early-season rice and double-season late rice that have low costs profit margins and downward trend of acreage, at same time taking into account total rice acreage, to prevent it from large fluctuation, to improve the yield of rice constantly, is the key to ensure steady increase of China rice output at this stage.
杭州: 浙江科学技术出版社,
[本文引用: 1]
Hangzhou: Zhejiang Science and Technology Press,
[本文引用: 1]
URL [本文引用: 1]
URL [本文引用: 1]
.
URL [本文引用: 1]
URL [本文引用: 1]
.北京: 中国农业出版社, 1986-
[本文引用: 1]
Beijing: China Agriculture Press, 1986-
[本文引用: 1]
DOI:10.1137/0515056URL [本文引用: 1]
Magsci [本文引用: 3]
理清2003年以来中国粮食产量增加的主要贡献因子及其贡献率,对于及时调整农业政策,保持和提升粮食生产能力有重要的意义。该文利用2003-2011年中国粮食及其各构成品种(根据国家统计局,粮食作物包括稻谷、小麦、玉米、薯类、豆类和其他谷物)的产量和播种面积数据,采用贡献因素分解的研究方法,研究了2003年以来中国粮食增产的作物和地区贡献,以及面积、单产和种植结构调整对于粮食增产的贡献率,并对各增产主力省区和主要粮食作物的增产贡献因素进行了分析,划定了增产主导类型。结果显示:研究期粮食增产全部来自3大粮食作物,其中玉米贡献了一半以上的增产量;杂粮、豆类和薯类总产均出现下降,其播种面积则分别下降了25.7%、17.4%和8.2%。地区贡献以黑龙江和河南最为突出,累积贡献率超过1/3;累积贡献率超过90%的13个省区,除新疆外其余都是粮食主产省区。作为传统农区的四川,其粮食增产贡献率仅为1.6%,与山西、陕西和甘肃等非主产区基本相当;全国粮食增产的面积贡献率最大,达到46.3%,其次是单产贡献率(44.2%),结构调整的贡献率将近10%,其中一半以上来自豆类向稻谷和玉米的调整;稻谷、玉米和春小麦的增产为面积主导型,而冬小麦的增产为单产和面积共同作用型;除河南和安徽为单产主导型,吉林和河北为面积单产共同作用型,其他增产主力省区的增产类型均为面积主导型。综合来看,2003-2011年中国粮食增产是以面积增加主导的外延式增产方式。由于粮食消费结构和国际粮食贸易容量的限制,今后结构调整的潜力已经很小。因此,在稳定粮食播种面积的基础上,进一步提高粮食作物的单产水平是今后稳定和提高粮食生产能力的重要举措。研究结果可为今后农业政策的调整提供决策依据。
[本文引用: 1]
[本文引用: 1]
DOI:10.3864/j.issn.0578-1752.2011.20.006URL [本文引用: 1]
【Objective】 The objective of this research is to analyze the phenophases (including the stages of seeding, heading and maturity) changes of rice, maize, spring wheat and soybean in three provinces of Northeast China. 【Method】Annual slope change rate (θ) was computed to evaluate the temporal trend and the relationship between agroclimate and phenophases. 【Result】Over the past 20 years, the timing of first effective temperature date (T≥10℃) was advanced, the first frost date was postponed, the growth period was continually extended and the accumulated temperature (T≥10℃) was increased in most area of the three provinces. Under this background, the temporal trend of phenophases of both rice and maize showed an advanced seeding stage (0.04<θ<0.55 d?a-1 and 0.04<θ<0.35 d?a-1), a postponed maturity stage (0.09<θ<0.35 d?a-1 and 0.23<θ<0.38 d?a-1) and an extended length of growth period (0.31<θ<1.26 d?a-1 and 0.11<θ<0.57 d?a-1). By contrast, temporal trend of soybean phenophases was different and characterized by an advanced seeding stage (0.01<θ<0.61 d?a-1), a maturity stage (0.18<θ<0.19 d?a-1), and a shortened growth period (0.06<θ<0.17 d?a-1). As for spring wheat, there was no obvious temporal change for the phenophases.【Conclusion】Climate change resulted in the increase of temperature suitability for crops, which could benefit from an early seeding stage, a late maturity stage and a long growth period.
URL [本文引用: 1]
本文从宏观层面探讨了东北三省水稻生产在满足市场消费需求、提高粮食综合生产能力、促进粮农增收和保护生态环境方面的重要意义,回顾了近年来东北三省水稻生产现状及存在问题,分析了东北三省水稻发展的面积和单产潜力,提出了促进东北三省水稻生产发展的措施。
URL [本文引用: 1]
本文从宏观层面探讨了东北三省水稻生产在满足市场消费需求、提高粮食综合生产能力、促进粮农增收和保护生态环境方面的重要意义,回顾了近年来东北三省水稻生产现状及存在问题,分析了东北三省水稻发展的面积和单产潜力,提出了促进东北三省水稻生产发展的措施。
DOI:10.1007/s10661-015-5004-6URLPMID:26627210 [本文引用: 1]
Accurate and updated time series maps of paddy rice distribution and planting intensity will greatly improve our knowledge. Unfortunately, spatiotemporal explicit information on rice fields is relatively limited, and considerable uncertainties still exist as regards to its inter-annual variations in China. In this study, an improved rice mapping methodology was proposed through combined consideration of vegetation phenology and surface moisture variations from different seasonal rice. This method was applied to southeast China based on 50002m 802day composite Moderate Resolution Imaging Spectroradiometer (MODIS) Enhance Vegetation Indices with two bands (EVI2) during the period 2001-2013. Its efficiency was validated with 763 ground survey sites, with an overall accuracy of 95.0202% and the kappa index of 0.9217. Spatiotemporal analysis indicated that rice cropping density and intensity lessened in southeast China during the period 2001-2013. Particularly, the paddy rice-planted areas reduced by 30.0902%, changing from 231,005 to 161,48402km(2). Among them, the planted areas of double rice decreased by 49.3402%, changing from 34,215 to 17,33502km(2). Therefore, averaged rice cropping intensity in southeast China decreased from 1.148 to 1.107. The primary dynamic patterns were from single rice or a rotation of rice plus other crops to non-rice (93,38602km(2)) and double rice to non-double rice (24,13202km(2)). When analyzed at provincial and altitudinal gradient levels, it was obvious that areas with greater rice cropping density or intensity were associated with more remarkable reductions. Graphical abstract The left graph shows that the rice cropping density lessened in Hubei, Hunan, Guangdong, Jiangxi, Anhui, Jiangsu, Henan provinces and other three provincial-level administrative units (Zhejiang, Fujian and Shanghai) from 2001 to 2013. The middle graph indicates the movement of gravity center as well as the variations in the total planted areas of single rice, rice plus others and double rice. The right graph denotes that the rice cropping intensity decreased in each provincial-level administrative unit from 2001 to 2013.
DOI:10.3969/j.issn.1000-0275.2012.04.007URL [本文引用: 3]
本文利用1949-2009年全国31个省(市,自治区)稻谷种植面积、总产量及单产资料,分析全国稻谷种植面积重心、总产量重心以及单产重心的移动轨迹、偏移距离等。结果表明:(1)1949-2009年,稻谷种植面积重心、总产量重心,整体上均呈现出向东北方向移动的趋势。(2)稻谷单产重心偏移轨迹从东西方向来看,20世纪50、60年代先向东偏移,此后逐渐向西回归;从南北方向上来看,单产重心呈现波动上升、下降趋势,大约在33°N-34°N之间移动。(3)从重心总偏移距离来看,种植面积最小,总产量次之,单产最大;从偏移方向来看,三者均是向东北、西南方向偏移的年份居多,说明稻谷生产东北、西南方向的发展不平衡状态较西北、东南方向的严重。(4)稻谷种植面积和总产量在南北方向上的动态变化相对东西向的变化剧烈,而单产则是东西向的变化比南北向的变化剧烈。
[本文引用: 2]
[本文引用: 2]
