 ,1, 李晓方2, 李定国,2,*, 林忠旭,1,*
QTL Mapping for Yield, Growth Period and Plant Height Traits Using MAGIC Population in Upland Cotton
HUANG Cong,1, LI Xiao-Fang2, LI Ding-Guo,2,*, LIN Zhong-Xu,1,*通讯作者:
第一联系人:
收稿日期:2018-02-8接受日期:2018-06-12网络出版日期:2018-07-02
| 基金资助: |
Received:2018-02-8Accepted:2018-06-12Online:2018-07-02
| Fund supported: |

摘要
关键词:
Abstract
Keywords:
PDF (3716KB)元数据多维度评价相关文章导出EndNote|Ris|Bibtex收藏本文
本文引用格式
黄聪, 李晓方, 李定国, 林忠旭. 利用陆地棉MAGIC群体定位产量、生育期和株高性状的QTL[J]. 作物学报, 2018, 44(9): 1320-1333. doi:10.3724/SP.J.1006.2018.01320
HUANG Cong, LI Xiao-Fang, LI Ding-Guo, LIN Zhong-Xu.
产量、生育期和株高是陆地棉重要的农艺性状。在传统的陆地棉育种中, 提高产量是最主要的目标, 是经济价值提升的主要因素。近年来, 中国棉花主要生产区向新疆转移[1,2], 而早熟性决定了棉花在新疆高纬度地区的适应性。此外, 棉花的机械化收获对棉花的株型如第一果枝节位和株高也有要求[3]。这些重要的农艺性状大部分都属于复杂的数量性状, 受微效多基因和加性效应的控制[4,5,6], 解析其遗传基础, 对指导棉花育种和生产具有重要意义。
QTL (quantitative trait locus)定位是解析复杂数量性状遗传基础的有效手段, 主要方法包括连锁分析和关联分析[7]。连锁分析主要采用表型或遗传差异较大的双亲构建衍生群体, 如初级作图群体F2和BC1, 永久性作图群体重组自交系(recombinant inbred line, RIL)和双单倍体系(doubled haploid, DH)等。在这类群体的基础上统计遗传标记与性状之间的连锁程度, 将基因定位在特定的区间内, 这种作图方法在棉花的QTL定位中已得到广泛应用[8,9]。双亲衍生的群体在连锁作图研究中做出了重要的贡献。关联分析则是近些年来发展起来的另一种作图效率较高的方法, 传统的关联分析主要基于自然群体, 该群体主要通过广泛收集种质资源而获得, 具有丰富的遗传变异和表型变异, 应用于关联分析能够检测到大量的QTL或标记位点[10,11,12]。自然群体关联分析定位的精度取决于LD (linkage disequilibrium)衰减速度, LD衰减越快, 定位精度越高, 其在不同的作物中表现不同, 例如玉米和水稻的LD衰减速度较快, 其衰减距离小于100 kb[13,14], 而陆地棉的LD衰减距离比较大[4,15], 利用陆地棉关联分析定位到的QTL不易筛选候选基因。利用自然群体进行关联分析时需注意群体结构的干扰, 防止产生假阳性[16,17]。
近年来, 通过人工杂交构建的多亲本群体应用于关联分析正在兴起, 包括NAM (nested association mapping)群体、MAGIC (multi-parent advanced generation intercross population)群体、ROAM (random-open-parent association mapping)群体等[18], 这类群体应用于关联分析具有等位基因丰富、无群体结构干扰和定位精度高等优点[17]。NAM群体和ROAM群体都是多个双亲本的RIL群体的集合, 不同的是在群体构建的杂交阶段, NAM群体由一个共同的亲本和多个亲本杂交, 而ROAM群体是多个亲本间两两随机杂交组合。这两种群体构建过程中仅有一代杂交, 重组次数有限, 没能实现多个亲本的遗传聚合。目前NAM群体主要在粮食作物玉米、水稻和大麦有相关的研究报道[19,20,21,22,23,24], 而ROAM群体仅仅在玉米中得到应用[25,26]。MAGIC群体构建过程中实现了多亲本的聚合杂交, 杂交重组代数最多, 重组产生的变异更丰富, 而且LD衰减更快; 在育种上, MAGIC群体聚合了多个亲本的遗传背景, 容易获得多个优良基因聚合的材料, 综合其遗传价值和育种价值更接近于理想群体[27,28]。在水稻、小麦、玉米、番茄、蚕豆等作物中, 已经有MAGIC群体应用的相关报道[29,30,31,32], 而关于棉花MAGIC群体的报道则较少[33,34]。
之前的研究中, 我们利用8个亲本构建了陆地棉MAGIC群体[35], 利用284对SSR (simple sequence repeat)标记对该群体进行了基因型分析, 并对纤维品质性状进行了关联分析检测到了控制相关性状的位点。本研究利用该群体对产量、生育期和株高相关性状进行关联分析, 解析其遗传基础, 为后续分子标记辅助选择育种提供参考信息。
1 材料与方法
1.1 试验材料
我们已构建的8亲本陆地棉MAGIC群体包含960个株系(MAGIC lines, MLs)[35], 亲本(parents of MAGIC population, PMs)的详细信息见表1。Table 1
表1
表1陆地棉MAGIC群体的8个亲本信息
Table 1
| 亲本编号 Parent code | 杂交编号 Cross code | 材料名 Name | 品系名称 Strain | 农艺性状 Agronomic trait | 材料来源 Material sources |
|---|---|---|---|---|---|
| PM1 | A | GY5 | 鄂棉15选系 Emian 15 inbred lines | 优质, 高产 High yield and fibre quality | 长江大学农学院 College of Agriculturel, Yangtze University |
| PM2 | B | KB10 | 鄂抗棉10号 Ekangmian 10 | 抗枯萎病、耐黄萎病 Fusarium wilt-resistant and Verticillium wilt-tolerance | 中国农业科学院棉花研究所 Cotton Research Institute of Chinese Academy of Agricultural Sciences |
| PM3 | C | GY2 | 苏棉16 Sumian 16 | 优质高产 High yield and fibre quality | 江苏省太仓农场 Taicang City Cotton Seed Farm in Jiangsu province |
| PM4 | D | KC9 | DP410B | 抗虫 Pest-resistant | 湖北省种子管理中心 Hubei Province Seed Management Station |
| PM5 | E | CQ13 | GK-12 | 抗虫 Pest-resistant | 中国农业科学院棉花研究所 Cotton Research Institute of Chinese Academy of Agricultural Sciences |
| PM6 | F | GY6 | 鄂棉15 Emian 15 | 优质高产 High yield and fibre quality | 长江大学农学院 College of Agriculture, Yangtze University |
| PM7 | G | CQ2 | KC160 | 抗虫 Pest-resistant | 湖北省种子管理中心 Hubei Province Seed Management Station |
| PM8 | H | GY4 | 鄂荆1号选系 Ejing 1 inbred lines | 优质高产 High yield and fibre quality | 长江大学农学院 College of Agriculture, Yangtze University |
新窗口打开|下载CSV
1.2 表型考察
选择长江流域棉区的黄冈市农业科学院(HG)和荆州市长江大学实验基地(JZ)以及黄河流域棉区的周口市农业科学院实验基地(ZK)作为表型实验点, 在2013年至2015年共设置5组环境试验, 分别为2013年黄冈市(E1)、2014年黄冈市(E2)、2014年周口市(E3)、2015年周口市(E4)和2015年荆州市(E5)。因为MAGIC群体较大, MLs每个环境设置单重复, 而亲本在E1~E5中分别设置2、2、5、5和5个重复。每个材料每重复种植1行10株, 行宽1 m, 行长5 m, 株距为40~45 cm。在生长周期内, 考察了生育期、株高和产量相关性状, 包括开花期(flowering time, FT)、第一果枝节位(first fruit spur branch number, FFSBN)、株高(plant height, PH)、单株有效铃数(effective boll number, EBN)。开花期为一个株行里有50%的单株进入开花的天数; 第一果枝节位是第一个果枝着生在主茎的节位; 考察的株高为棉株从地面到主茎顶端的高度; 单株有效铃数为每株果枝上的有效结铃数量。性状考察以株行为单位, 统计平均值。在吐絮成熟后, 从每个株行收取10个植株中部共20个棉铃考察性状, 包括单铃籽棉重(boll weight, BW)、单铃皮棉重(lint weight, LW)、衣分(lint percentage, LP)和籽指(seed index, SI)。利用R软件对收集的多环境表型数据进行双因素方差分析(analysis of variance, ANOVA)和最佳线性无偏预测(best linear unbiased prediction, BLUP), 并计算性状在多环境下的遗传力等。利用SPSS软件对表型进行统计学分析。1.3 基因型检测及分析
之前的研究中, 已利用284对SSR标记对该MAGIC群体进行了基因分型[35]。1.4 SSR标记与表型关联
利用TASSEL 3.0软件[36], 采用一般线性模型(general linear model, GLM)和混合线性模型(mixed linear model, MLM)将SSR标记与表型关联。在之前的研究中对MAGIC群体进行主成分分析(principal component analysis, PCA), 发现该群体无明显的群体结构[35], 所以采用的混合线性模型仅利用亲缘关系矩阵(kingship, K)对随机误差矫正。采用P<0.01作为宽松的显著关联的阈值, 设置Bonferroni校验阈值为更为严格的显著阈值, 即P < 1/n (n为所用到的标记数)[37]。该群体的连锁不平衡(linkage disequilibrium, LD)衰减速度较快, 当r2 < 0.1时, LD衰减距离仅为0.76 cM[35], 以间距为0.76 cM为阈值识别标记位点是否属于同一连锁QTL。2 结果与分析
2.1 MAGIC群体和亲本的性状变异
8个性状中, 单株有效铃数、单铃籽棉重、单铃皮棉重和衣分获得了5个环境的有效数据, 株高和第一果枝节位获得了E2、E3和E4三个环境的有效数据, 开花期仅缺失E1表型数据, 籽指仅缺失E5的表型数据。对多环境的数据进行方差分析, 8个性状受到遗传效应、环境效应和遗传×环境互作效应的影响, 其中环境效应影响的方差占主导地位(表2)。5个产量相关性状, 单株有效铃数、单铃籽棉重、单铃皮棉重、衣分和籽指都显著地受到遗传效应和环境效应的影响, 其中单铃籽棉重、单铃皮棉重、衣分还显著地受到遗传×环境互作效应的影响。开花期和株高显著地受到环境效应的影响, 其他效应不明显。没有检测到第一果枝节位显著的遗传和环境效应影响。Table 2
表2
表28个性状不同环境间的方差分析(ANOVA)
Table 2
| 性状 Trait | 平方和 Sum of squares | 均方 Mean of square | P值显著性 Significance by P-value | ||||||
|---|---|---|---|---|---|---|---|---|---|
| G | E | G×E | G | E | G×E | G | E | G×E | |
| 开花期FT | 28792 | 276730 | 9815 | 30 | 138365 | 7 | *** | ||
| 第一果枝节位FFSBN | 27900 | 19 | 11088 | 29.12 | 18.92 | 15.73 | |||
| 株高PH | 212681 | 770794 | 100555 | 222 | 770794 | 145 | *** | ||
| 单株有效铃数EBN | 44434 | 78050 | 68598 | 46 | 39025 | 37 | * | *** | |
| 单铃籽棉重BW | 672.5 | 1949.1 | 460.3 | 0.7 | 974.6 | 0.3 | *** | *** | *** |
| 单铃皮棉重LW | 129.5 | 435.3 | 108.8 | 0.13 | 217.67 | 0.06 | *** | *** | *** |
| 衣分LP | 14719 | 3611 | 10178 | 15.3 | 1805.4 | 5.7 | *** | *** | * |
| 籽指SI | 1679.2 | 321.9 | 502.3 | 1.7 | 321.9 | 0.6 | *** | *** | |
新窗口打开|下载CSV
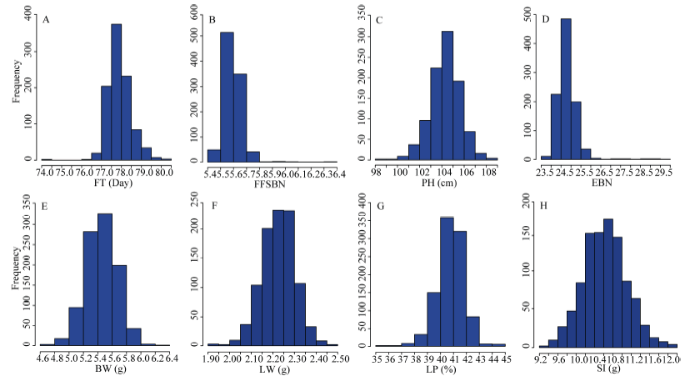
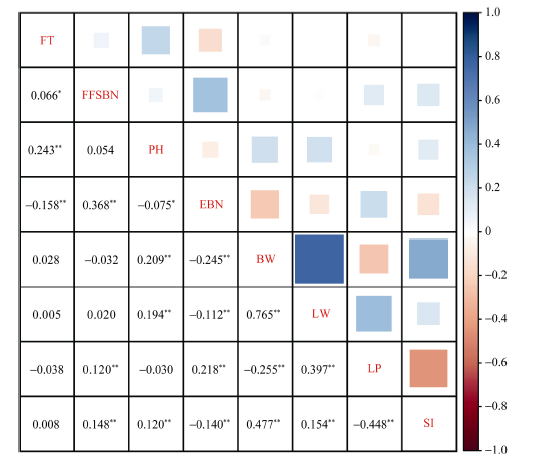
经过BLUP将多环境的表型数据整合, 统计了MAGIC群体的8个性状的均值、标准差、变异系数、峰度和偏度。8个性状的偏度绝对值都小于1, 符合连续的正态分布(表3和图1)。8个性状遗传力(H2)在亲本(PMs)中变化范围内为0.22~0.87, 而在MAGIC群体(MLs)中表现为0.17~0.71, 遗传力较高的性状有单铃重、衣分和籽指。比较亲本和MAGIC群体的表型变异, 发现除第一果枝节位和单株有效铃数外, MAGIC群体的表型变异范围更广。相关性分析表明, 多数性状之间存在显著相关性(图2), 其中相关系数绝对值大于0.300的成对性状有单铃重-单铃皮面重(0.573)、单铃重-籽指(0.329)和衣分-籽指(0.332)。
Table 3
表3
表38个性状经过BLUP后的统计描述
Table 3
| 性状 Trait | 均值 Mean | 变异范围 Range | 标准差 SD | 变异系数 CV (%) | 偏度 Skewness | 峰度 Kurtosis | 遗传力 H2 | |||
|---|---|---|---|---|---|---|---|---|---|---|
| PMs | MLs | PMs | MLs | MLs | MLs | MLs | MLs | PMs | MLs | |
| 开花期FT (d) | 76.52 | 77.93 | 74.41-78.39 | 76.71-80.44 | 0.55 | 0.70 | 0.93 | 1.35 | 0.87 | 0.46 |
| 第一果枝节位FFSBN | 6.03 | 5.59 | 5.68-6.32 | 5.44-5.76 | 0.06 | 1.07 | 0.35 | -0.37 | 0.45 | 0.20 |
| 株高PH (cm) | 102.04 | 104.36 | 98.22-103.61 | 98.44-108.96 | 1.32 | 1.26 | -0.23 | 0.88 | 0.59 | 0.29 |
| 单株有效铃数EBN | 27.75 | 24.77 | 25.16-29.41 | 23.71-26.29 | 0.39 | 1.56 | 0.37 | 0.44 | 0.57 | 0.17 |
| 单铃籽棉重BW (g) | 5.04 | 5.46 | 4.84-5.36 | 4.73-6.34 | 0.21 | 3.88 | -0.02 | 0.23 | 0.66 | 0.64 |
| 单铃皮棉重LW (g) | 2.17 | 2.23 | 2.15-2.20 | 1.90-2.50 | 0.08 | 3.48 | -0.21 | 0.59 | 0.22 | 0.54 |
| 衣分LP (%) | 43.14 | 40.74 | 42.34-43.87 | 35.31-44.49 | 1.04 | 2.54 | -0.55 | 2.00 | 0.56 | 0.60 |
| 籽指SI (g) | 10.87 | 10.63 | 10.60-11.35 | 9.23-12.07 | 0.48 | 4.48 | 0.18 | 0.01 | 0.62 | 0.71 |
新窗口打开|下载CSV
图1
 新窗口打开|下载原图ZIP|生成PPT
图18个性状BLUP后的频率分布直方图
A: 开花期; B: 第一果枝节位; C: 株高; D: 单株有效铃数; E: 单铃籽棉重; F: 单铃皮棉重; G: 衣分; H: 籽指。
Fig. 1Phenotype histograms of eight traits after BLUP
A: flowering time (FT); B: first fruit spur branch number (FFSBN); C: plant height (PH); D: effective boll number (EBN); E: boll weight (BW); F: lint weight (LW); G: lint percentage (LP); H, seed index (SI).
图2
 新窗口打开|下载原图ZIP|生成PPT
图28个性状之间的Pearson’s相关系数
*和**分别表示在P < 0.05和P < 0.01的水平上显著相关。FT: 开花期; FFSBN: 第一果枝节位; PH: 株高; EBN: 单株有效铃数; BW: 单铃籽棉重; LW: 单铃皮棉重; LP: 衣分; SI: 籽指。
Fig. 2Pearson’s correlation coefficients among eight traits
* and ** indicate the significant correlation at P < 0.05 and P < 0.01, respectively. FT: flowering time; FFSBN: first fruit spur branch number; PH: plant height; EBN: effective boll number; BW: boll weight; LW: lint weight; LP: lint percentage; SI: seed index.
2.2 SSR标记关联分析
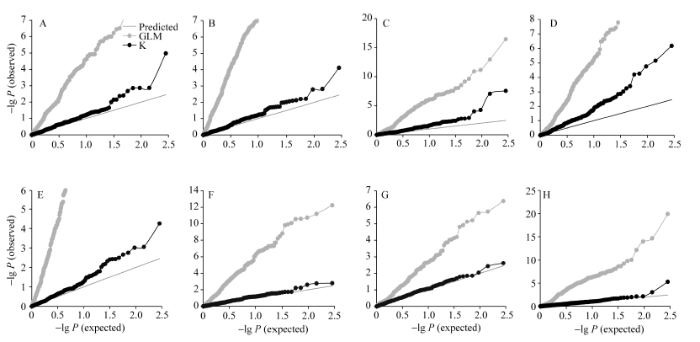
利用TASSEL 3.0将标记与BLUP后的表型值关联, 比较GLM和MLM(K)的结果, 分位数-分位数(Q-Q)图显示MLM(K)模型更接近于预测值, 能够很好控制假阳性(图3)。MLM(K)的关联结果中, 在P < 0.01的显著水平条件下, 共检测到87个关联位点, 当P < 0.00352 (P < 1/284)时, 共检测到41个SSR位点。统计各位点对性状变异的解释率(R2), 其变化范围为0.71%~7.27%, 多数位点呈现微效性。此外, 87位点中有70个同时被GLM模型检测到, 剩余17个位点在MLM模型中被特异地检测到。有7个位点能够在BULP表型值和单个环境表型值中被共同检测到, 分别为DPL0461-FT (BLUP, E5)、MON_ DC20094-FFSBN (BLUP, E2)、HAU3069-FFSBN (BLUP, E3)、HAU3069-PH (BLUP, E3)、MUSS298- EBN (BLUP, E5)、MON_DPL0524-EBN (BLUP, E3)和MON_DC40117-EBN (BLUP, E2), 剩余80个仅在BULP表型值关联分析中被检测到(表4)。图3
 新窗口打开|下载原图ZIP|生成PPT
图3一般线性模型和混合线性模型分位数-分位数(Q-Q)图比较
A: 开花期; B: 第一果枝节位; C: 株高; D: 单株有效铃数; E: 单铃籽棉重; F: 单铃皮棉重; G: 衣分; H: 籽指。
Fig. 3Comparison between GLM and MLM by Quantile-quantile (Q-Q) plots in association mapping
A: flowering time; B: first fruit spur branch number; C: plant height; D: effective boll number; E: boll weight; F: lint weight; G: lint percentage; H: seed index.
对于5个产量相关性状, 共检测到51个关联位点。对单株有效铃数检测到的显著关联标记数最多, 有25个, 表型变异解释率范围为0.71%~6.19%; 其次为单铃籽棉重, 检测到了13个显著关联标记, 表型变异解释率范围为0.73%~3.63%; 单铃皮棉重、籽指和衣分关联到的标记数相对较少, 分别为5、5和3个位点, 表型变异解释率范围为0.79%~1.67%、0.71%~2.60%和1.32%~3.60%。对2个生育期相关的性状, 开花期和第一果枝节位分别检测到10个和17个显著关联的位点, 解释率范围分别为0.78%~ 7.23%和0.73%~7.27%。株高关联到的位点数为9个, 解释率范围为0.71%~4.02% (表4)。
Table 4
表4
表4检测到与8个性状显著关联的SSR标记
Table 4
| 性状 Trait | SSR标记 SSR marker | 染色体 Chromosome | 遗传位置 Position (cM) | P值 P-value | 解释率 R2 (%) | 环境 Environment |
|---|---|---|---|---|---|---|
| 开花期 | NBRI_HQ527566 | 1 | 150.22 | 4.24E-03 (*, #) | 1.45 | BLUP |
| FT | MON_CGR5525 | 6 | 49.08 | 3.91E-03 (*, #) | 1.20 | BLUP |
| MON_DC20094 | 8 | 101.49 | 1.33E-03 (**) | 1.12 | BLUP | |
| MON_CER0167 | 10 | 101.22 | 9.83E-03 (*, #) | 0.81 | BLUP | |
| MON_CGR5113 | 11 | 10.25 | 1.38E-03 (**, #) | 5.44 | BLUP | |
| MON_CGR5390 | 13 | 55.20 | 7.07E-03 (*, #) | 1.10 | BLUP | |
| MON_DPL0522 | 21 | 16.34 | 1.35E-03 (**, #) | 1.52 | BLUP | |
| MON_DC30015 | 23 | 85.25 | 1.04E-05 (**, #) | 7.23 | BLUP | |
| DPL0461 | 24 | 63.21 | 6.98E-03 (*, #) | 0.78 | BLUP, E5 | |
| MON_SHIN0607 | 26 | 137.12 | 2.09E-03 (**, #) | 1.52 | BLUP | |
| 第一果枝节位 | NBRI_HQ527566 | 1 | 150.22 | 5.85E-03 (*) | 1.28 | BLUP |
| FFSBN | MON_CGR5534 | 2 | 17.30 | 5.68E-03 (*, #) | 1.24 | BLUP |
| 性状 Trait | SSR标记 SSR marker | 染色体 Chromosome | 遗传位置 Position (cM) | P值 P-value | 解释率 R2 (%) | 环境 Environment |
| NAU2858 | 2 | 133.14 | 1.64E-03 (**, #) | 2.03 | BLUP | |
| MON_CER0086b | 6 | 106.70 | 5.23E-05 (**, #) | 2.48 | BLUP | |
| MON_CGR5001b | 7 | 22.05 | 8.69E-03 (*, #) | 0.73 | BLUP | |
| MON_DC20094 | 8 | 101.49 | 6.08E-03 (*, #) | 0.80 | BLUP, E2 | |
| BNL3442 | 11 | 31.48 | 6.41E-03 (*, #) | 0.79 | BLUP | |
| HAU2489 | 15 | 44.81 | 5.03E-03 (*) | 0.84 | BLUP | |
| MUSS422b | 15 | 115.63 | 2.58E-08 (**, #) | 3.33 | BLUP | |
| MON_CGR5001a | 16 | 39.66 | 1.26E-03 (**, #) | 1.10 | BLUP | |
| HAU3069 | 19 | 206.66 | 3.92E-03 (*, #) | 1.18 | BLUP, E3 | |
| NAU7153 | 21 | 59.03 | 9.20E-05 (**, #) | 1.97 | BLUP | |
| BNL3171 | 21 | 72.70 | 4.07E-03 (*) | 1.89 | BLUP | |
| MON_DC30015 | 23 | 85.25 | 8.21E-08 (**, #) | 7.27 | BLUP | |
| MON_CGR5423 | 24 | 10.95 | 2.18E-03 (**, #) | 1.43 | BLUP | |
| HAU3812 | 24 | 43.09 | 5.18E-03 (*, #) | 1.12 | BLUP | |
| MON_CER0086a | 25 | 86.68 | 1.69E-03 (**, #) | 1.49 | BLUP | |
| 株高 | miR393-Me4 | 8 | 67.26 | 9.45E-03 (*) | 0.71 | BLUP |
| PH | MON_CGR5113 | 11 | 10.25 | 8.72E-03 (*, #) | 4.02 | BLUP |
| MON_CGR6580a | 11 | 78.45 | 7.93E-03 (*, #) | 1.21 | BLUP | |
| MON_SHIN1343 | 17 | 40.41 | 6.26E-03 (*, #) | 1.11 | BLUP | |
| HAU3069 | 19 | 206.66 | 7.38E-03 (*, #) | 1.04 | BLUP, E3 | |
| MON_DPL0522 | 21 | 16.34 | 1.61E-03 (**, #) | 1.40 | BLUP | |
| DPL0461 | 24 | 63.21 | 7.63E-05 (**, #) | 1.66 | BLUP | |
| MON_DC20035 | 24 | 198.85 | 1.49E-03 (**, #) | 1.36 | BLUP | |
| MON_DPL0811a | 25 | 113.14 | 6.02E-03 (*, #) | 0.79 | BLUP | |
| 单株有效铃数 | MON_DC40052 | 1 | 51.96 | 5.92E-03 (*, #) | 1.69 | BLUP |
| EBN | NBRI_HQ527566 | 1 | 150.22 | 2.93E-03 (**) | 1.52 | BLUP |
| CIR381 | 2 | 38.87 | 3.97E-04 (**, #) | 1.68 | BLUP | |
| CCRI523 | 5 | 39.95 | 9.49E-03 (*) | 0.72 | BLUP | |
| BNL584 | 6 | 17.52 | 7.51E-03 (*, #) | 1.26 | BLUP | |
| MON_CER0086b | 6 | 106.70 | 1.34E-03 (**, #) | 1.61 | BLUP | |
| HAU2147 | 10 | 4.91 | 4.40E-03 (*) | 0.87 | BLUP | |
| BNL511 | 10 | 59.83 | 9.83E-03 (*, #) | 0.71 | BLUP | |
| HAU3909 | 10 | 63.97 | 6.86E-06 (**, #) | 2.63 | BLUP | |
| MON_CGR5352b | 13 | 22.19 | 9.17E-04 (**, #) | 1.85 | BLUP | |
| MON_CGR5390 | 13 | 55.20 | 2.17E-03 (**, #) | 1.36 | BLUP | |
| MON_DC30178 | 13 | 90.51 | 6.32E-03 (*) | 0.80 | BLUP | |
| MON_DPL0535 | 13 | 97.44 | 2.52E-03 (**, #) | 2.01 | BLUP | |
| MON_CER0157 | 13 | 148.92 | 1.41E-03 (**, #) | 1.09 | BLUP | |
| MON_CGR5001a | 16 | 39.66 | 7.63E-03 (*) | 0.76 | BLUP | |
| HAU0197 | 17 | 61.97 | 5.67E-04 (**, #) | 2.04 | BLUP | |
| BNL3875 | 19 | 125.78 | 3.76E-03 (*, #) | 1.45 | BLUP | |
| MON_CGR5845 | 19 | 177.05 | 1.72E-05 (**, #) | 4.55 | BLUP | |
| NAU7153 | 21 | 59.03 | 6.31E-05 (**, #) | 2.05 | BLUP | |
| 性状 Trait | SSR标记 SSR marker | 染色体 Chromosome | 遗传位置 Position (cM) | P值 P-value | 解释率 R2 (%) | 环境 Environment |
| HAU2959 | 21 | 107.97 | 3.53E-03 (*, #) | 0.89 | BLUP | |
| MUSS298 | 23 | 29.08 | 3.94E-03 (*, #) | 0.86 | BLUP, E5 | |
| MON_DPL0524 | 23 | 31.92 | 4.30E-03 (*) | 1.44 | BLUP, E3 | |
| MON_DC30015 | 23 | 85.25 | 6.46E-07 (**, #) | 6.19 | BLUP | |
| HAU4497 | 24 | 185.64 | 5.50E-05 (**, #) | 2.05 | BLUP | |
| MON_DC40117 | 26 | 62.97 | 6.25E-03 (*, #) | 1.05 | BLUP, E2 | |
| 单铃籽棉重 | HAU1619a | 1 | 168.64 | 3.66E-03 (*) | 0.92 | BLUP |
| BW | CIR381 | 2 | 38.87 | 9.59E-04 (**, #) | 1.48 | BLUP |
| HAU0800a | 2 | 142.99 | 9.39E-03 (*) | 0.73 | BLUP | |
| MON_CER0086b | 6 | 106.70 | 1.74E-03 (**, #) | 1.74 | BLUP | |
| MUSB0812 | 8 | 107.81 | 7.25E-03 (*, #) | 1.42 | BLUP | |
| HAU0119 | 17 | 0.00 | 4.71E-03 (*, #) | 1.75 | BLUP | |
| HAU3986 | 17 | 100.50 | 3.67E-03 (*, #) | 1.68 | BLUP | |
| MUSB1135a | 18 | 140.00 | 5.50E-05 (**, #) | 1.73 | BLUP | |
| MON_CGR5845 | 19 | 177.05 | 2.16E-03 (**) | 3.63 | BLUP | |
| MON_DC40103 | 20 | 60.87 | 3.84E-03 (*, #) | 1.17 | BLUP | |
| 单铃皮棉重 | HAU2959 | 21 | 107.97 | 3.16E-03 (**, #) | 0.91 | BLUP |
| LW | NAU5418 | 21 | 108.18 | 8.76E-04 (**, #) | 1.63 | BLUP |
| HAU3640 | 24 | 175.90 | 6.59E-03 (*, #) | 1.09 | BLUP | |
| HAU0800a | 2 | 142.99 | 6.07E-03 (*) | 0.79 | BLUP | |
| BNL3034 | 14 | 66.47 | 5.81E-03 (*, #) | 1.67 | BLUP | |
| MUSB1135a | 18 | 140.00 | 2.51E-03 (**, #) | 0.95 | BLUP | |
| HAU3640 | 24 | 175.90 | 1.62E-03 (**, #) | 1.37 | BLUP | |
| MON_DPL0811a | 25 | 113.14 | 1.75E-03 (**, #) | 1.02 | BLUP | |
| 衣分 | MON_CGR5707 | 9 | 61.36 | 2.37E-03 (**, #) | 1.32 | BLUP |
| LP | MON_DPL0095b | 17 | 78.11 | 3.67E-03 (*, #) | 1.34 | BLUP |
| MON_DC30015 | 23 | 85.25 | 8.92E-03 (*, #) | 3.60 | BLUP | |
| 籽指 | CIR381 | 02 | 38.87 | 5.35E-06 (**, #) | 2.60 | BLUP |
| SI | HAU1321 | 12 | 29.33 | 7.26E-03 (*) | 2.12 | BLUP |
| MON_SHIN1558 | 13 | 54.09 | 9.94E-03 (*) | 0.71 | BLUP | |
| MON_C2-0118 | 14 | 135.20 | 7.01E-03 (*, #) | 0.78 | BLUP | |
| NAU6468 | 16 | 28.49 | 8.77E-04 (**, #) | 2.51 | BLUP |
新窗口打开|下载CSV
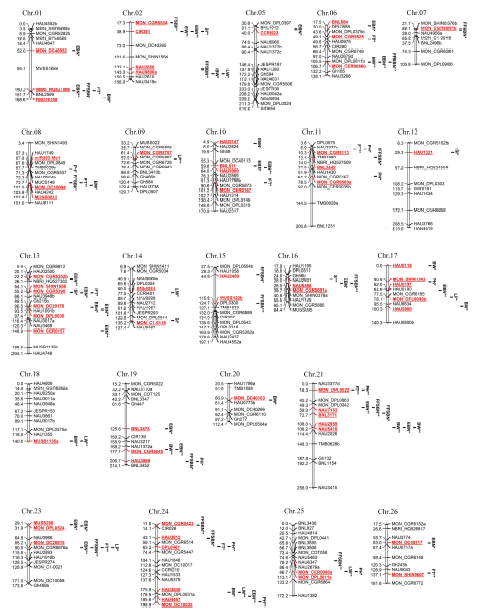
87个关联位点共覆盖64个SSR标记, 分布在棉花的23条染色体上, At亚组(Chr.01~Chr.13)和Dt亚组(Chr.14~Chr.26)分别有30个和34个标记, 在Chr.03、Chr.04和Chr.22未检测到相关的SSR位点(表4和图4)。在Chr.13和Chr.24检测到显著关联的位点最多, 均有6个。有20个SSR标记与多个性状关联, 其中MON_DC30015标记同时与4个性状关联, NBRI_HQ527566、CIR381和MON_CER0086b同时与3个性状关联, 其余14个标记各自关联到2个性状。Chr.21上的HAU2959和NAU5418都显著与单铃籽棉重(BW)关联, 其间距为0.21 cM, 间距小于LD衰减距离(0.76 cM), 可划分为同一个或连锁的QTL (表5)。通过检索发现64个SSR标记中, 有30个已被前人报道为控制棉花相关性状的位点, 包括产量、纤维品质、抗病、株型、生育期、种子成分等性状(表6)。
图4
 新窗口打开|下载原图ZIP|生成PPT
图4检测到的显著关联位点在参考遗传图谱上的分布
红色和下画线字体表示与性状显著关联的SSR标记。*和**分别表示在P<0.01和P<0.00352水平上显著关联。
Fig. 4Distribution of the loci identified by association analysis on the published genetic map
The identified markers significantly associated with traits are indicated by red and underlined font. * and ** indicate the significant association at P < 0.05 and P < 0.00352, respectively. FT: flowering time; FFSBN: first fruit spur branch number; PH: plant height; EBN: effective boll number; BW: boll weight; LW: lint weight; LP: lint percentage; SI: seed index.
Table 5
表5
表5检测到的多效性位点
Table 5
| 多效性SSR标记 Multi-effect SSR marker | 染色体 Chromosome | 位置 Position (cM) | 性状 Trait |
|---|---|---|---|
| NBRI_HQ527566 | 1 | 150.22 | 单株有效铃数, 第一果枝节位, 开花期 EBN, FFSBN, FT |
| CIR381 | 2 | 38.87 | 单铃籽棉重, 单株有效铃数, 籽指 BW, EBN, SI |
| HAU0800a | 2 | 142.99 | 单铃籽棉重, 单铃皮棉重 BW, LW |
| MON_CER0086b | 6 | 106.70 | 单铃籽棉重, 单株有效铃数, 第一果枝节位 BW, EBN, FFSBN |
| MON_DC20094 | 8 | 101.49 | 第一果枝节位, 开花期 FFSBN, FT |
| MON_CGR5113 | 11 | 10.25 | 开花期, 株高 FT, PH |
| MON_CGR5390 | 13 | 55.20 | 单株有效铃数, 开花期 EBN, FT |
| MON_CGR5001a | 16 | 39.66 | 单株有效铃数, 第一果枝节位 EBN, FFSBN |
| MUSB1135a | 18 | 140.00 | 单铃籽棉重, 单铃皮棉重 BW, LW |
| MON_CGR5845 | 19 | 177.05 | 单铃籽棉重, 单株有效铃数 BW, EBN |
| HAU3069 | 19 | 206.66 | 第一果枝节位, 株高 FFSBN, PH |
| MON_DPL0522 | 21 | 16.34 | 开花期, 株高 FT, PH |
| NAU7153 | 21 | 59.03 | 单株有效铃数, 第一果枝节位 EBN, FFSBN |
| HAU2959 | 21 | 107.97 | 单铃籽棉重, 单株有效铃数 BW, EBN |
| MON_DC30015 | 23 | 85.25 | 单株有效铃数, 第一果枝节位, 开花期, 衣分 EBN, FFSBN, FT, LP |
| DPL0461 | 24 | 63.21 | 开花期, 株高 FT, PH |
| HAU3640 | 24 | 175.90 | 单铃籽棉重, 单铃皮棉重 BW, LW |
| MON_DPL0811a | 25 | 113.14 | 单铃皮棉重, 株高 LW, PH |
| MON_CGR5390 | 13 | 55.20 | 单株有效铃数, 开花期 EBN, FT |
| HAU2959 | 21 | 107.97 | 单铃籽棉重, 单株有效铃数 BW, EBN |
新窗口打开|下载CSV
Table 6
表6
表6定位到的位点与已报道的结果比较
Table 6
| SSR标记 SSR marker | 本研究定位到的性状 Associated traits in this study | 已报道定位到的性状 Identified traits in reported studies |
|---|---|---|
| BNL3034 | 单铃皮棉重LW | 籽壳比重, 籽指, 纤维舒适度, 纤维2.5%跨距长度, 株高 HP, SI, WF, SL2.5, PH |
| BNL3171 | 第一果枝节位FFSBN | 纤维50%跨距长度, 纤维2.5%跨距长度, 纤维长度, 纤维强度 SL50, SL2.5, FL, FS |
| BNL3442 | 第一果枝节位FFSBN | 纤维50%跨距长度, 纤维2.5%跨距长度, 纤维长度 SL50, SL2.5, FL |
| 单株籽棉产量, 单株有效铃数 SY, EBN | ||
| BNL3875 | 单株有效铃数EBN | 纤维长度, 纤维强度, 纤维伸长率, 纤维整齐度FL, FU, FE, FS |
| BNL584 | 单株有效铃数EBN | 衣指, 马克隆值LI, MV |
| CIR381 | 单铃籽棉重, 单株有效铃数, 籽指 LW, EBN, SI | 纤维周长, 纤维舒适度, 纤维2.5%跨距长度, 纤维强度 PER, WF, SL2.5, FS |
| HAU0119 | 单铃籽棉重BW | 纤维强度, 耐盐性 FS, ST |
| HAU1321 | 籽指SI | 单株铃数, 棉籽含油量 EBN, OC |
| HAU1619a | 单铃籽棉重BW | 马克隆值 MV |
| HAU2147 | 单株有效铃数BW | 籽指, 纤维长度 SI, FL |
| HAU2489 | 第一果枝节位FFSBN | 纤维伸长率, 纤维整齐度 FE, FU |
| SSR标记 SSR marker | 本研究定位到的性状 Associated traits in this study | 已报道定位到的性状 Identified traits in reported studies |
| HAU3069 | 第一果枝节位, 株高 FFSBN, PH | 单铃籽棉重, 籽指, 根系面积 BW, SI, RSA |
| MON_CGR5001a | 单株有效铃数EBN | 棉籽含油量, 棉籽蛋白含量 OC, PC |
| MON_CGR5423 | 第一果枝节位FFSBN | 主根长 RL |
| MON_CGR5525 | 开花期FT | 果枝长度 FBL |
| MON_CGR5534 | 第一果枝节位FFSBN | 衣分, 株高, 果枝数, 籽指, 第一果枝长度 LP, PH, FSBN, SI, BFBL |
| MON_CGR5707 | 衣分LP | 单铃种子数, 衣分 BSN, LP |
| MON_DC30015 | 单株有效铃数, 第一果枝节位, 开花期, 衣分 EBN, FFSBN, FT, LP | 籽指 SI |
| MON_DC30178 | 单株有效铃数EBN | 籽指 SI |
| MON_DC40052 | 单株有效铃数EBN | 棉籽棕榈酸含量 PAC |
| MON_DC40117 | 单株有效铃数EBN | 腺体 Gl |
| MON_DPL0095b | 衣分LP | 衣分, 籽棉产量, 籽指 LP, SY, SI |
| MON_DPL0522 | 开花期, 株高FT, PH | 第一果枝节位 FFSBN |
| MON_DPL0524 | 单株有效铃数EBN | 开花期, 果枝始节高 FT, FFSH |
| MON_DPL0535 | 单株有效铃数EBN | 根系面积, 根系体积 RSA, RV |
| MUSB0812 | 单铃籽棉重EBN | 枯萎病抗性 FW |
| MUSS298 | 单株有效铃数EBN | 棉仁蛋白含量, 纤维马克隆值, 纤维强度 EPP, MV, FS |
| MUSS422b | 第一果枝节位FFSBN | 株高, 果枝数, 秋桃数, 纤维长度, 纤维强度 PH, FSBN, AB, FL, FS |
| NAU5418 | 单铃籽棉重EBN | 棉籽含油量 OC |
| NAU6468 | 籽指SI | 果枝数, 纤维长度 FSBN, FL |
新窗口打开|下载CSV
3 讨论
陆地棉作为重要的经济作物, 前人对其农艺性状展开了大量的QTL定位研究, 然而产量、生育期和株高的深度QTL定位工作相对比落后, 也没有精细定位和图位克隆的相关报道。相对于水稻、玉米等作物, 陆地棉高质量的基因组图谱公布时间较晚[38,39], 应用高通量SNP标记进行QTL分析和研究刚刚起步, 而且陆地棉为异源四倍体, 基因组较大较复杂, 获取高质量的SNP比较昂贵, 传统的SSR标记依然具一定的优势, 将其结合关联分析去挖掘控制棉花的产量、生育期和株高相关性状的位点在现实育种中更加实用[40,41]。中国的陆地棉育种历史比较短, 育成和推广的品种主要基于早期引进的品种, 其遗传多样性狭窄[42,43], 基于双亲本构建衍生群体很难获得足够的遗传变异, 陆地棉自然群体有充足的遗传变异, 但存在群体结构干扰而且定位精度较低, 构建陆地棉MAGIC群体可以很好地结合双亲连锁群体和自然关联群体的优点, 同时有效克服两者的缺陷。我们构建的MAGIC群体有960个株系, 样本量大, 能够容纳较多的由多亲本聚合而产生的遗传变异, 而且具有无明显的群体结构和LD衰减快等特点[35]。MAGIC群体相较于亲本, 其表型多样性也更丰富, 本研究中产量相关性状和株高性状中表现出的变异幅度更大, 不乏超出亲本表现的优异材料, 如高衣分(43.87%)、高单铃重(6.34 g)的材料, 这类材料可为育种提供供体材料。
利用MAGIC群体关联分析解析农艺性状的遗传基础具有高效性, 采用的混合线性模型MLM(K), 无需考虑群体结构干扰, 能够很好地控制假阳性, 对每个性状都能检测到较多的显著关联位点。大部分位点都表现出微效性, 对表型变异的解释率最大的位点是与第一果枝节位相关的MON_DC30015 (7.27%)。此外, 检测到的64个SSR标记中, 有30个被报道控制棉花相关的农艺性状, 有28个被报道的位点不同于本研究关联到的结果。其中有2个定位到的QTL与前人的研究相符, 标记MON_ DPL0095和MON_CGR5707位点都检测到控制衣分性状[44,45,46]。另外, MON_DPL0522检测到与开花期相关联, 而前人报道其是控制早熟性状第一果枝节位的QTL, 这些可靠的位点在后续的研究中具有应用价值[47]。其余34个SSR标记都是新检测到的控制相关性状的位点, 它们对已有的研究结果进行了补充。
本研究中发现一些基因簇或热点位点。从有20个位点控制多个性状, 这些位点可推测出存在着多效性的基因或控制不同性状的基因簇, 为多性状的遗传研究或改良提供指导依据[9,48-49]。CIR381、MON_CER0086b、MON_CGR5845和HAU2959同时控制单株有效铃数和单铃籽棉重2个性状, HAU0800a和MUSB1135a同时关联到单铃籽棉重和单铃皮棉重, 这些标记位点可应用于产量性状的协同改良。而一些开花期、第一果枝节位和株高的多效位点, 如MON_CGR5113、MON_DPL0522和DPL0461 (开花期和株高), NBRI_HQ527566、MON_DC20094和MON_DC30015 (开花期和第一果枝节位), 对棉花早熟和机械化收获株型改良育种有重要应用价值。此外一些关联位点热点染色体可成为相应性状研究或改良的焦点, 例如对单株有效铃数在Chr.01、Chr.06、Chr.10、Chr.13、Chr.19、Chr.21和Chr.23上分别检测到2、2、3、5、2、2和3个位点, 对第一果枝节位、株高和单铃籽棉重也都在相应同一条染色体上检测到多个位点。利用数量性状位点的加性效应, 集中利用热点分布的染色体结合辅助选择有利于加快育种进程。
4 结论
利用构建的8个亲本的陆地棉MAGIC群体解析了产量、生育期和株高性状的遗传基础。获取了8个性状多环境的表型数据, 大部分性状的表型变异丰富。检测到87个显著关联的SSR标记位点, 20个标记位点与多个性状关联, 有30个位点被报道为控制相关或其他性状的位点。本研究结果为遗传研究或标记辅助育种提供参考依据。参考文献 原文顺序
文献年度倒序
文中引用次数倒序
被引期刊影响因子
[本文引用: 1]
[本文引用: 1]
[本文引用: 1]
[本文引用: 1]
[本文引用: 1]
[本文引用: 1]
[本文引用: 2]
[本文引用: 1]
[本文引用: 1]
[本文引用: 1]
[本文引用: 1]
[本文引用: 2]
[本文引用: 1]
[本文引用: 1]
[本文引用: 1]
[本文引用: 1]
[本文引用: 1]
[本文引用: 1]
[本文引用: 1]
[本文引用: 1]
DOI:10.1371/journal.pgen.1003246URLPMID:23437002 [本文引用: 1]

Abstract The strengths of association mapping lie in its resolution and allelic richness, but spurious associations arising from historical relationships and selection patterns need to be accounted for in statistical analyses. Here we reanalyze one of the first generation structured association mapping studies of the Dwarf8 (d8) locus with flowering time in maize using the full range of new mapping populations, statistical approaches, and haplotype maps. Because this trait was highly correlated with population structure, we found that basic structured association methods overestimate phenotypic effects in the region, while mixed model approaches perform substantially better. Combined with analysis of the maize nested association mapping population (a multi-family crossing design), it is concluded that most, if not all, of the QTL effects at the general location of the d8 locus are from rare extended haplotypes that include other linked QTLs and that d8 is unlikely to be involved in controlling flowering time in maize. Previous independent studies have shown evidence for selection at the d8 locus. Based on the evidence of population bottleneck, selection patterns, and haplotype structure observed in the region, we suggest that multiple traits may be strongly correlated with population structure and that selection on these traits has influenced segregation patterns in the region. Overall, this study provides insight into how modern association and linkage mapping, combined with haplotype analysis, can produce results that are more robust.
DOI:10.1016/j.tplants.2006.12.001URLPMID:17224302 [本文引用: 2]
Linkage disequilibrium (LD) mapping in plants detects and locates quantitative trait loci (QTL) by the strength of the correlation between a trait and a marker. It offers greater precision in QTL location than family-based linkage analysis and should therefore lead to more efficient marker-assisted selection, facilitate gene discovery and help to meet the challenge of connecting sequence diversity with heritable phenotypic differences. Unlike family-based linkage analysis, LD mapping does not require family or pedigree information and can be applied to a range of experimental and non-experimental populations. However, care must be taken during analysis to control for the increased rate of false positive results arising from population structure and variety interrelationships. In this review, we discuss how suitable the recently developed alternative methods of LD mapping are for crops.
DOI:10.1016/j.molp.2016.12.008URLPMID:28039028 [本文引用: 1]
This review summarizes recent progress02in maize GWAS02to establish new insights of functional genomics in the omics era. Particularly, potential contributions from over-genomic variants, innovations for statistical methods, and distinctive02population designs are highlighted to jointly address the missing heritability issue.
DOI:10.1534/g3.117.041608URLPMID:5473768 [本文引用: 1]
Describing the genetic diversity in the gene pool of crops will provide breeders with novel resources for varietal improvement. Nested Association Mapping (NAM) populations are uniquely suited for characterizing parental diversity through the shuffling and fixation of parental haplotypes. Here, we describe a set of 1879 rice NAM lines created through the selfing and single-seed descent of F1hybrids derived from elite IR64indicacrossed with 10 diversetropical japonicalines. Genotyping data indicatedtropical japonicaalleles were captured at every queried locus despite the presence of segregation distortion factors. Several distortion loci were mapped, both shared and unique, among the 10 populations. Using two-point and multi-point genetic map calculations, our datasets achieved the 1500 cM expected map size in rice. Finally, we highlighted the utility of the NAM lines for QTL mapping, including joint analysis across the 10 populations, by confirming known QTL locations for the trait days to heading.
[本文引用: 1]
[本文引用: 1]
[本文引用: 1]
[本文引用: 1]
[本文引用: 1]
DOI:10.1111/nph.13810URLPMID:26720856 [本文引用: 1]
Summary Meiotic recombination is a major driver of genetic diversity, species evolution, and agricultural improvement. Thus, an understanding of the genetic recombination landscape across the maize ( Zea mays ) genome will provide insight and tools for further study of maize evolution and improvement. Here, we used c . 50 000 single nucleotide polymorphisms to precisely map recombination events in 12 artificial maize segregating populations. We observed substantial variation in the recombination frequency and distribution along the ten maize chromosomes among the 12 populations and identified 143 recombination hot regions. Recombination breakpoints were partitioned into intragenic and intergenic events. Interestingly, an increase in the number of genes containing recombination events was accompanied by a decrease in the number of recombination events per gene. This kept the overall number of intragenic recombination events nearly invariable in a given population, suggesting that the recombination variation observed among populations was largely attributed to intergenic recombination. However, significant associations between intragenic recombination events and variation in gene expression and agronomic traits were observed, suggesting potential roles for intragenic recombination in plant phenotypic diversity. Our results provide a comprehensive view of the maize recombination landscape, and show an association between recombination, gene expression and phenotypic variation, which may enhance crop genetic improvement.
DOI:10.1111/nph.13814URLPMID:26715032 [本文引用: 1]
Summary Improvement of grain yield is an essential long-term goal of maize ( Zea mays ) breeding to meet continual and increasing food demands worldwide, but the genetic basis remains unclear. We used 10 different recombination inbred line (RIL) populations genotyped with high-density markers and phenotyped in multiple environments to dissect the genetic architecture of maize ear traits. Three methods were used to map the quantitative trait loci (QTLs) affecting ear traits. We found 17–34 minor- or moderate-effect loci that influence ear traits, with little epistasis and environmental interactions, totally accounting for 55.4–82% of the phenotypic variation. Four novel QTLs were validated and fine mapped using candidate gene association analysis, expression QTL analysis and heterogeneous inbred family validation. The combination of multiple different populations is a flexible and manageable way to collaboratively integrate widely available genetic resources, thereby boosting the statistical power of QTL discovery for important traits in agricultural crops, ultimately facilitating breeding programs.
DOI:10.1007/s00122-015-2506-0URLPMID:25855139 [本文引用: 1]
MAGIC populations present novel challenges and opportunities in crops due to their complex pedigree structure. They offer great potential both for dissecting genomic structure and for improving breeding populations. The past decade has seen the rise of multiparental populations as a study design offering great advantages for genetic studies in plants. The genetic diversity of multiple parents, recombined over several generations, generates a genetic resource population with large phenotypic diversity suitable for high-resolution trait mapping. While there are many variations on the general design, this review focuses on populations where the parents have all been inter-mated, typically termed Multi-parent Advanced Generation Intercrosses (MAGIC). Such populations have already been created in model animals and plants, and are emerging in many crop species. However, there has been little consideration of the full range of factors which create novel challenges for design and analysis in these populations. We will present brief descriptions of large MAGIC crop studies currently in progress to motivate discussion of population construction, efficient experimental design, and genetic analysis in these populations. In addition, we will highlight some recent achievements and discuss the opportunities and advantages to exploit the unique structure of these resources post-QTL analysis for gene discovery.
[本文引用: 1]
[本文引用: 1]
[本文引用: 1]
[本文引用: 1]
[本文引用: 1]
[本文引用: 1]
[本文引用: 1]
[本文引用: 1]
[本文引用: 1]
[本文引用: 6]
[本文引用: 1]
[本文引用: 1]
[本文引用: 1]
[本文引用: 1]
[本文引用: 1]
[本文引用: 1]
[本文引用: 1]
[本文引用: 1]
[本文引用: 1]
[本文引用: 1]
[本文引用: 1]
[本文引用: 1]
[本文引用: 1]
[本文引用: 1]
[本文引用: 1]
[本文引用: 1]
[本文引用: 1]
[本文引用: 1]
